
Abstract
Weld lines are a serious defect observed in plastic injection molded parts, impacting both their cosmetic appearance and mechanical properties. Controlling the conditions of plastic injection is crucial to mitigate these weld lines. This study introduces a novel approach to identify polypropylene injection molding (PIM) conditions aimed at reducing weld lines in polypropylene parts. The PIM conditions considered in this study include melt temperature, injection pressure, packing pressure, packing time, and cooling time. An orthogonal array Taguchi L27 design was employed for the experimental setup, producing 27 polypropylene parts with varying combinations of process conditions. The width of weld lines generated on the parts’ surfaces was measured using an optimum microscope for all trials. Parametric analysis was conducted using response surface plots and contour plots to estimate the process conditions yielding minimum weld lines. Analysis of variance and regression analysis were employed to interpret the experimental data, with the resulting regression equation used to predict weld lines for a set of PIM process conditions. Finally, two efficient optimization algorithms, genetic algorithm (GA), and particle swarm optimization (PSO), were implemented using MATLAB programming to estimate the optimum process conditions for minimizing weld lines. The GA and PSO predicted weld line widths of 6.12302 μm and 6.123 μm, respectively, representing an 18.51% improvement in results. These findings demonstrate that the novel approach presented in this study can be effectively and reliably applied to address plastic product defects in the industry.
Keywords
Introduction
Plastic injection is extensively employed to manufacture plastic parts of different sizes with complex shapes and geometries. The produced parts from PIM are widely used in household utensils, machinery components, toys, etc. PIM is a hot working process in which raw material (may be virgin or used plastic) is injected into the mold cavity with a certain pressure and temperature. A plunger or runner on the mold cavity presses the molten injected plastic to provide the required shape and size to the part. The mold is also heated to provide uniform cooling of the plastic. The developed parts should have good mechanical properties and surface characteristics without any defects. Thus, the melt temperature (or the temperature at which plastic is supplied to the mold cavity), injection pressure, pressure applied by the plunger (also known as packing pressure), time for which packing pressure is applied, and time required for cooling are the controlling conditions of the PIM process. These conditions ensure the quality of the product. Plastic injection molding products normally suffer from defects like burn marks, warping, sink marks, weld lines, jetting, vacuum voids, etc. In this study, the PIM conditions were investigated for the reduction of one of the critical defects in plastic components, that is, weld line defect. 1 Weld line is that flaw in the PIM processed plastic parts which deteriorates the appearance as well as strength. In literature, the weld lines were studied and investigated for suitable remedies. Kitayama et al. used experimental and simulation techniques to study the PIM process conditions for the reduction of weld lines. Their study lacks consideration of PIM process conditions other than weld line temperature. 2 Zhai et al. presented an approach for the reduction of weld lines based on the design of runner and gate location in PIM, keeping constant process conditions. 3 Two illustrations of the Taguchi method were used in the literature for the optimization of PIM conditions. Kamarudin et al. reported that Taguchi methodology is effective in evaluating the PIM process conditions.4,5 Ozcelik et al. optimized the PIM process conditions using the Taguchi methodology, considering only three process conditions such as melt temperature, packing pressure, and injection pressure for minimum weld lines on polypropylene parts. 6 Wang et al. applied the Taguchi method together with simulation tools such as mold-flow analysis for the optimization of PIM process conditions on a brake booster valve body. 7 Wu et al. used the Taguchi method to study the influence of the process conditions: melt temperature, mold temperature, injection speed, and packing pressure on the tensile strength of PIM parts made of polypropylene and high-density polyethylene. 8 Deng et al. have integrated the Taguchi methodology, regression analysis, and Davidon-Fletcher-Powell method for the estimation of optimum PIM process conditions. 9 Sreedharan et al. 10 have combined the Taguchi method with grey relation analysis for the optimization of PIM process conditions, minimizing the weld lines and sink marks. Various optimization approaches used for PIM process conditions include response surface methodology, Kriging model, artificial neural network (ANN), genetic algorithms, and hybrid approaches.11–13 Deng has given a genetic algorithm-based optimization methodology for injection molding process conditions in view of weld line defect with the help of one case study. 14 Wu et al. also used genetic algorithms for optimizing the PIM process; moreover, they used mold-flow software for the simulation of the process. 15 Deng et al. have applied particle swarm optimization for the optimization of PIM process, considering process variables such as melt temperature, mold temperature, and injection time using software simulation. 16 Shi et al. reported a soft computing approach for the optimization of the PIM process with conditions: melt temperature, mold temperature, injection time, and pressure. They have combined mold flow simulation, genetic algorithm, and artificial neural network. 17
It was observed in the literature that the plastic injection molding process was investigated and optimized considering mold design systems (runner and gating system), process conditions for the maximization of mechanical properties, minimization of defects like warpage or shrinkage, weld lines, etc., using the Taguchi method as well as optimization algorithms. The significance of this study lies in its departure from conventional approaches, which often overlook the critical role of process conditions in experimental exploration. Here, we address this gap by introducing a novel experimental methodology aimed at optimizing Polypropylene Injection Molding (PIM) process conditions to mitigate weld lines. By doing so, we not only contribute to advancing the understanding of PIM processes but also offer practical solutions for enhancing the quality and integrity of polypropylene polymer products. This research underscores the importance of meticulous attention to process parameters in polymer manufacturing, ultimately paving the way for more efficient and reliable production processes.
Materials and methods
Taguchi (L27) design of experiments
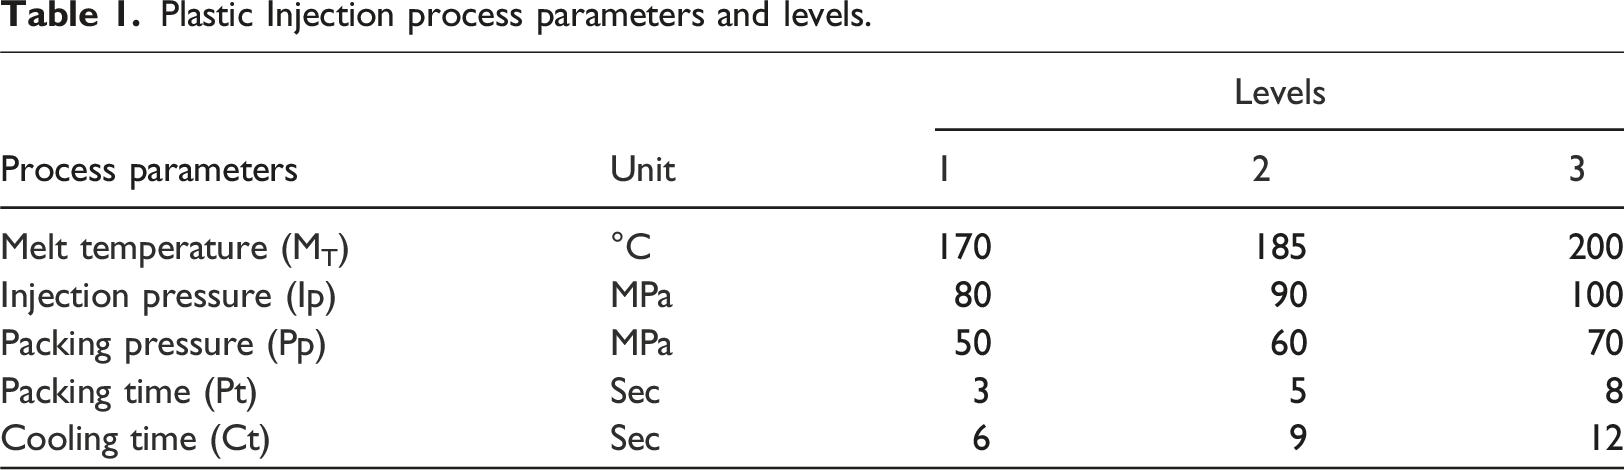
Plastic Injection process parameters and levels.
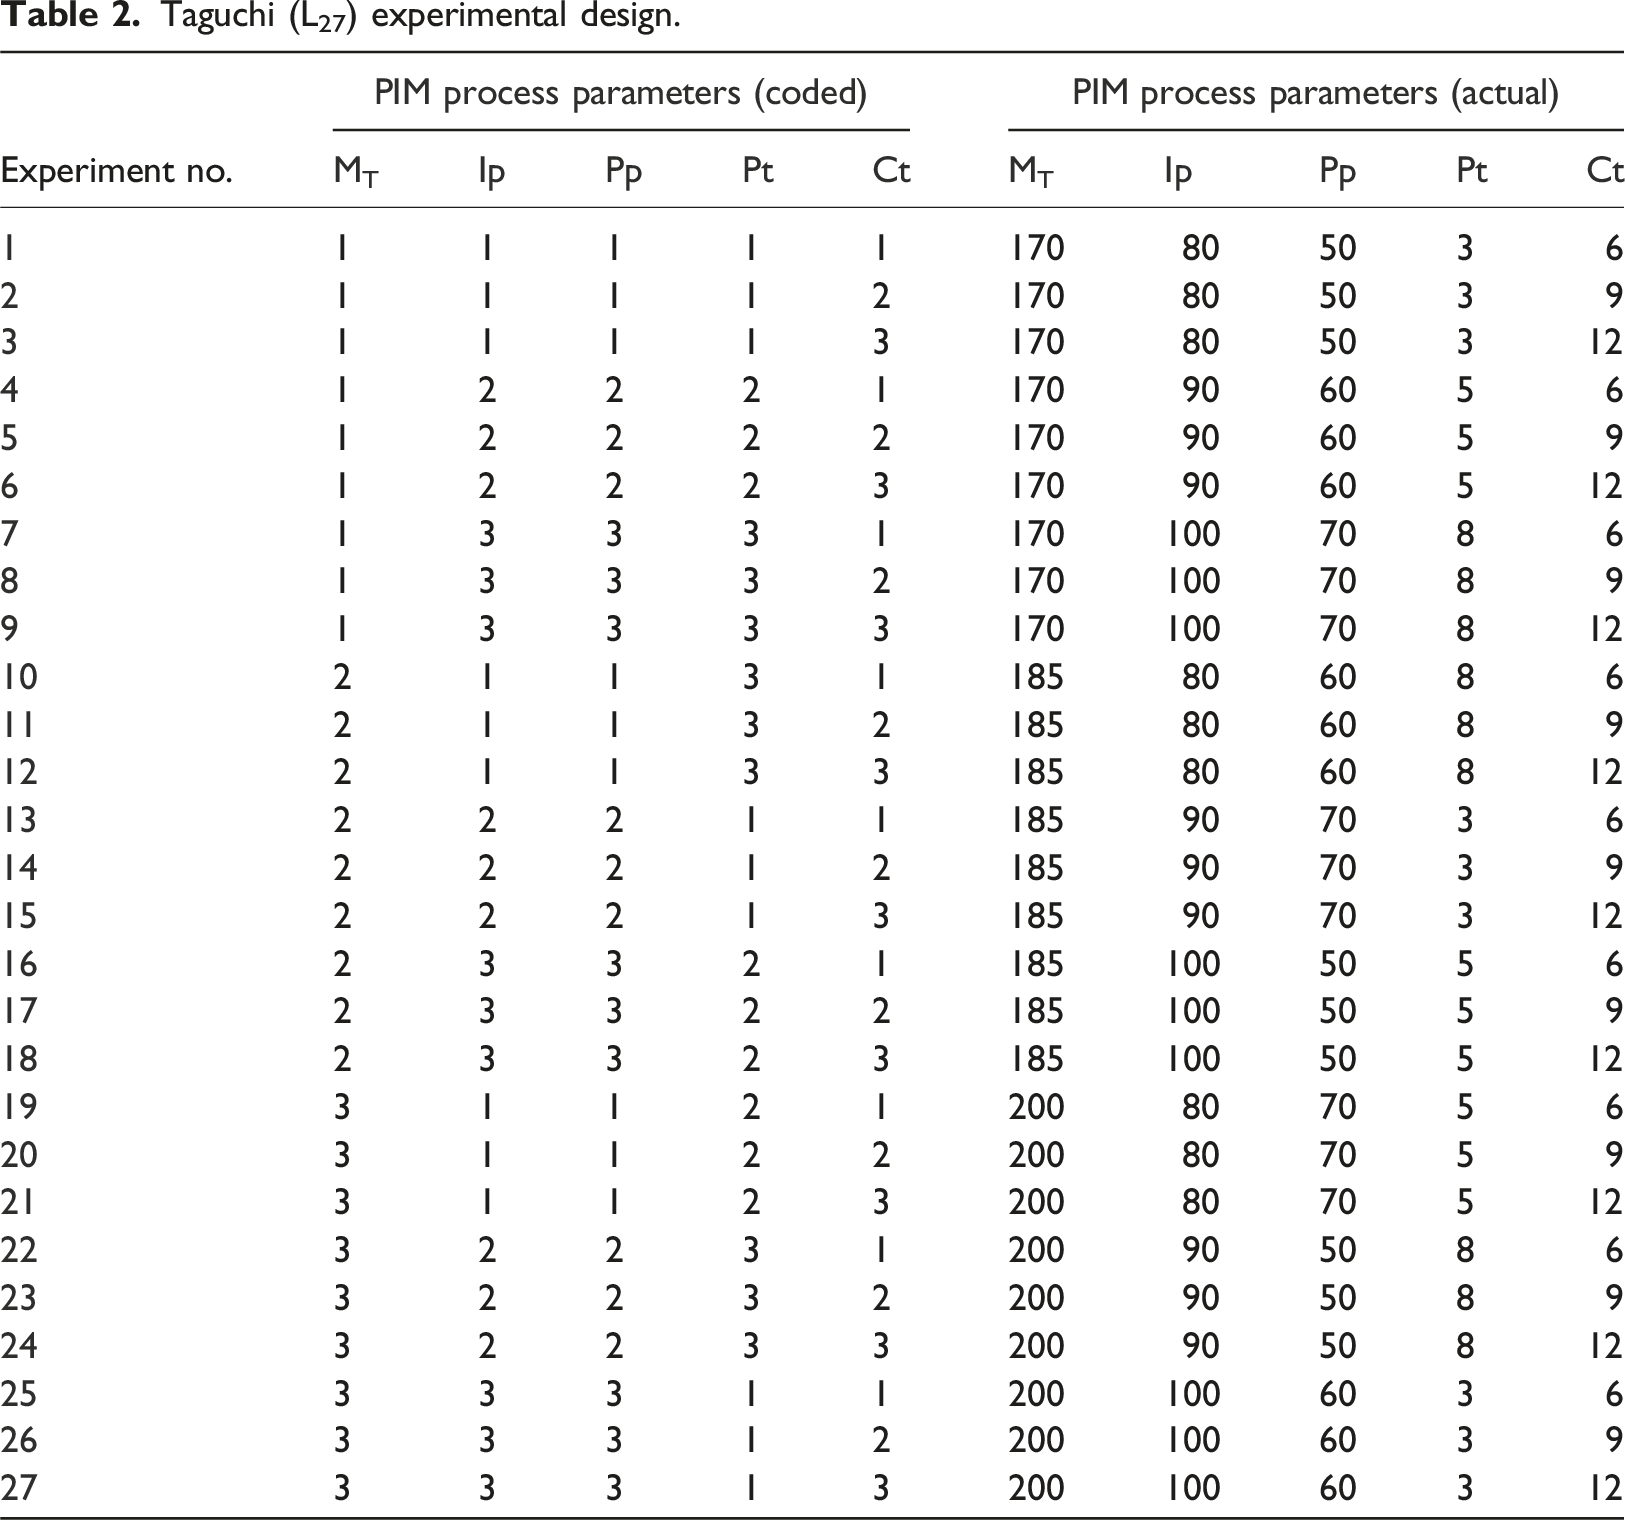
Taguchi (L27) experimental design.
Plastic injection molding process
Figure 1 shows the PIM mold design and the polypropylene parts. During production, the mold parts underwent numerous operations, including CNC operations, carried out consecutively. The 27 polypropylene parts were manufactured according to the design of experiments (DOE) plan. Design of plastic mold and PP products.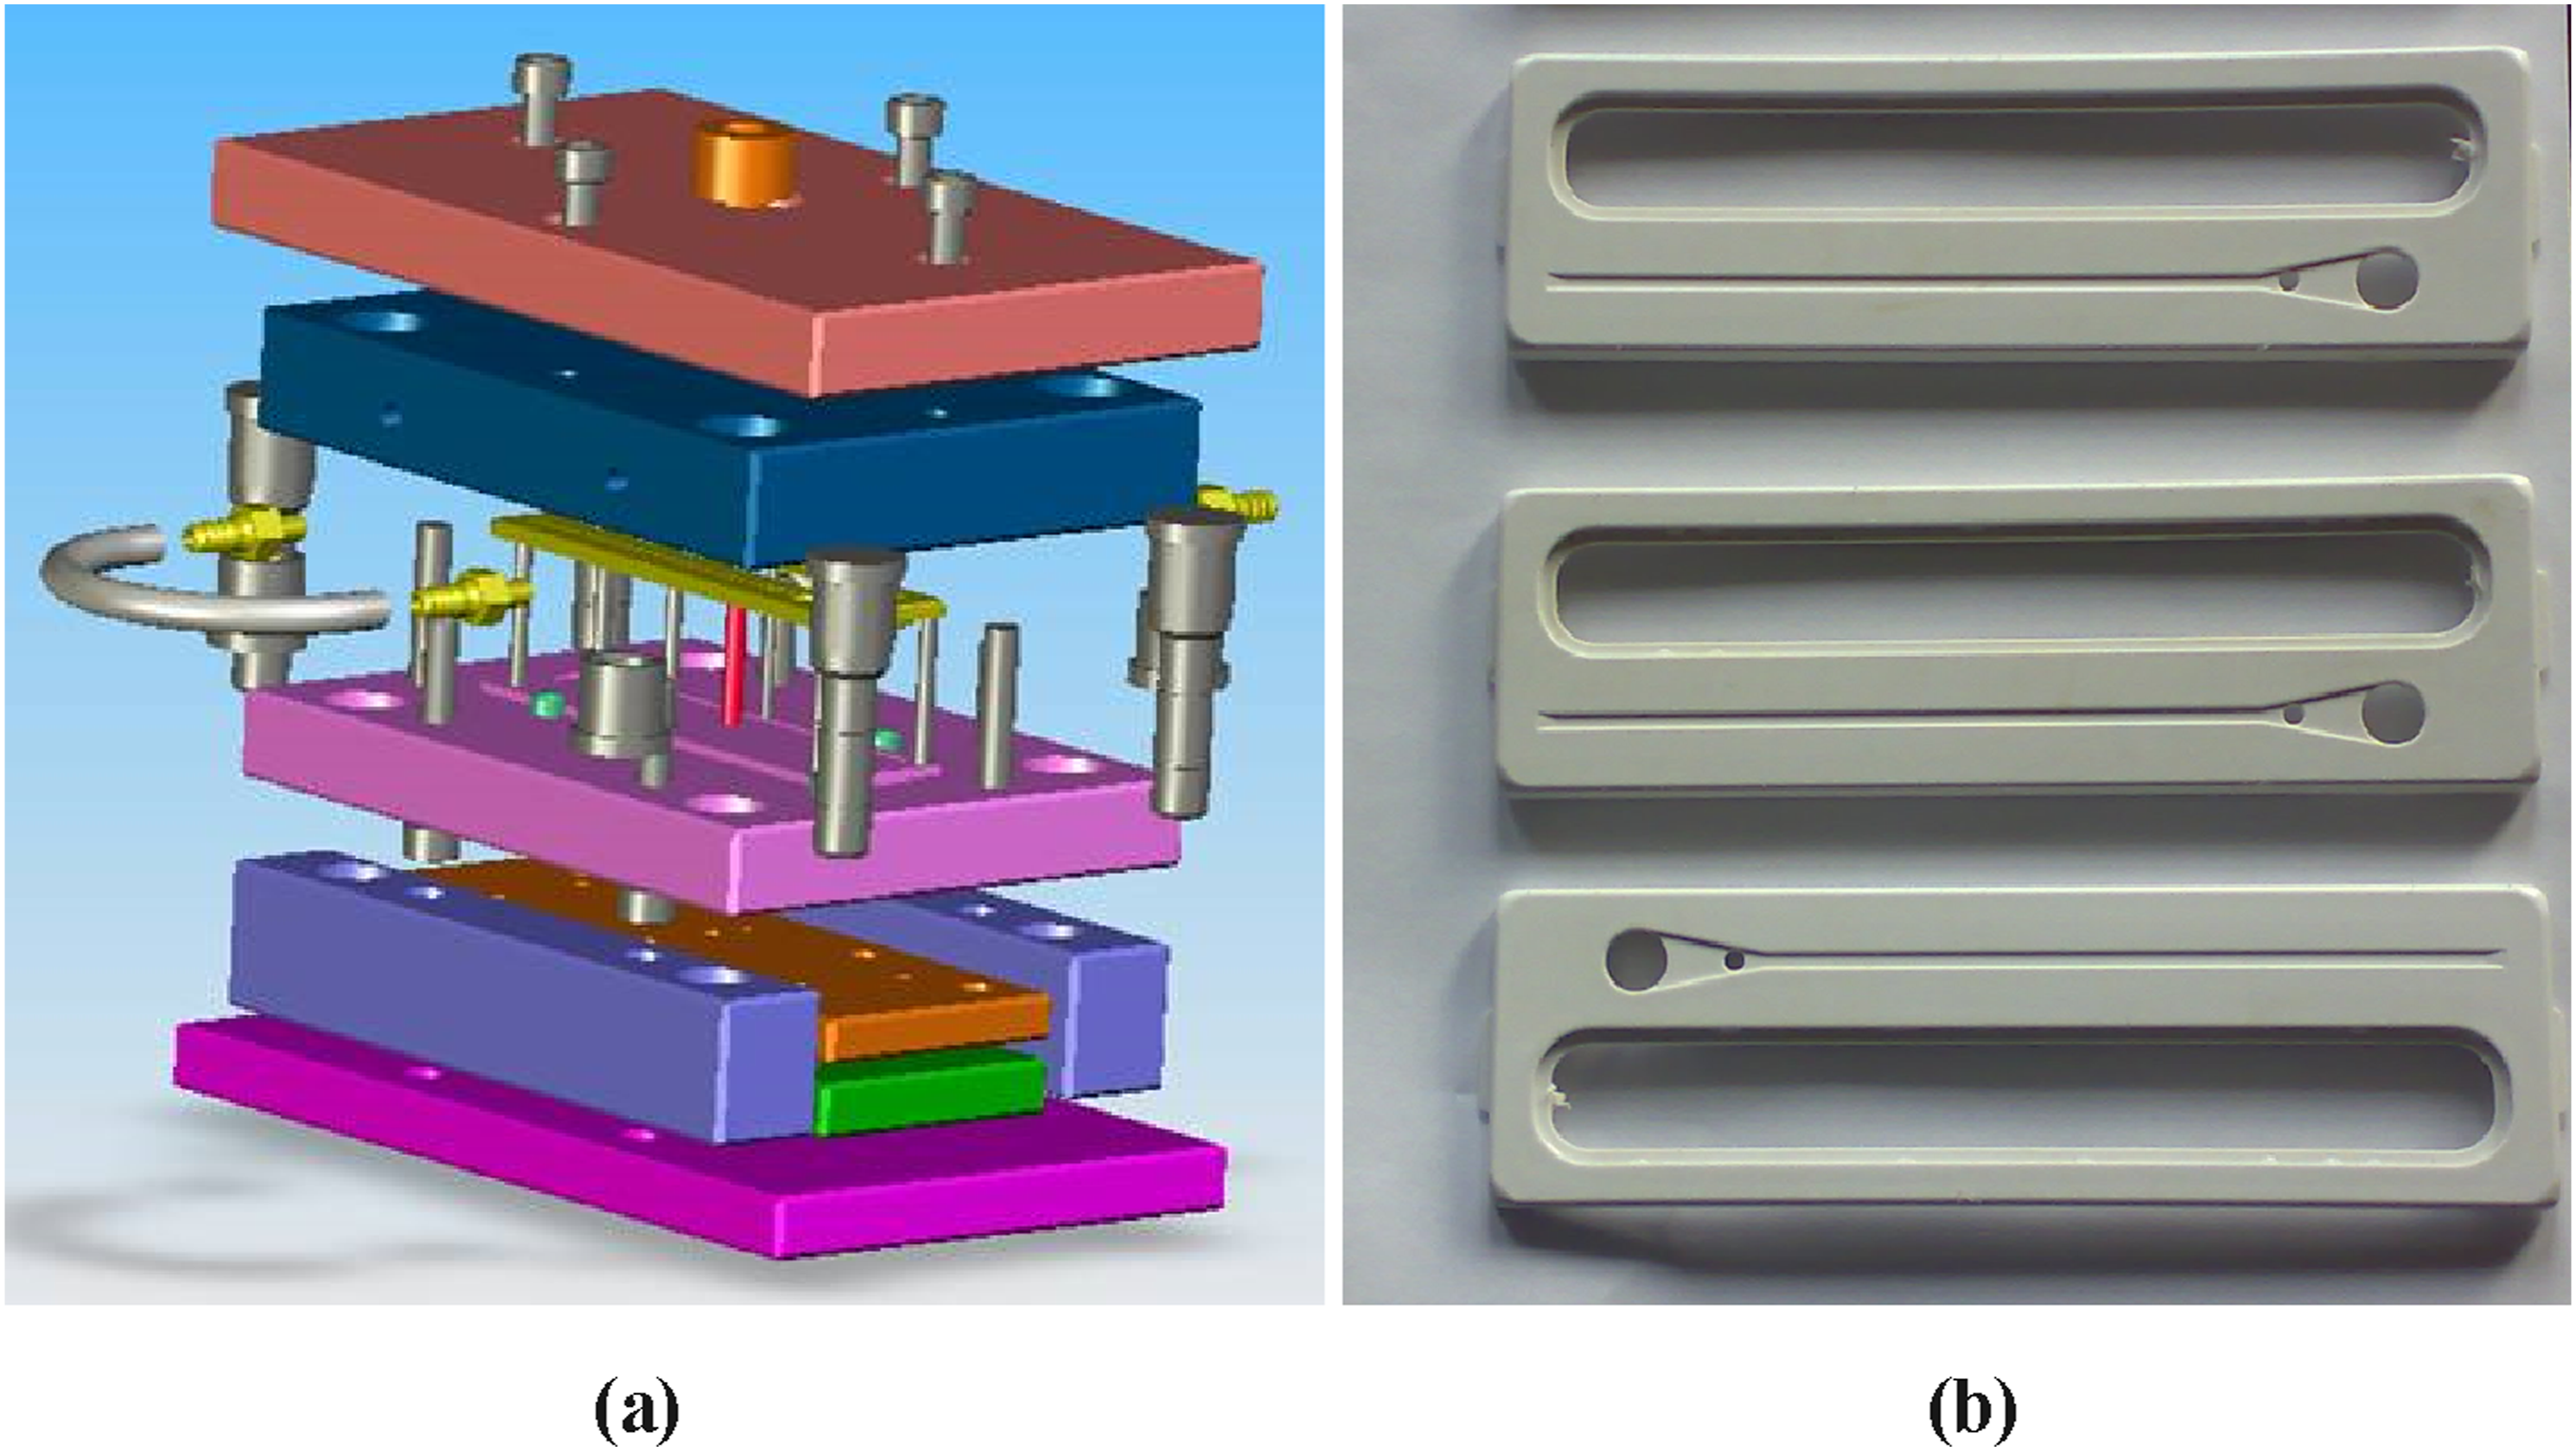
Measurement of weld line width of the samples
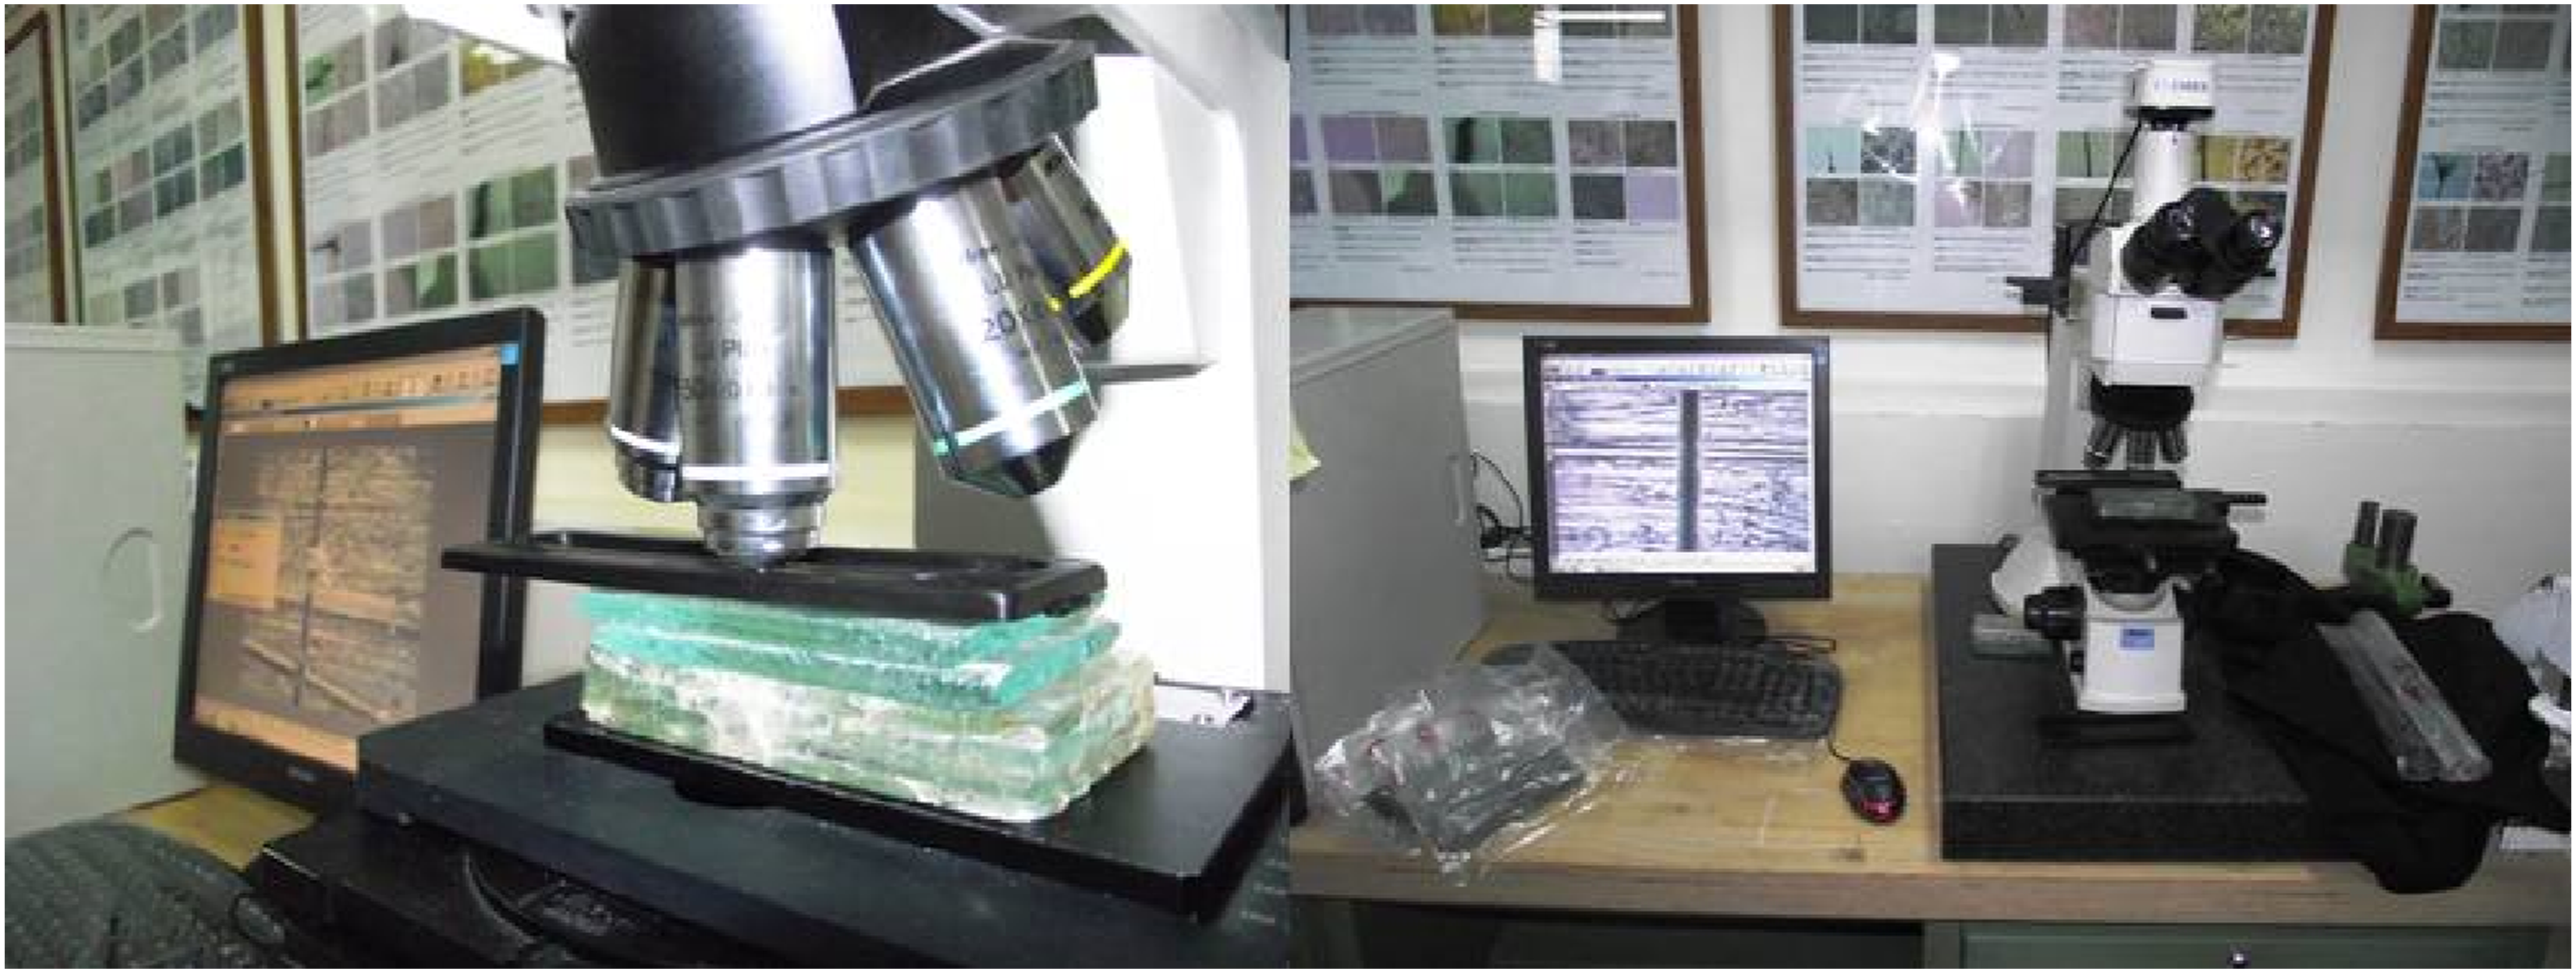
Visible joint marks, that is, weld lines observed on polypropylene polymer materials, were measured using an optical microscope “Nikkon” in the “CLEMEX” program. Measurements of weld lines on plastic tests were conducted at different points along the line. Figure 2 illustrates the location of the actual weld line on the sample, while Figure 3 displays the measurement unit pictures obtained from the optical microscope for the 27 polypropylene parts. The location of real weld line on PP sample. Measurement of weld line with optic microscopy.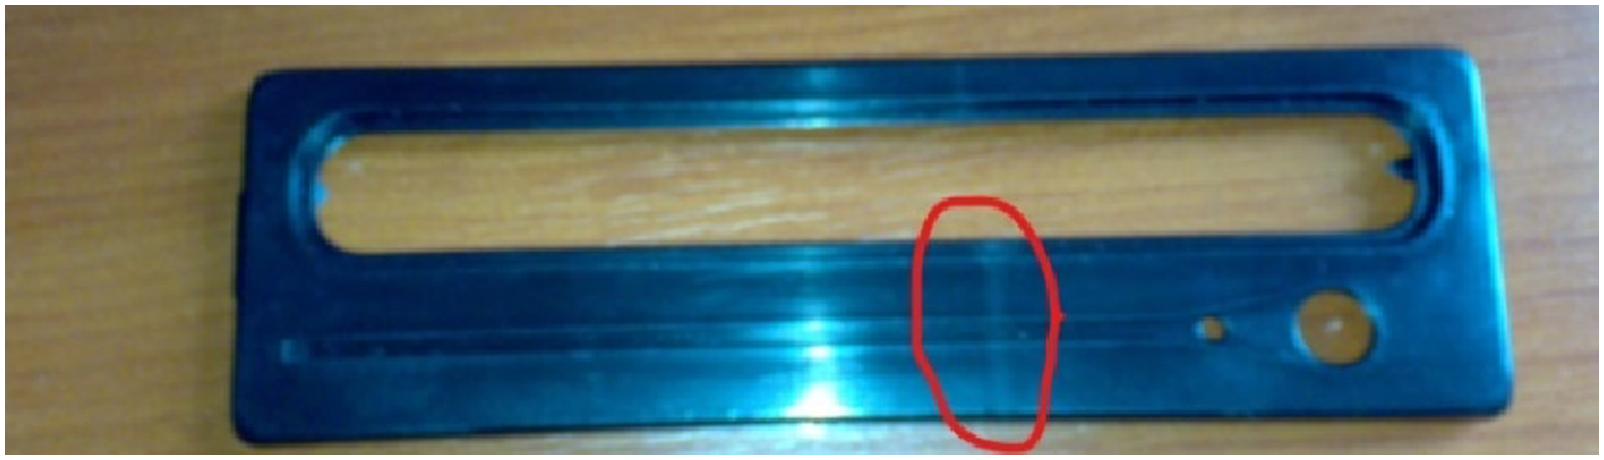
Parametric analysis
The measurement results were examined for a parametric study of the PIM process using response surfaces. Additionally, contour plots were utilized to estimate the optimum conditions for minimizing weld line width.
Statistical analysis
The experimental results were analyzed for statistical inference, determining significant PIM process parameters, and developing a predictive model for weld line width.
Genetic algorithm
Genetic Algorithms (GAs) are adaptive heuristic search algorithms based on the evolutionary principles of natural selection and genetics. Introduced by Holland in the 1960s, GA is a subset of a larger class of evolutionary algorithms that utilize techniques inspired by evolutionary biology, including inheritance, mutation, selection, and crossover. 22 GAs begins with a population of candidate solutions represented as chromosomes. Through iterative processes of selection, crossover (recombination), and mutation, new generations of solutions are generated. The fittest individuals, determined by a fitness function, are chosen to pass their genes to the next generation. Over successive generations, the population evolves toward an optimal solution.23,24 In the current study, GA was employed to identify the optimum PIM conditions for minimizing weld lines. The MATLAB programming platform was utilized for the implementation of GA.
Particle swarm optimization
Particle Swarm Optimization (PSO) is a heuristic optimization technique inspired by the social behavior of birds and fish. Introduced by Kennedy and Eberhart in 1995, PSO is based on the cooperative behavior observed in flocks of birds or schools of fish. 25 In PSO, each potential solution within the search space is represented as a particle in the swarm. These particles move iteratively through the solution space, with their movements influenced by their own best-known position and the overall best-known position within the swarm. The algorithm aims to find the optimal solution by updating generations of particles until a stopping criterion is met. 26 The velocity of each particle is dynamically adjusted according to its historical behaviors, guiding the swarm toward optimal regions.27,28 In the present work, PSO was utilized to determine the optimum set of PIM process conditions for minimizing weld lines, employing MATLAB.
Results and discussions
Weld lines measurements and statistical analysis
The significance of welding lines lies in their ability to join diverse materials, such as metals or alloys, seamlessly and securely. By creating a continuous and strong bond, welding lines ensure the structural integrity of the assembled parts, enabling them to withstand various mechanical stresses, vibrations, and environmental conditions.29–32 Furthermore, welding lines contribute to the efficiency of manufacturing processes, allowing for the creation of complex and customized designs that might be challenging to achieve through other joining methods. Micrographs showing measurements in microns are presented in Figure 4. It can be observed in the micrographs that welding lines, which may appear as surface imperfections, actually signify material flow detachment, thus resulting in a reduction of strength and mechanical properties. Welding lines play a crucial role in the fabrication and assembly of materials, serving as integral connections that contribute to the overall strength, stability, and functionality of structures or components. The average values of welding line width obtained at different points have been recorded for further study.
33
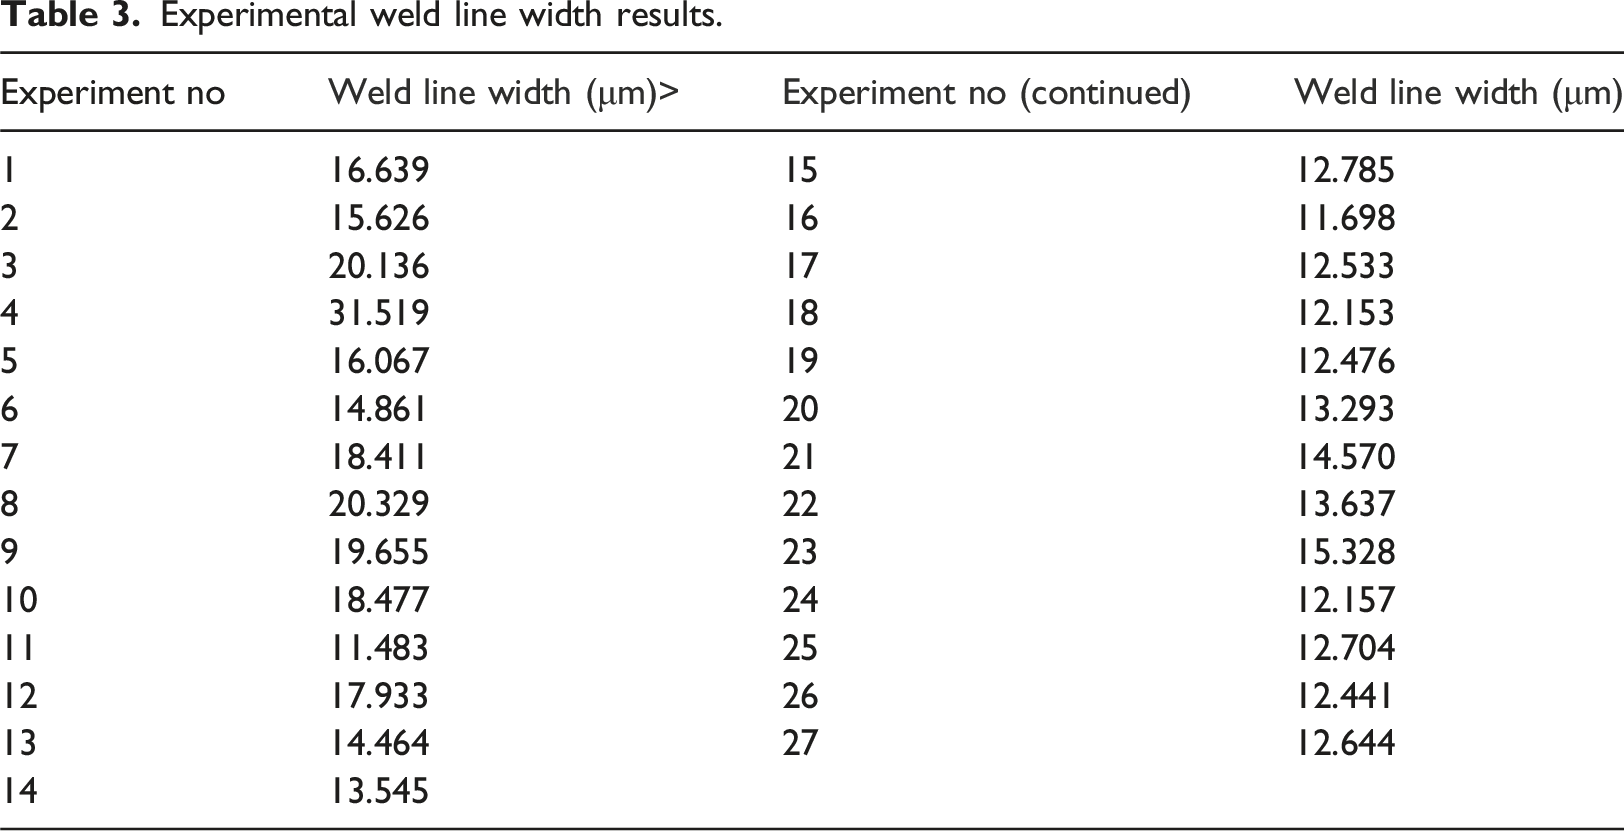
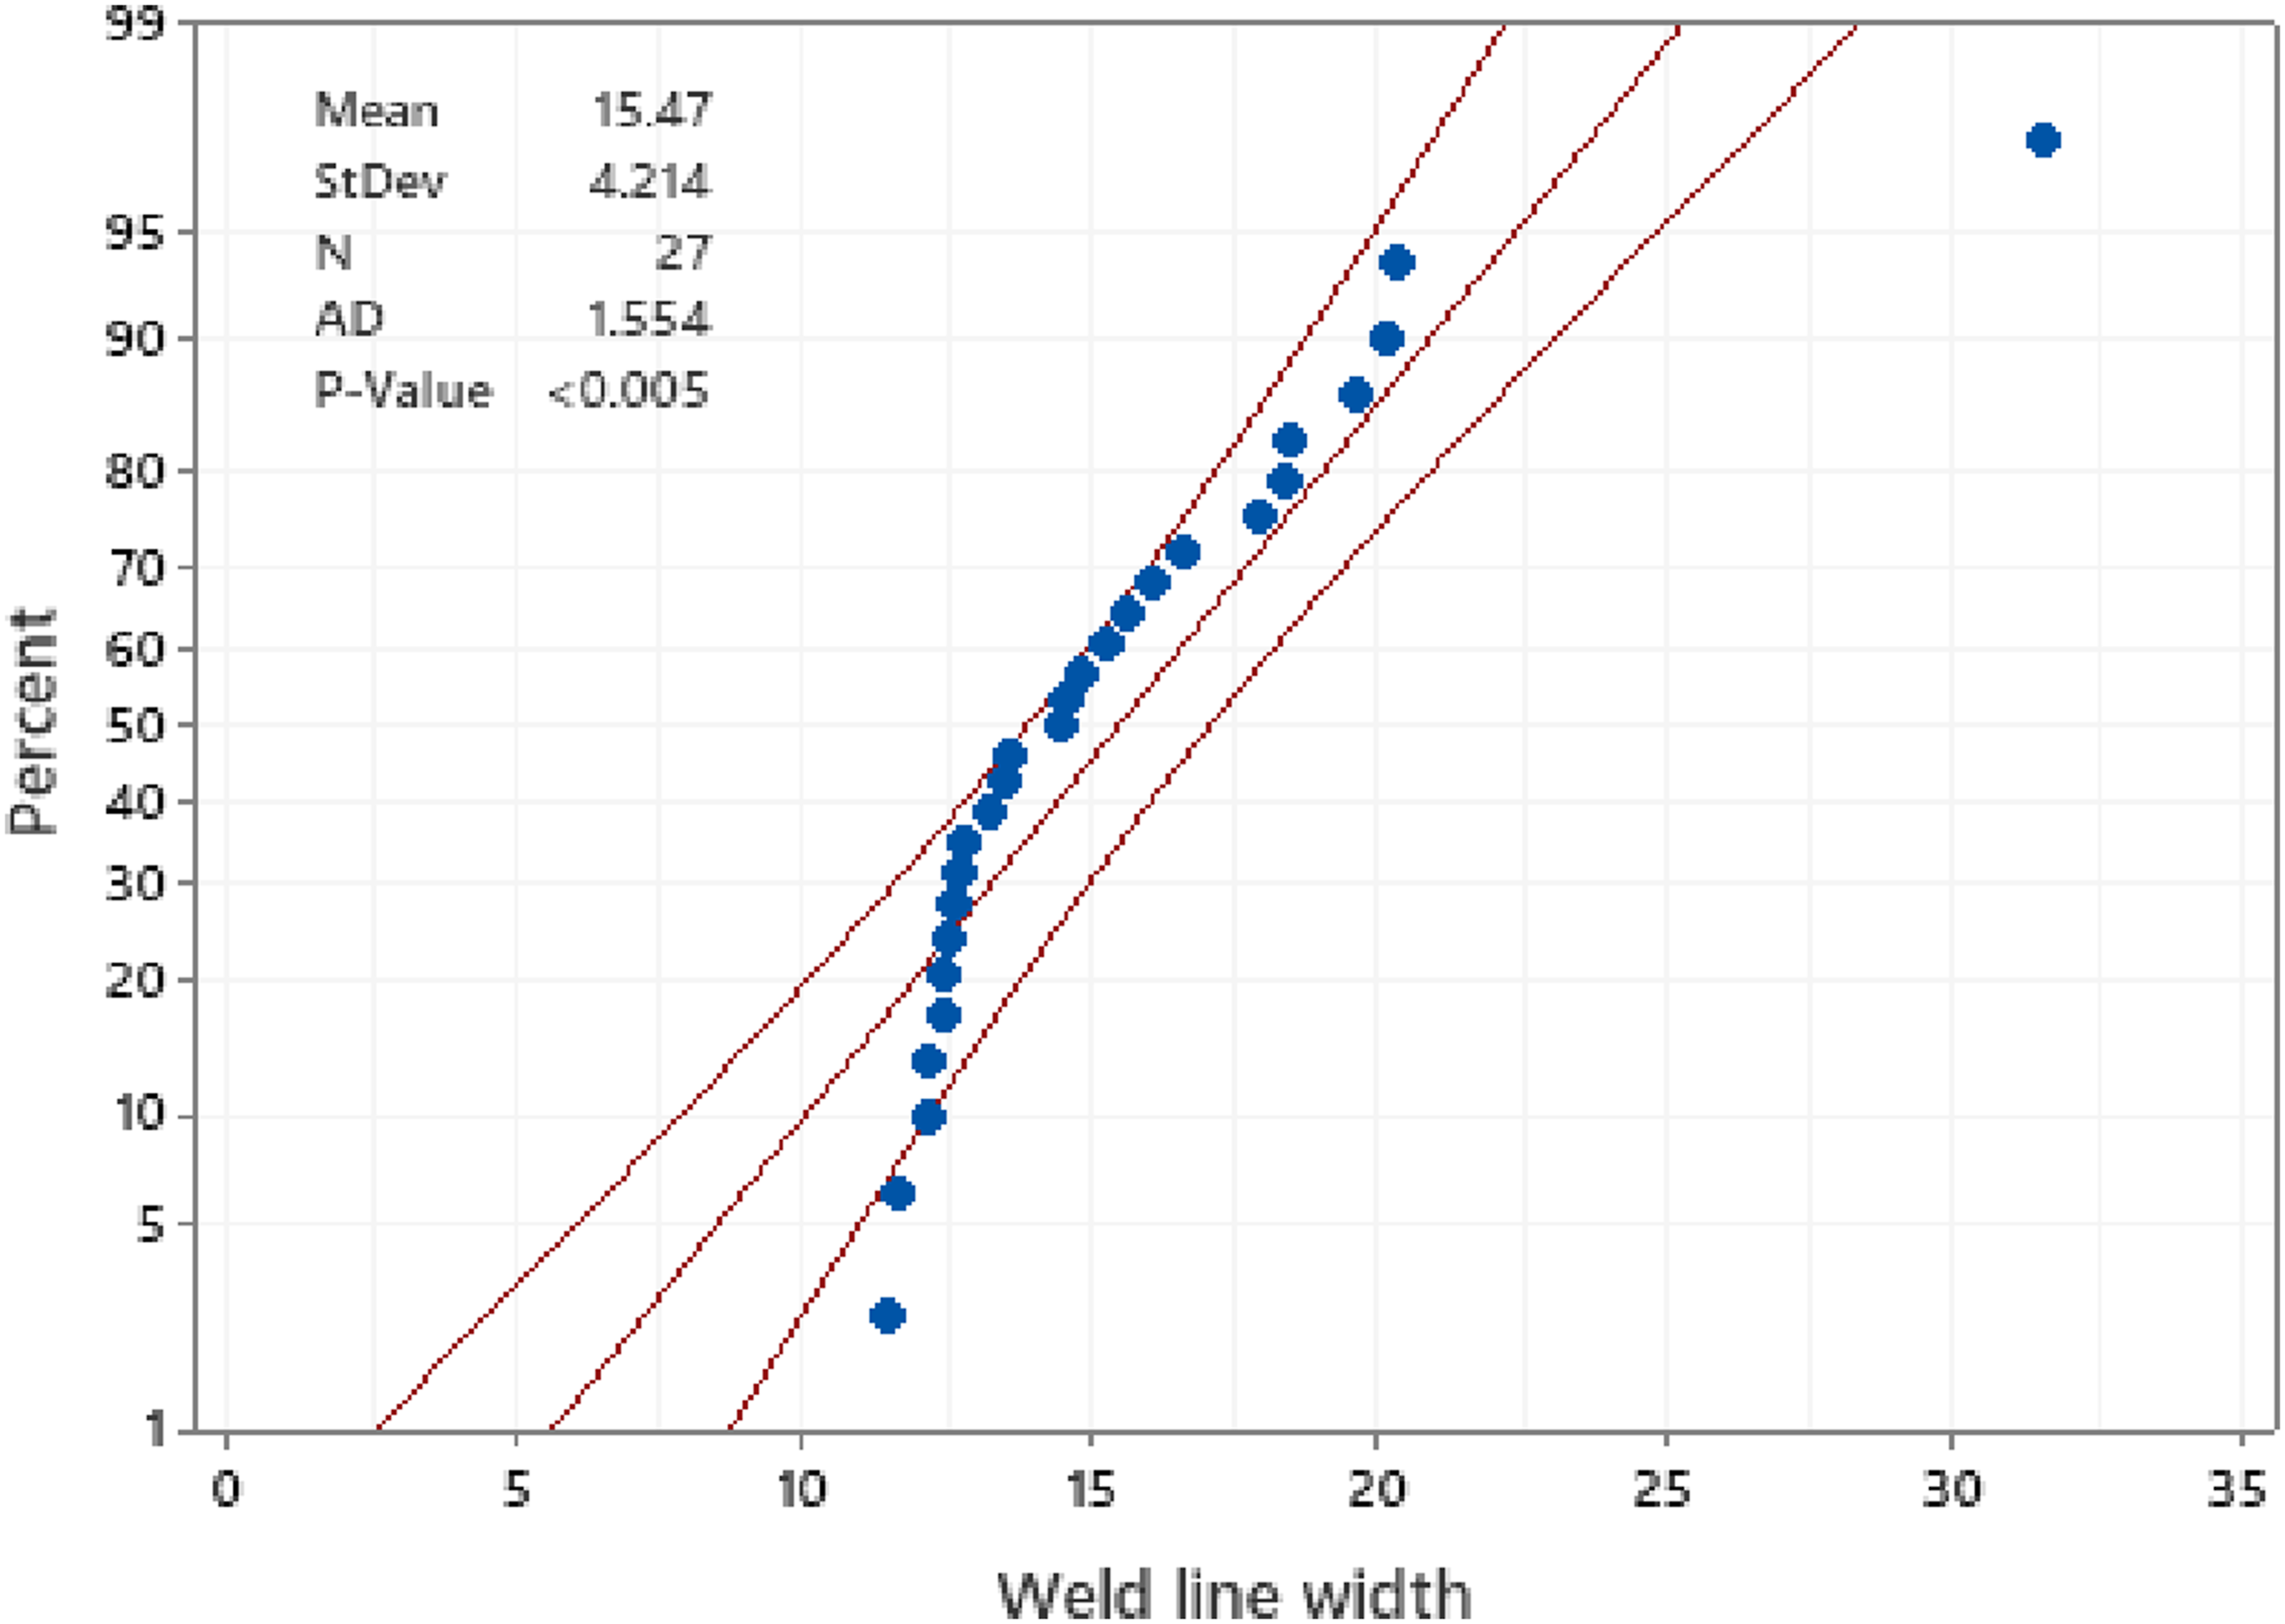
Table 3 presents these measurements for 27 experimental runs. Figure 5 illustrates the normal probability of welding line widths. They either lie on the line or are close to it, indicating a normal distribution of errors. Furthermore, there is no clustering of values indicating data binding. The mean value of measurements is 15.47, with a standard deviation of 4.214 at a confidence interval of 95%. Weld Lines results for different PP samples. Experimental weld line width results. Normal probability plot at CI 95%.
Parametric analysis for optimum PIM conditions effects on weld lines
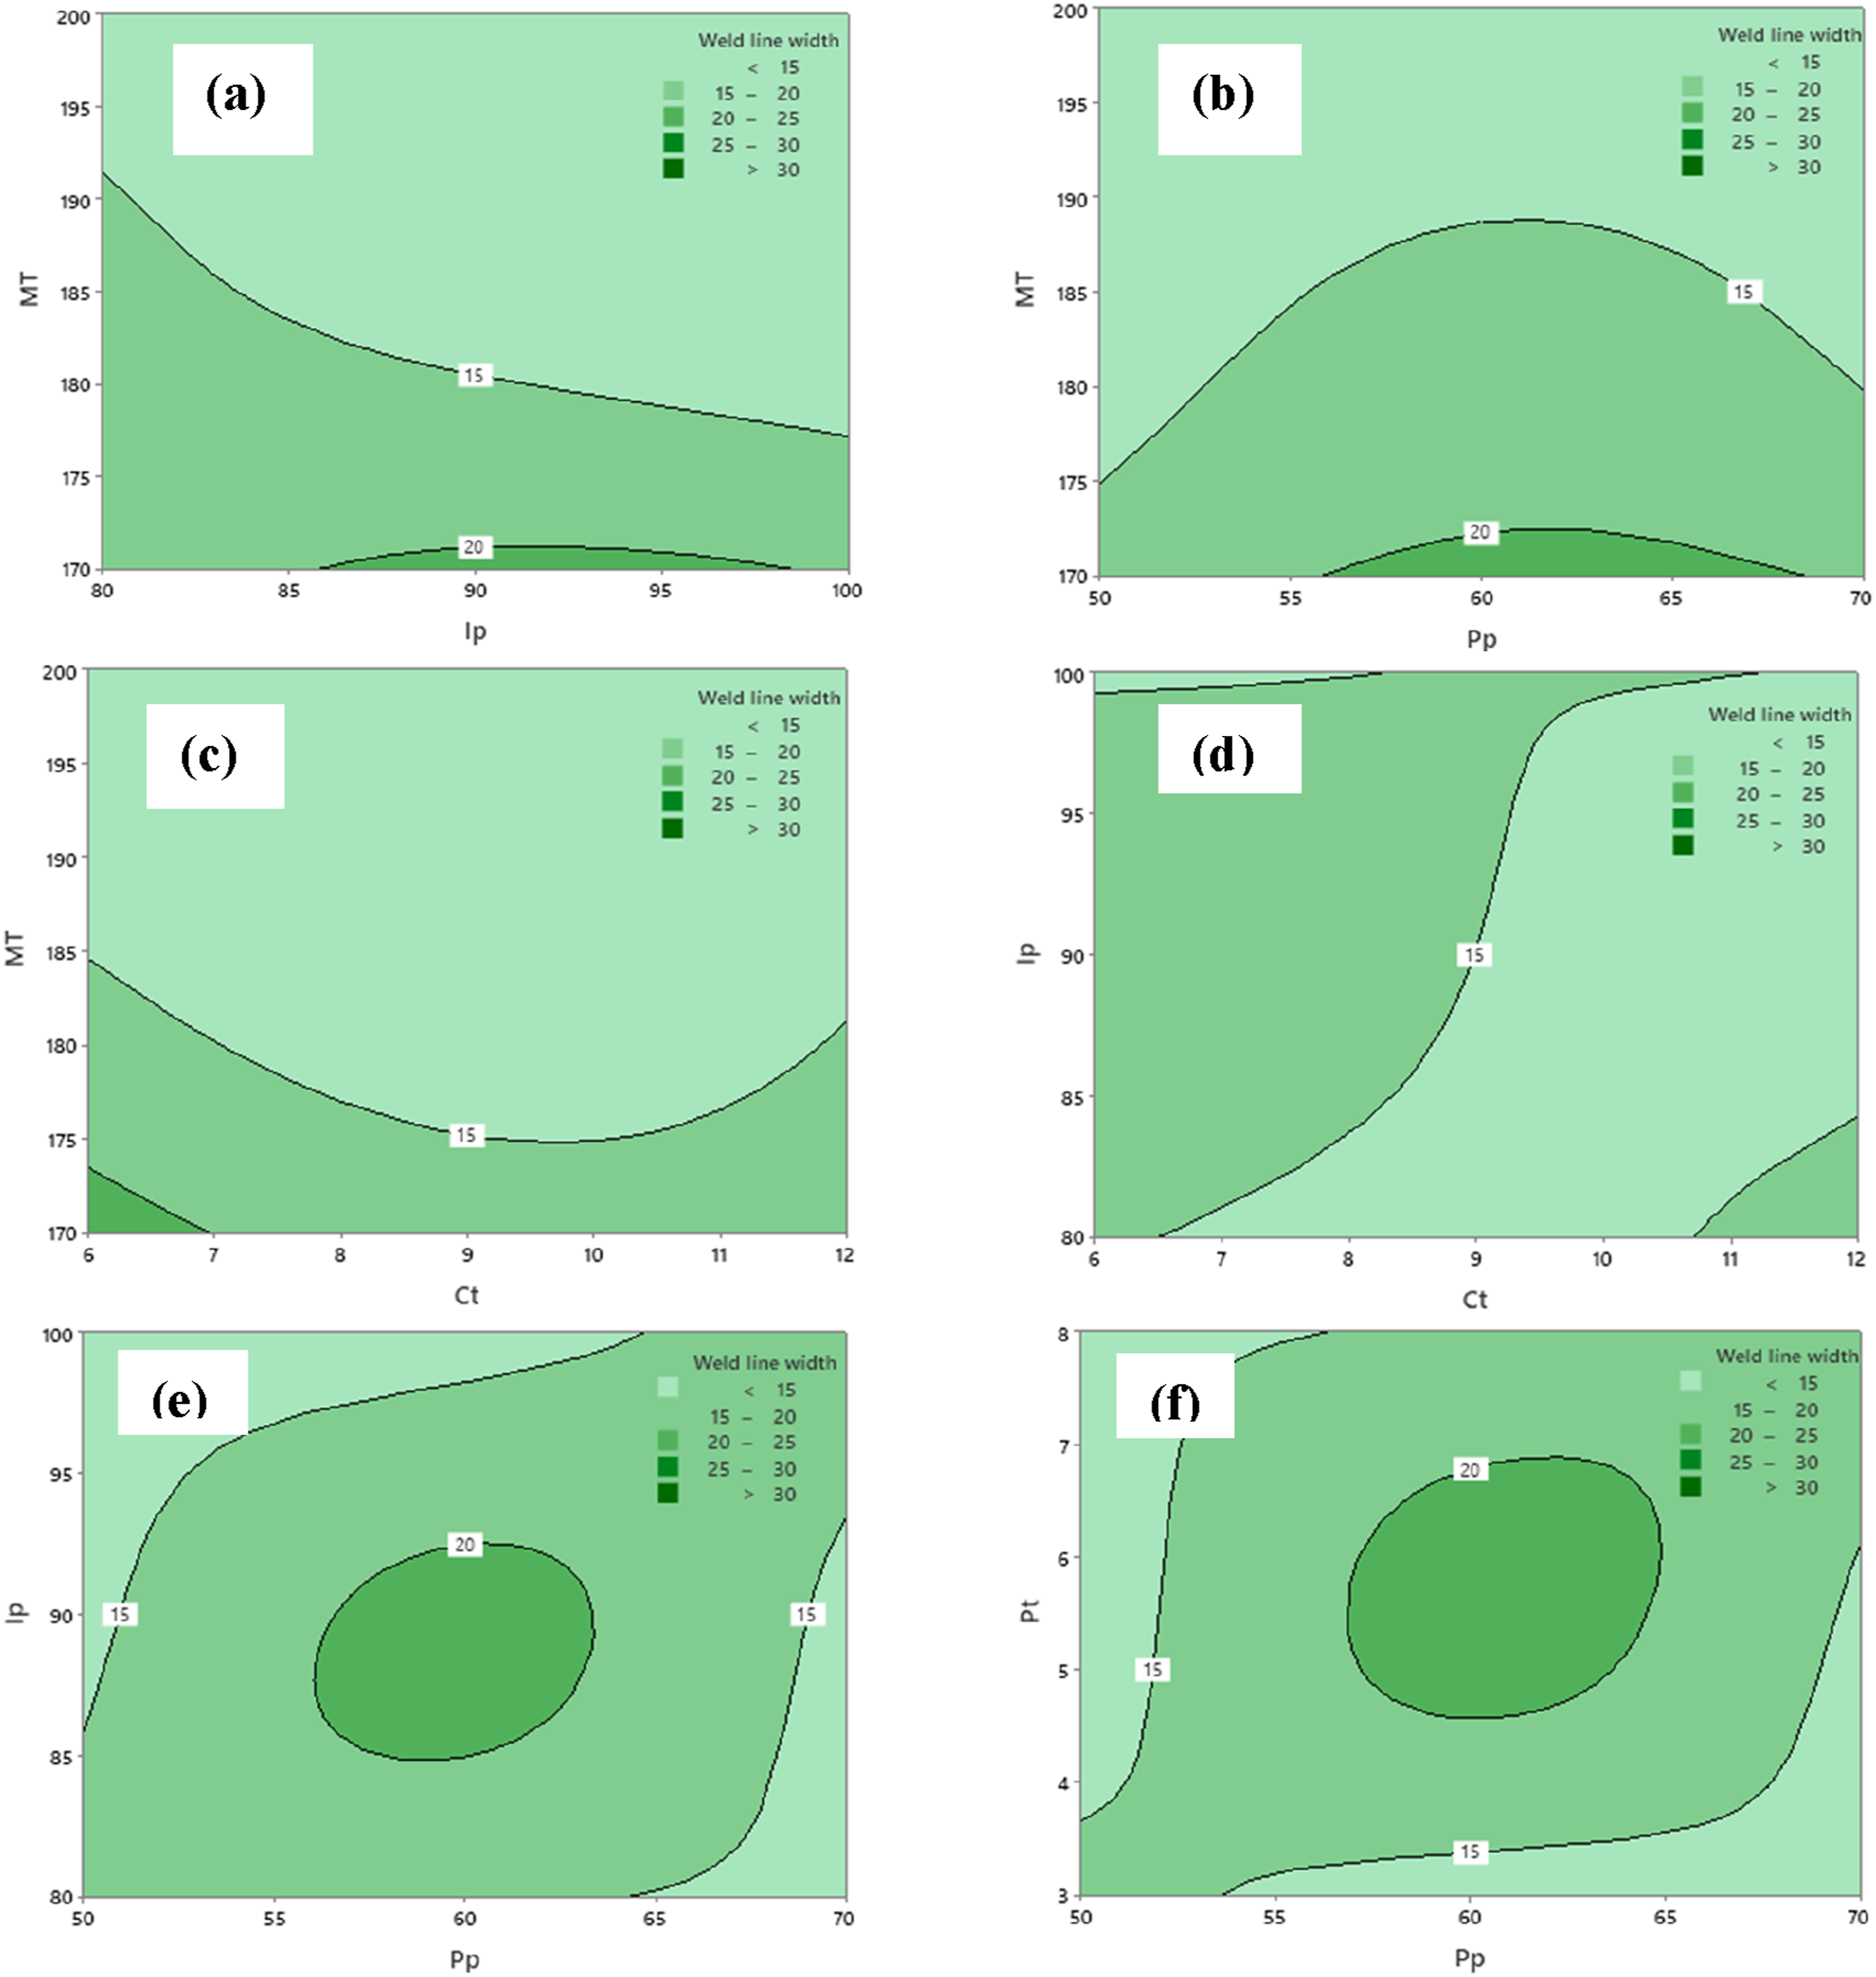
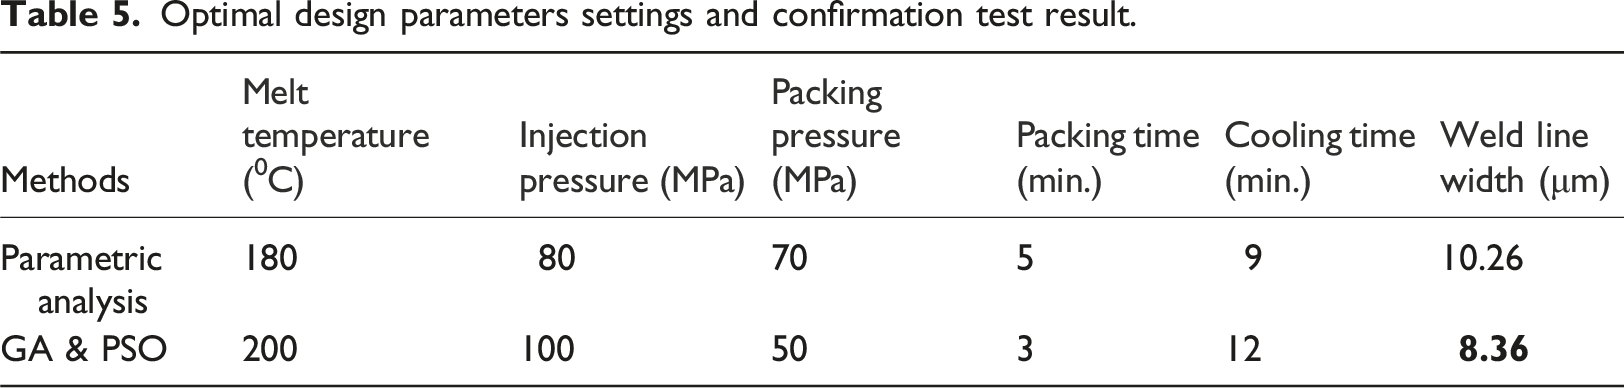
Using the response surface model for weld line, the influence of PIM conditions on the weld line was plotted using response surface plots (Figure 6) and contour plots (Figure 7). The trend of weld line width with PIM process conditions can be studied, and optimum parameter settings can be obtained. At 180°C melt temperature (MT), weld line width increases with injection pressure (IP) up to 90 MPa, then decreases (Figure 6(a)). Whereas at the same MT, weld line increases with packing pressure (Pp) up to 60 MPa, then decreases up to 68 MPa, and increases again at the end (Figure 6(b)). At 180°C MT, weld line width decreases with cooling time (Ct) up to 8 min, then remains constant (Figure 6(c)). It was observed from Figure 6(d) that the weld line width increases with IP at 6 min of Ct up to 90 MPa, then decreases, whereas at 80 MPa IP, weld line decreases with Ct up to 9 min, then increases till the end. Similarly, the pair of conditions melt temperature (MT)-injection pressure (IP), packing pressure (Pp)-packing time (Pt) can also be examined (Figure 6(e)–(f)). Contour plots depict (in Figure 7) that the optimum PIM conditions for minimum weld line width were: 180°C melt temperature, 80 MPa injection pressure, 70 MPa pack pressure, 5 min packing time, and 9 min cooling time. Response surface plots. Contour plots.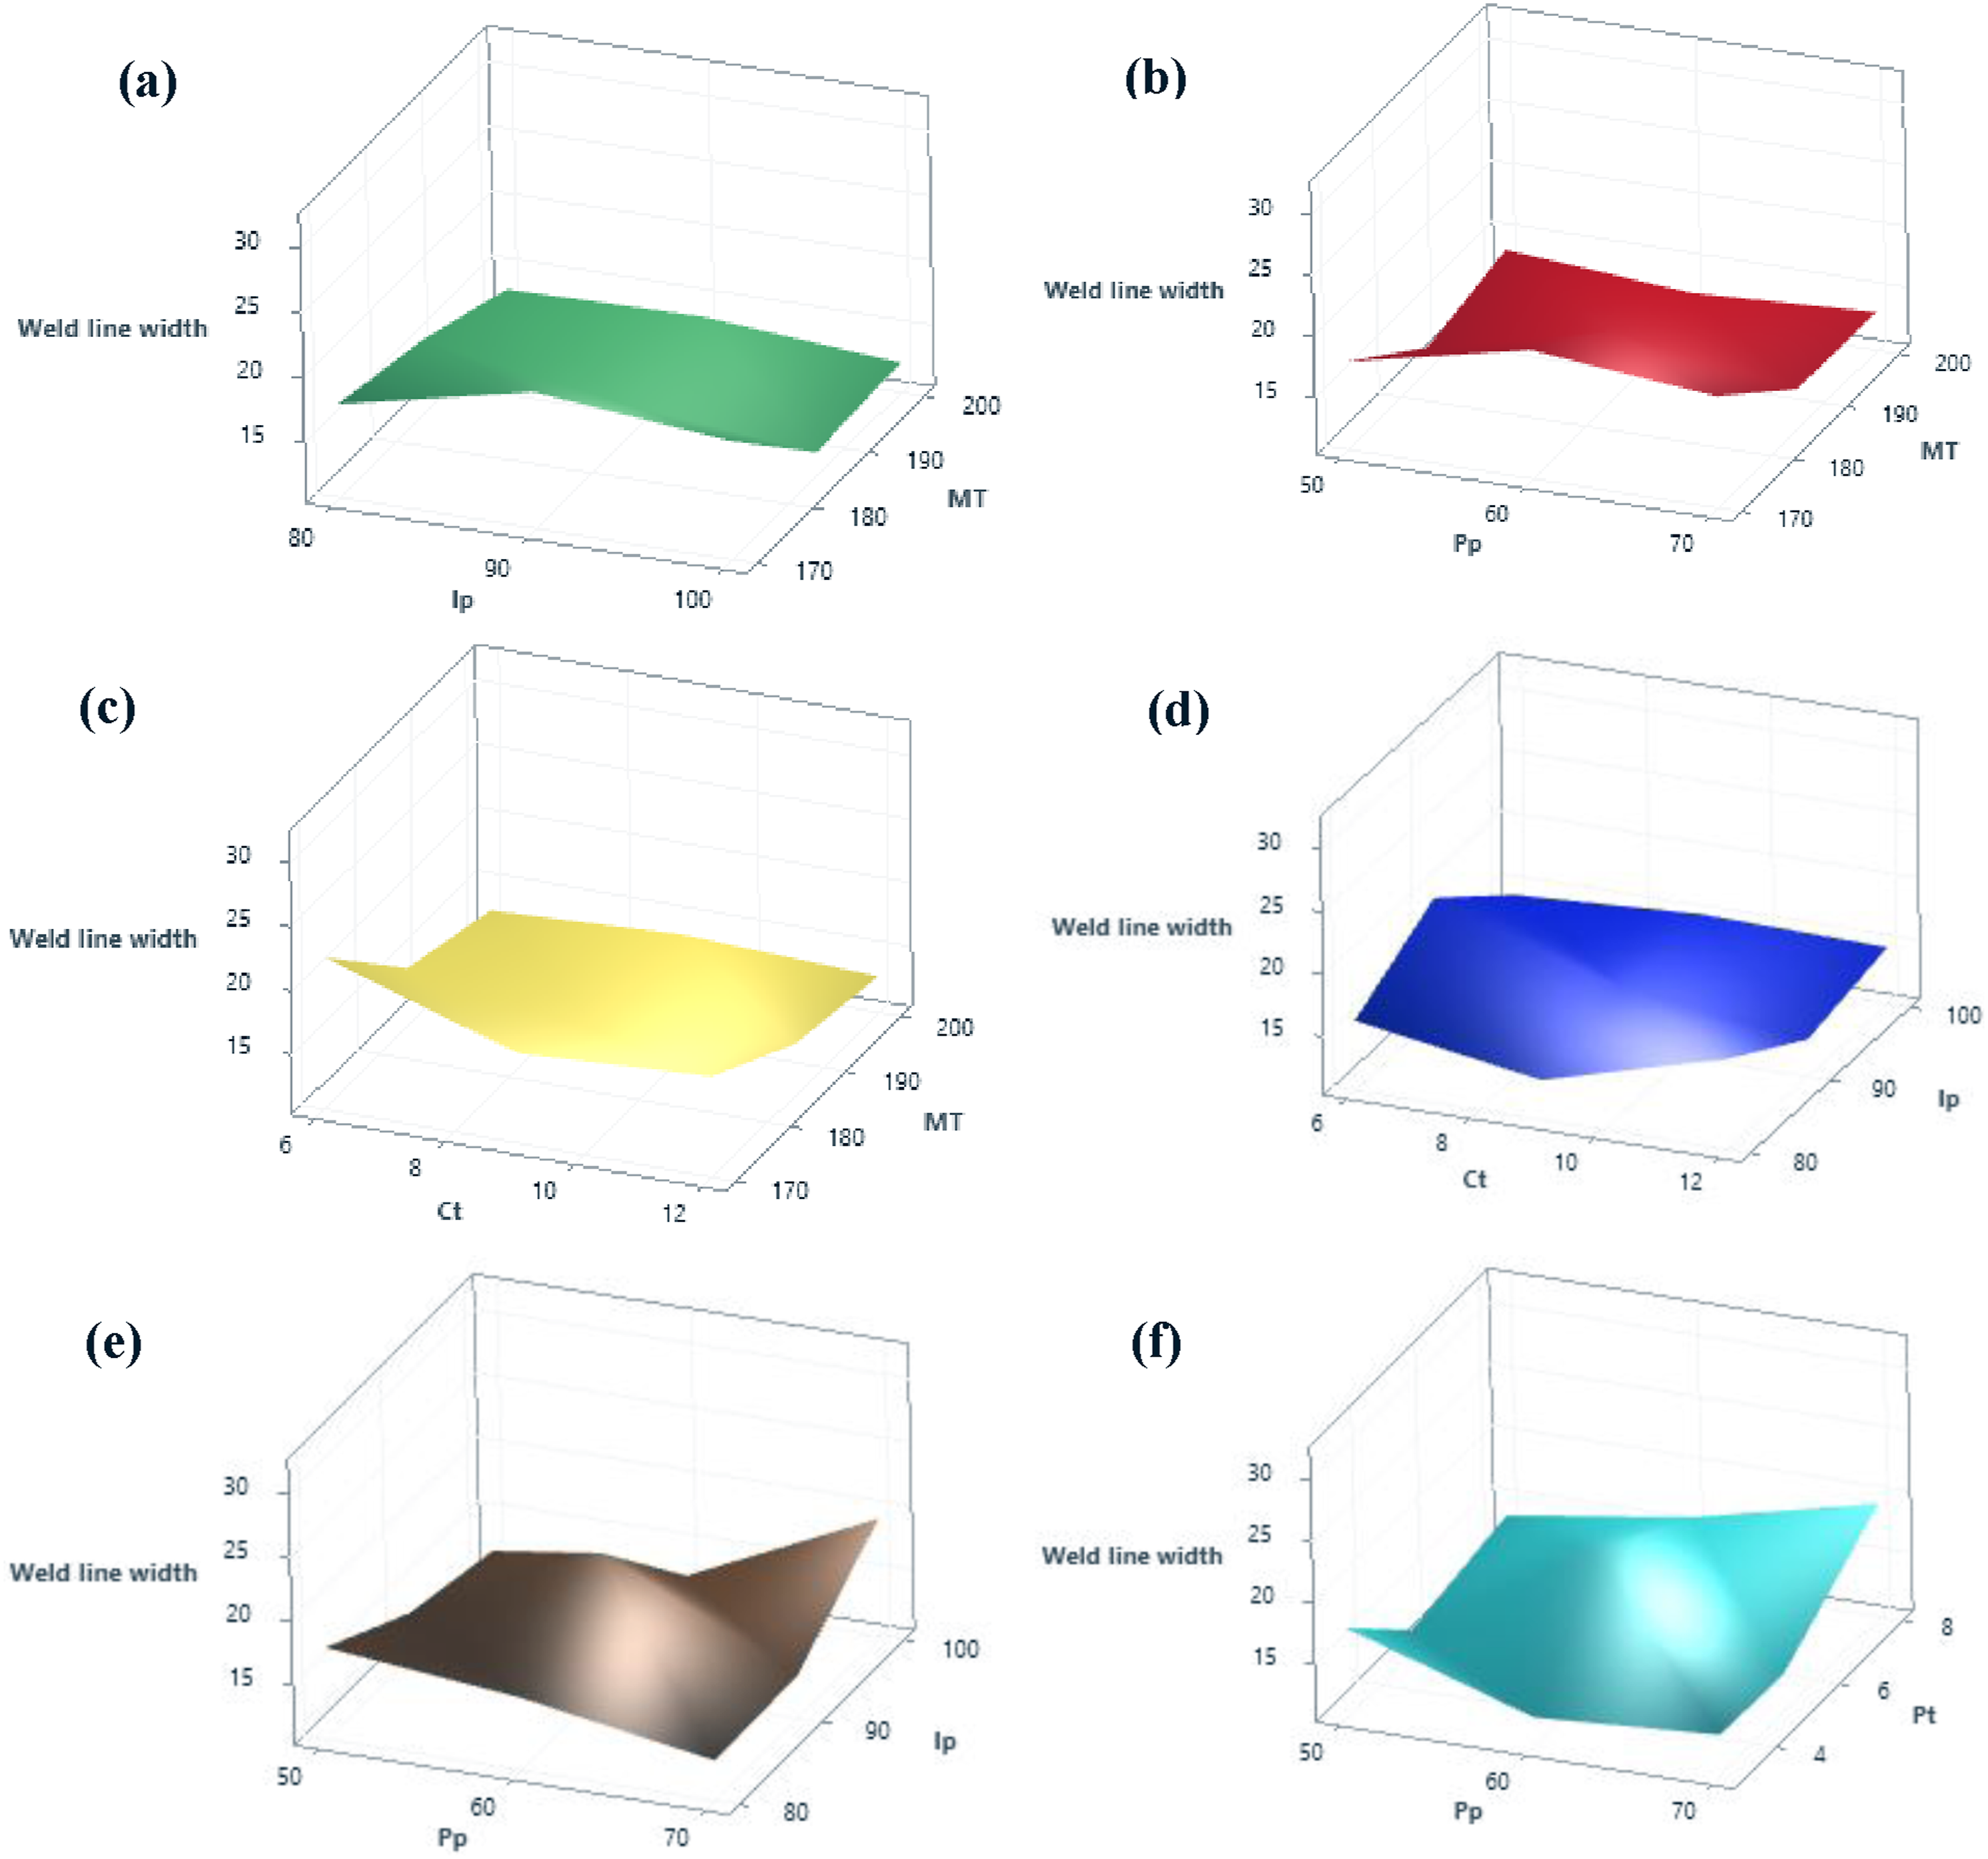
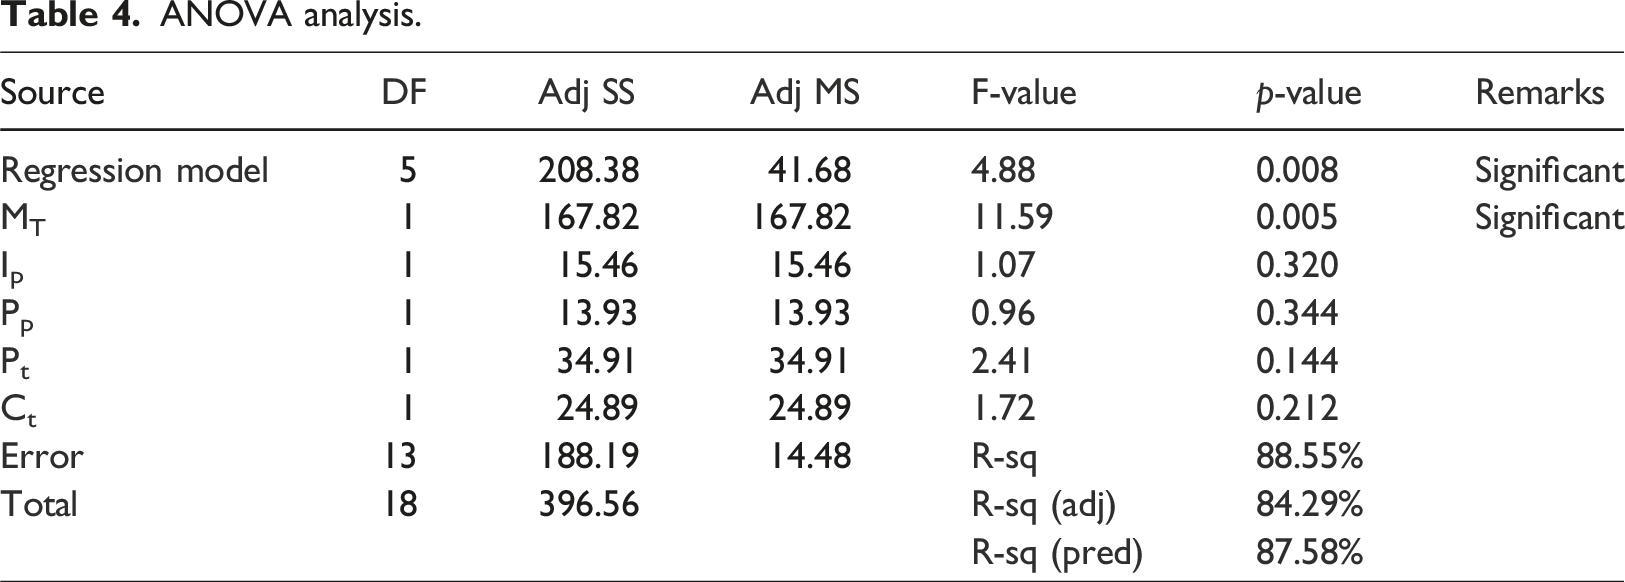
ANOVA and regression methods
Analysis of Variance (ANOVA) is a statistical method used to determine if there are any statistically significant differences between the means of three or more independent (unrelated) groups. It was introduced by the statistician Ronald A.Fisher in the 1920s. 28 ANOVA provides a statistical test of whether or not the means of several groups are equal, and therefore generalizes the t test to more than two groups. The method is used to analyze the differences among group means in a sample. The ANOVA test has important assumptions that must be satisfied to reliably use it: normality, homogeneity of variances, and independent observations. 34 The results of the ANOVA test are reported in the form of an F-statistic and associated p-value. The F-statistic is a ratio of variances, and it compares the variance between group means to the variance within groups. A significant F-statistic indicates that there is a significant difference between at least two of the group means. 25
ANOVA analysis.
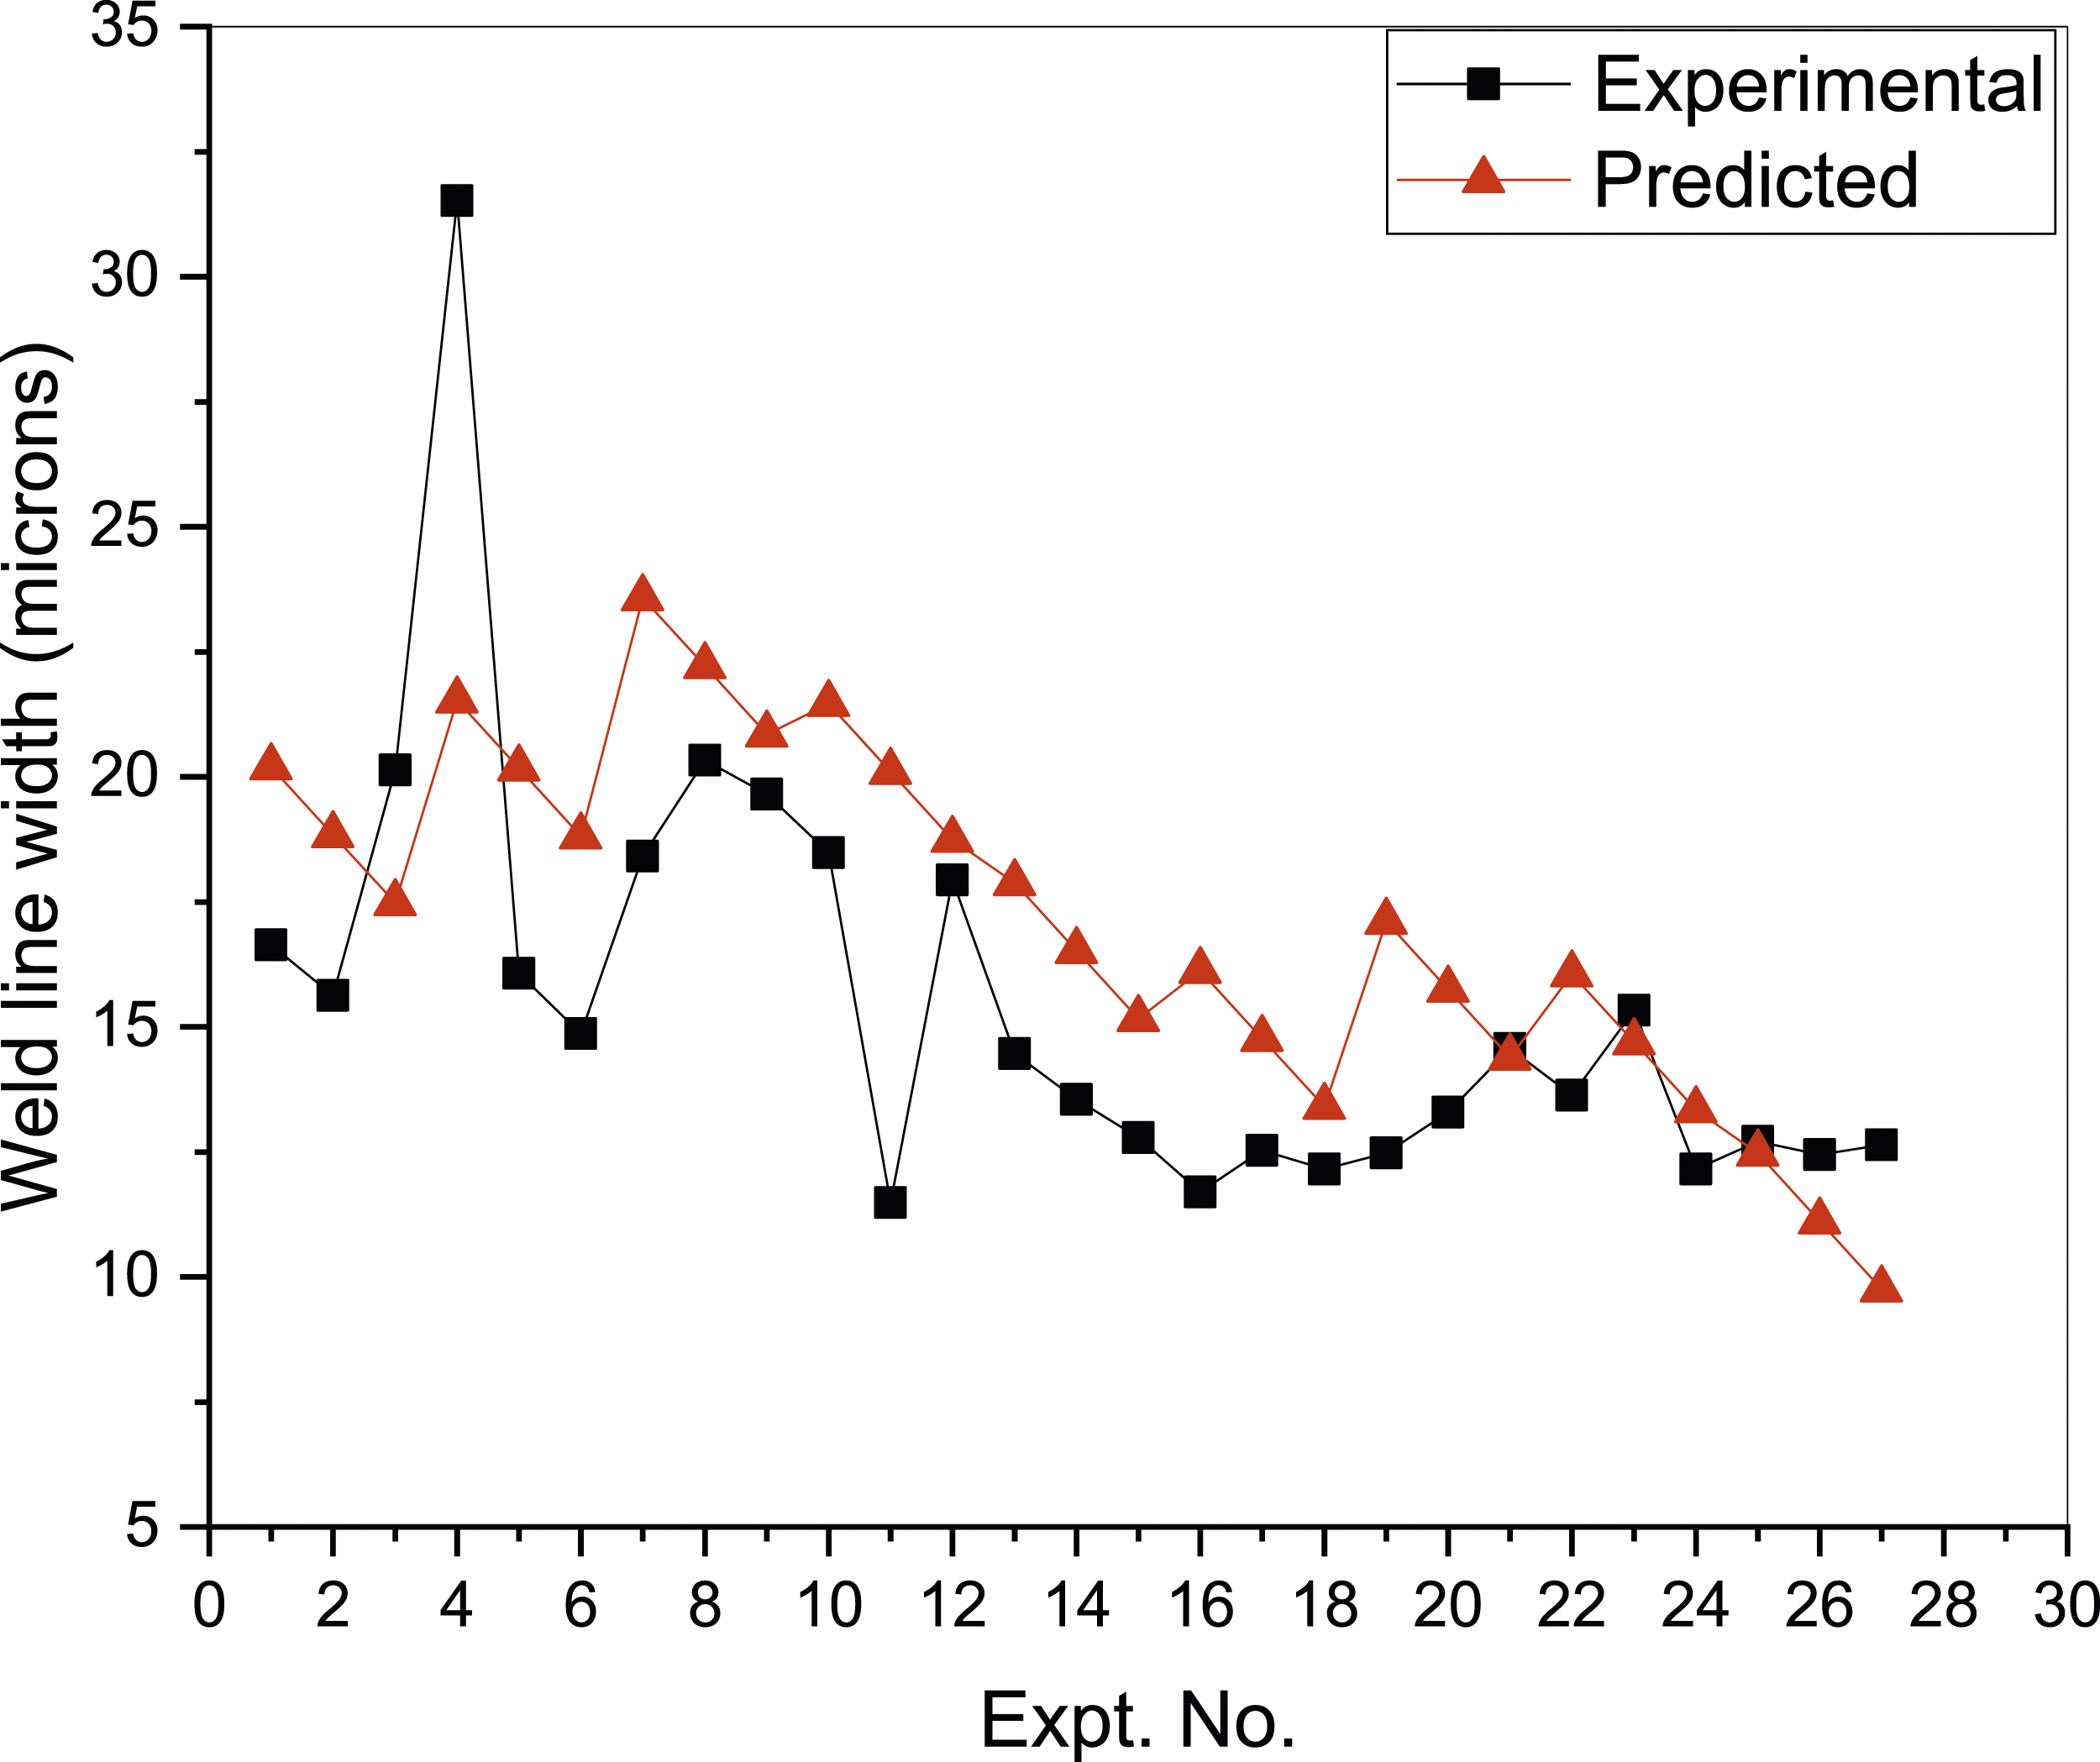
Experimental versus predicted weld line width.
Linear regression
Linear Regression is a basic statistical method used to model the relationship between a dependent parameter and one or more independent parameters. The simplest form of linear regression is simple Linear Regression, which models the relationship between two variables by fitting a linear equation to observed data. The method of least squares, introduced by Legendre and Gauss, is commonly used to estimate the parameters of the linear equation. This technique minimizes the sum of the squared residuals, which are the differences between observed and calculated values.28,35 The assumptions of Linear Regression include linearity, independence, homoscedasticity, and normality of residuals.
Evolutionary optimization for optimum PIM conditions
A minimization problem for the weld line width was defined to get optimum conditions of plastic injection process considering the regression equation (Equation (1)) generated by the predictive model. 36
Find Z = (MT, Ip, Pp, Pt, Ct);
To minimize
Subjected to,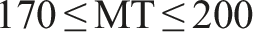
Most preferred and accurate evolutionary optimization algorithms: GA & PSO was applied to solve this problem. Figure 9 gives performance of the GA in the form of mean & best fitness observed after running MATLAB code for the objective function.
27
Different GA conditions consider in the code were: chromosome length 12, population 100, generation 160, crossover rate 0.95 and mutation rate 0.05. Fitness
18
is the objective function for the optimization problem. The mean fitness starts with relatively higher value (15.5 μm) and becomes minimum (6.12302 μm) at 60th generation, whereas best fitness starts at 10.5 μm and yields minimum value (6.12302 μm) at 50th generation. This variation is because of the random generation of population of 100 individuals by GA, it can be observed that irrelative to this variation of fitness they converges to the same optimum value. After certain generations (30th) GA compares average fitness with the best fitness and both progress with better value (6.12302 μm). The optimum process conditions predicted by GA are given in Table 5. Convergence of GA.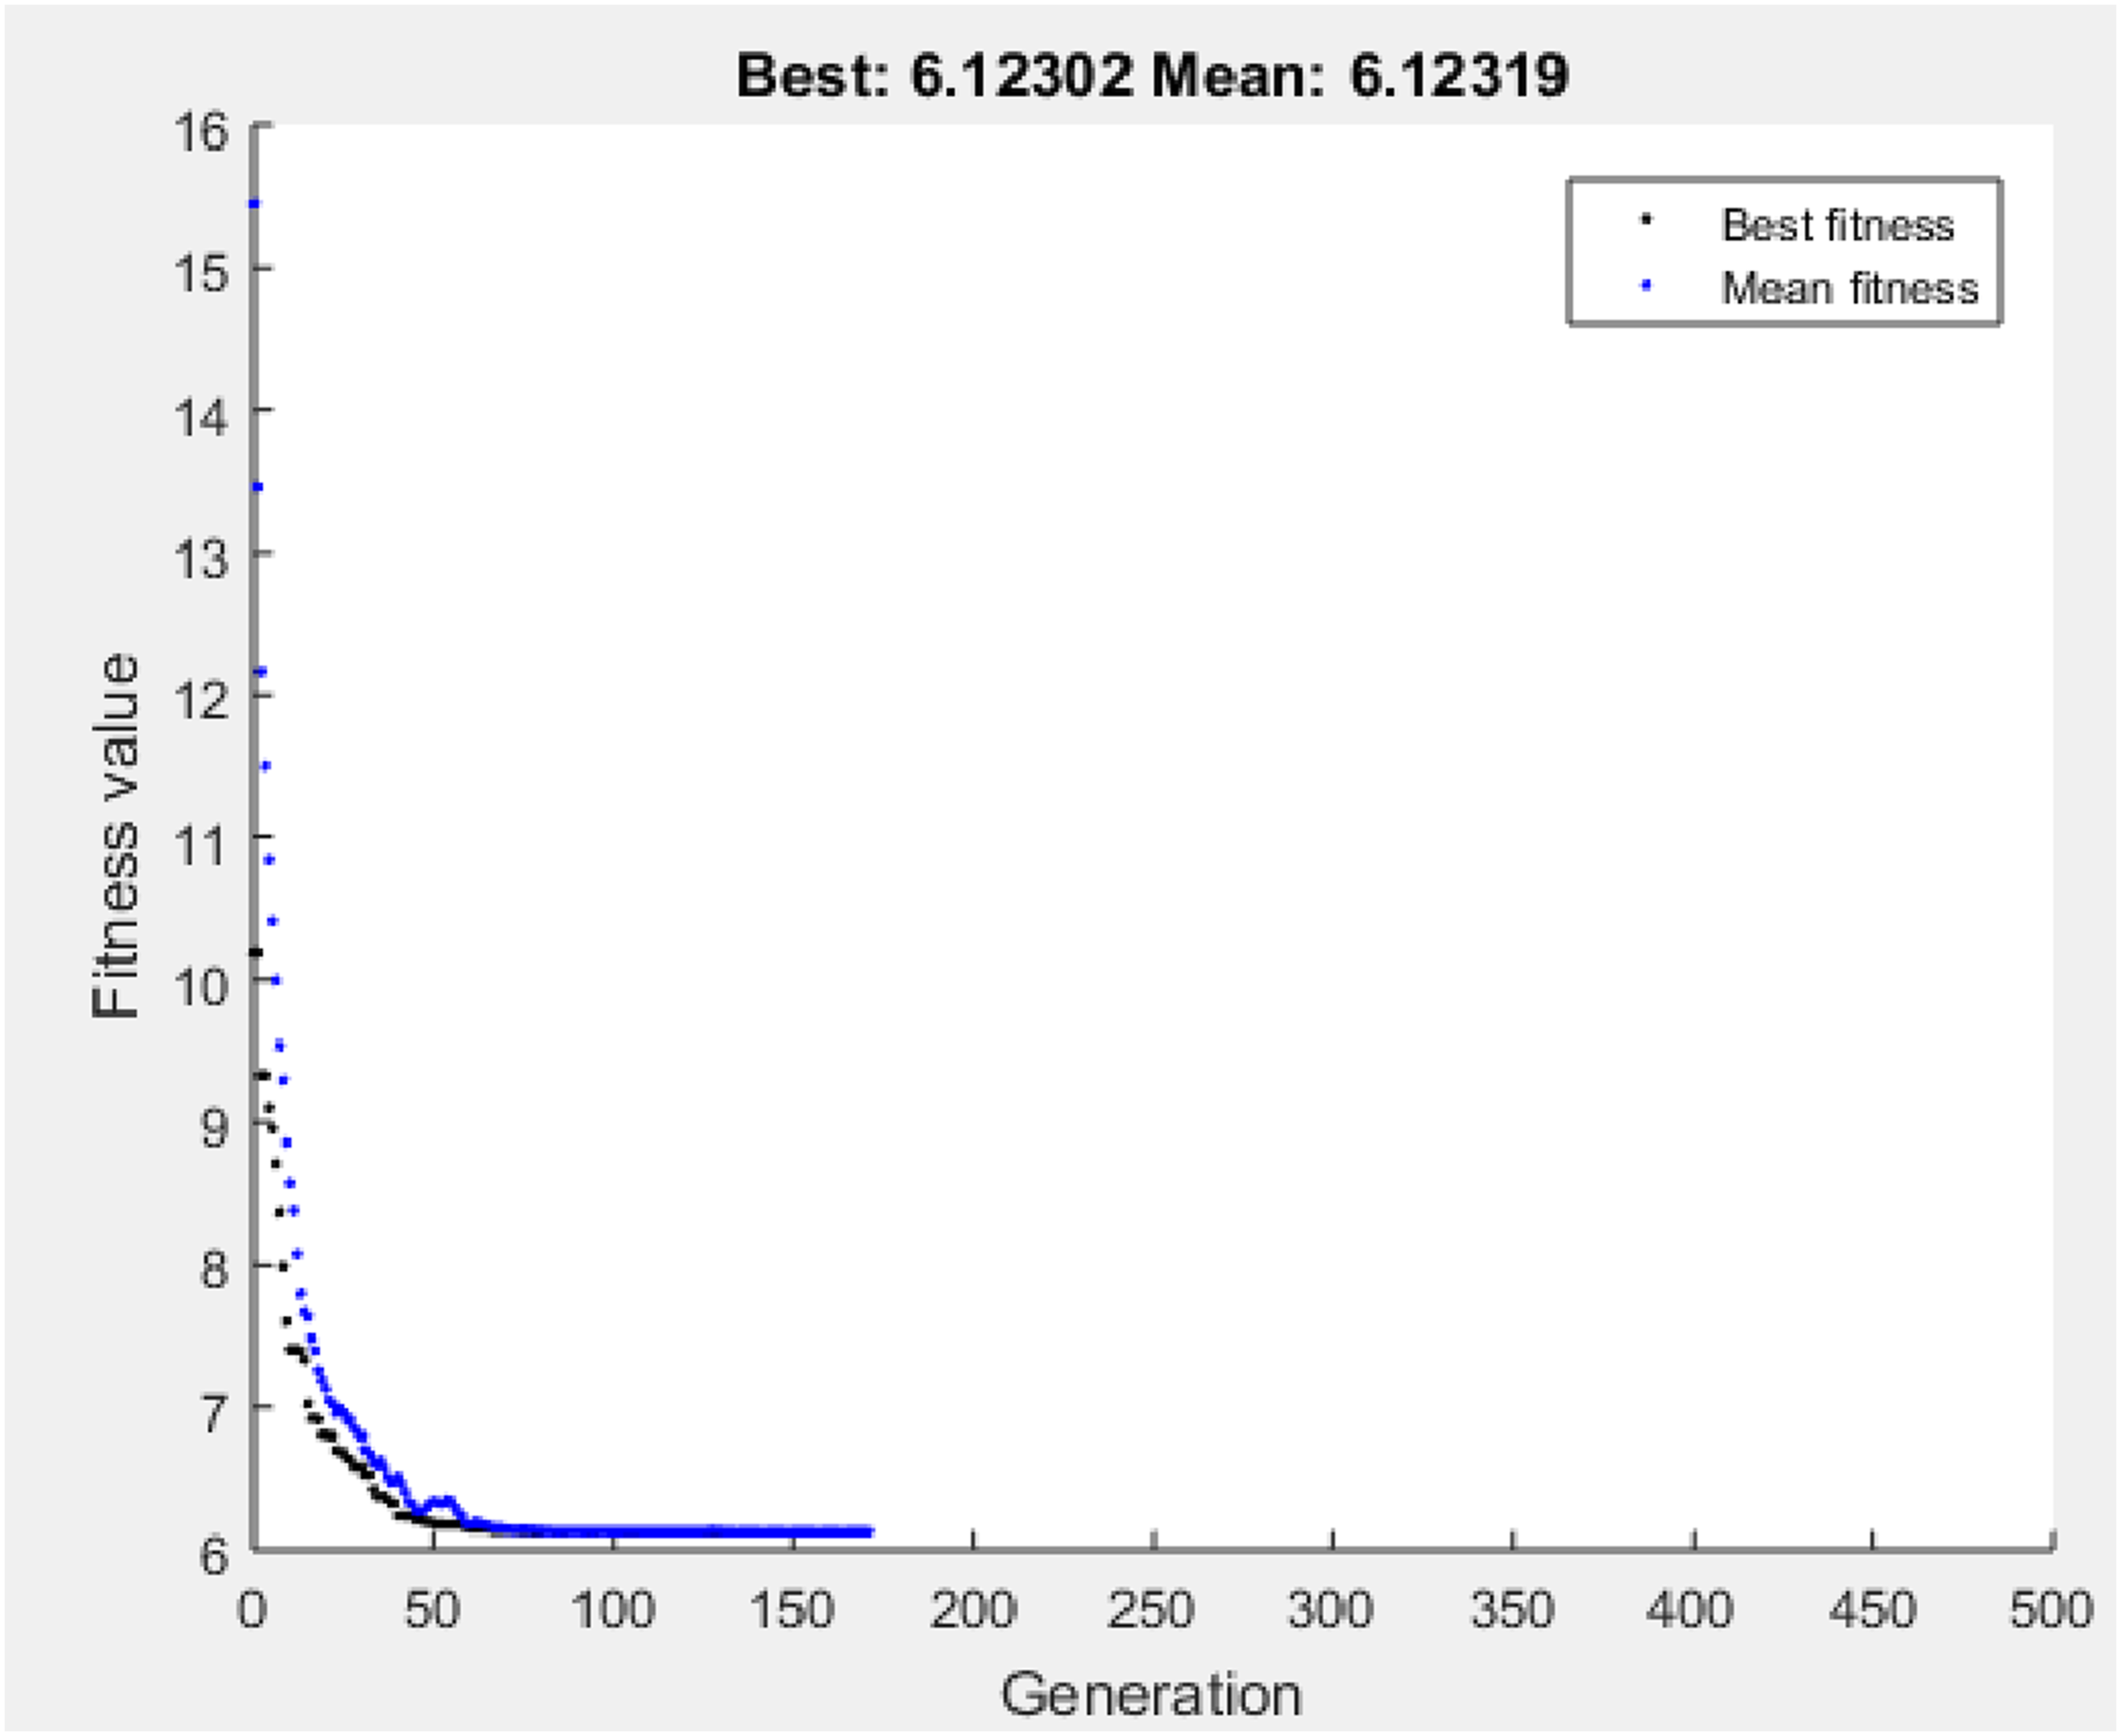
PSO was implemented using MATLAB code. In PSO, the terms swarm size, acceleration factor, minimum and maximum inertia weights play a significant role in the evaluation of the fitness function. In this study, the values of these terms were set as 100, 2, 0.4, and 0.9, respectively.30,18 PSO was run for 100 generations. Figure 10 illustrates the convergence of PSO, revealing that PSO quickly converges to the best solution to this problem. PSO predicts similar design conditions settings (Table 5) as predicted by GA,
32
confirming the optimum solution to the problem. Two validation tests were performed with optimum process conditions values generated by the methods,37,38 using measurements and results provided in Table 5. The chosen process parameters surpass both the melting point, set at 180°C instead of 166°C, and the yield strength, exceeding 80 MPa compared to the minimum requirement of 35 MPa. Convergence of PSO. Optimal design parameters settings and confirmation test result.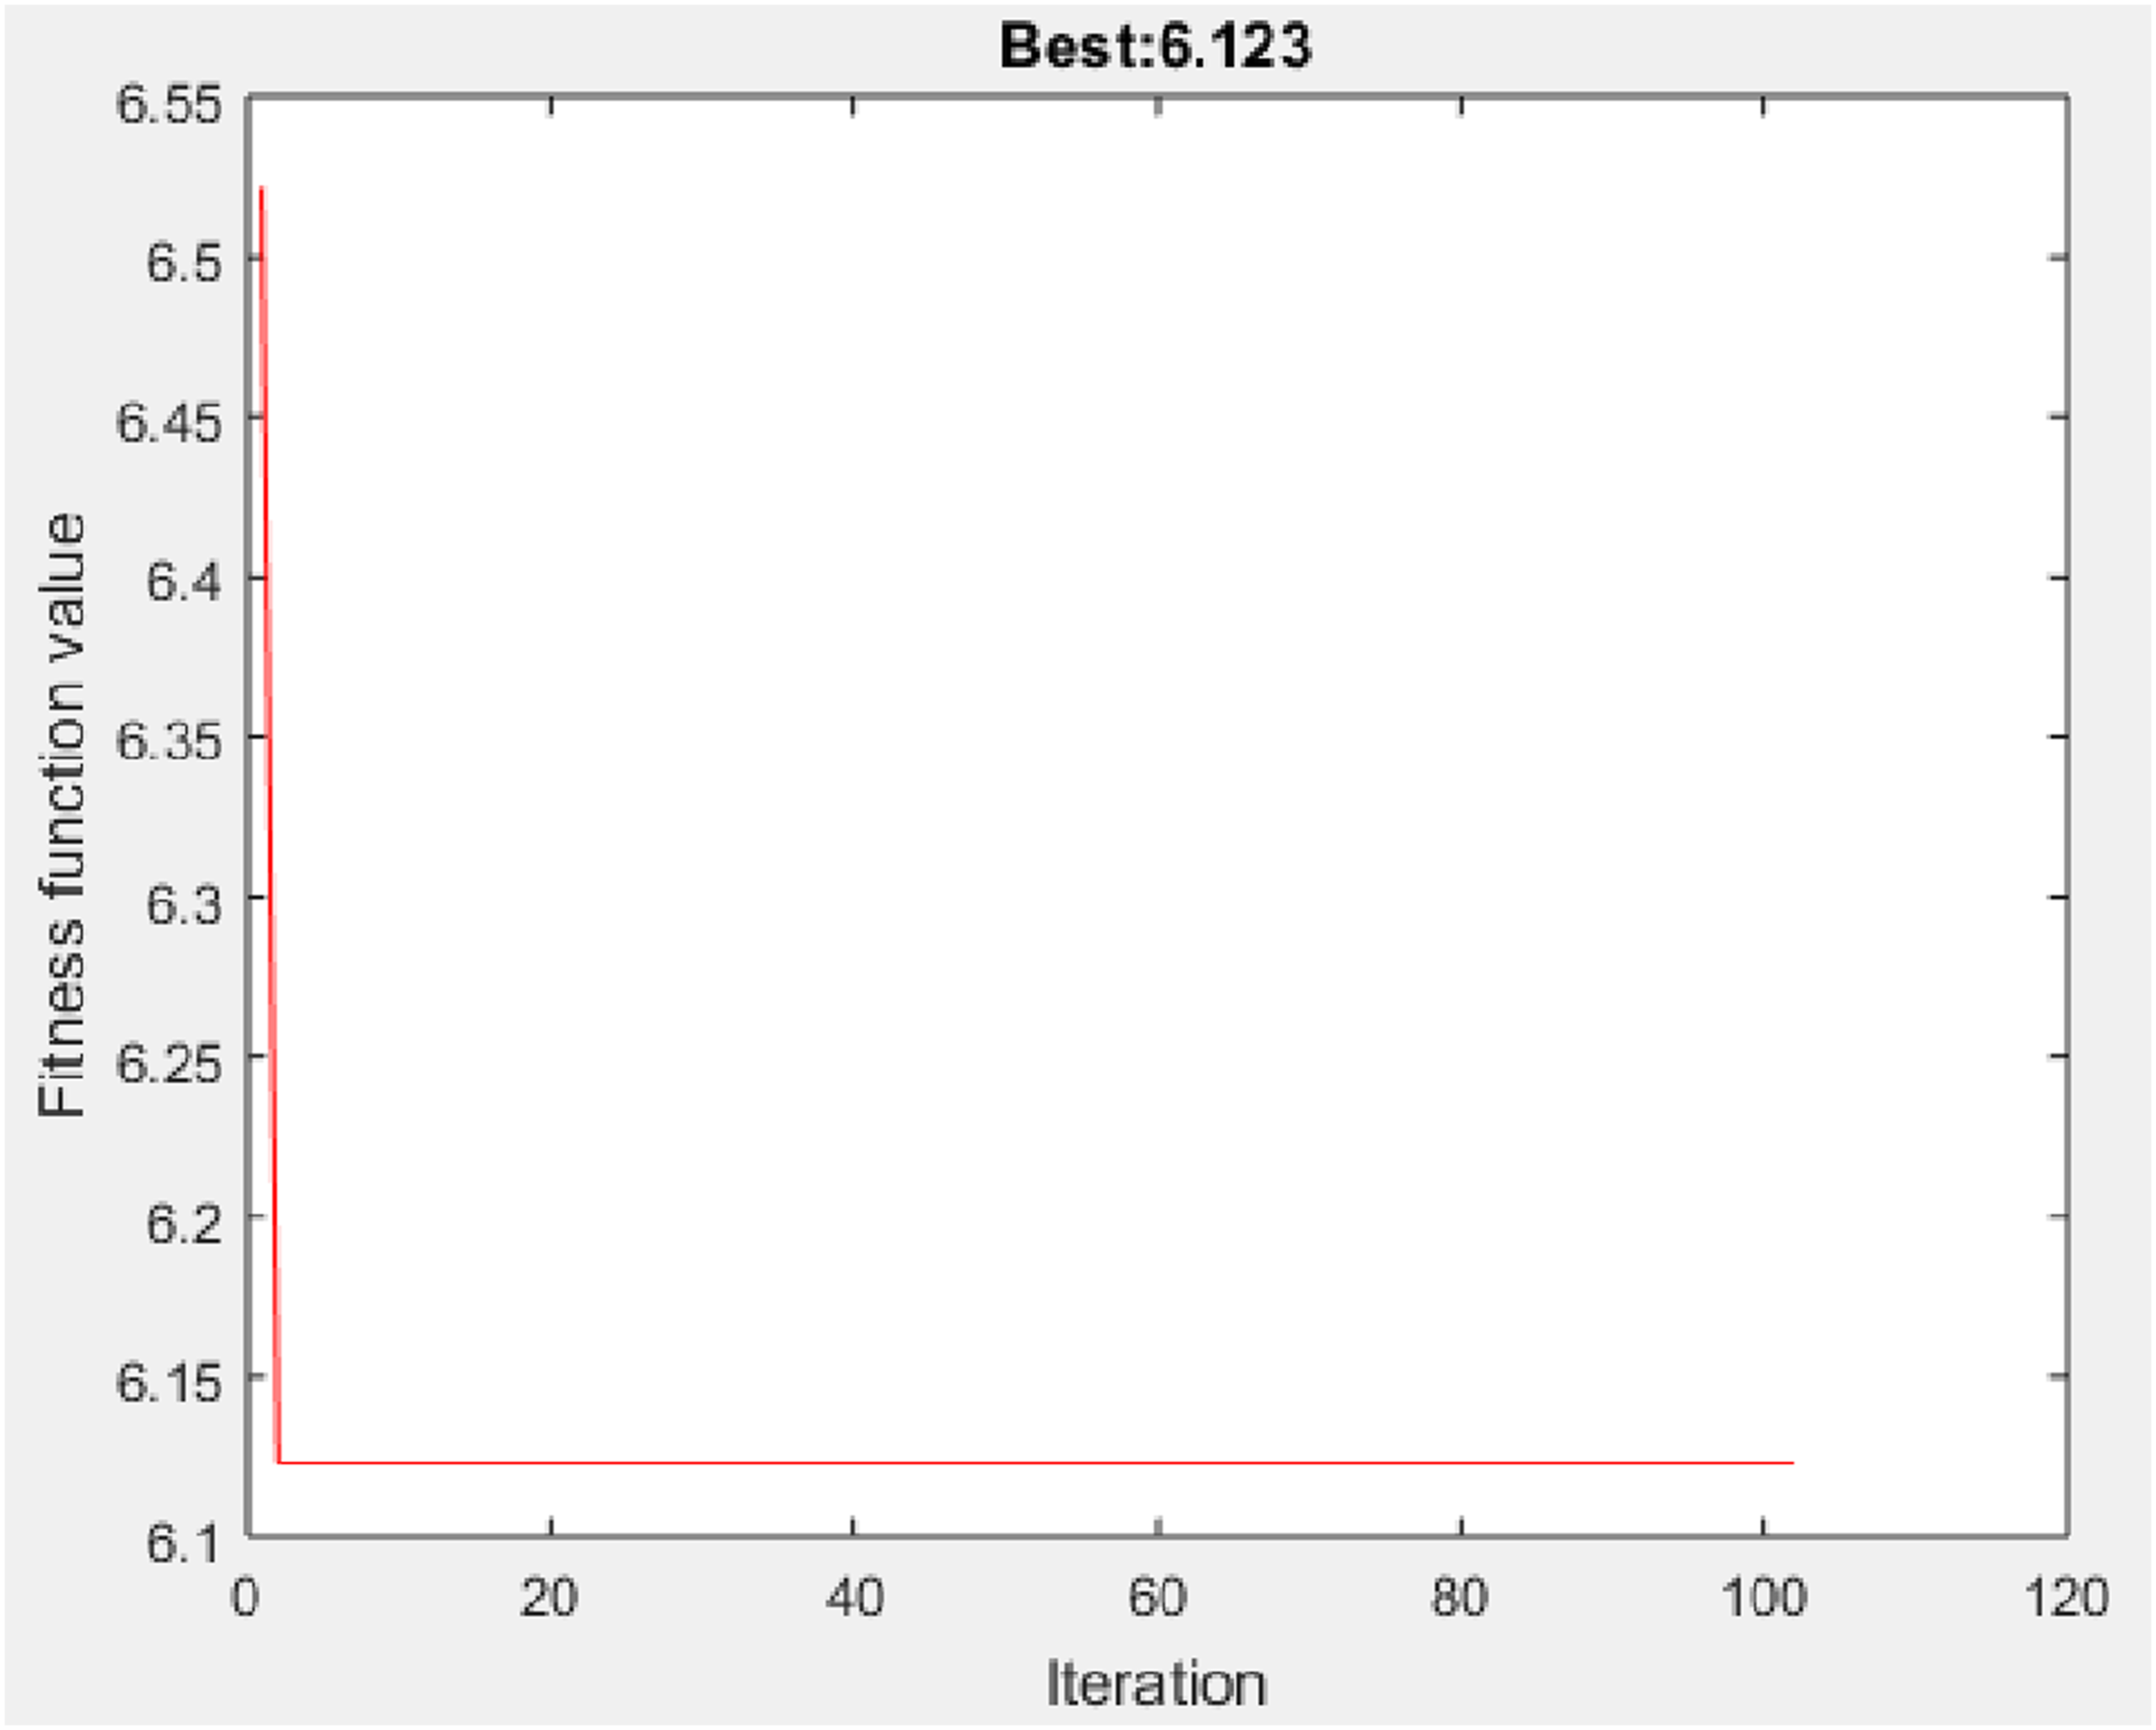
Conclusions
The present work led to following conclusions: • The plastic injection conditions directly influence the presence of weld lines on the polypropylene polymer material, which can be controlled. This was observed through the generation of different weld lines for various combinations of process conditions. Multiple trial experiments with combinations of process conditions enhanced the contribution of each process parameter in the study. • The mold was designed for plastic injection based on a proper runner and gating design suitable for the polypropylene material. Implementing variations in the runner and gating system was difficult; therefore, the process conditions were considered for the study. • The effect of each process condition on the weld lines was studied using response surface plots, and stationary points with a set of process conditions for minimum weld lines were estimated using contour plots • The current experimental model is important and efficiently used to predict the weld lines for combinations of PIM conditions. Melting temperature is the most important parameter among the five parameters. • GA and PSO predicted the weld line width of 6.12302 μm and 6.123 μm respectively. They have shown 18.51% of improvement in results. • The current approach reaches the most important finding that the plastic injection conditions suggested here for the polypropylene parts reduce a critical defect known as the weld lines • These results show that the developed optimization can effectively address plastic product errors encountered in the industry.
Footnotes
Acknowledgements
The authors would like to thank at Kocaeli University. This work was funded by Kocaeli University (KOU-BAP-2011/77).
Declaration of conflicting interests
The author(s) declared no potential conflicts of interest with respect to the research, authorship, and/or publication of this article.
Funding
The author(s) disclosed receipt of the following financial support for the research, authorship, and/or publication of this article: This work was supported by the Kocaeli University (KOU-BAP-2011/77).