
Abstract
A new sustainable and environmentally friendly composite material has been developed from coconut fibre particles and recycled polystyrene dissolved in chloroform. Three particle sizes and four reinforcement ratios were used. The composite was moulded by cold pressing without measuring the pressure but by fixing the thickness. The density (592.53 – 723.03) kg.m-3 shows the lightness of the material. The moisture content (6.63 – 8.35%), water absorption rate (54.06 – 109.42) % and thickness swelling rate (2.86 – 16.09) % are within the acceptable range of ≤16% for use in dry and wet areas, except for formulations with a 55% reinforcement rate. The absorption kinetics of the composites produced show hydrophilicity and correlate with Page’s model. Microscopic examination shows better interfacial cohesion with low visible porosity for composites with the lowest particle content and reinforcement rate. Young’s modulus (129.29 – 530.95) MPa and mechanical stress at break (1.26 – 6.508) MPa are relatively low compared to structural materials. Thermal conductivity (0.22 – 0.347) W.m-1.k-1 and thermal effusivity (571.9 – 856.7) J.m-2.K-1.S-1/2 are within the range of thermally insulating materials. Smaller particles show better cohesion with the matrix. These materials are intended for use in furniture, false ceilings, house partitions, computer stands and telephone booth doors.
Introduction
The increase in the production of materials for industrial sectors (automotive, civil engineering, clothing, insulation, etc.) has been driven by growing demand for raw materials that meet certain requirements, such as good mechanical strength, low thermal conductivity and expansion, and good cost-effectiveness.1,2 The development of these materials with varying characteristics generates enormous problems related to long production times, excessive energy consumption, greenhouse gas emissions, etc., due to the nature of the inputs, which are in most cases of synthetic origin3–5 Several researchers in the industrial sector claim that the civil engineering industry, particularly construction, is responsible for 40% of energy consumption, 12% of water consumption and 40% of greenhouse gas emissions.4–7 With technological advances, there is a demand for materials with a combination of properties that traditional materials such as alloys, ceramics and polymers cannot fully satisfy on their own. Consequently, researchers’ attention has turned to composite materials, which offer combinations of improved properties and result in significant physical, mechanical, thermal and chemical qualities.2,8,9 In the production process of composite materials, several parameters can interact with the performance of the material (the type of moulding, the homogenisation speed, the particle size, the temperature, the reinforcement or matrix content, the nature of the matrix, etc.).10–12 These different parameters give the materials various characteristics that can be used in industry. Several materials have been developed from wood residues, fibres, shells, etc. As reinforcement with thermosetting polymers (epoxy, polyester, urea formaldehyde, etc.) and thermoplastics (polyethylene terephthalate, polystyrene, polypropylene, etc.) applicable in various industrial sectors within the framework of sustainable development.1,4,13,14
Polystyrene is a synthetic aromatic polymer made from styrene monomer using a polymerisation process that can be in rigid or expanded form. 15 Its production generates approximately 322 million metric tonnes (Mt) per year. 16 The development of polystyrene to promote a circular economy has prompted several researchers to develop recycling techniques. Researchers such as Geyer and al., 16 Hopewell, 17 and Maharana and al. 18 have shown that polystyrene can be recycled using various techniques, including mechanical, chemical, and quaternary recycling. According to Hopewell, 17 Kajiwara and al., 19 quaternary recycling releases hazardous substances (greenhouse gases) into the atmosphere and poses a threat to the environment. According to Maharana and al., 18 chemical recycling by dissolution is more advantageous than mechanical recycling, although it provides good cohesion with reinforcements but consumes a lot of energy. Belblidia and al. 20 reported in their work on ensuring a circular economy that PSE can be recycled in a loop using an injection process without altering its chemical structure or mechanical properties. In addition, it is reported that polystyrene, like other plastics, is non-degradable. These applications can be used in thermal insulation, packaging, healthcare, construction, etc., like other thermoplastics (polyvinyl chloride (PVC)). 21 Several authors have shown that the nature of the solvent used in the dissolution recycling process does not alter the chemical structure of the solution obtained and that the latter can be used as a matrix.22,23 Sourbh Thakur and al. 24 have shown in their work that, in addition to mechanical and chemical recycling, recycling by landfill and incineration is also possible. However, recycling through landfill causes major environmental problems such as groundwater contamination and marine pollution due to the non-degradable nature of polystyrene. Recycling by incineration produces harmful gases by releasing carbon dioxide. Chemical recycling converts polystyrene waste into oil, polymer and hydrocarbon using appropriate solvents without destroying the styrene polymer chain. The results obtained corroborate those of Garcia and al., 25 and Cella and al., 22 Polleto and al., 26 Masri and al., 14 and Amadji and al., 27 have demonstrated the effectiveness of recycled polystyrene in developing industrial composites for furniture and thermal insulation in buildings using wood and palm waste, thereby promoting sustainable development and ensuring a circular economy. The incorporation of plant-based fillers or reinforcements into the polystyrene matrix increases its porosity and water absorption, given the hydrophobic nature of the matrix.22,28
Coconuts are grown in 87 countries around the world, covering 11.8 million hectares, making them the sixth most cultivated fruit. 29 Production is estimated at 63 million tonnes per year29,30 and locally in Cameroon at 7 million tonnes per year. 31 Approximately 73% of the world’s coconut production area is concentrated in the Philippines (31%), Indonesia (24%) and India (18%). Jamaica and Ghana occupy a marginal position in global coconut production (0.2% and 0.6% respectively).30,31 The coconut trade mainly involves processed products. Coconuts are a source of fibre and manganese and are mainly grown in tropical areas. Coconuts are mainly composed of 35% husk, 12% shell, 28% kernel and 25% water. 32 Current research is being conducted on coconut biomass to extract acids and agricultural substrates and to develop composites.30,33,34 The work of Ekpenyong 35 has shown that coconut shells and husks can be used to develop thermally insulating composites. Bhaskar and al. 36 showed that adding coconut particles as reinforcement in an epoxy composite leads to increased water absorption and decreased mechanical properties. Agunsoye et al., 37 show that the hardness of the composite based on coconut shell particles and low-density polyethylene matrix increases with increasing coconut shell content, although the tensile strength, modulus of elasticity, impact strength and ductility of the composite decrease. Bujang and al. 38 experimented with coconut fibre-reinforced composites and their results showed dynamic characteristics in mechanical properties such as tensile modulus changing with fibre content. Singh and al. 39 showed that epoxy composite materials based on coconut shell powder (CSP) with different particle sizes exhibited better tensile properties, flexural strength and water absorption. Bouwa and al. 29 showed that coconut and palm shell particles as reinforcement in a polyester matrix can produce ceilings. The work of Sriprom and al. 40 demonstrated good interfacial cohesion between coconut fibres treated with 5% NaOH and a resin dissolved in acetone. Salinas and al. 41 reported that a material made from treated coconut fibre and expanded polystyrene PSE could be feasible and beneficial for the industrial sector. Obianuju 42 reported in his work an improvement in mechanical properties and interfacial cohesion for low load proportions between coconut shells and an PSE matrix. According to Sutakhote and al. 43 polystyrene can be dissolved in p-cymene and used as a binder to produce coconut fibre-reinforced composites. They found an increase in absorption rate and a decrease in mechanical properties with increasing fibre content. Pusri and al. 44 reported that coconut and polystyrene fibres can be used effectively to reinforce cementitious matrices. Adding fibre improves the mechanical performance of the briquettes produced, while adding polystyrene reduces this performance. Overall, composite materials for sustainable development are increasingly being studied with coconut by-products, making it an alternative material for sustainable development. Based on current knowledge, although polystyrene has been used as a binder and coconut by-products as reinforcement in various studies, a composite of dissolved polystyrene as a binder reinforced with coconut shell particles will be a novelty for sustainable development. A study on microscopic visualisation is also planned, as is a study on the composite’s sensitivity to water using absorption kinetics incorporating Fick’s equations, a classification of the composite by density, combined with thermal and mechanical tests that will provide technological data on the material produced. This could provide a scientifically important database on the industrial functionality of the composites produced.
Materials and methods
Coconut waste was collected in the town of Edea, in the Littoral region of Cameroon, then transported to the laboratory and dried in the sun for seven days to reduce its water content (Figure 1(a)). The fibre-rich fluff was crushed and sieved using a set of three sieves to separate the different sizes. [t – 0.35 [mm; [0.35 – 0.63 [mm and [0.63 – 1 [mm (Figure 1(b)). The particle sizes were chosen based on the work of Masri and al.
14
and Takoumbe and al.,
4
which define the size of particle composites in the range of 0.063–1 mm, and based on the range of sieves available in the laboratory. (a) Coconut fibre stuffing; (b) Different particles of fluff.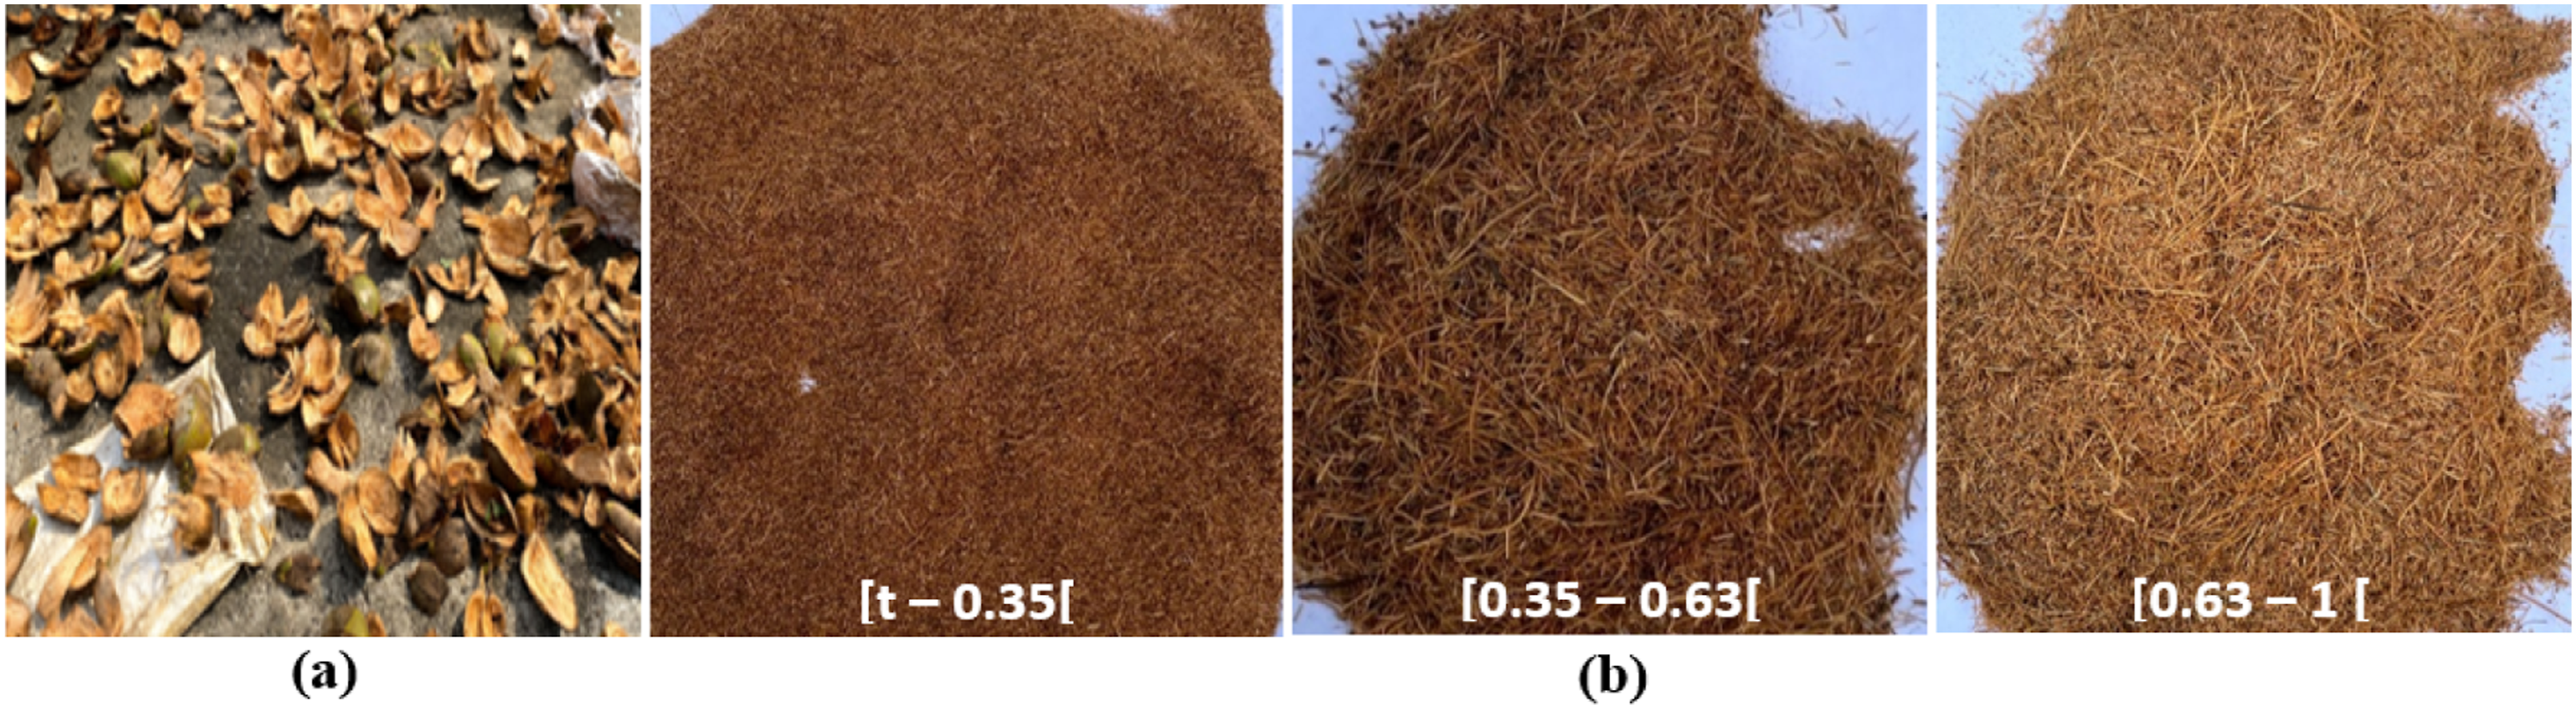
The polystyrene was collected from the streets of Douala, Cameroon, in the form of waste, then washed to remove impurities (Figure 2(a)). Polystyrene fragments were placed in a solvent (chloroform) to dissolve them (Figure 2(b)) and used as a binder. This solvent has been used by other authors, notably in the work of Garcia and al.,
23
For recycling polystyrene by dissolution as a binder. The mass of polystyrene contained in the resin is 30% of the mass of the solvent calculated from equation (1).
14
In this equation, k is the quantity of polystyrene, Ms represents the mass of the solvent and MPs represents the mass of the polystyrene. The matrix obtained is shown in Figure 2(c). (a) Washing the polystyrene; (b) Dissolving the polystyrene; (c) Polystyrene resin.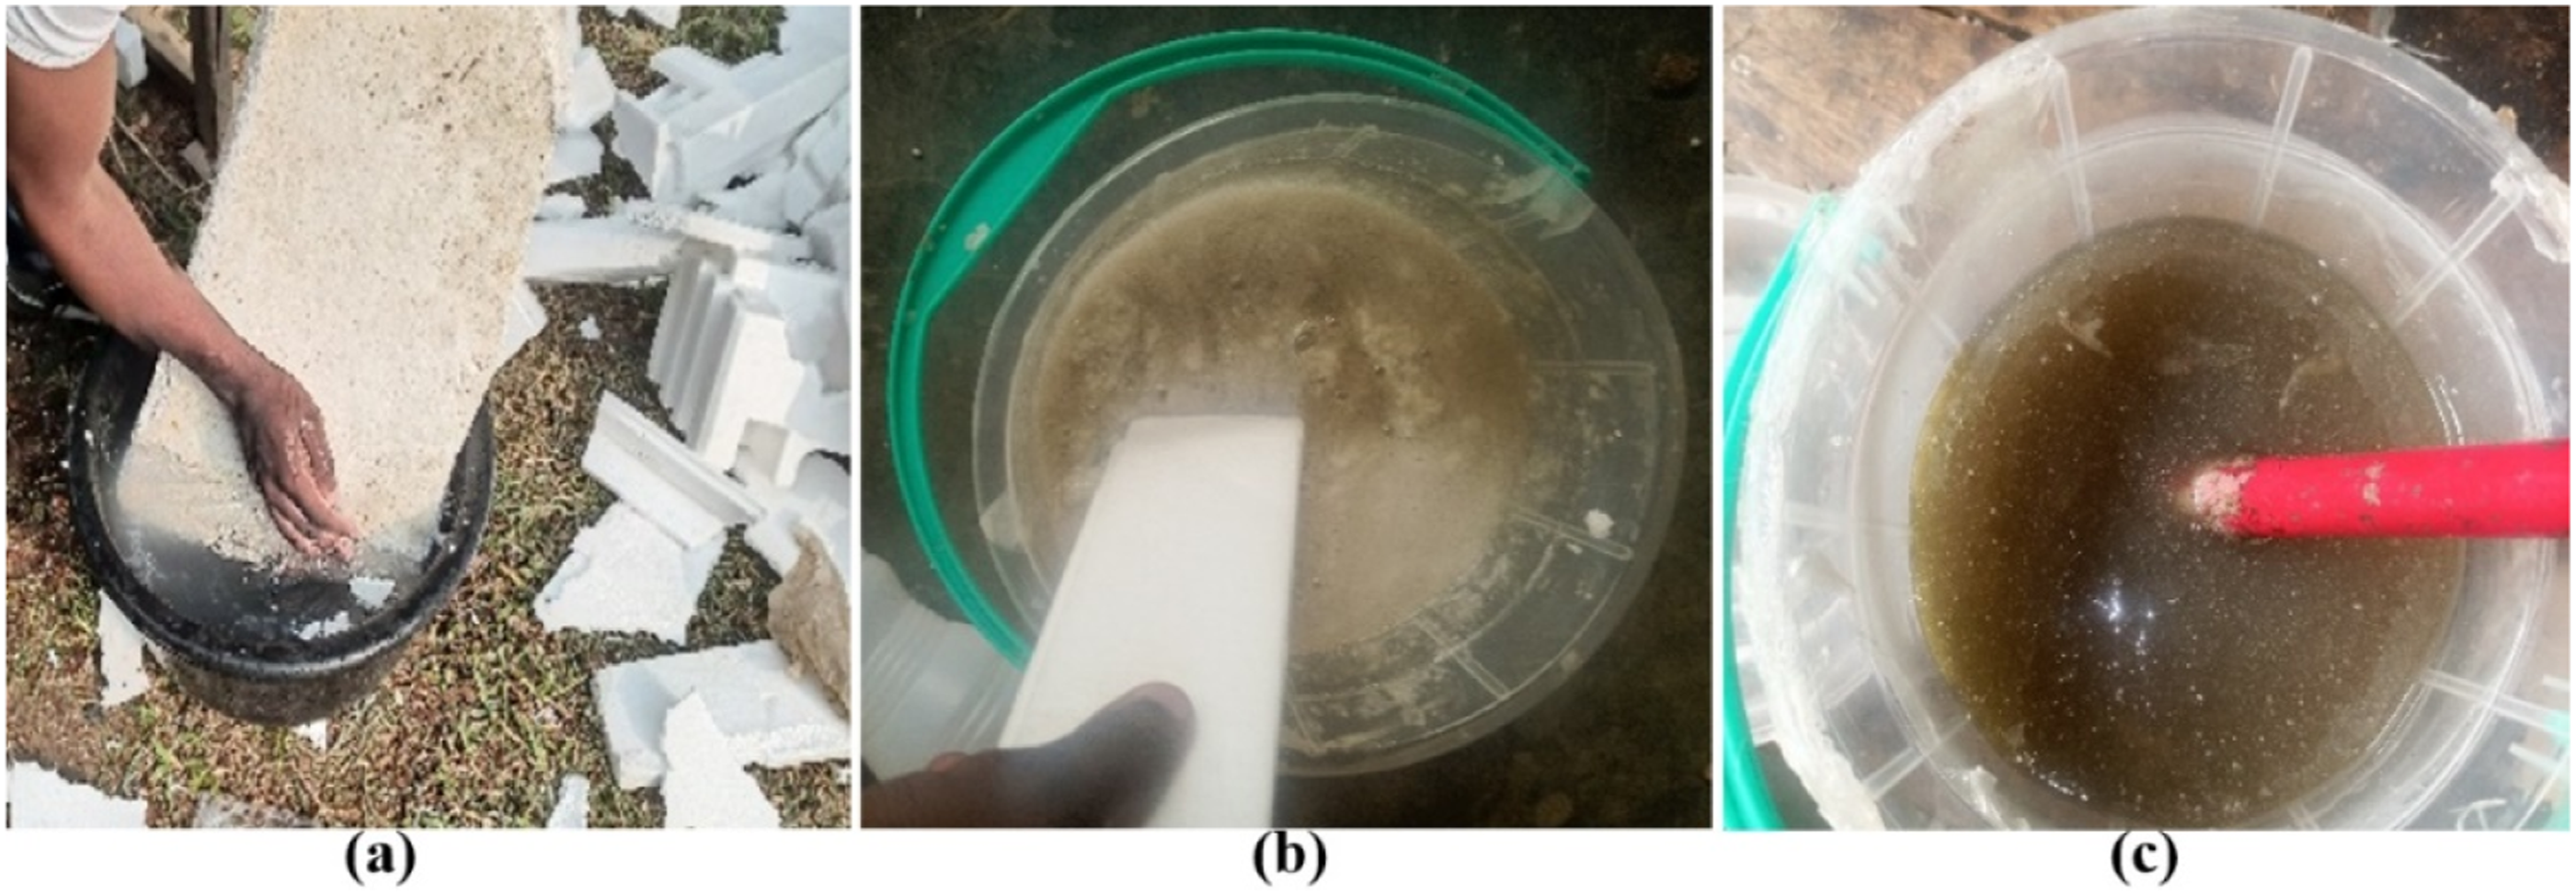


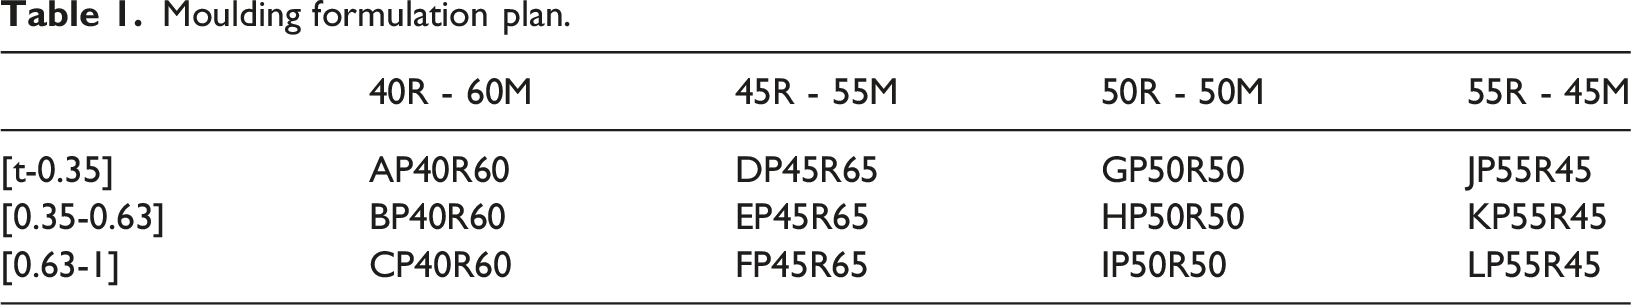
Moulding formulation plan.
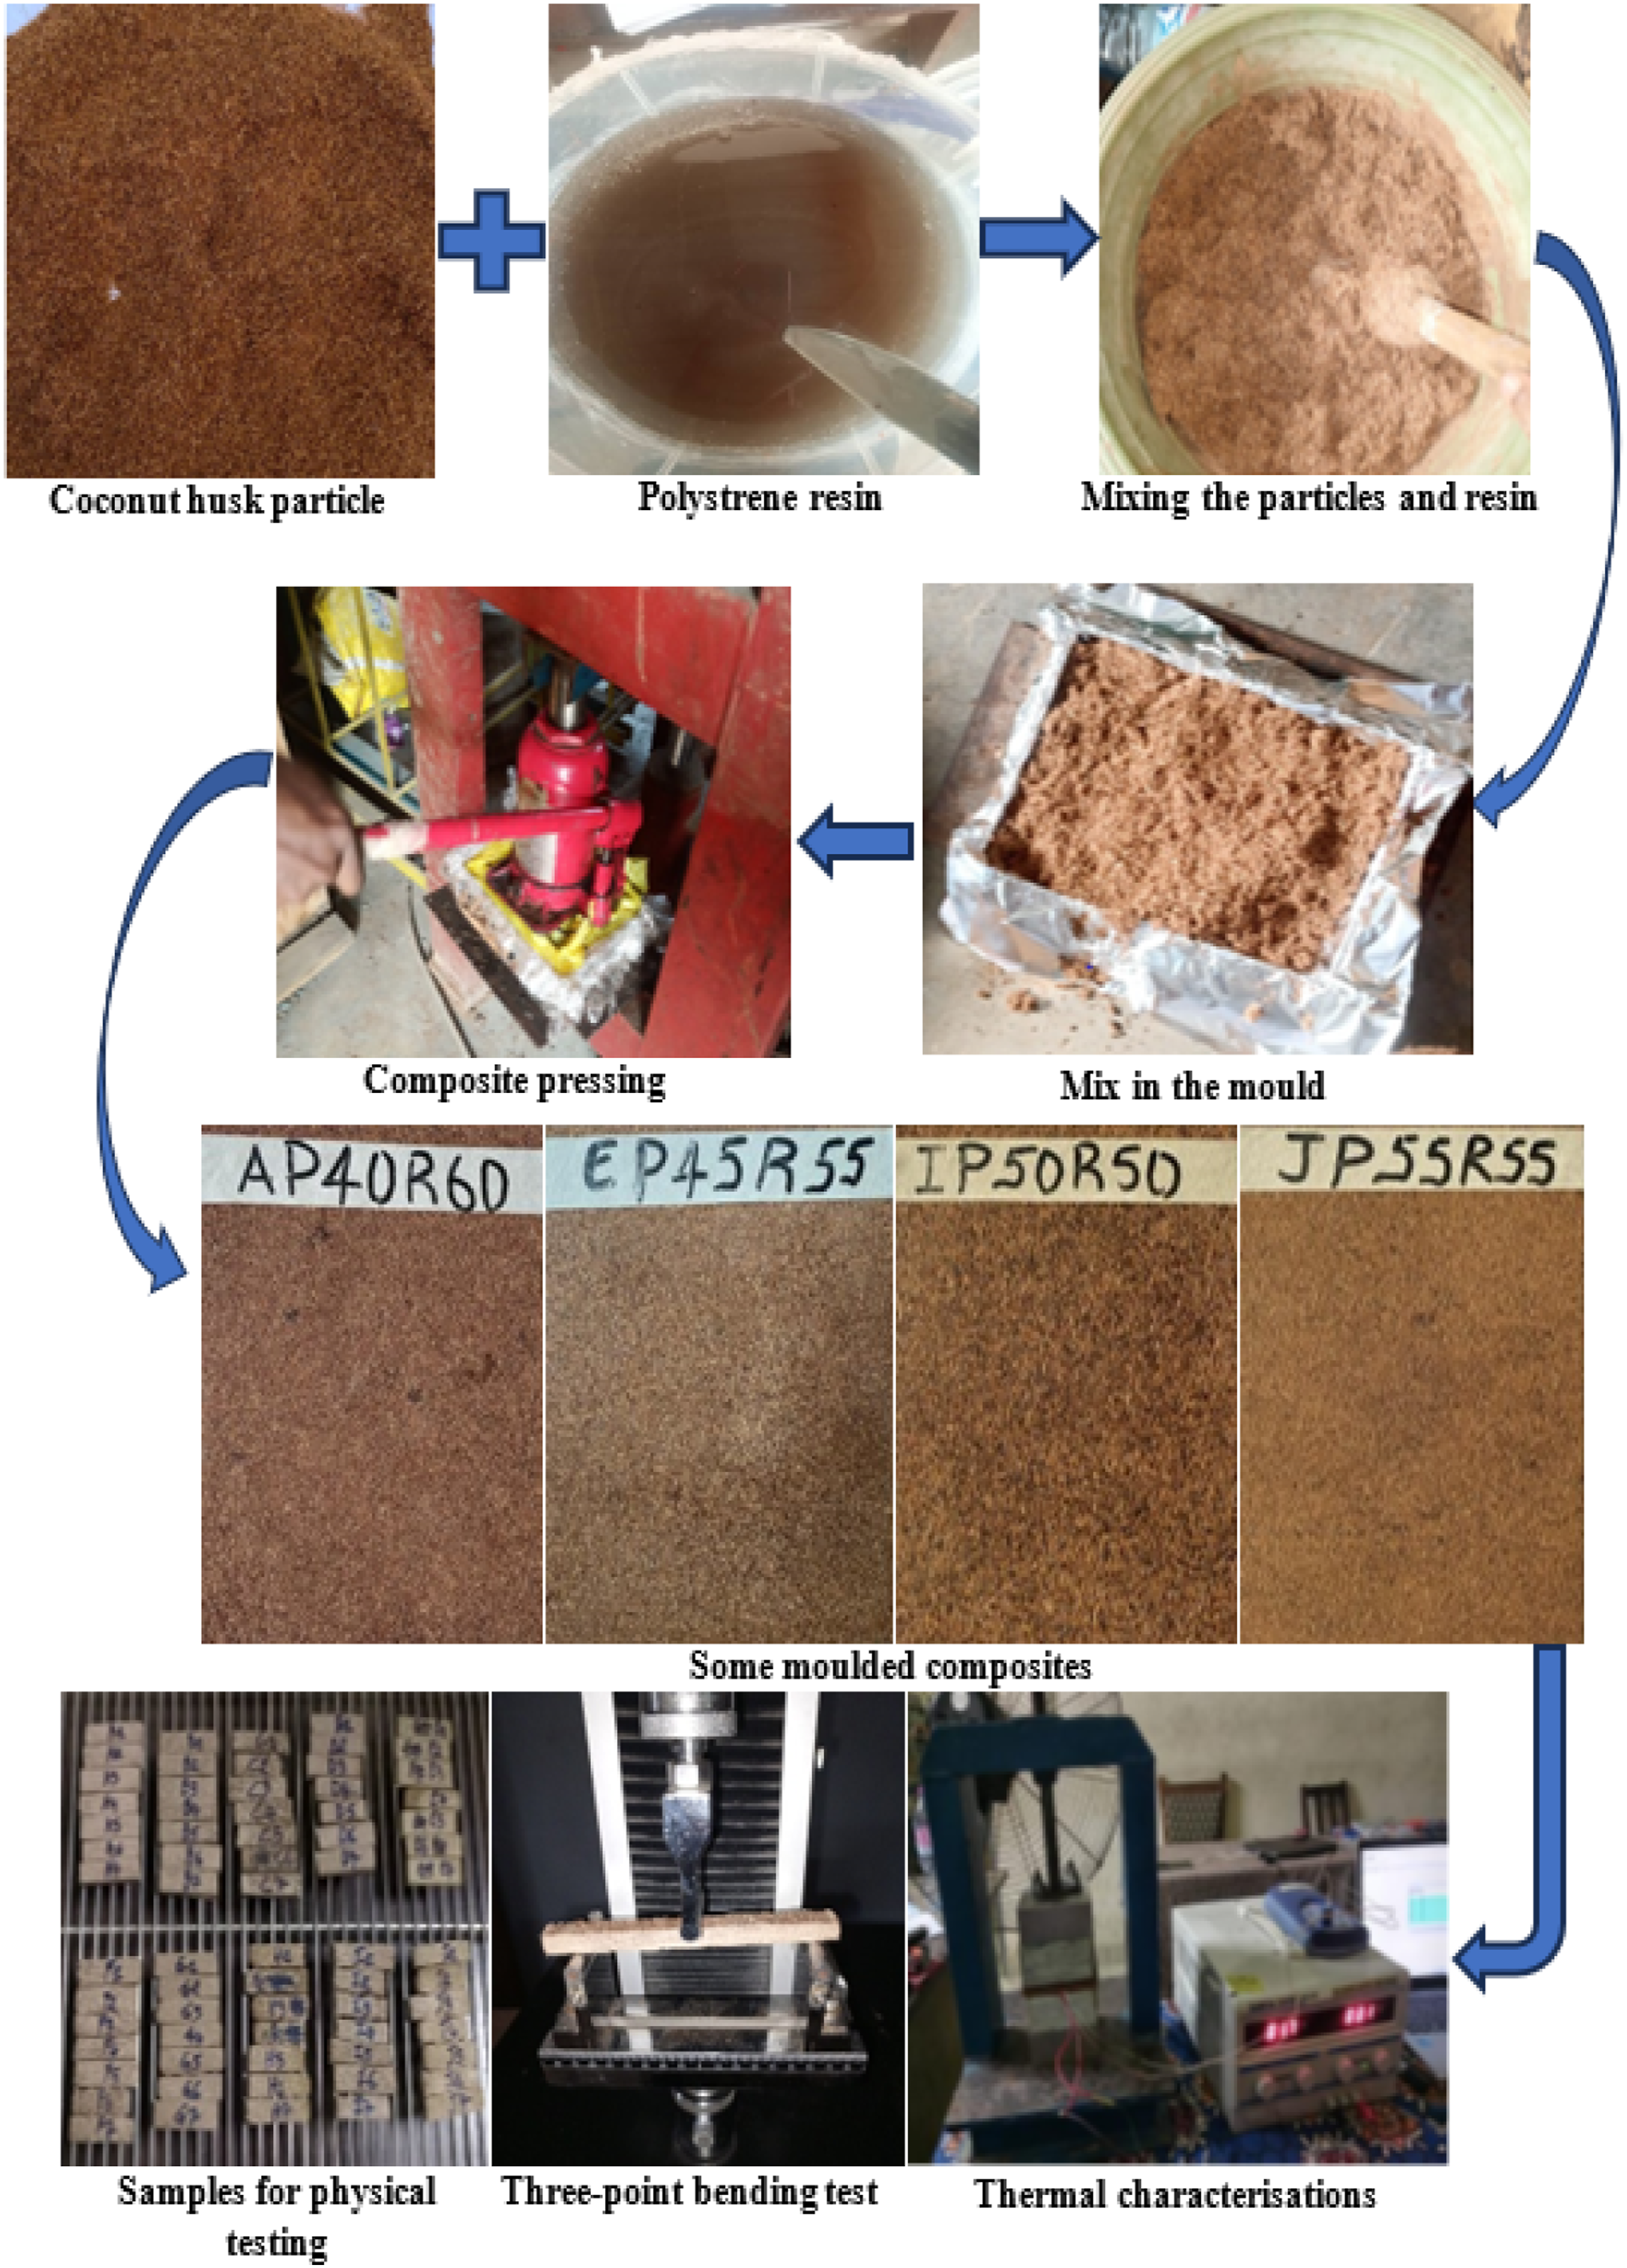
Moulding process and samples from the various tests.
Determination of Moisture content and density
Samples measuring 60*15*5 ± 1 mm were taken from plates measuring 200*150*10 ± 1 mm. Seven (07) samples were used per formulation, for a total of 84 samples. The samples were dried at 70°C for 5 h in a Mermmet ventilated oven.
14
This temperature was chosen to be below the glass transition temperature of polystyrene.
22
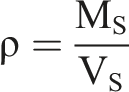
The wet and dry dimensions were measured with a micrometer and the wet (MH) and dry (MS) masses were measured with an electronic balance accurate to one hundredth of a gram. The technique used in this test is gravimetric. The moisture content (W) is obtained using equation (1) and the density (ρ) using equation (2).1,4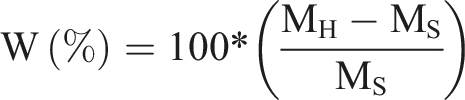
Water absorption study


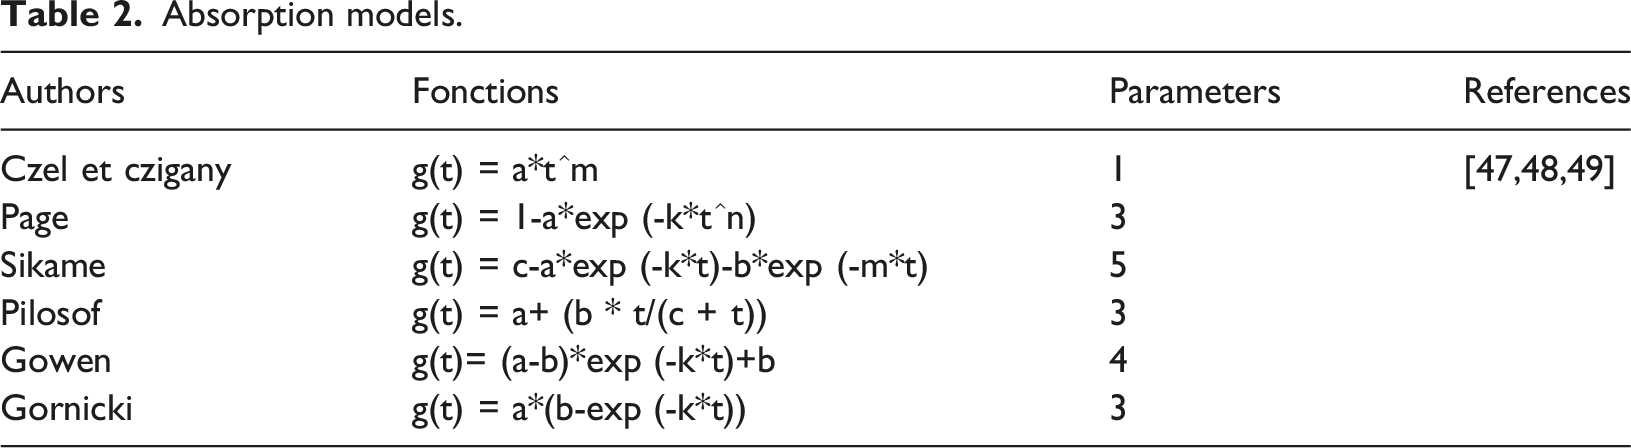
Absorption models.
A visualisation of the surface states of the composites produced was carried out using a laboratory microscope in order to better understand the interfacial mechanism between the fibres and particles. Although visualisation using a scanning electron microscope (SEM) would be more appropriate. The decision to use this microscope rather than SEM was due to logistical constraints. This approach to visualising surface states in order to explain interfacial cohesion has already been used on other composites. 5
Mechanical characterisation by three-point bending test
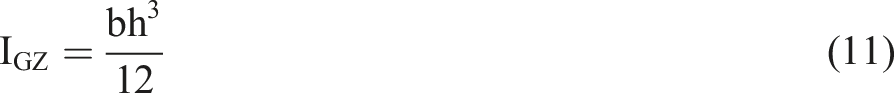
The three-point bending test was performed in accordance with ASTM D790 - 3 on samples measuring 150 × 15 × 10 mm. Seven (07) samples per formulation, representing a total of eighty-four (84) samples, were tested. A load of 5 kN is applied to each sample at a speed of 5 mm/min. During the test, curves describing the test progression are plotted and the data is automatically recorded and used to calculate the modulus and stress at break. The flexural parameters, in particular Young’s modulus, were calculated using equation (8), and the stress at break using equation (9).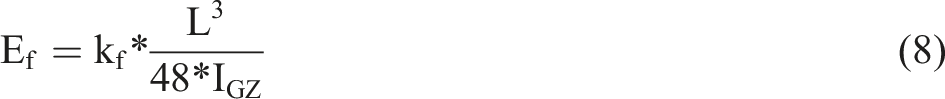


Determination of thermal characteristics
The asymmetric hot plate method is used to determine the thermal characteristics of the material. The 100*100*10 mm sample is placed in contact with a heating film to which a type K temperature sensor is attached. The assembly is then inserted between two 100*100*10 mm polystyrene blocks. The temperature is kept constant above the polystyrene blocks by means of two 100*100*10 mm aluminium blocks placed below and above the polystyrene blocks and held tight by the frame. A heat flow was sent to the heating element (MINCO HK 5178) via a stabilised power supply at a voltage of 3 V corresponding to an amperage of 1.7 A. The temperature rise at the centre of the heating element is measured by a type K thermocouple attached to one side of the element. This approach to determining thermal characteristics (thermal conductivity and thermal effusivity) has been observed in the literature.1,5
A multi-factor ANOVA was conducted on twelve composite formulations, each evaluated with seven replicates, in order to examine the influence of particle size and reinforcement rate on six properties: flexural modulus, flexural stress, water absorption rate, water swelling rate, water content and bulk density. The analysis was performed using SPSS software (general linear model followed by multivariate), with a significance threshold of 5%. The conditions for applying ANOVA were verified using Levene’s test for homogeneity of variance. In the event of a significant effect, a Tukey HSD post-hoc test was used to identify significant differences between particle size levels and reinforcement rates on the properties of the composites.
Results and discussions
Drying of composites
Moisture content
The moisture content ranges from 6.63 to 8.35% and is suitable for use in wet areas. Low moisture content (< 15%) remains effective in reducing the risk of delamination and cracking due to stress with thermoplastic and thermosetting polymers during use.4,13 However, the distribution curve shows that the moisture content (Figure 4) increases with the reinforcement rate. This is due to the hydrophilic nature of coconut husk. Similarities have been observed in other composites.4,13 Smaller particles have lower moisture contents, which can be explained by the fact that the channels that can contain water are destroyed during grinding. However, the results obtained are comparable to those of Takoumbe and al.
4
(5.37–11.65%), Kaoutoing and al.
13
(7–15%), and Betené and al.
50
(5–12%). Moisture content by volume.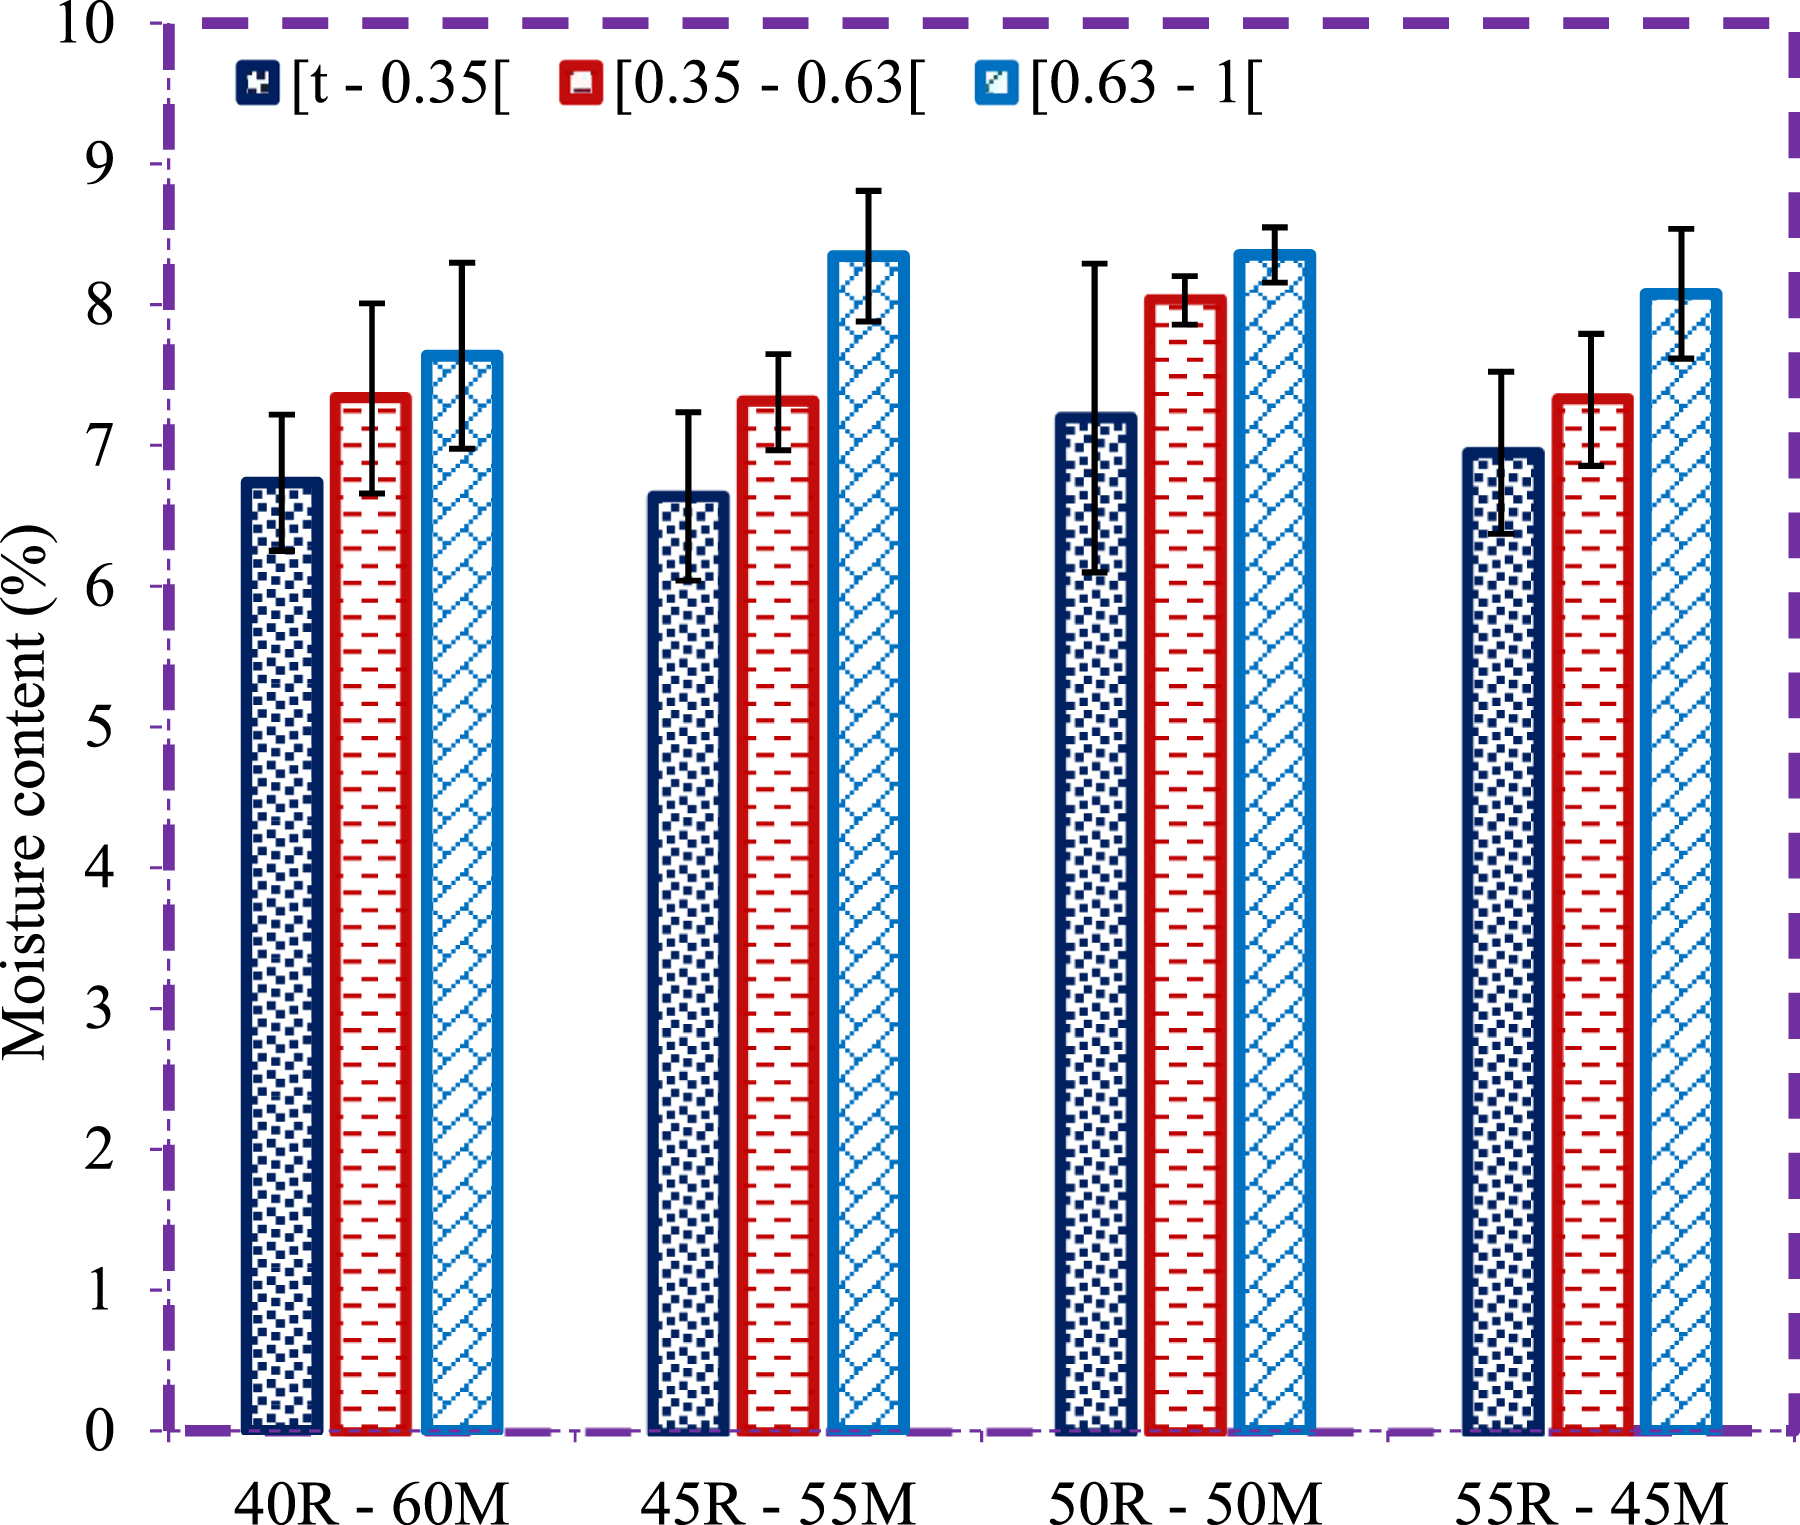
Density
The density of the composite material ranges from 592.53 ± 28 kg.m-3 to 723.03 ± 57 kg.m-3, classifying it as a medium-density composite (450 ≤ ρ ≤ 800). They can be used to develop furniture, partitions or as home insulation material. The results (Figure 5) show that the density of the composite decreases as the particle size increases. This shows that large particles are lighter, more porous and take up less space in the mould. These results are consistent with the moisture content. The effect of the reinforcement rate shows non-linear dispersions as it increases. This is associated with the moulding technique, which can generate risks of unmeasured pressure variations during the production of these composites. This can be presented as one of the limitations of this technique. Overall, the density of the composites produced is comparable to other composites4,27,50 and tropical woods identified in the literature. This makes these composites a substitute material for tropical woods.49,51 Density.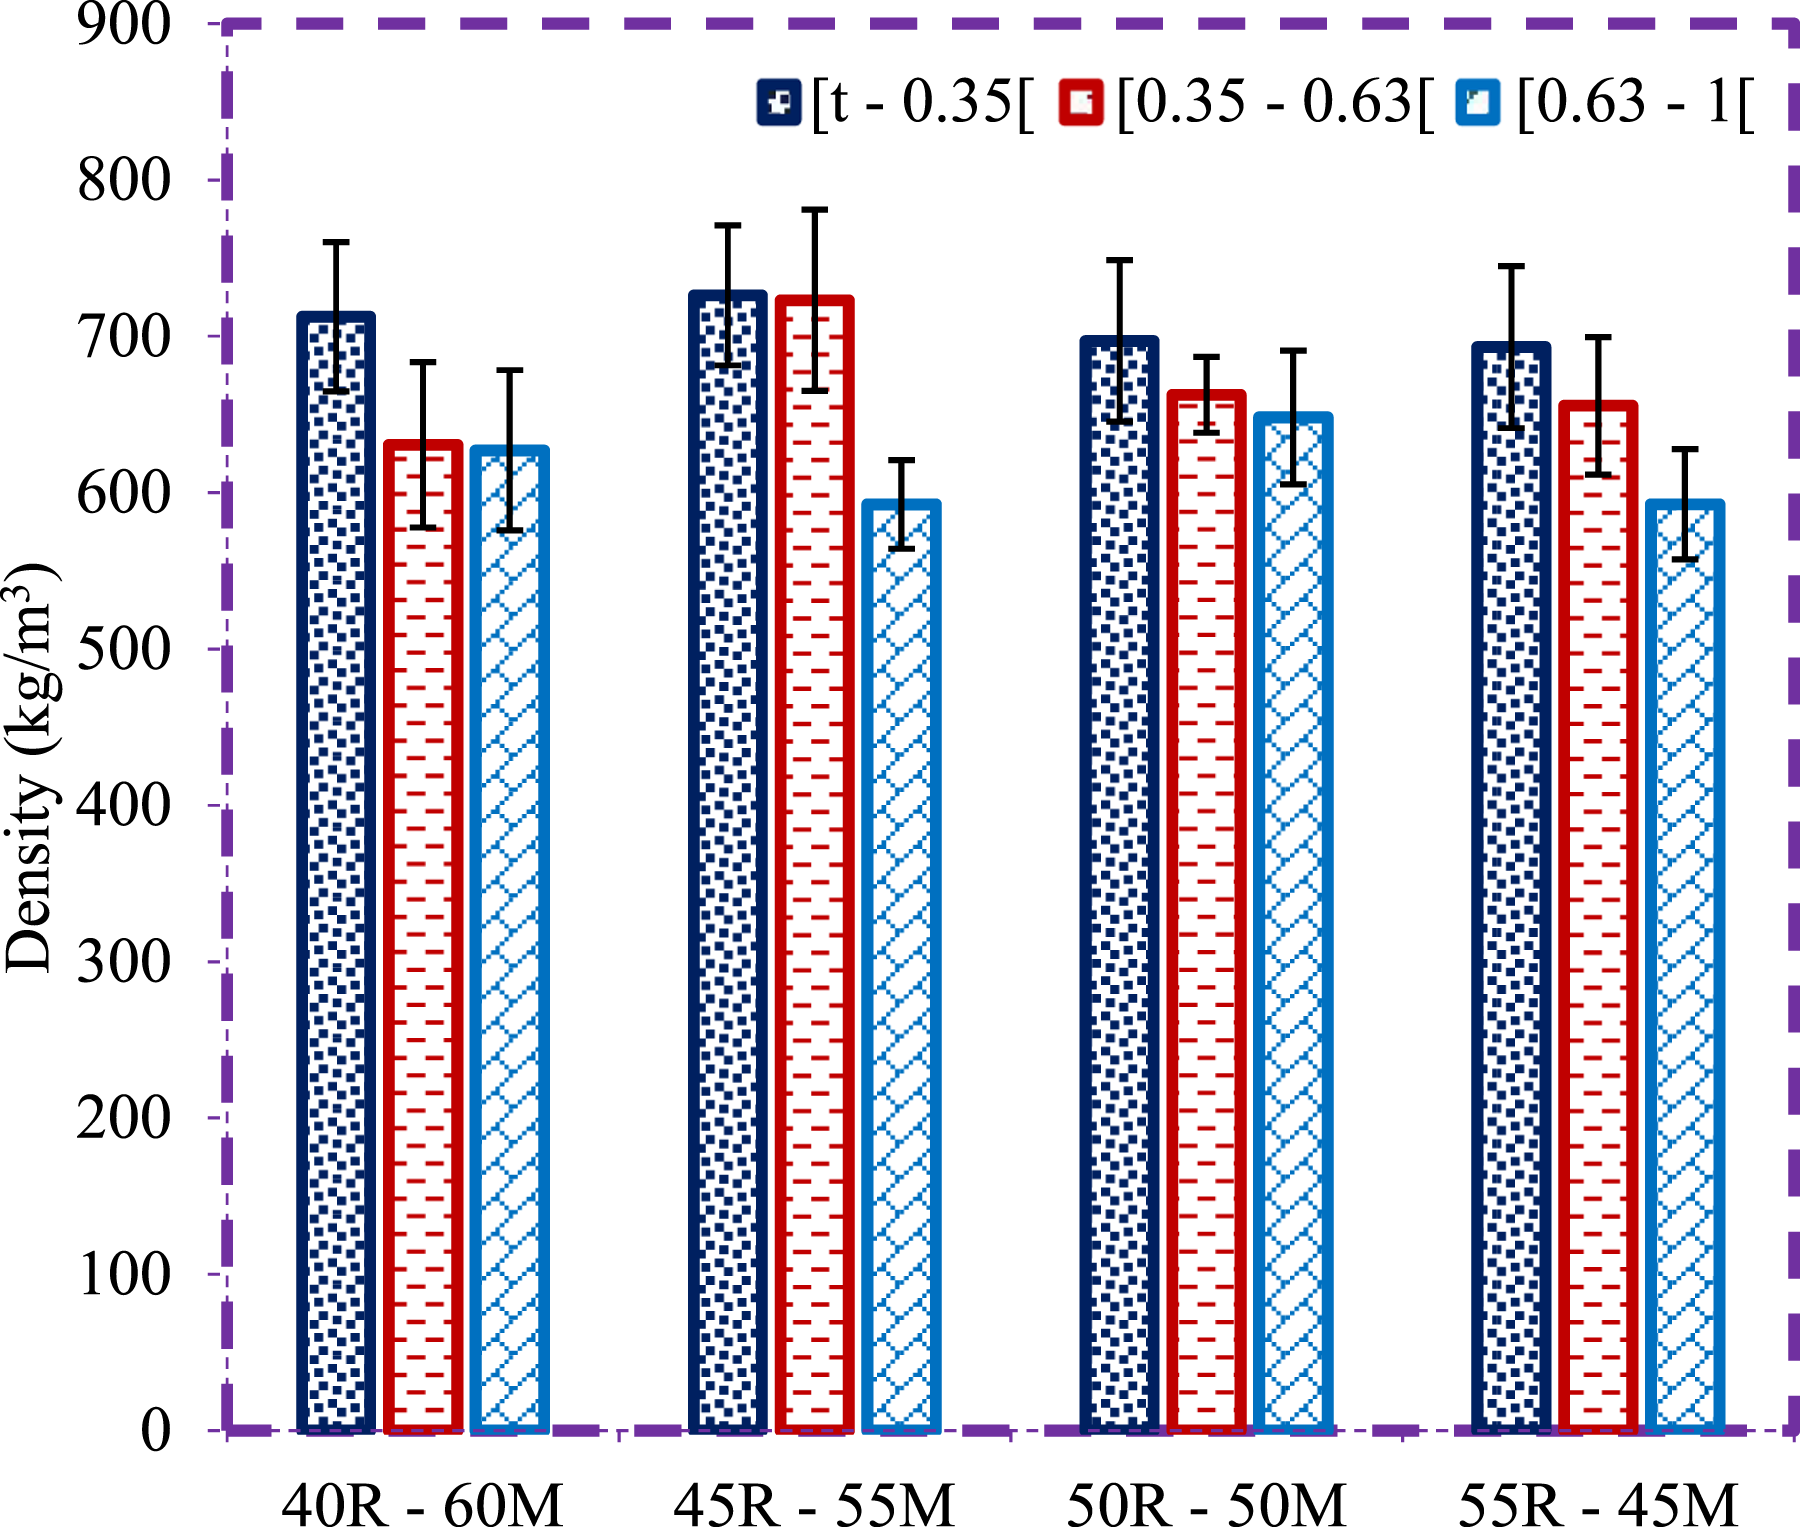
Water absorption of the composites produced
Water absorption rate
The water absorption rate is (54.06 ± 3.19 – 109.42 ± 5.78) %. The lowest values are obtained for the 50R-50M formulation and for the smallest particle sizes, and the highest values for the 55R-45M formulations and for the largest particle sizes. The absorption rate (Figure 6) increases with increasing particle size, due to the hydrophilic nature of the particles and the hydrophobic nature of the polystyrene matrix.14,22 The absorption rate results corroborate those for density. Similar observations have been made on other composites to reflect the effect of particle size and reinforcement rate.1,4 The results obtained are comparable to other composites such as epoxy/Iroko wood composites (60 – 168) %,
4
raffia vinifera/urea (54 – 94) %,
1
and pseudo oil palm trunk/polyester (33 – 145) %.
29
Tropical woods used in insulation, such as Alfra wood (102 %), Rosi wood (120 %), Ojamlesh wood (54 %) 47,52 and oil palm wood (84 – 119) %,
46
This makes these composites a substitute material for tropical woods, helping to combat deforestation and promote environmental protection. Water absorption rate.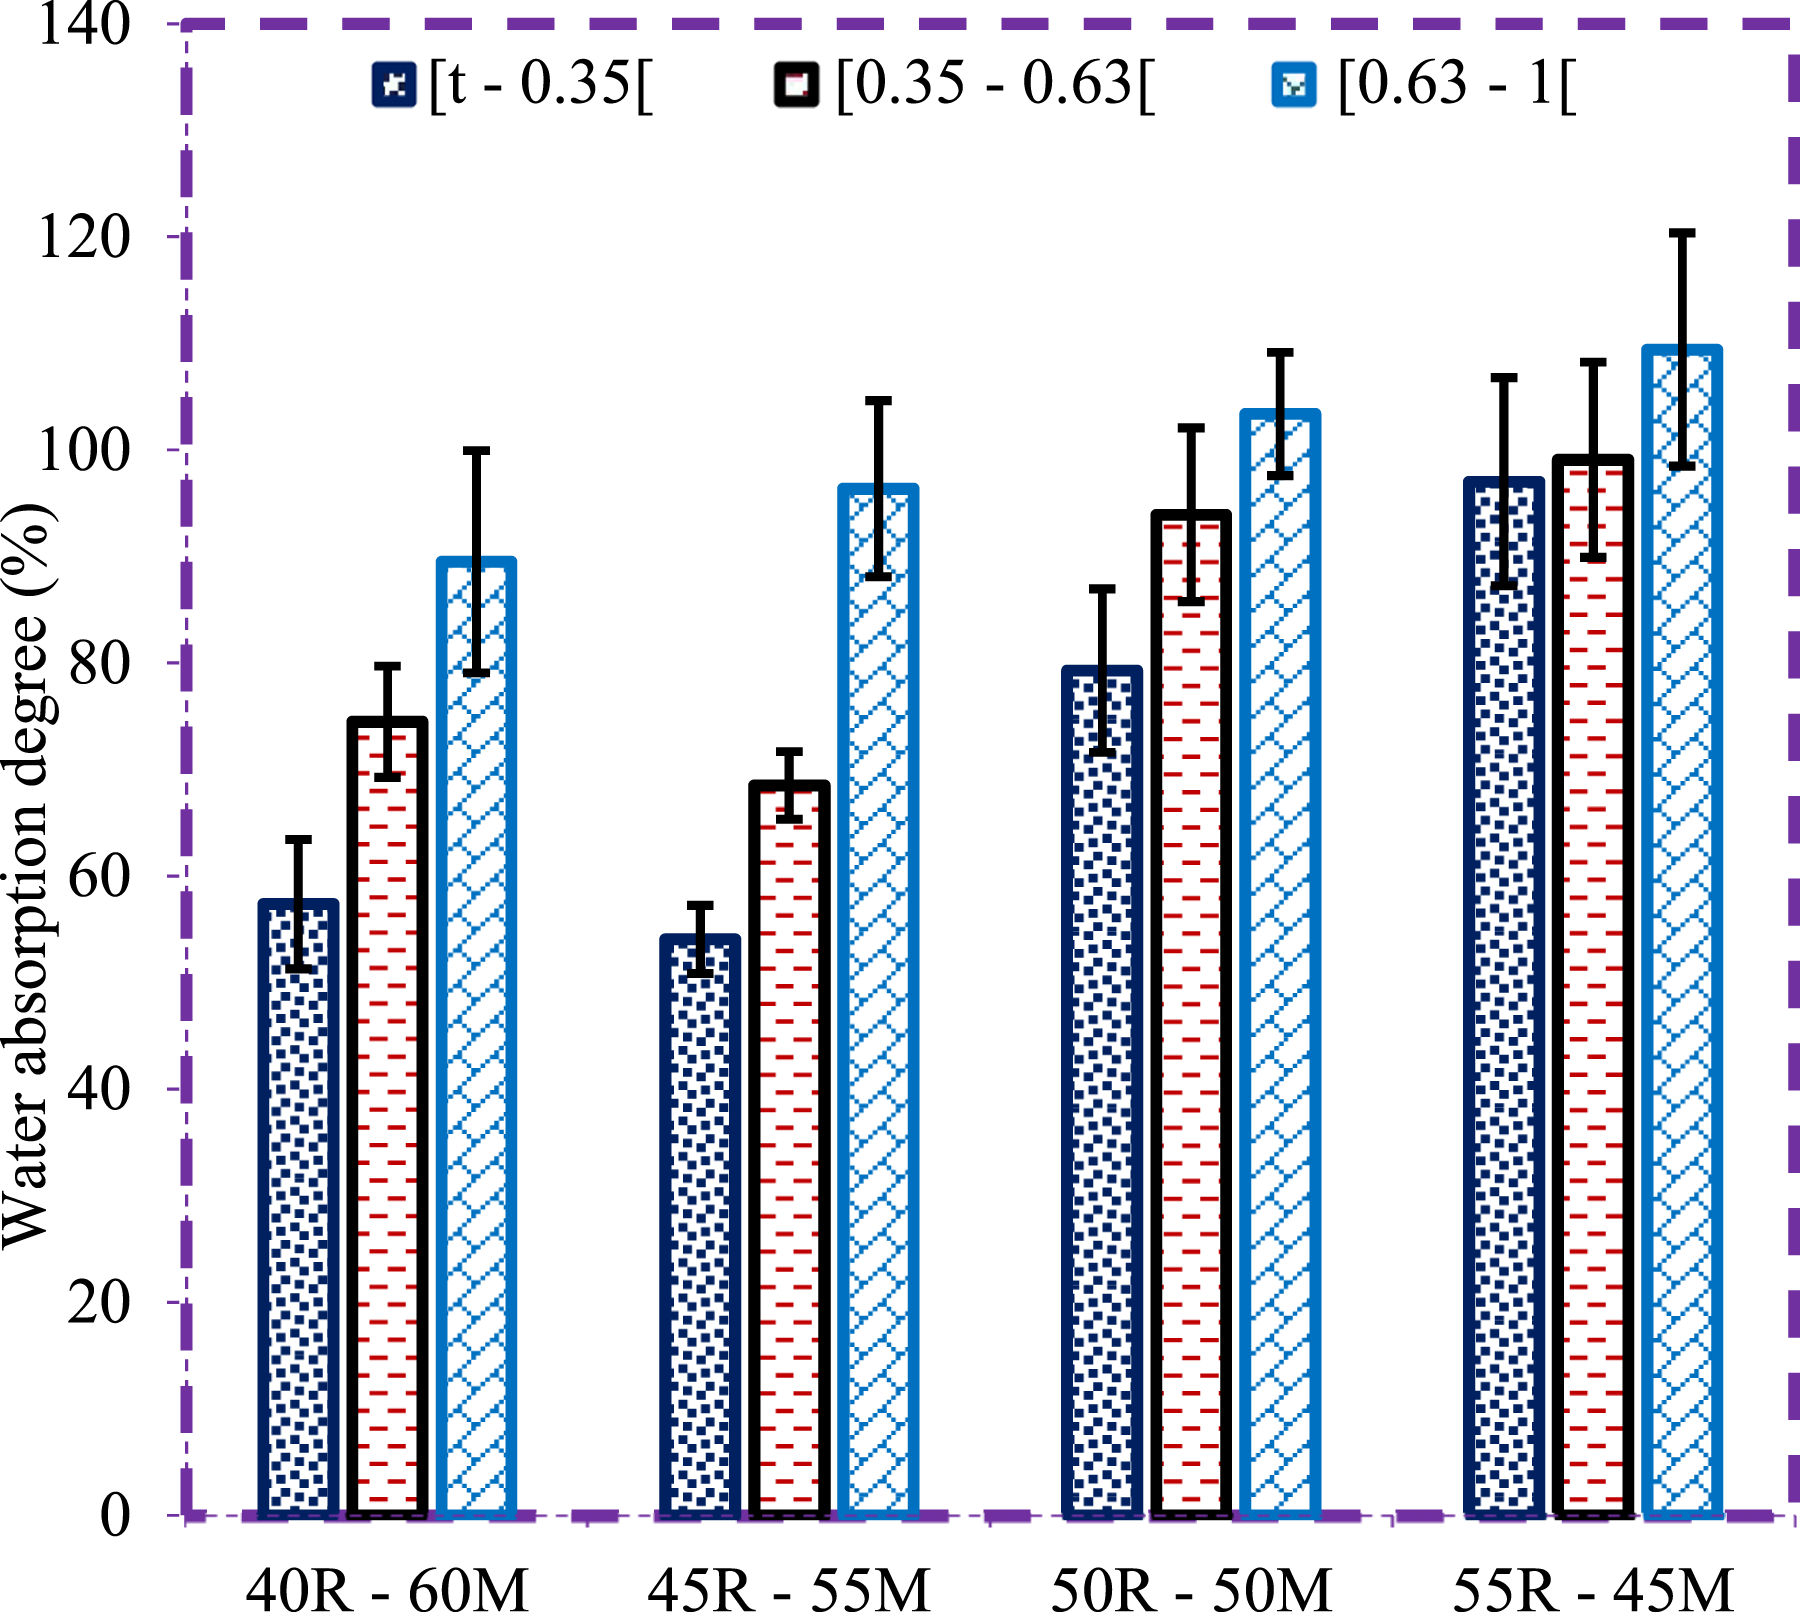
Thickness swelling rate
The swelling rate of the composite obtained ranges from 2.86 ± 0.06 to 16.09 ± 2.2%. The composite made with small particles does not undergo significant swelling compared to the one with larger particles. This can be explained by the fact that the particles used to produce it no longer have cavities that can hold water and deform under the effect of the amount of water present. Consequently, the thickness swelling rate is lower for smaller particles at a reinforcement rate of 40%, which is consistent with the work of Dawoua and al.,
13
Figure 7 shows that the swelling rate follows the same trend as the water absorption rate, indicating a good correlation between the water absorption rate, density and swelling rate. For applications in wet and dry environments, these results are consistent with standards EN 323 and NF EN 312-5 (TGE ≤16%),
4
with the exception of formulations at 55R – 45M formulations. In addition, low swelling rates would limit cracking stresses during use in dry or wet environments, as reported in the literature.4,53,54 Alkaline treatment of the particles would reduce their hydrophilicity and further reduce cracking stresses. The results obtained are comparable to the composites produced by Bouwa and al. (1.57 – 4.41) %,
29
Baskaran and al. (13.55 – 33) %,
55
Hashin and al. (37 – 41) %,
56
Nadhari and al. (17.96 – 79.53) %
57
; Mawardi and al. (41.33 – 73.33) %,
58
Lee and al. (10.48 – 33.27) %,
59
Jumhuri and al. (53.51 – 65.95) %
60
oriented as false ceilings in houses and as partitioning and thermal insulation material. Thickness swelling rate.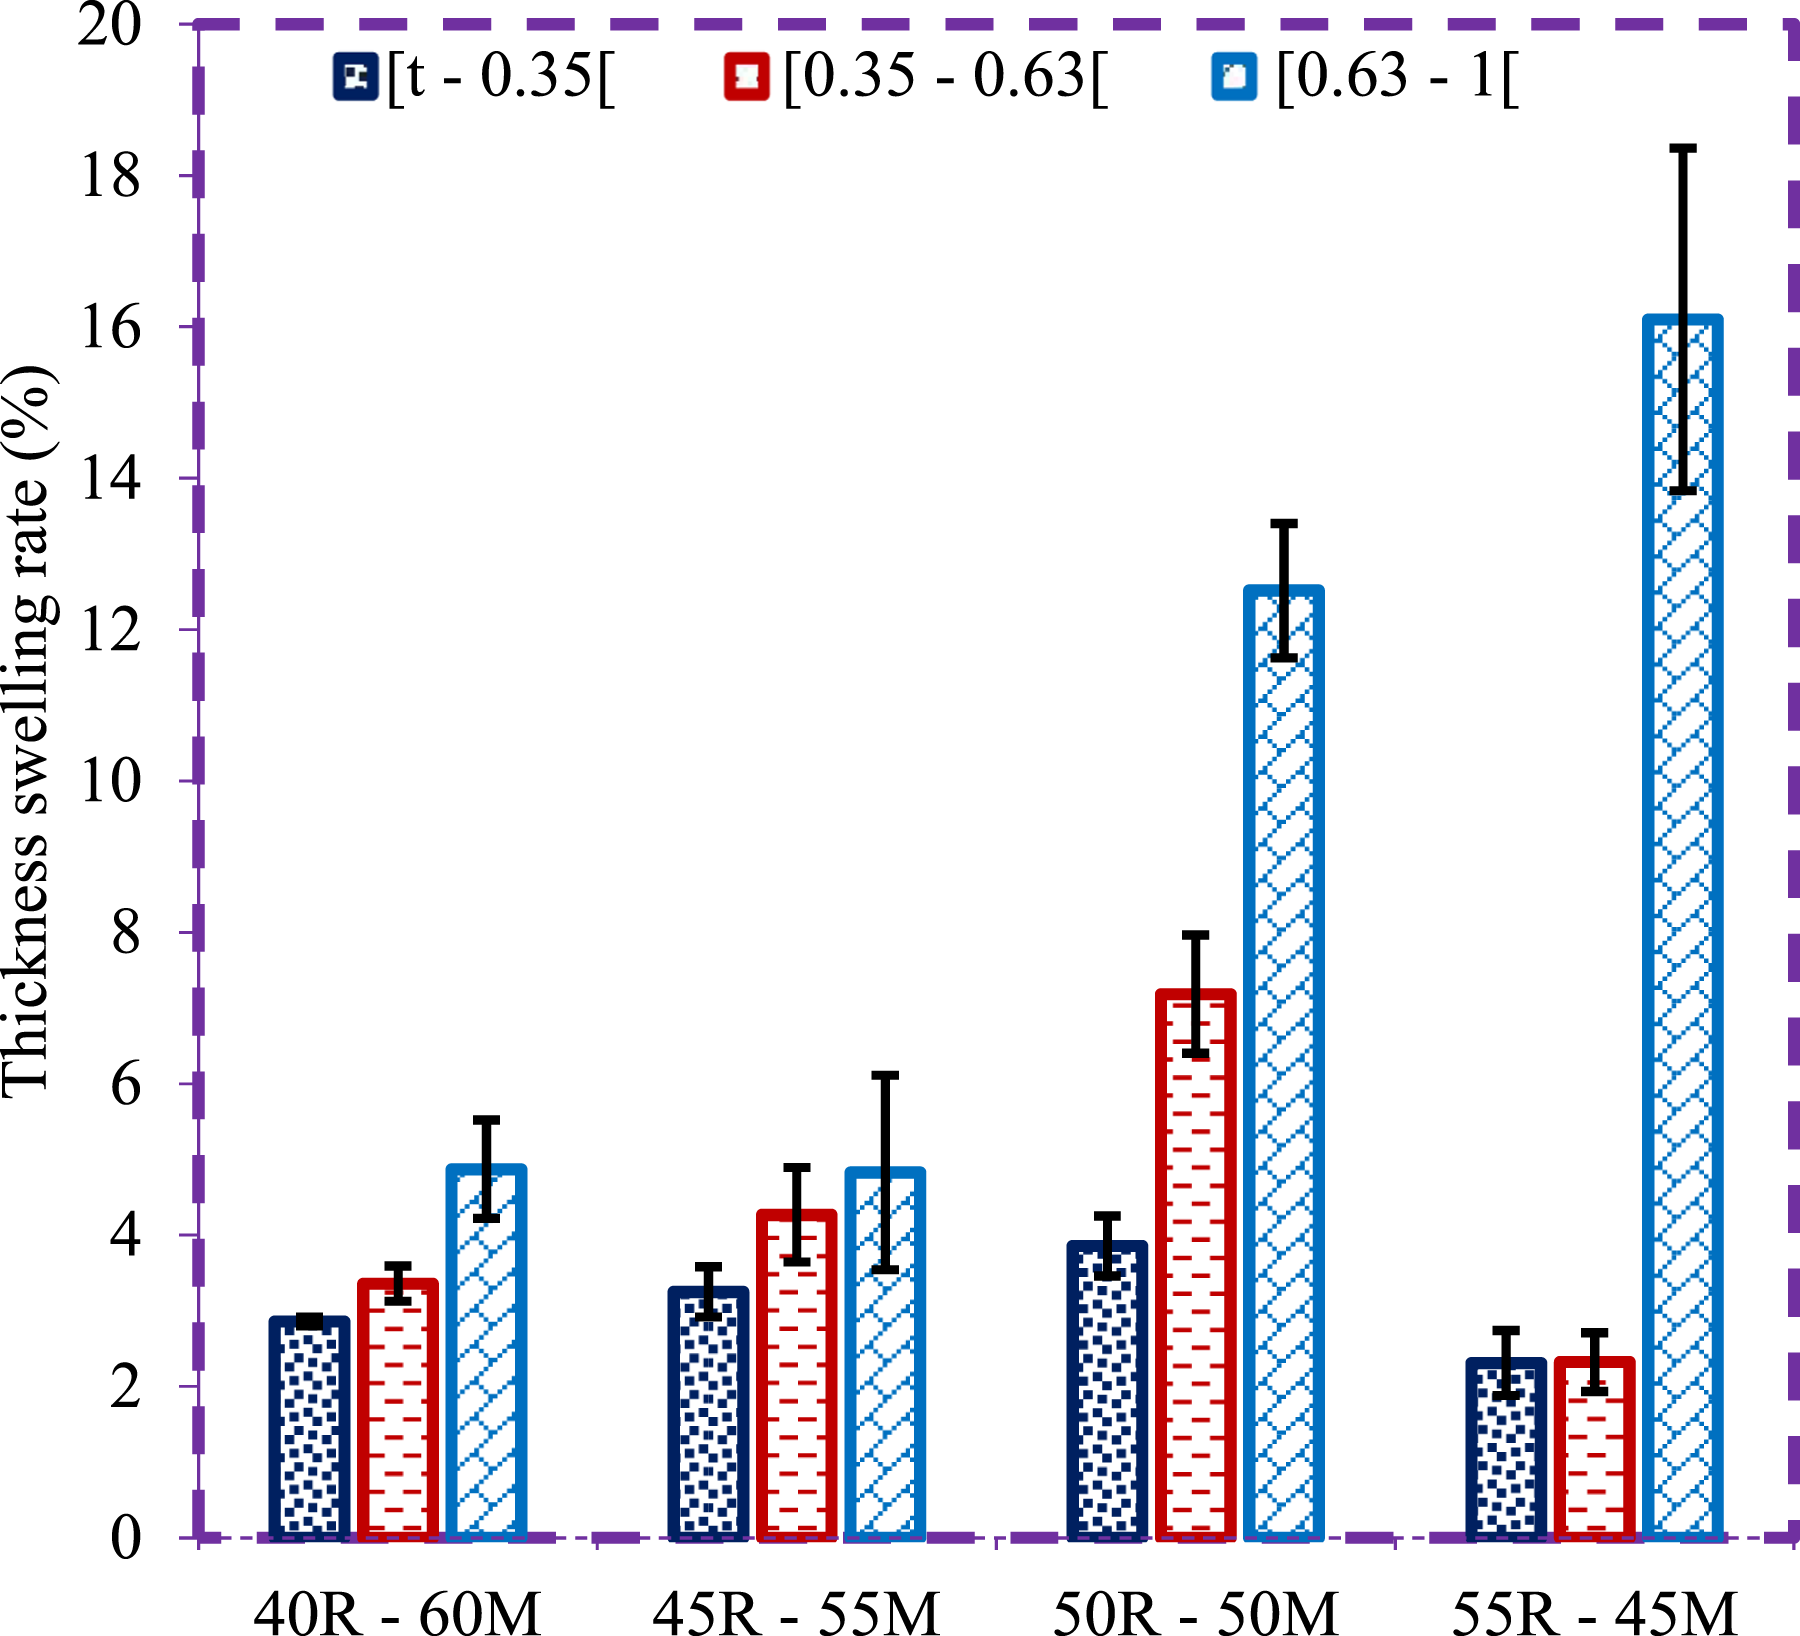
Water absorption kinetics
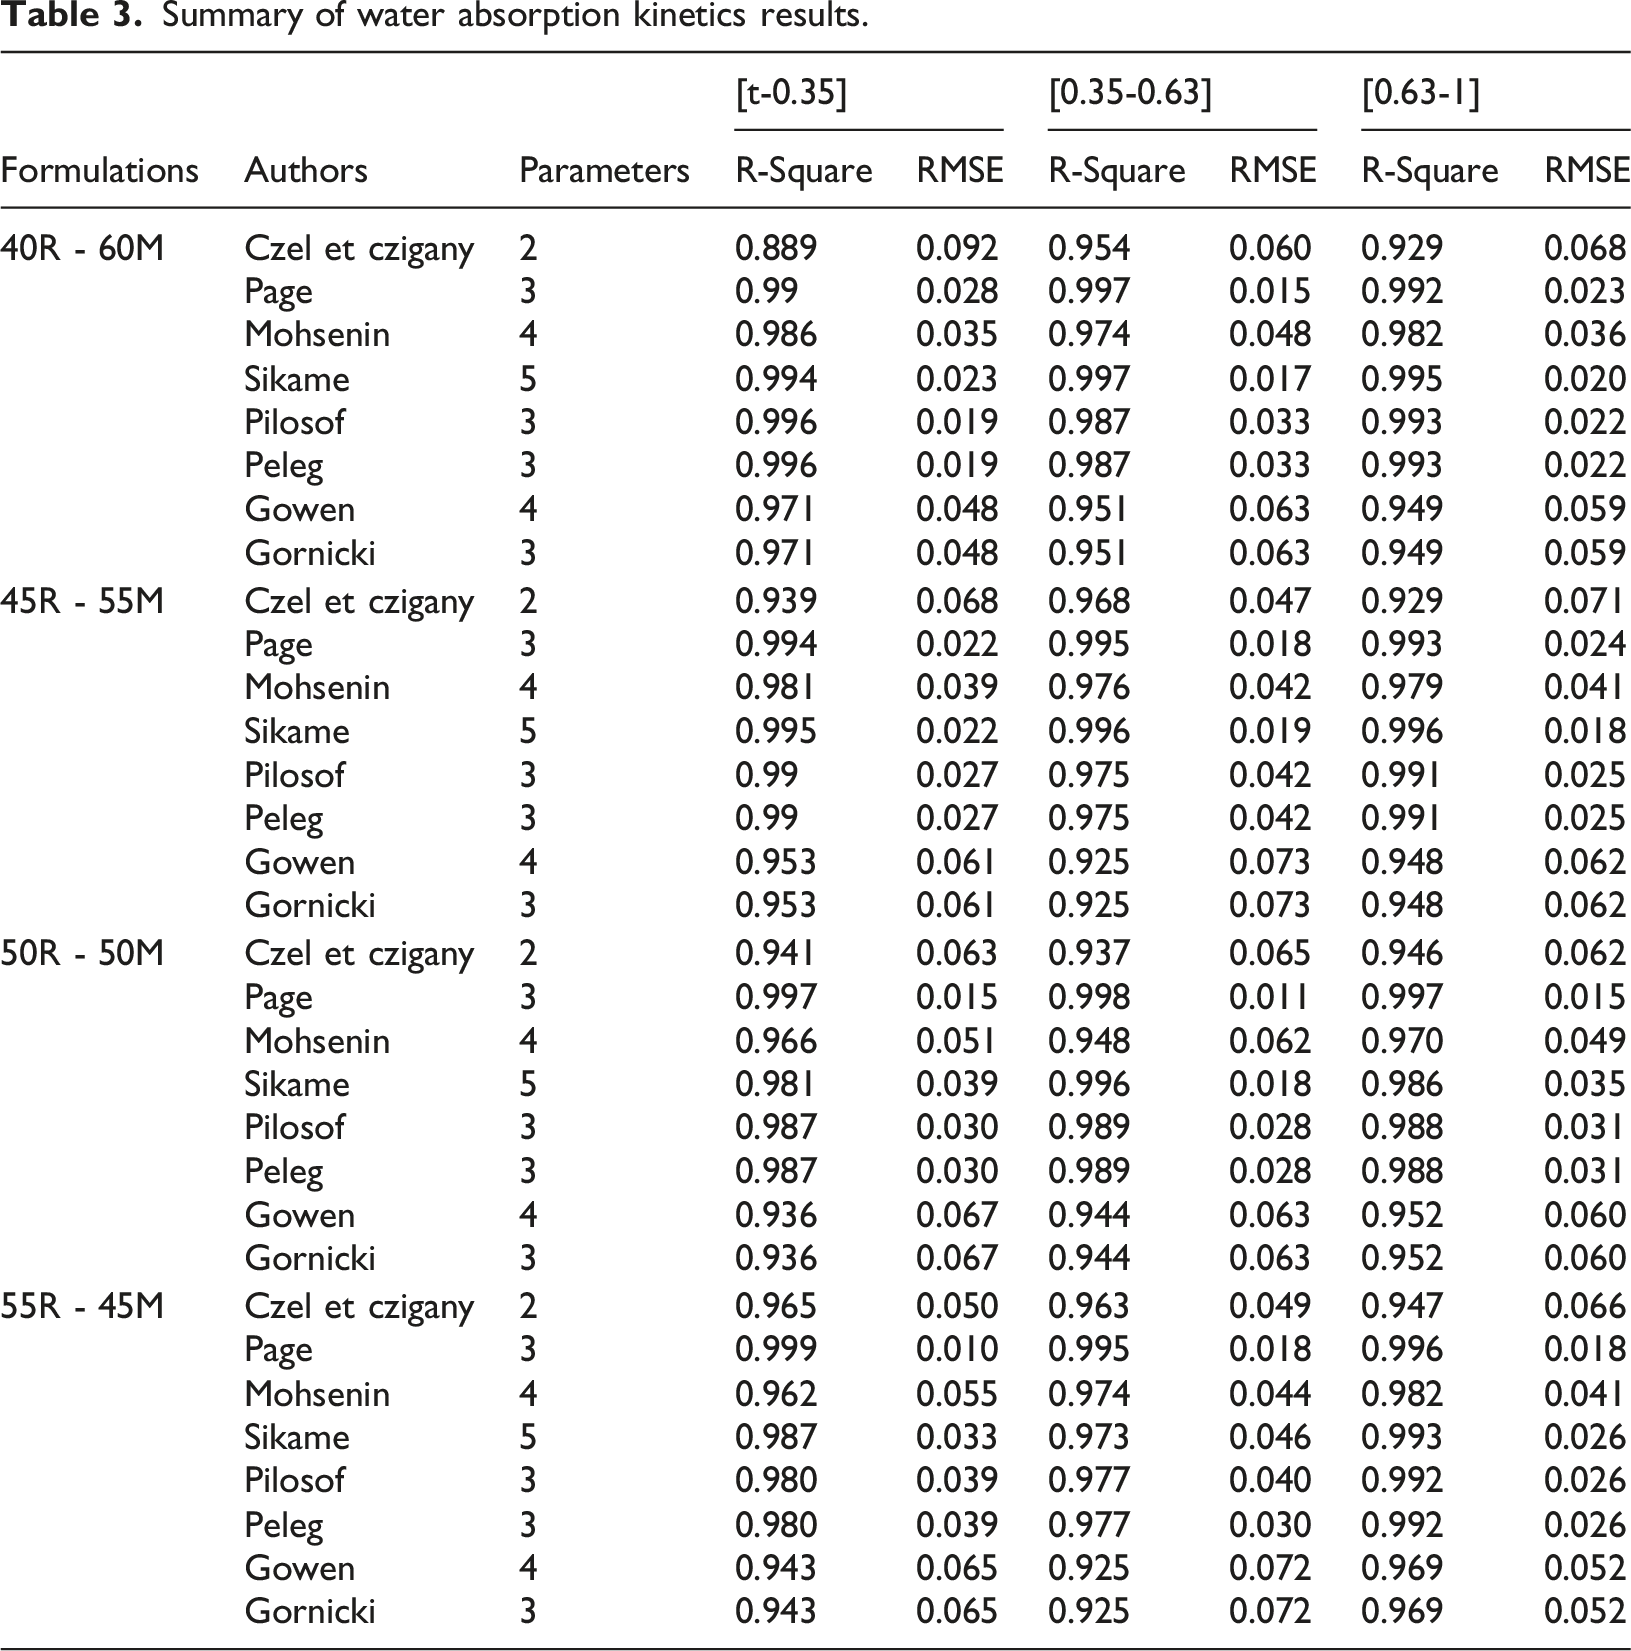
The experimental absorption points show an increase in mass over time. The absorption curve (Figure 8(a)) for the smallest particles ([t – 0.35 [) shows rapid absorption in the first 200 min. The same observation is made for particles of size [0.35 – 0.63 [ (Figure 8(b)) and larger particles ([0.63 – 1 [) (Figure 8(c)). Overall, saturation was reached within 925 min. In addition, a change in behaviour was observed within 400 min for the smallest particle sizes ([t – 0.35 [), 250 min for medium-sized particles [0.35 – 0.63 [ and 200 min for large particles [0.63 – 1 [This variation in time between phases may be associated with the porous nature of the particles. This is justified by the fact that large composites are less compact than small ones and are likely to be more porous.4,48 In the first phase, the material exhibits linear behaviour showing the onset of saturation, and the second phase marks the end of the test. Similar observations have been made on other composites and wood materials.4,46,47 The experimental drying points were correlated with the absorption models (Table 2) to reflect the absorption behaviour (Figure 8(d)). Absorption gradient; (a) [t – 0.35]; (b) [0.35 – 0.63]; (c) [0.63 – 1]; (d) Absorption kinetics.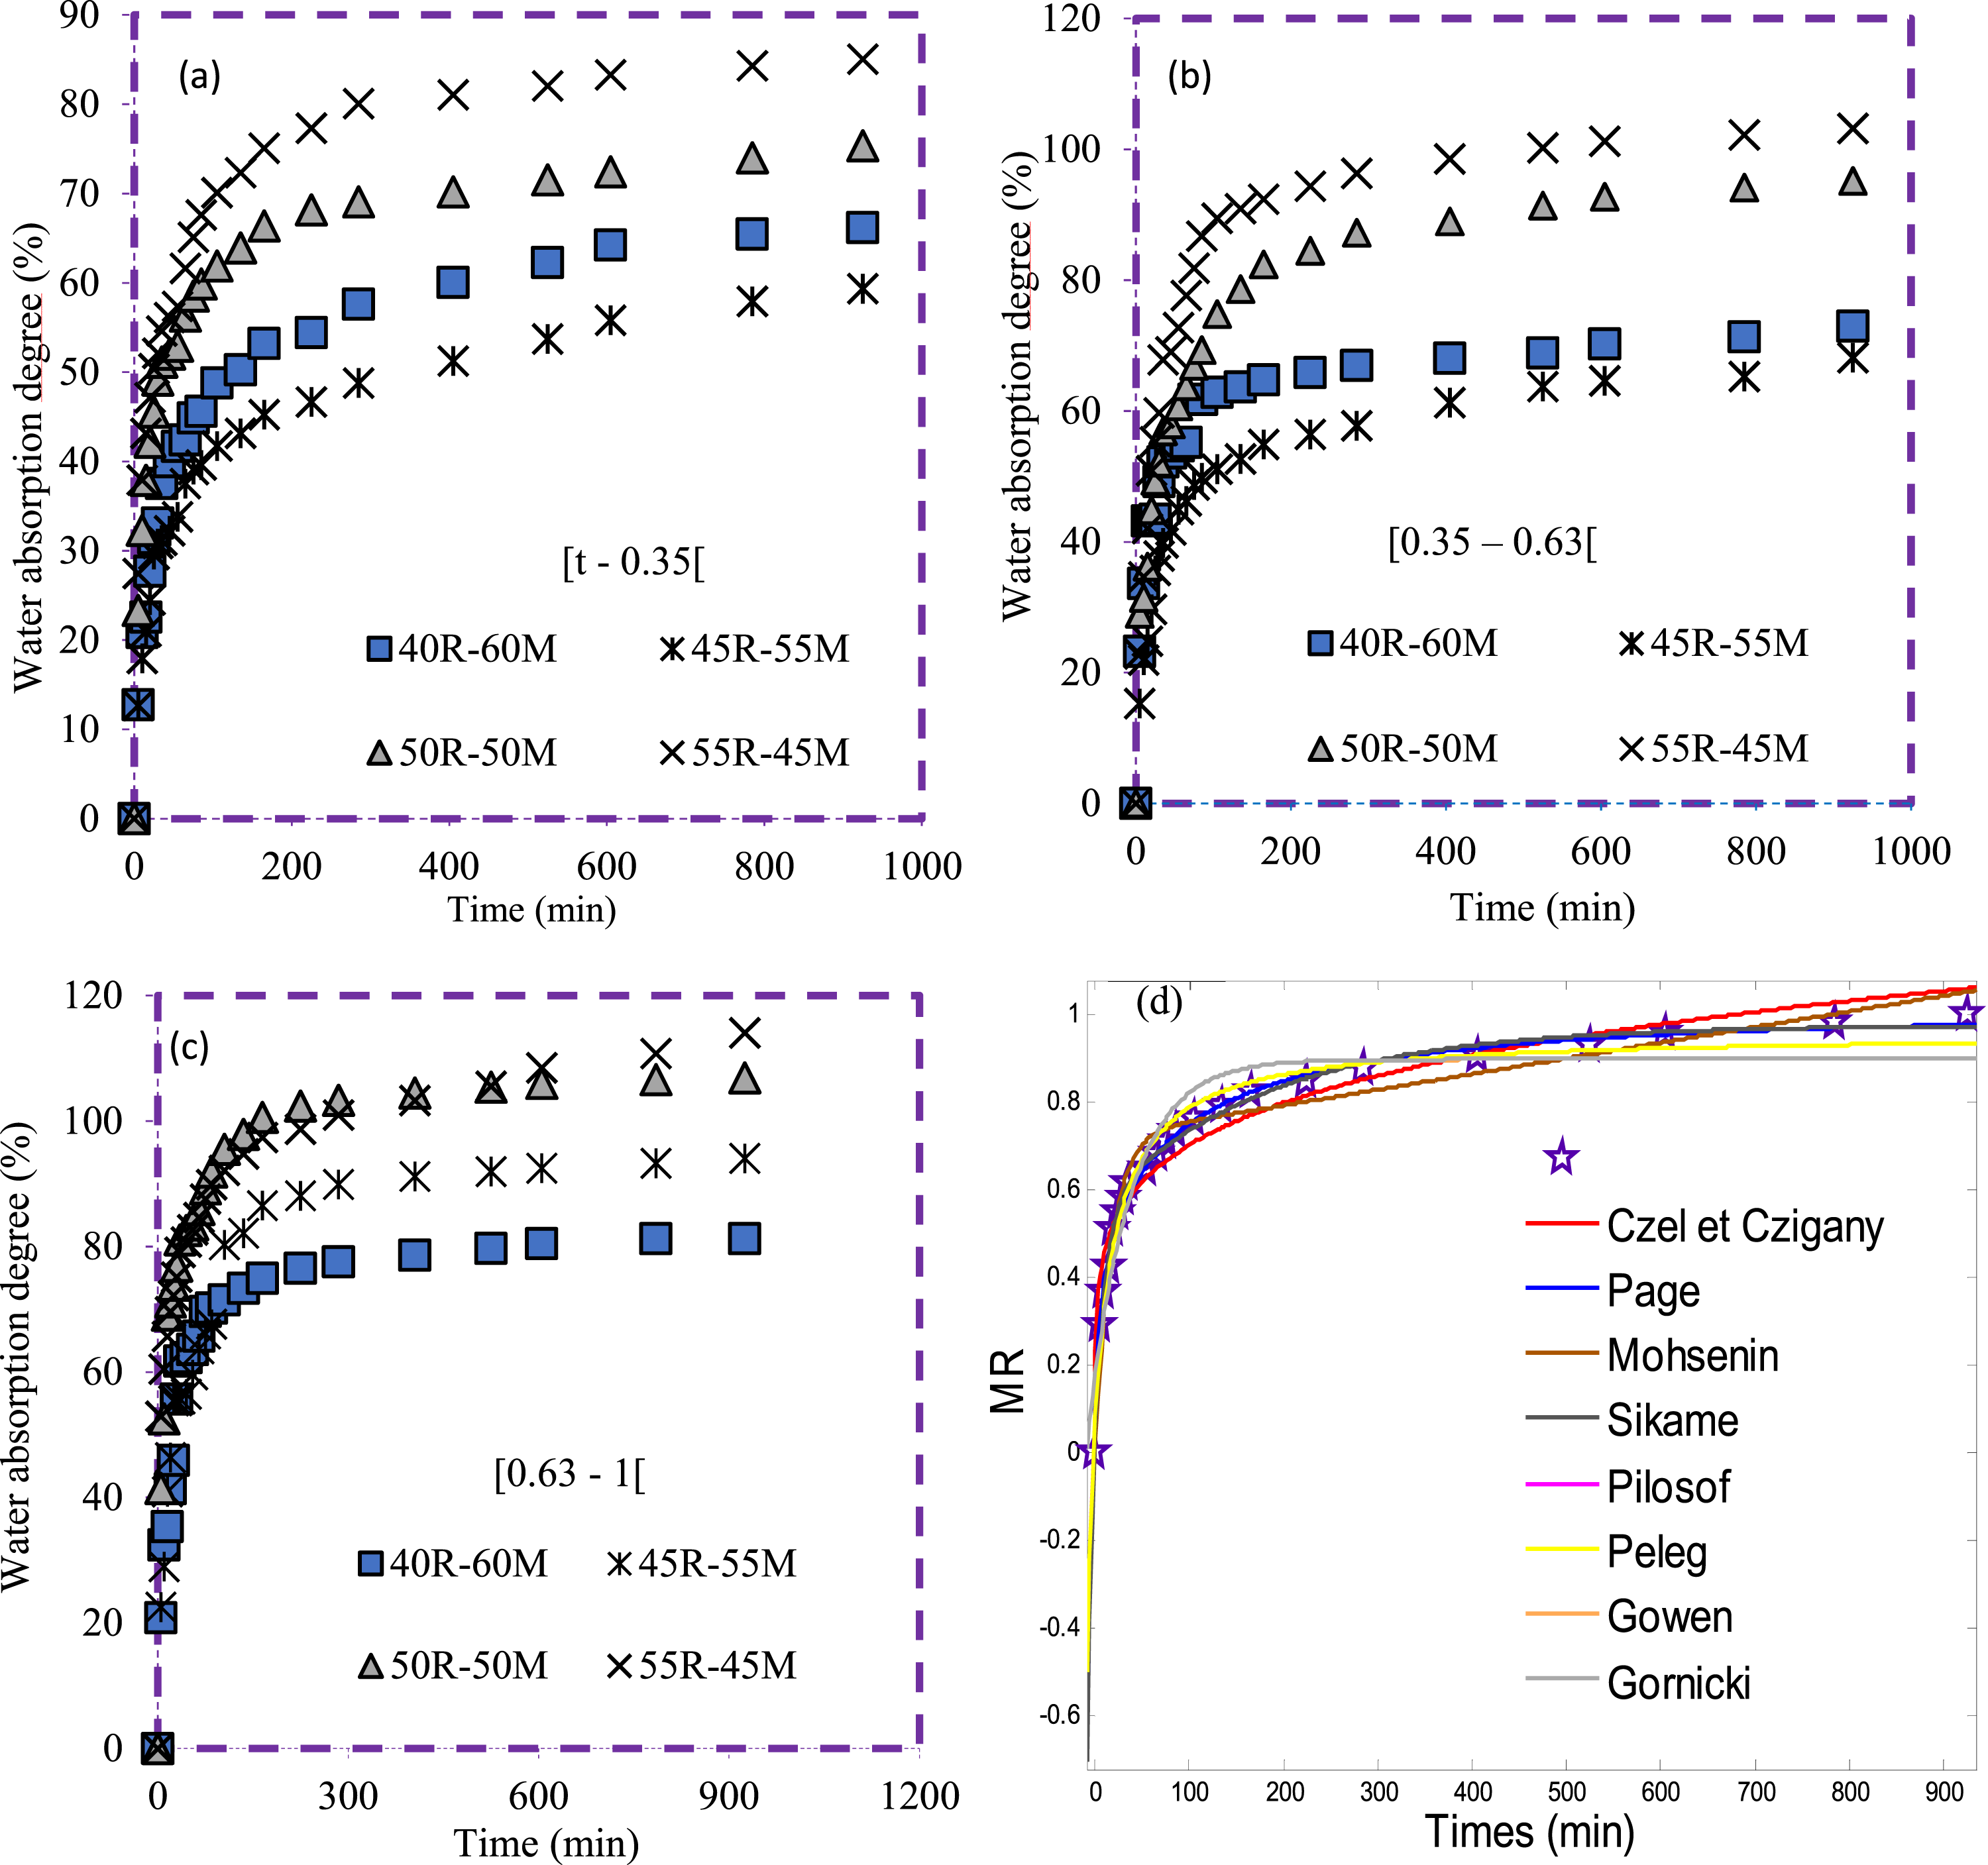
Summary of water absorption kinetics results.
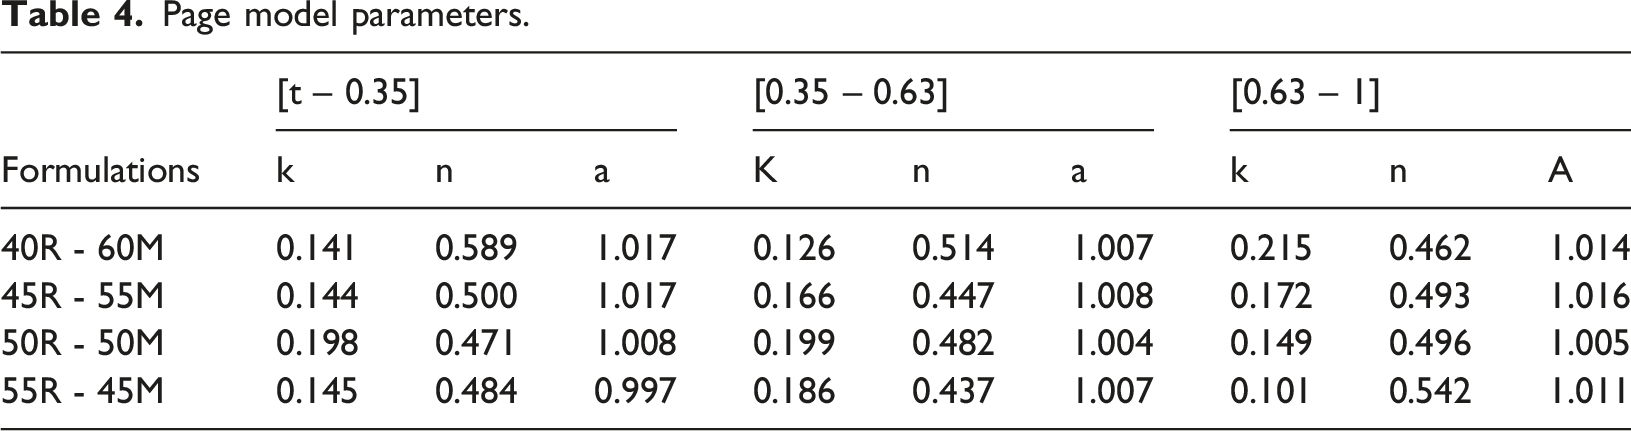
Page model parameters.
Absorption diffusion coefficients
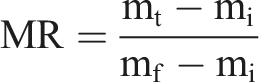
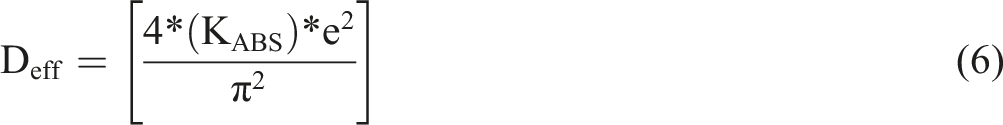
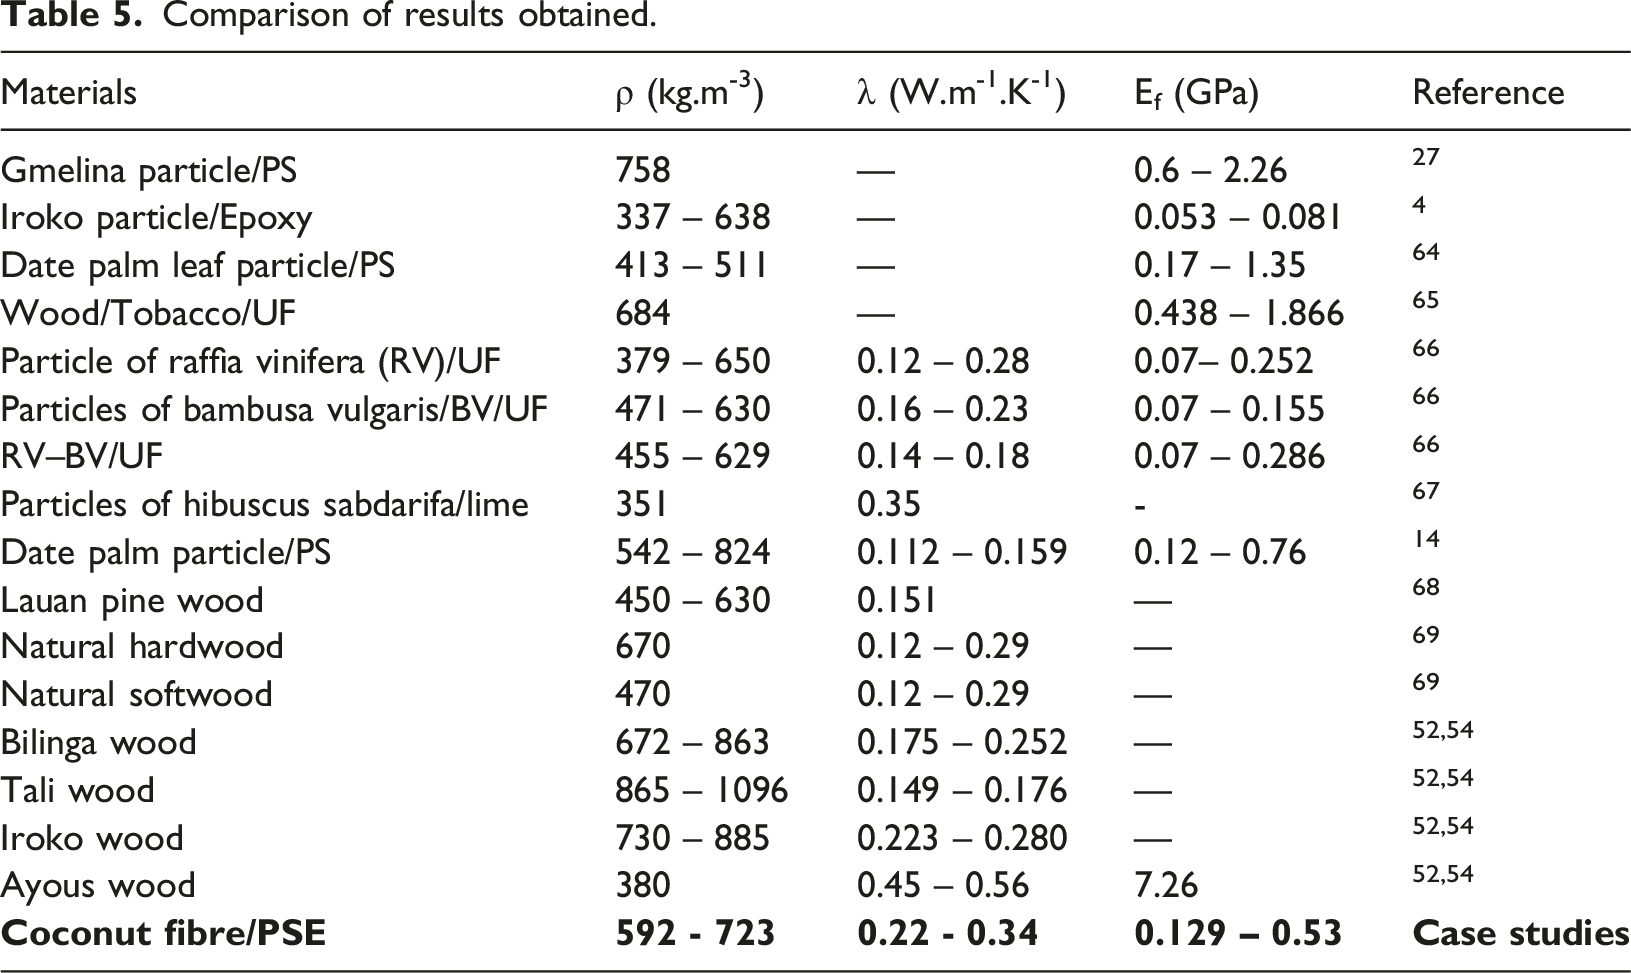
The absorption curves (Figure 8) show a linear absorption phase in the first linear sections. The correlation coefficient of the linear part of this absorption represents the slope (KAbs) used in equation (6) to calculate the diffusion coefficient. The diffusion coefficient (1.13*10-08 ± 4.96*10-10 – 1.65*10-08 ± 1.68*10-09) m2.s-1 is higher than the corrected diffusion coefficient (1.13*10-08 – 4.16*10-08 ± 4.95*10-09) m2.s-1. This is because the calculation of the diffusion coefficient does not take into account the overall geometry of the sample, unlike the corrected diffusion coefficient. Similarities have been observed in other particle composites.4,48 This absorption capacity demonstrates the hydrophilic nature of the composites developed due to the hydrophilic nature of the filler particles. The diffusion coefficient curve (Figure 9) shows that diffusion is higher for reinforcement rates of 55%. Although this formulation diffuses water more quickly than the others, it remains unsuitable for use in wet areas according to standards EN 323 and NF EN 312-5 (TGE ≤16%). Overall, the results obtained are comparable to those for raffia vinifera cork (1.06*10-09 – 8.74*10-09) m2·s-1,
47
linen/urea fibre composite (1.75*10-11 – 2.22*10-11) m2·s-1, linen twill fibre composite (1.32*10-10 – 9.93*10-11) m2.s-1 with applications defined in the thermal insulation of buildings. Table 5 presents a comparison of some materials identified in the literature. Diffusion coefficient. Comparison of results obtained.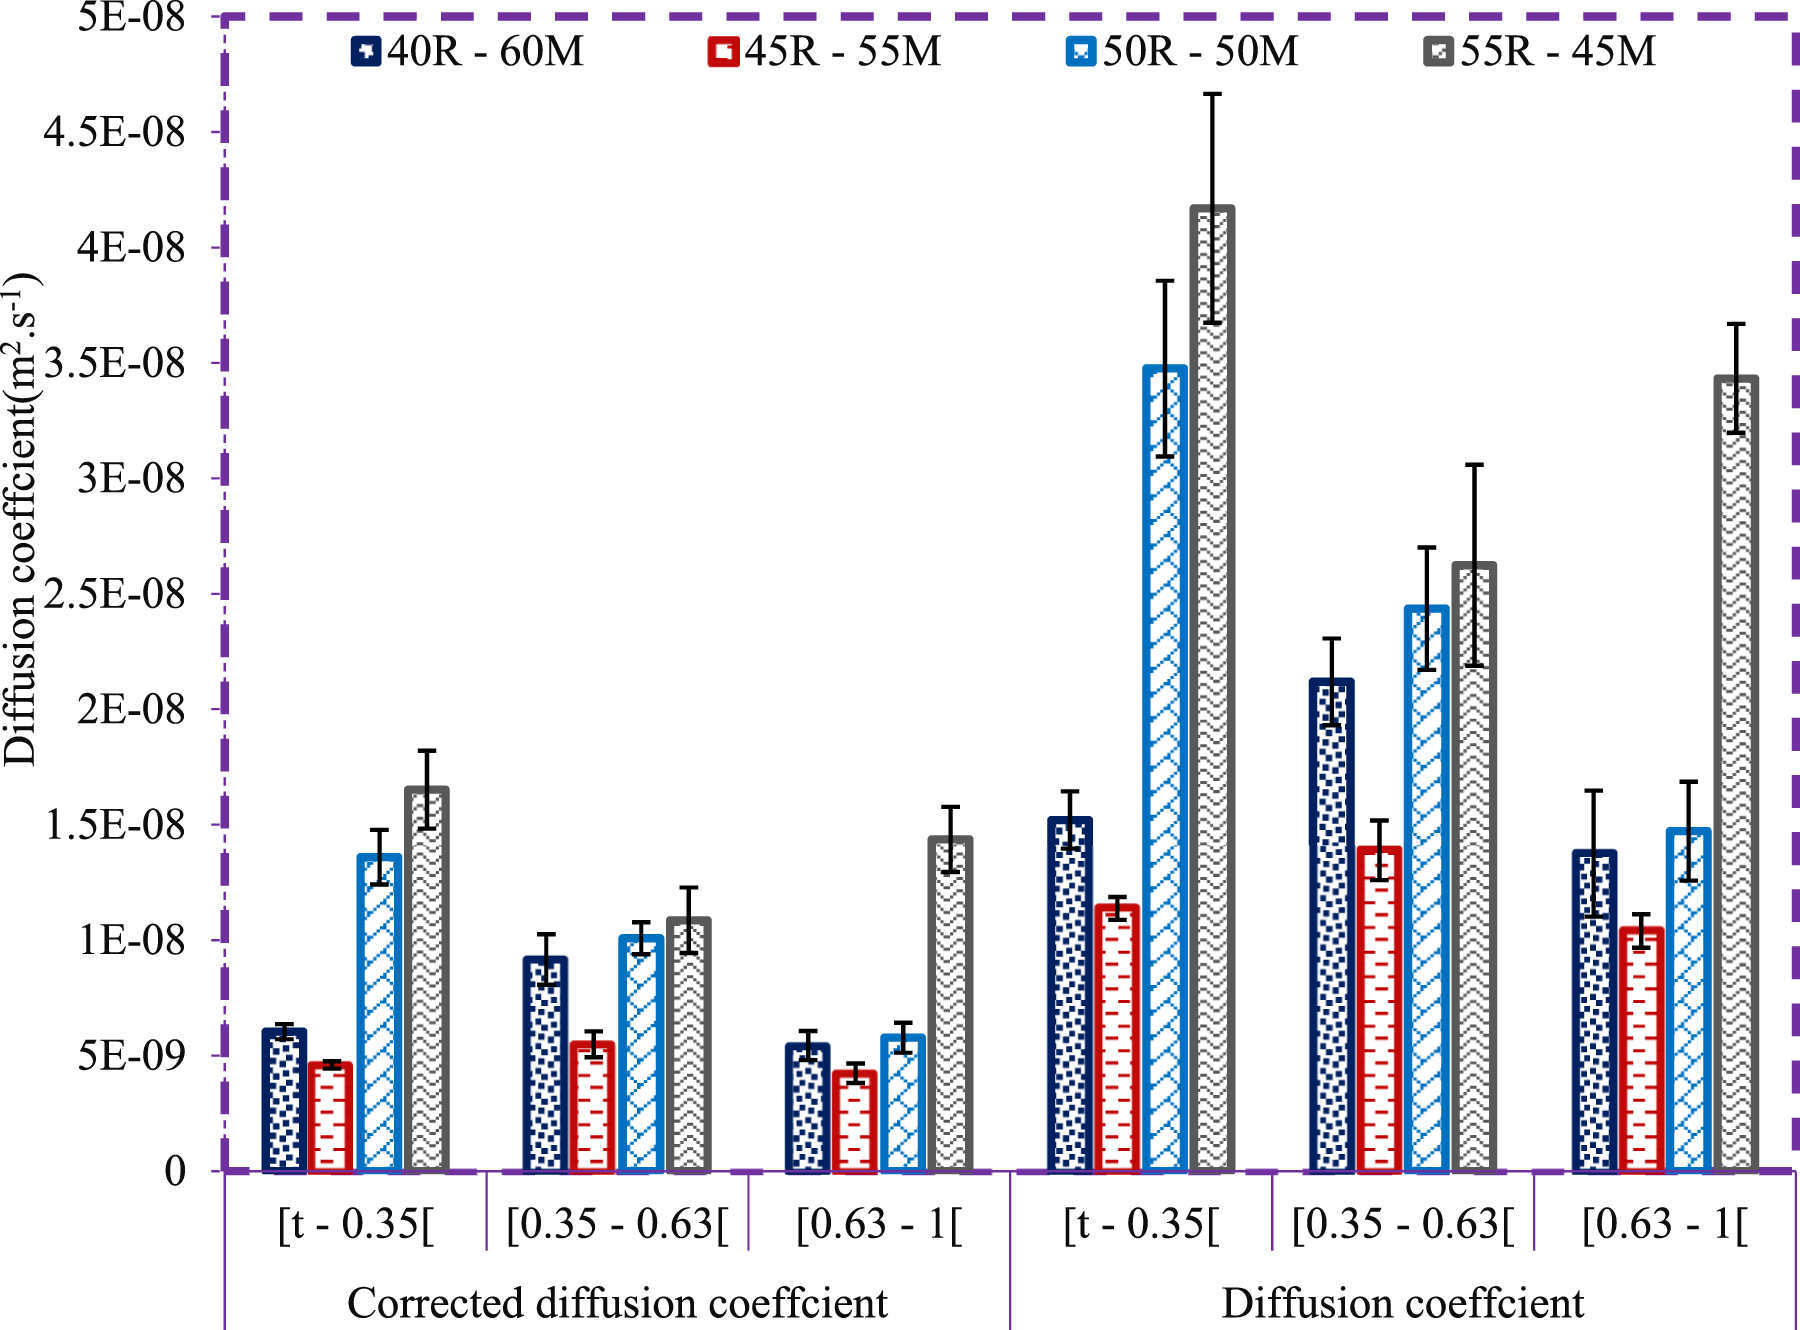
Microscopic observation of surface conditions reveals rough surfaces with a more compact structure for small particle sizes and reinforcement rates of 40% and 45%. In addition, a random dispersion of fibre particles impregnated with matrix is observed overall for all formulations. These surfaces become increasingly porous and less compact as particle size and reinforcement rate increase, creating voids in the composites. Figure 10(a)–10(f) show better interfacial cohesion between the reinforcement and the matrix, which could explain the compact, less porous structure with low absorption and high densities. This ability to absorb less water may be beneficial for structural applications.29,60 On the other hand, Figure 10(g)–10(l) show more porous structures. This is consistent with the water absorption data, which is higher for these formulations. Masri and al.
14
reported low densities with increasing sizes and reinforcement rates for date palm leaf and polystyrene fibres due to the more porous structure of the composites. A similar observation is reported by Takoumbe and al.,
4
A more pronounced sensitivity to water for large particles and high reinforcement rates is probably due to open porosities that tend to trap water in the composites produced. This sensitivity to water in composites may be responsible for the low mechanical performance and low thermal conductivity reported in the literature.1,5,14 Microscopic view; (a) AP40R60; (b) BP40R60; (c) CP40R60; (d) DP45R65; (e) EP45R65; (f) FP45R65; (g) GP50R50; (h) HP50R50; (i) IP50R50; (j) JP55R45; (k) KP55R45; (l) LP55R45.
Three-point bending mechanical properties of the composites produced
The test was carried out on six (06) samples of each formulation, totalling 72 samples. The force-displacement curves recorded by the testing device show a sudden break for small particles ([t – 0.35 [), indicating better cohesion between the small particles and the matrix (Figure 11(a)). When the particle size increases (Figure 11(b) and 11(c)) for [0.35 – 0.63 [ and [0.63 – 1 [ respectively), ductile fracture is observed, which can be explained by a gradual separation between the particles and the reinforcement. The slope of the force-displacement curve was calculated in the linear part of each sample (Figure 11(d)). According to Masri and al.
14
and Amadji and al.,
27
the change in behaviour during the fracture phase from brittle to ductile is due to the brittle nature of polystyrene. The incorporation of plant particles into the matrix allows the composites produced to change from brittle to ductile as the reinforcement rate increases. This has been observed in other polymer matrix composites reinforced with plant material.4,13,50 Flexural curve; (a) [t – 0.35]; (b) [0.35 – 0.63]; (c) [0.63 – 1]; (d) Slope.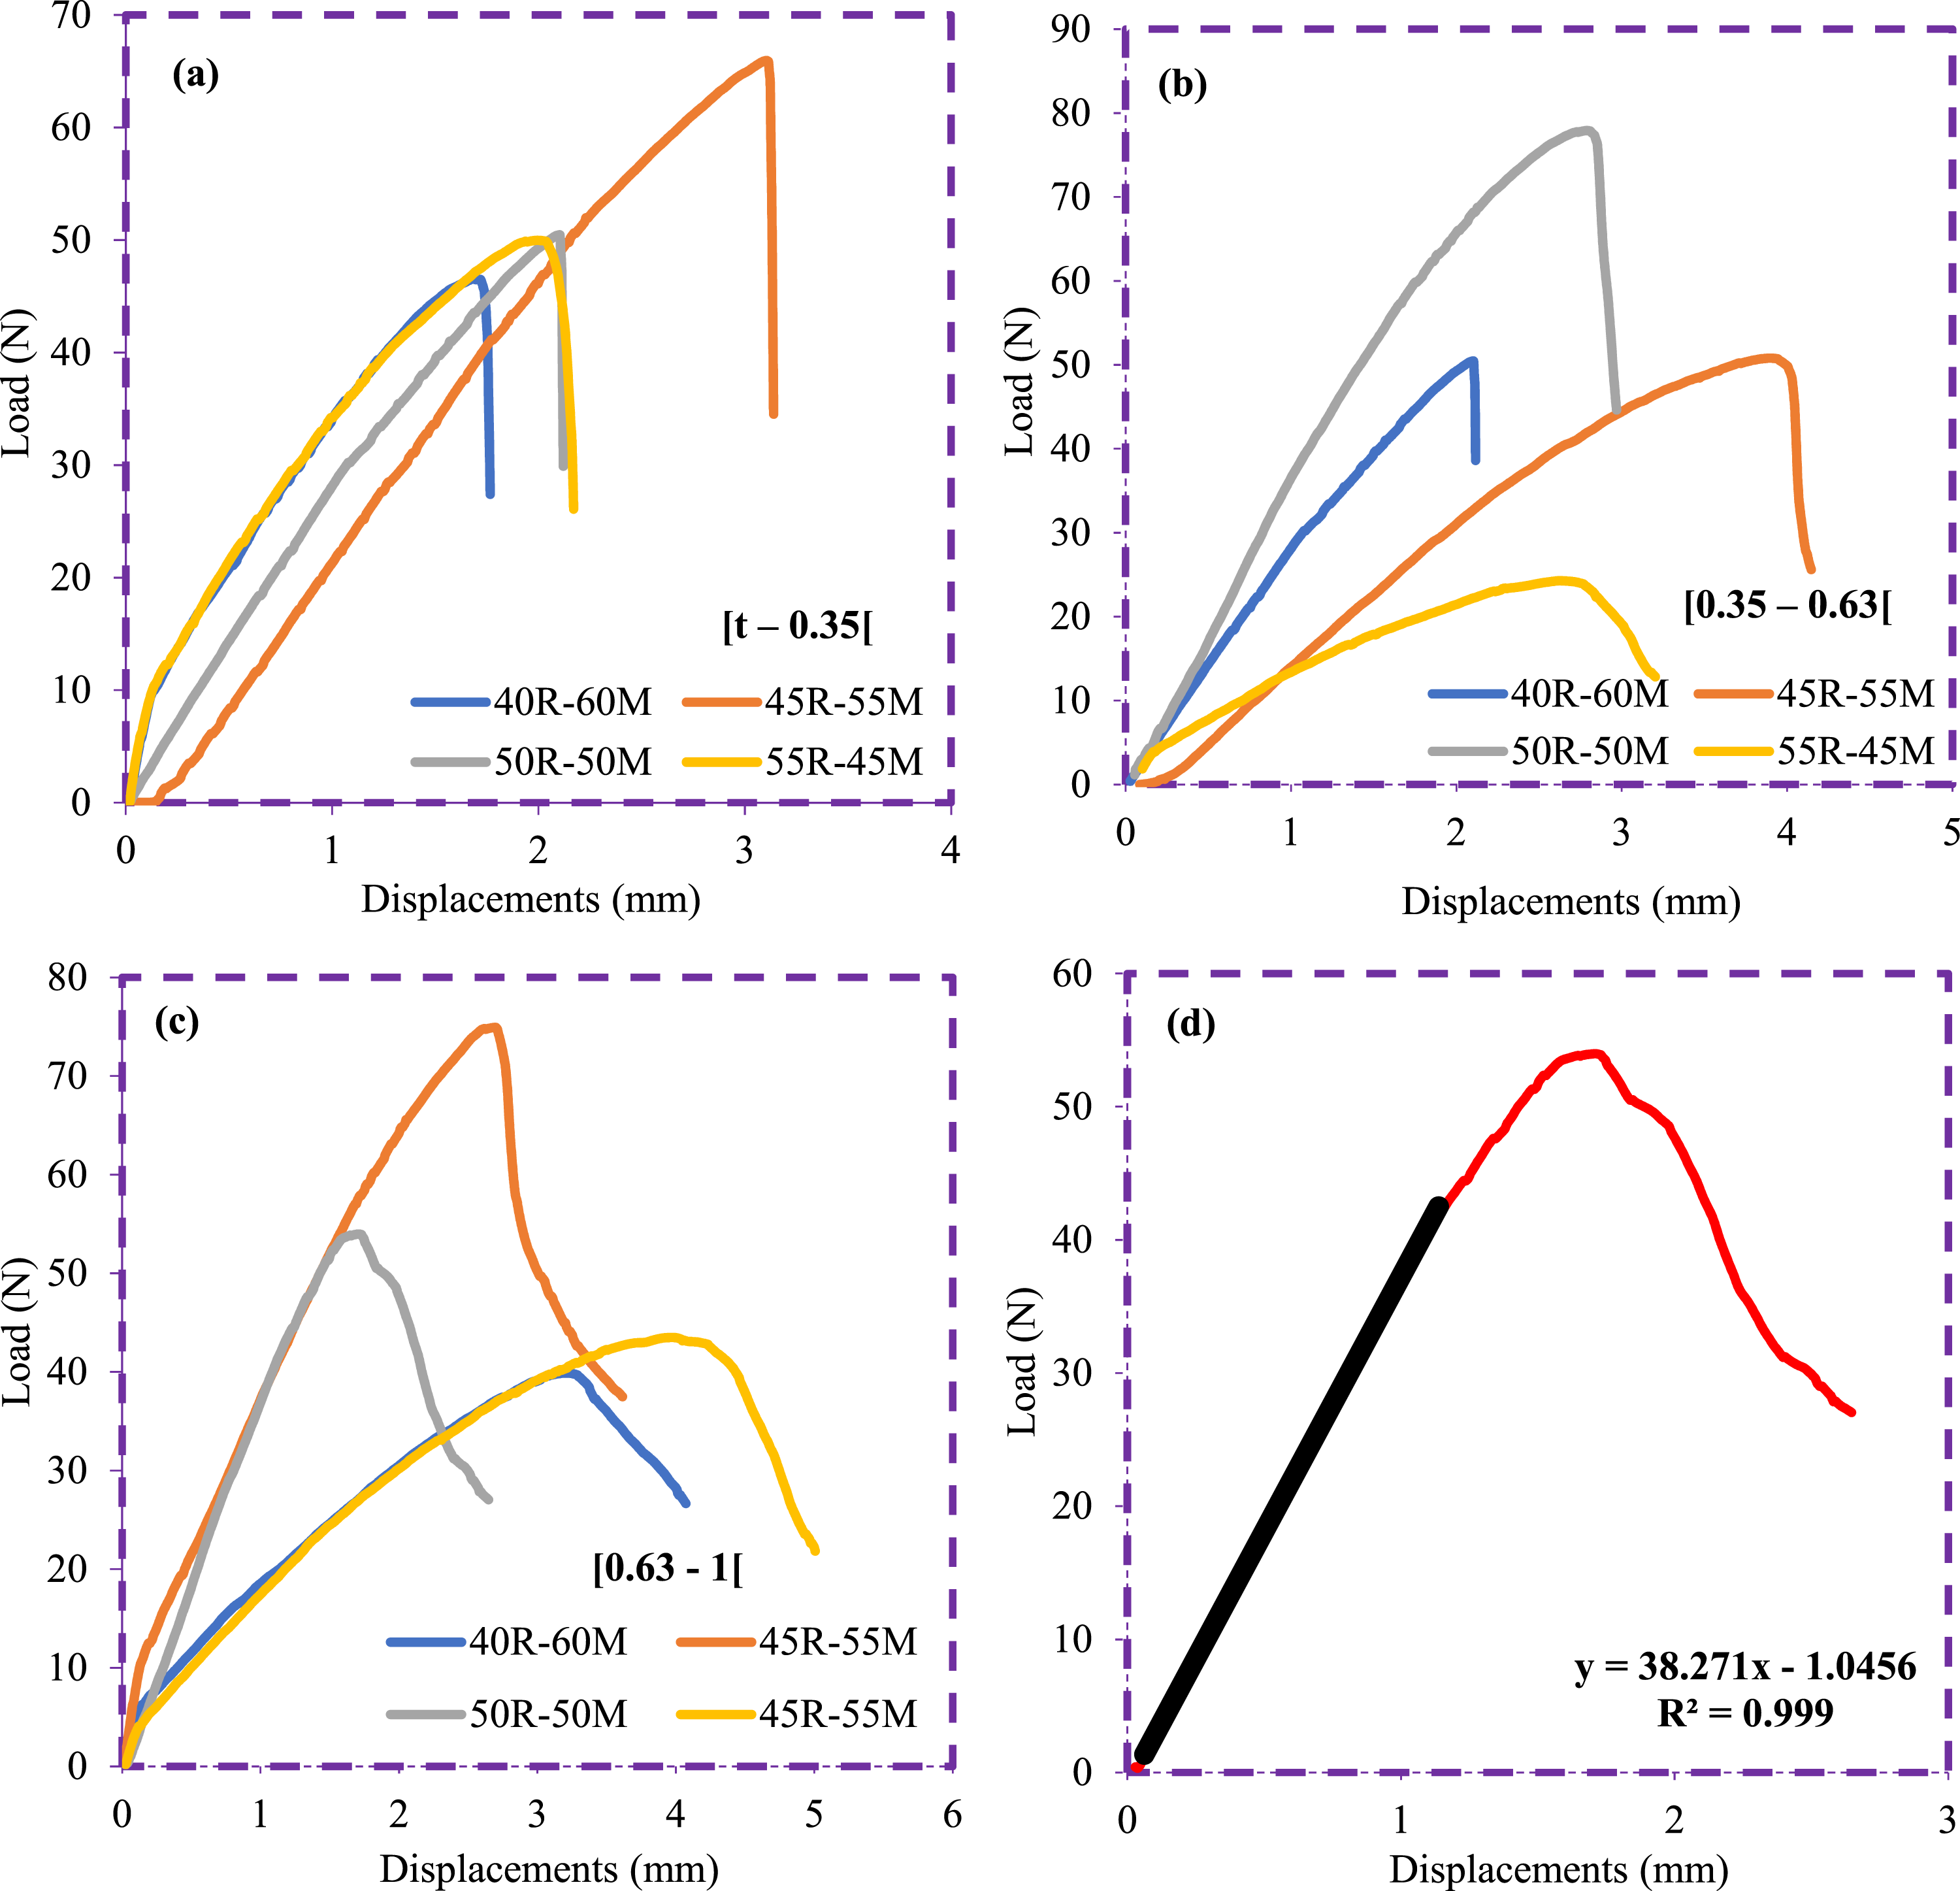
The flexural modulus (Figure 12(a)) varies between 129.29 ± 29 MPa and 530.95 ± 77.7 MPa. The values obtained are lower for composites with large particles [0.63 – 1 [ with a reinforcement rate of 50% and higher for smaller particles [t – 0.35 [ with reinforcement rates of 40, 45 and 50%. The flexural strength (Figure 12(b)) varies between 1.26 ± 0.13 MPa and 6.508 MPa. The values obtained are lower for large particles at a reinforcement rate of 55% and higher for smaller particles at a reinforcement rate of 50%. These results show better cohesion between the small particles and the matrix. Mechanical performance decreases with increasing particle size, which is consistent with the literature.1,4,14,27 Mechanical performance; (a) Flexural modulus; (b) Flexural strength.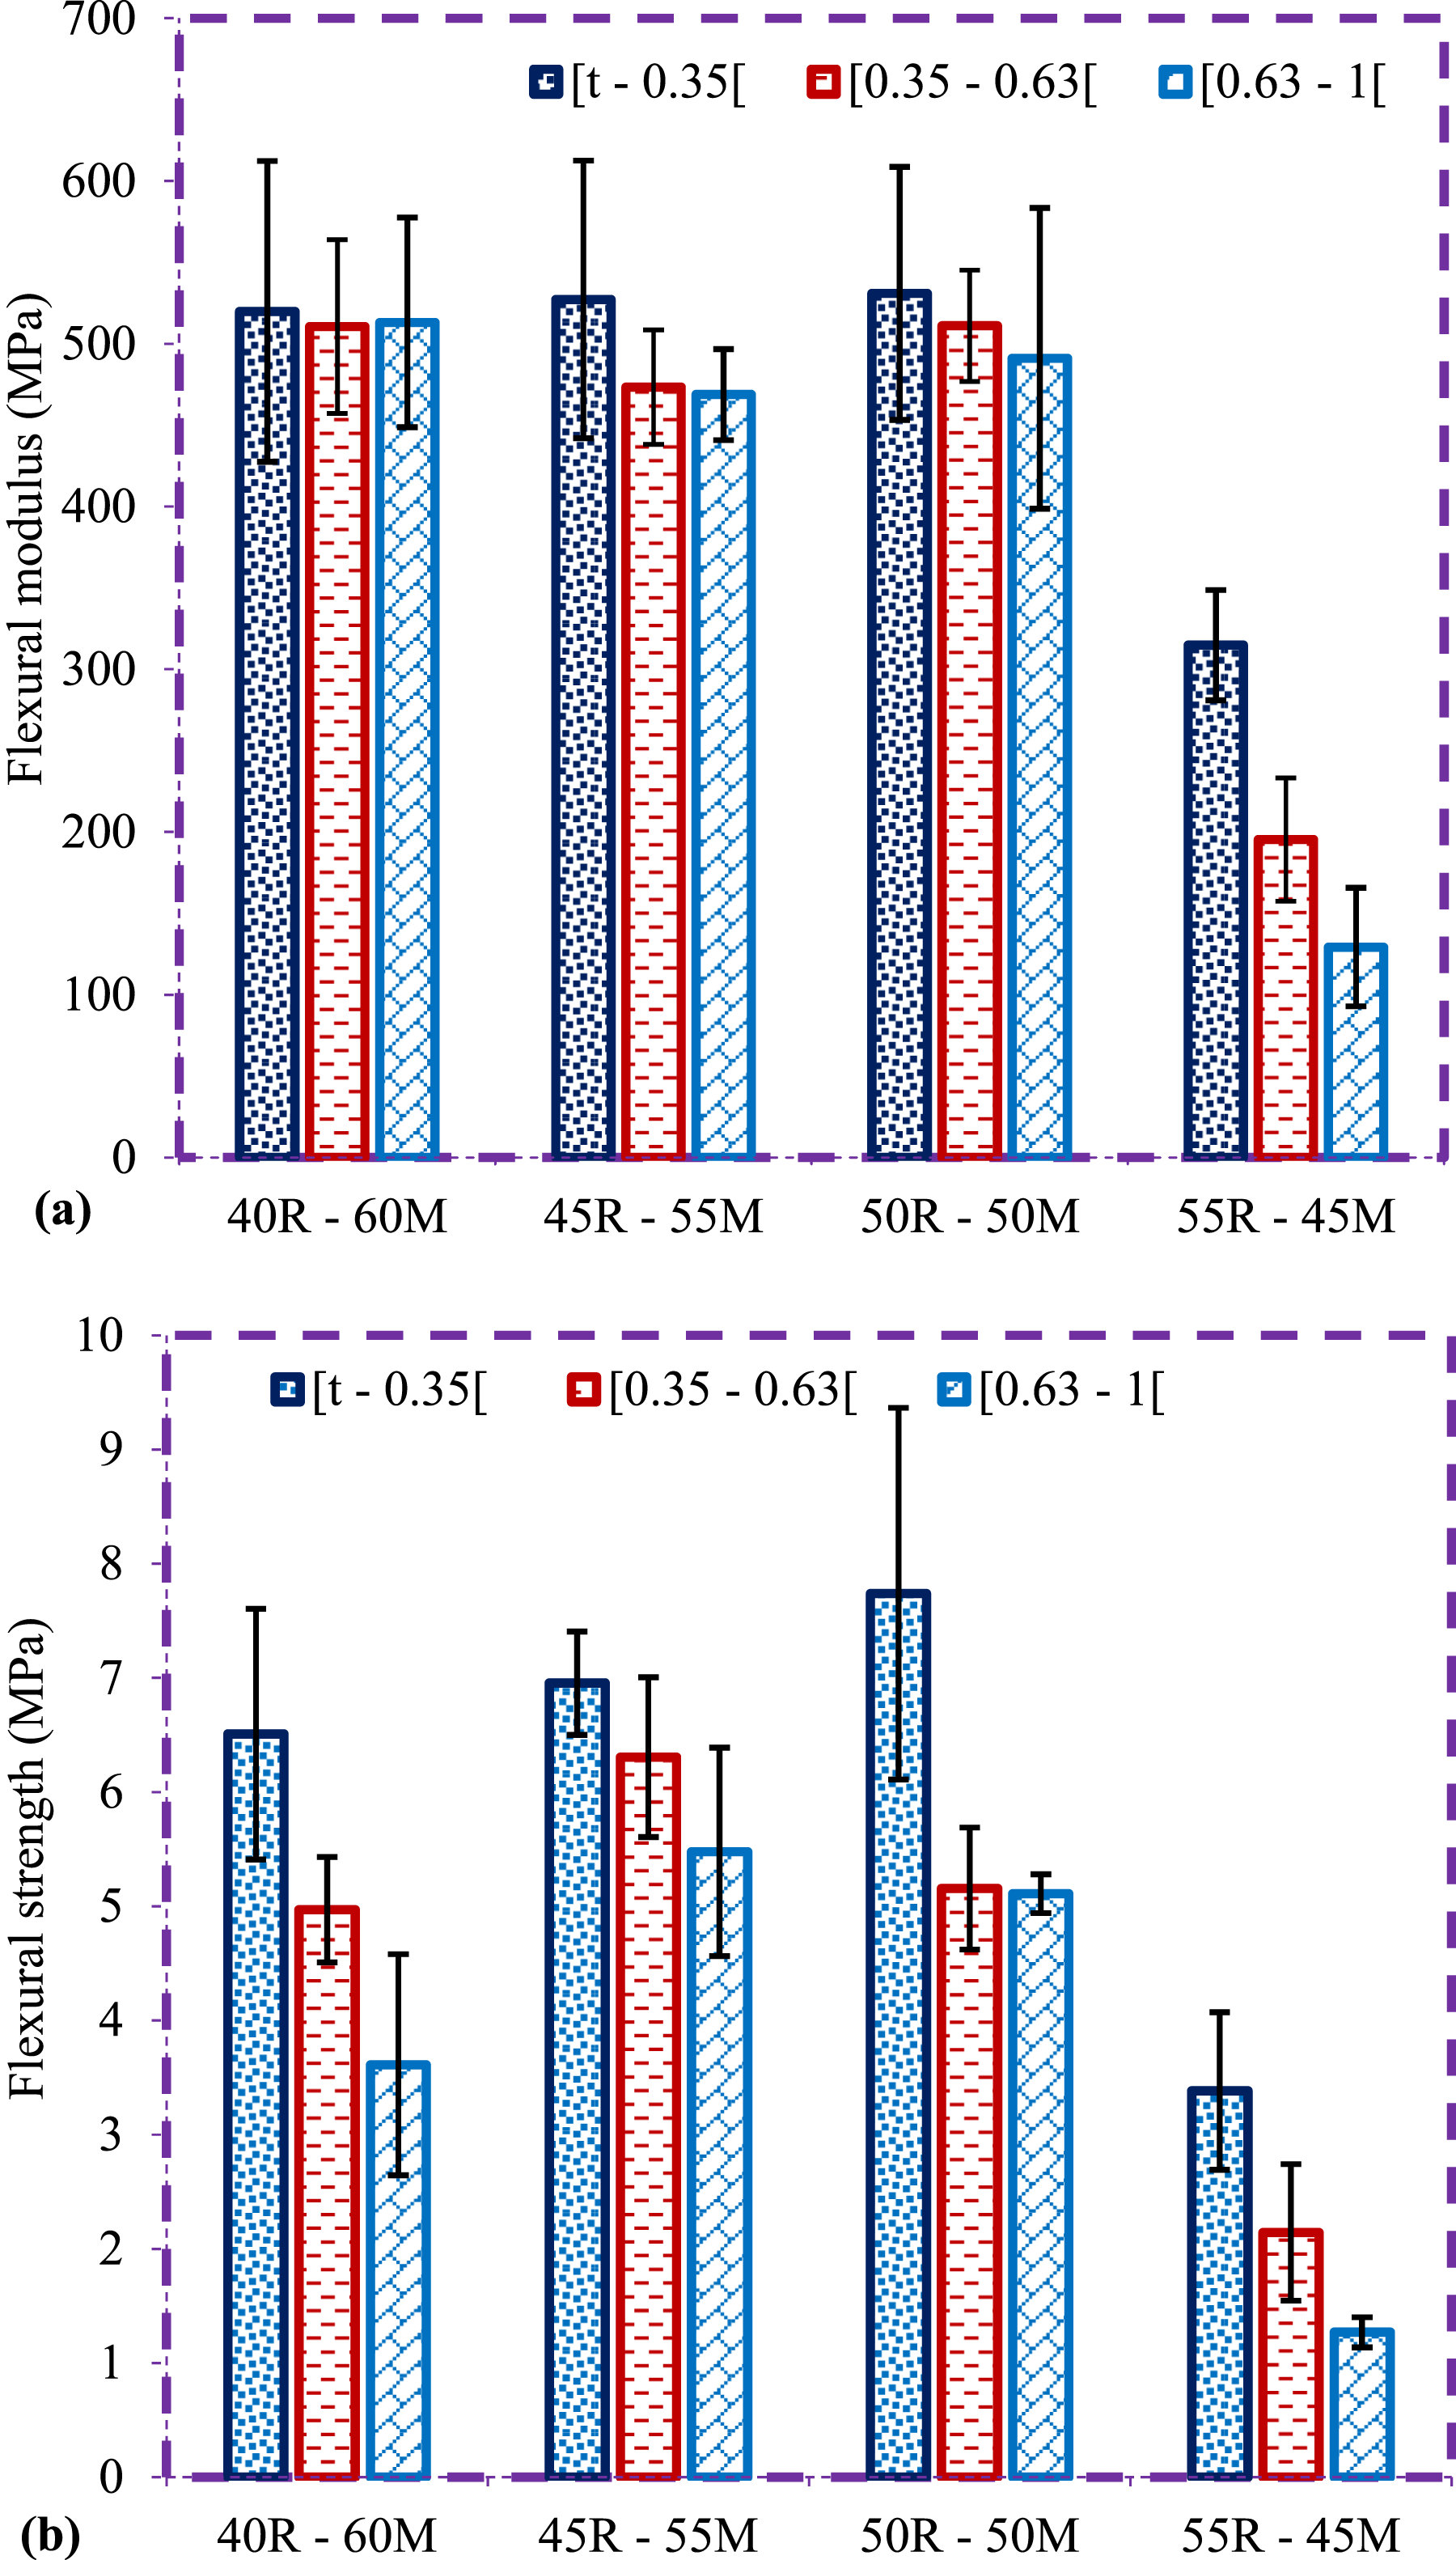
Thermal properties
Thermal conductivity (Figure 13(a)) ranges from 0.22 ± 0.036 W.m-1 K-1 to 0.347 ± 0.003 W.m-1 K-1. Thermal effusivity (Figure 13(b)) ranges from 571.99 ± 33.08 J.m-2.K-1.S-1/2 to 856.778 ± 25.97 J.m-2.K-1.S-1/2. The results for thermal conductivity and thermal effusivity follow the same pattern. Overall, the composites produced remain thermally insulating. The results decrease as the reinforcement size increases. This is due to the porous nature of the coconut husk particles and is consistent with the physical results for density and absorption rate. Similar observations are reported in the literature.
1
The results increase with the addition of reinforcement percentage, which is justified by the fact that the thermal conductivity of polystyrene (0.03 W.m-1.k-1)
22
is lower than that of the reinforcement.1,14,27 This phenomenon is also observed in other composites with wood particles and a polystyrene matrix.
27
The thermal effusivity values are comparable to those of certain tropical woods such as Bilinga (417–662 J.m-2.K-1 S-1/2), Tali (497–647 J.m-2.K-1.S-1/2) and Iroko (407–638 J.m-2.K-1.S-1/2).49,51 Thermal properties; (a) Thermal conductivity; (b) Thermal effusivity.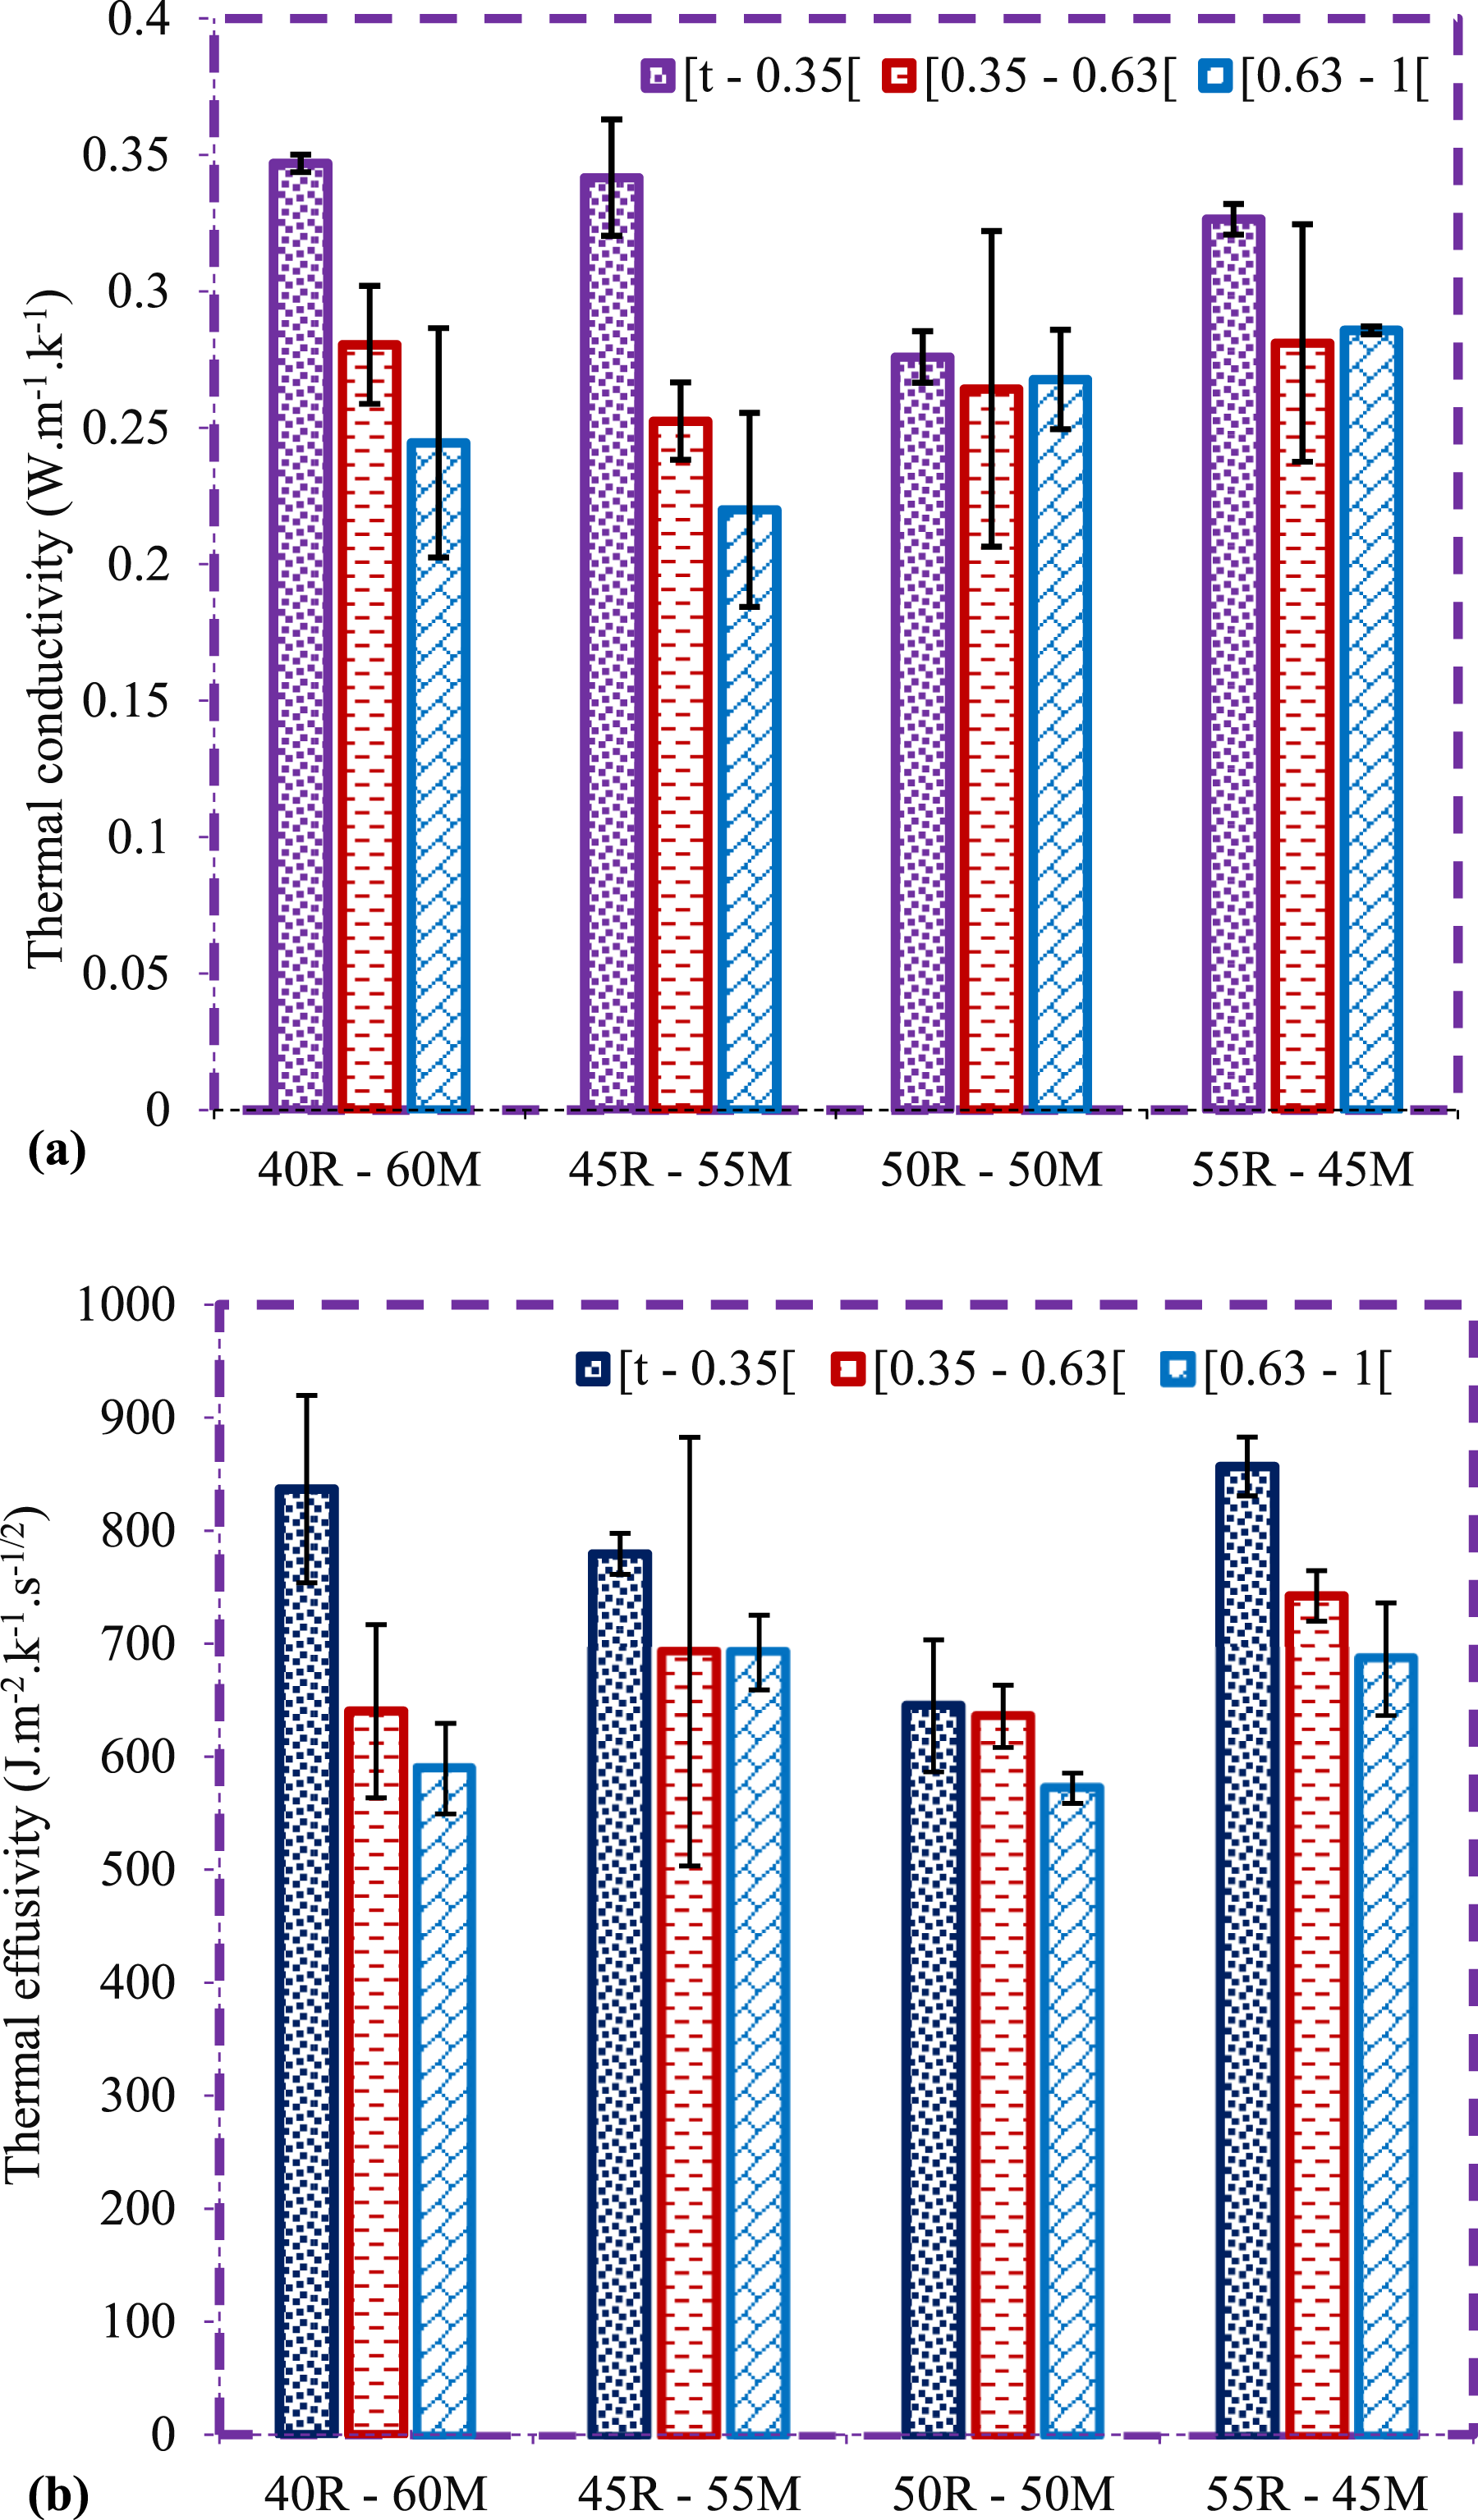
Based on the work carried out, the composites developed show innovative potential in various industrial fields. Table 4 summarises the results obtained, comparing them with those of other researchers who have studied similar or substitute materials. It appears that the density of these composites is in the same range as that of certain tropical woods from Cameroon, such as Talis, Iroko and Bilinga, 42 These materials may therefore constitute a composite alternative for combating deforestation and protecting the environment. The density values observed are comparable to those of commercially available composites classified as medium density (450 ≤ ρ ≤ 800), which are mainly used in the manufacture of furniture and fibreboard or structures. 13 These composites are of the same order of magnitude as those produced by Mbou and al., 1 Takoumbe and al., 4 Malti and al., 61 and Masri and al., 14 However, their mechanical performance remains inferior to that of natural woods49,51 and certain composites.27,62 In terms of thermal conductivity, the measured values remain lower than those of softwoods and natural woods, while being comparable to those of other natural wood species.49,51 Nevertheless, the composites developed retain their thermal insulation properties. 63
Levene’s test of equality of error variances.
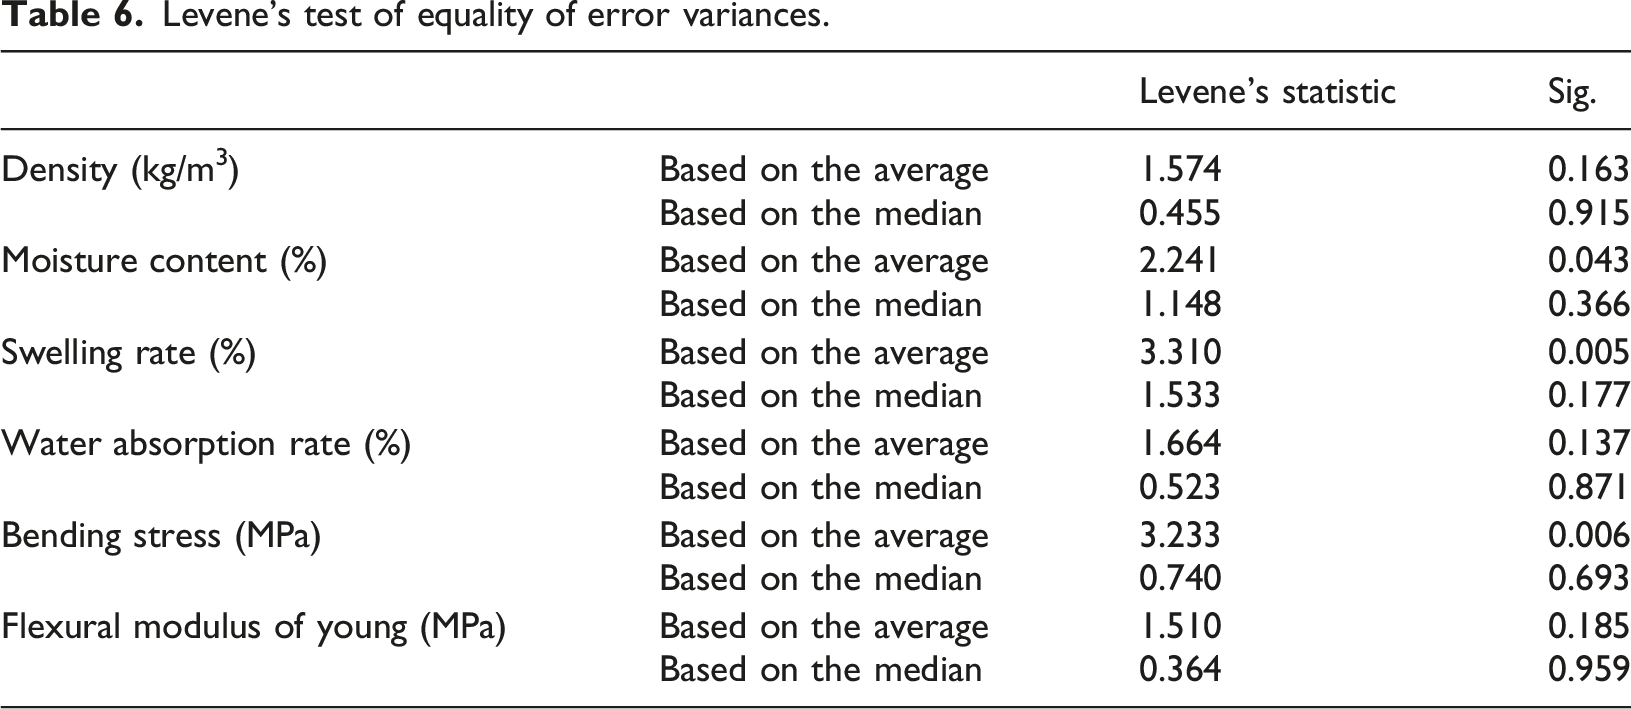
Multivariate analysis (Table 6) revealed that particle size and reinforcement ratio have a significant effect (p < 0.05) on most of the properties studied. The influence is particularly marked on flexural stress, with high F values (F = 58.03 for reinforcement and F = 30.87 for particle size) and high partial coefficients of determination (η2 = 0.866 and 0.696 respectively), reflecting a major contribution of these factors to the mechanical reinforcement of the composite.
Test of inter-subject effects.
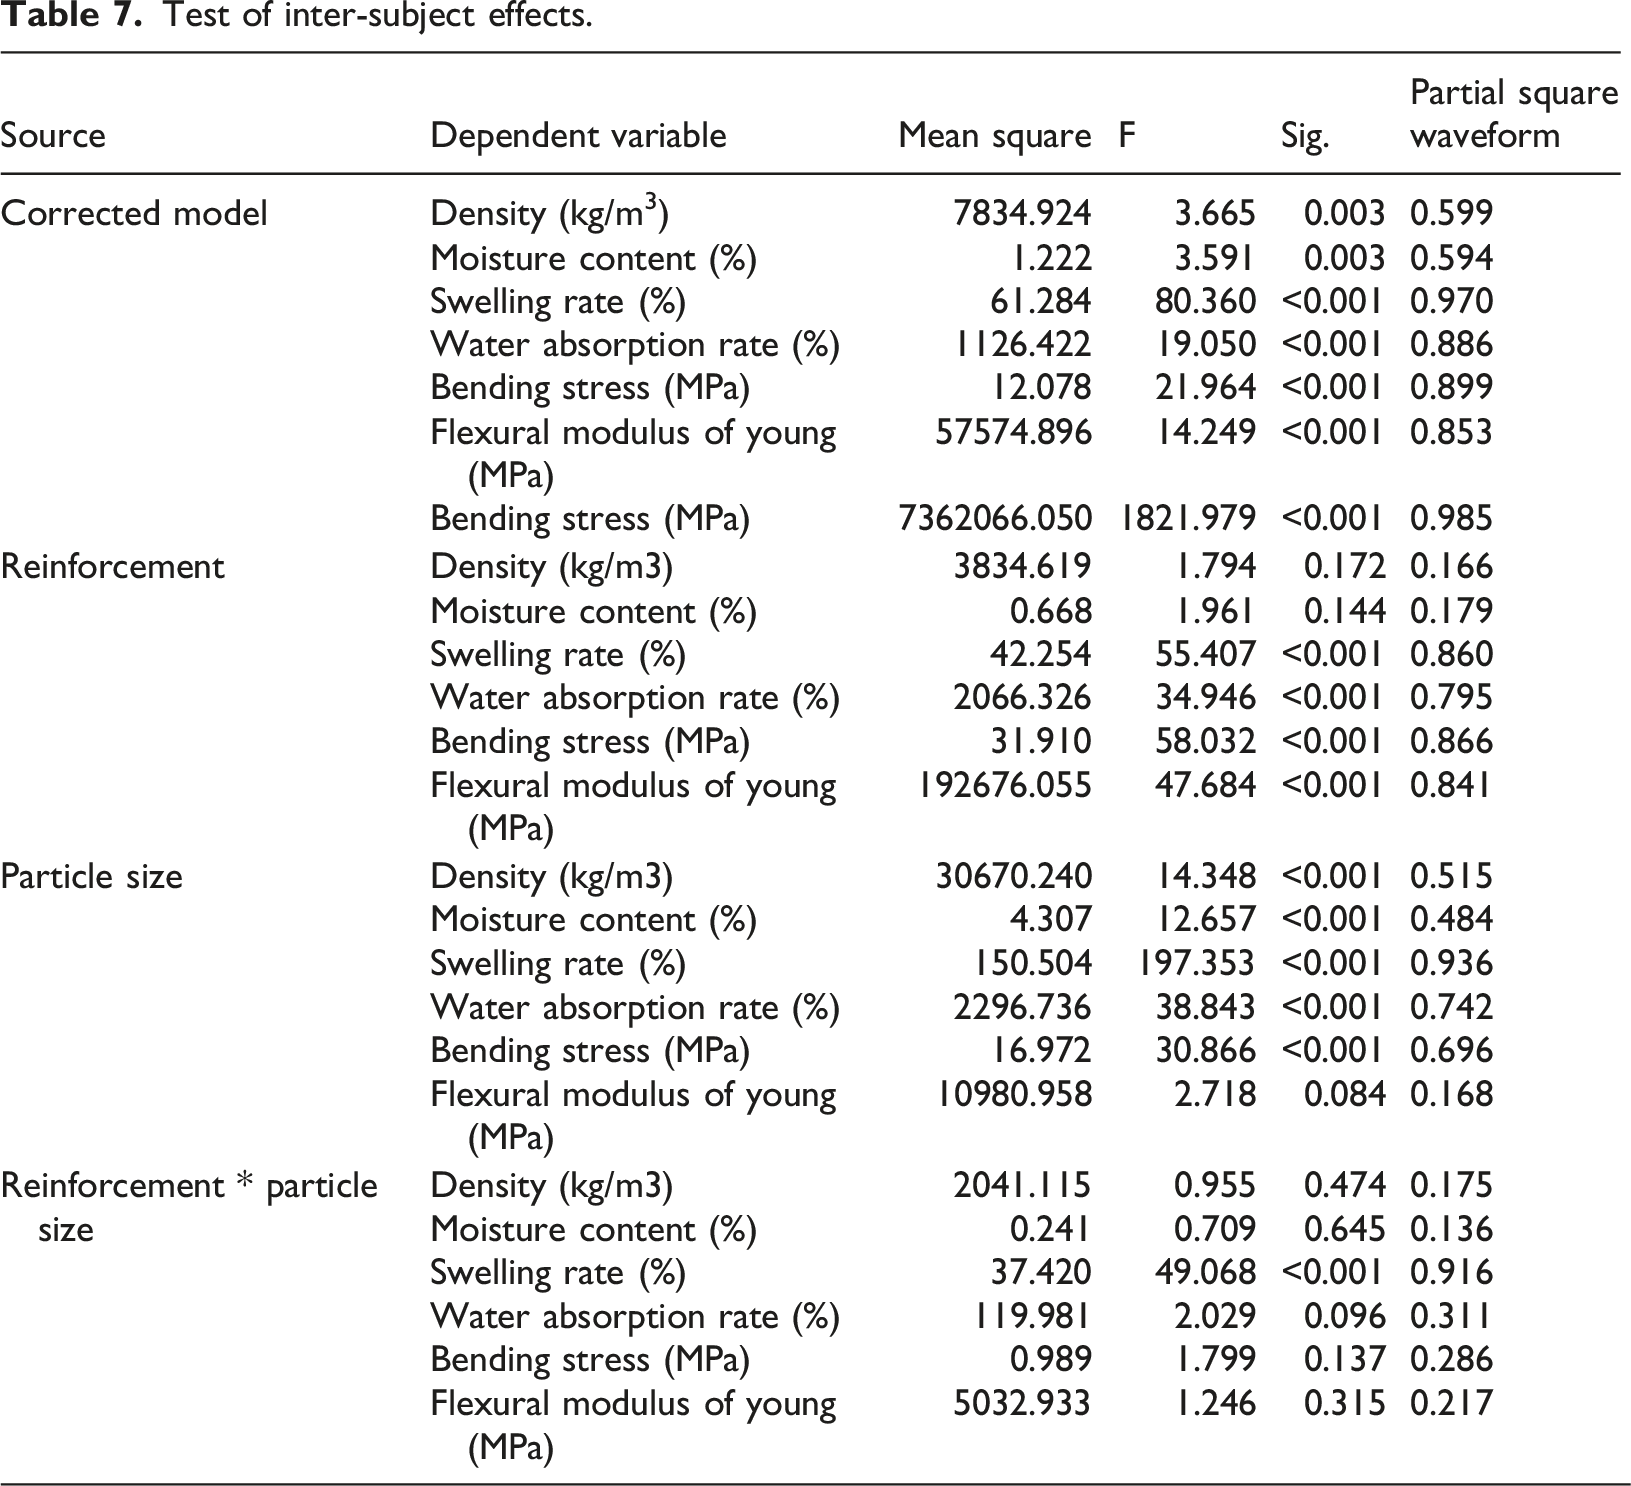
The water properties are also sensitive to the factors studied. The water absorption rate is significantly influenced by both particle size (F = 38.84; η2 = 0.742) and reinforcement (F = 34.95; η2 = 0.795), highlighting a strong dependence on formulation parameters. Similarly, the swelling rate shows very marked effects for particle size (F = 197.35; η2 = 0.936), reinforcement (F = 55.41; η2 = 0.860), and their interaction (F = 49.07; η2 = 0.916), confirming the extreme sensitivity of this property to both factors and their combination.
With regard to density and moisture content, the results show a significant effect of particle size (F = 14.35; η2 = 0.515 for density and F = 12.66; η2 = 0.484 for moisture content), while the effect of reinforcement remains insignificant (p > 0.05). The interaction between reinforcement and particle size also has no significant influence on these two properties.
Finally, the interaction analysis shows that only the swelling rate is significantly affected by the combination of reinforcement and particle size (F = 49.07; p < 0.05; η2 = 0.916), reflecting a strong synergy between the two factors on this parameter. However, no significant interaction was observed for the other properties, suggesting that their evolution is mainly determined by the independent effects of the factors studied.
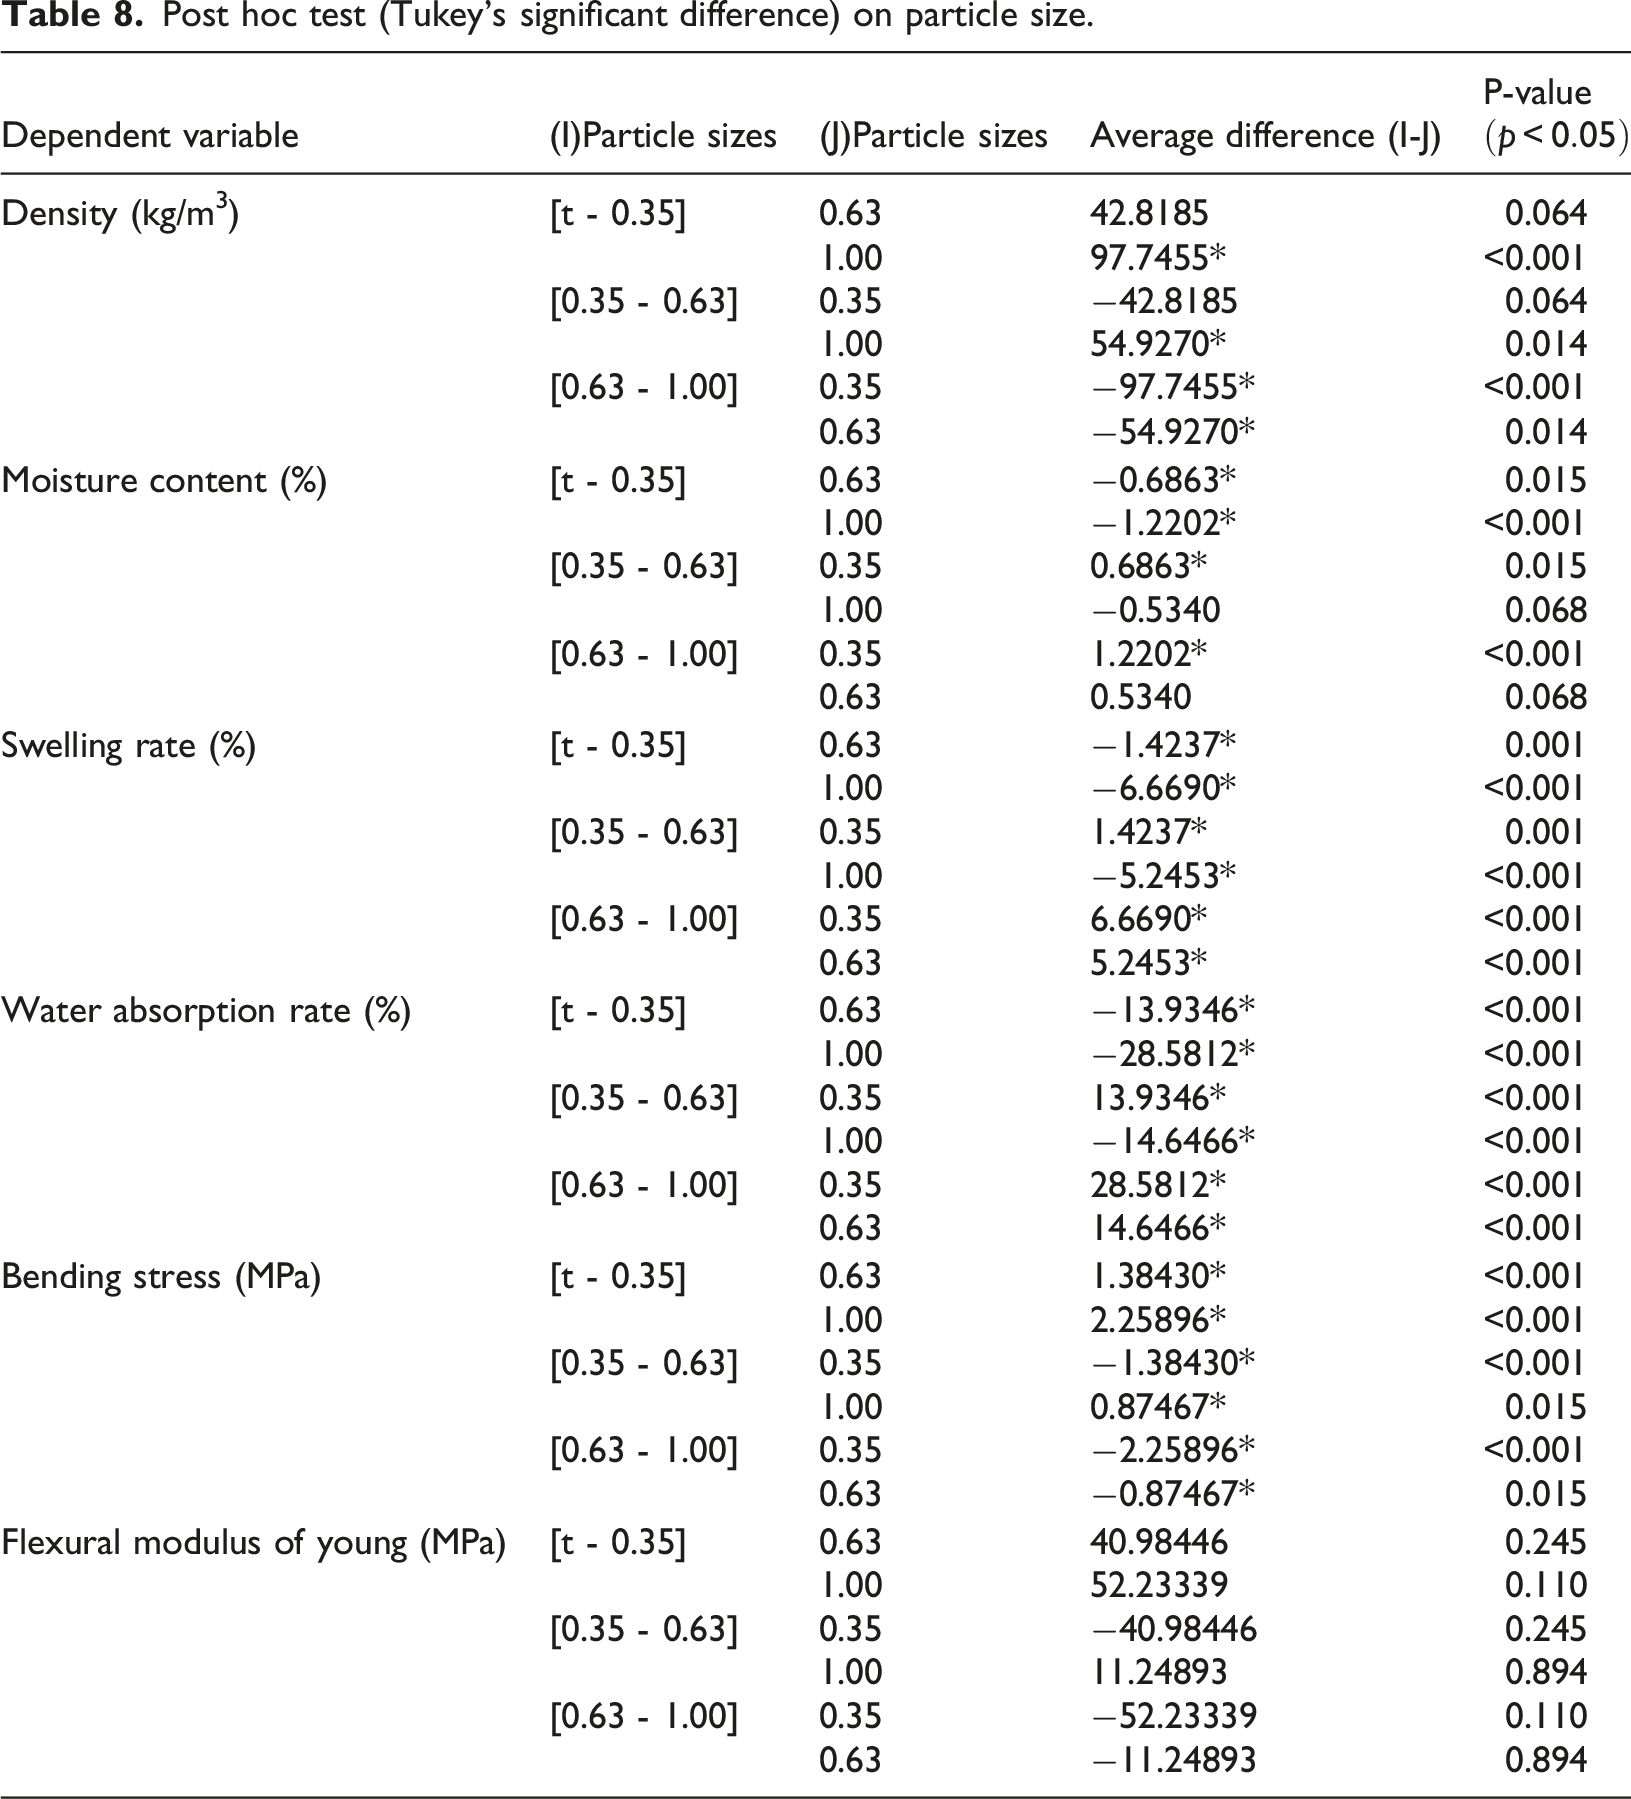
Post hoc test (Tukey’s significant difference) on particle size.
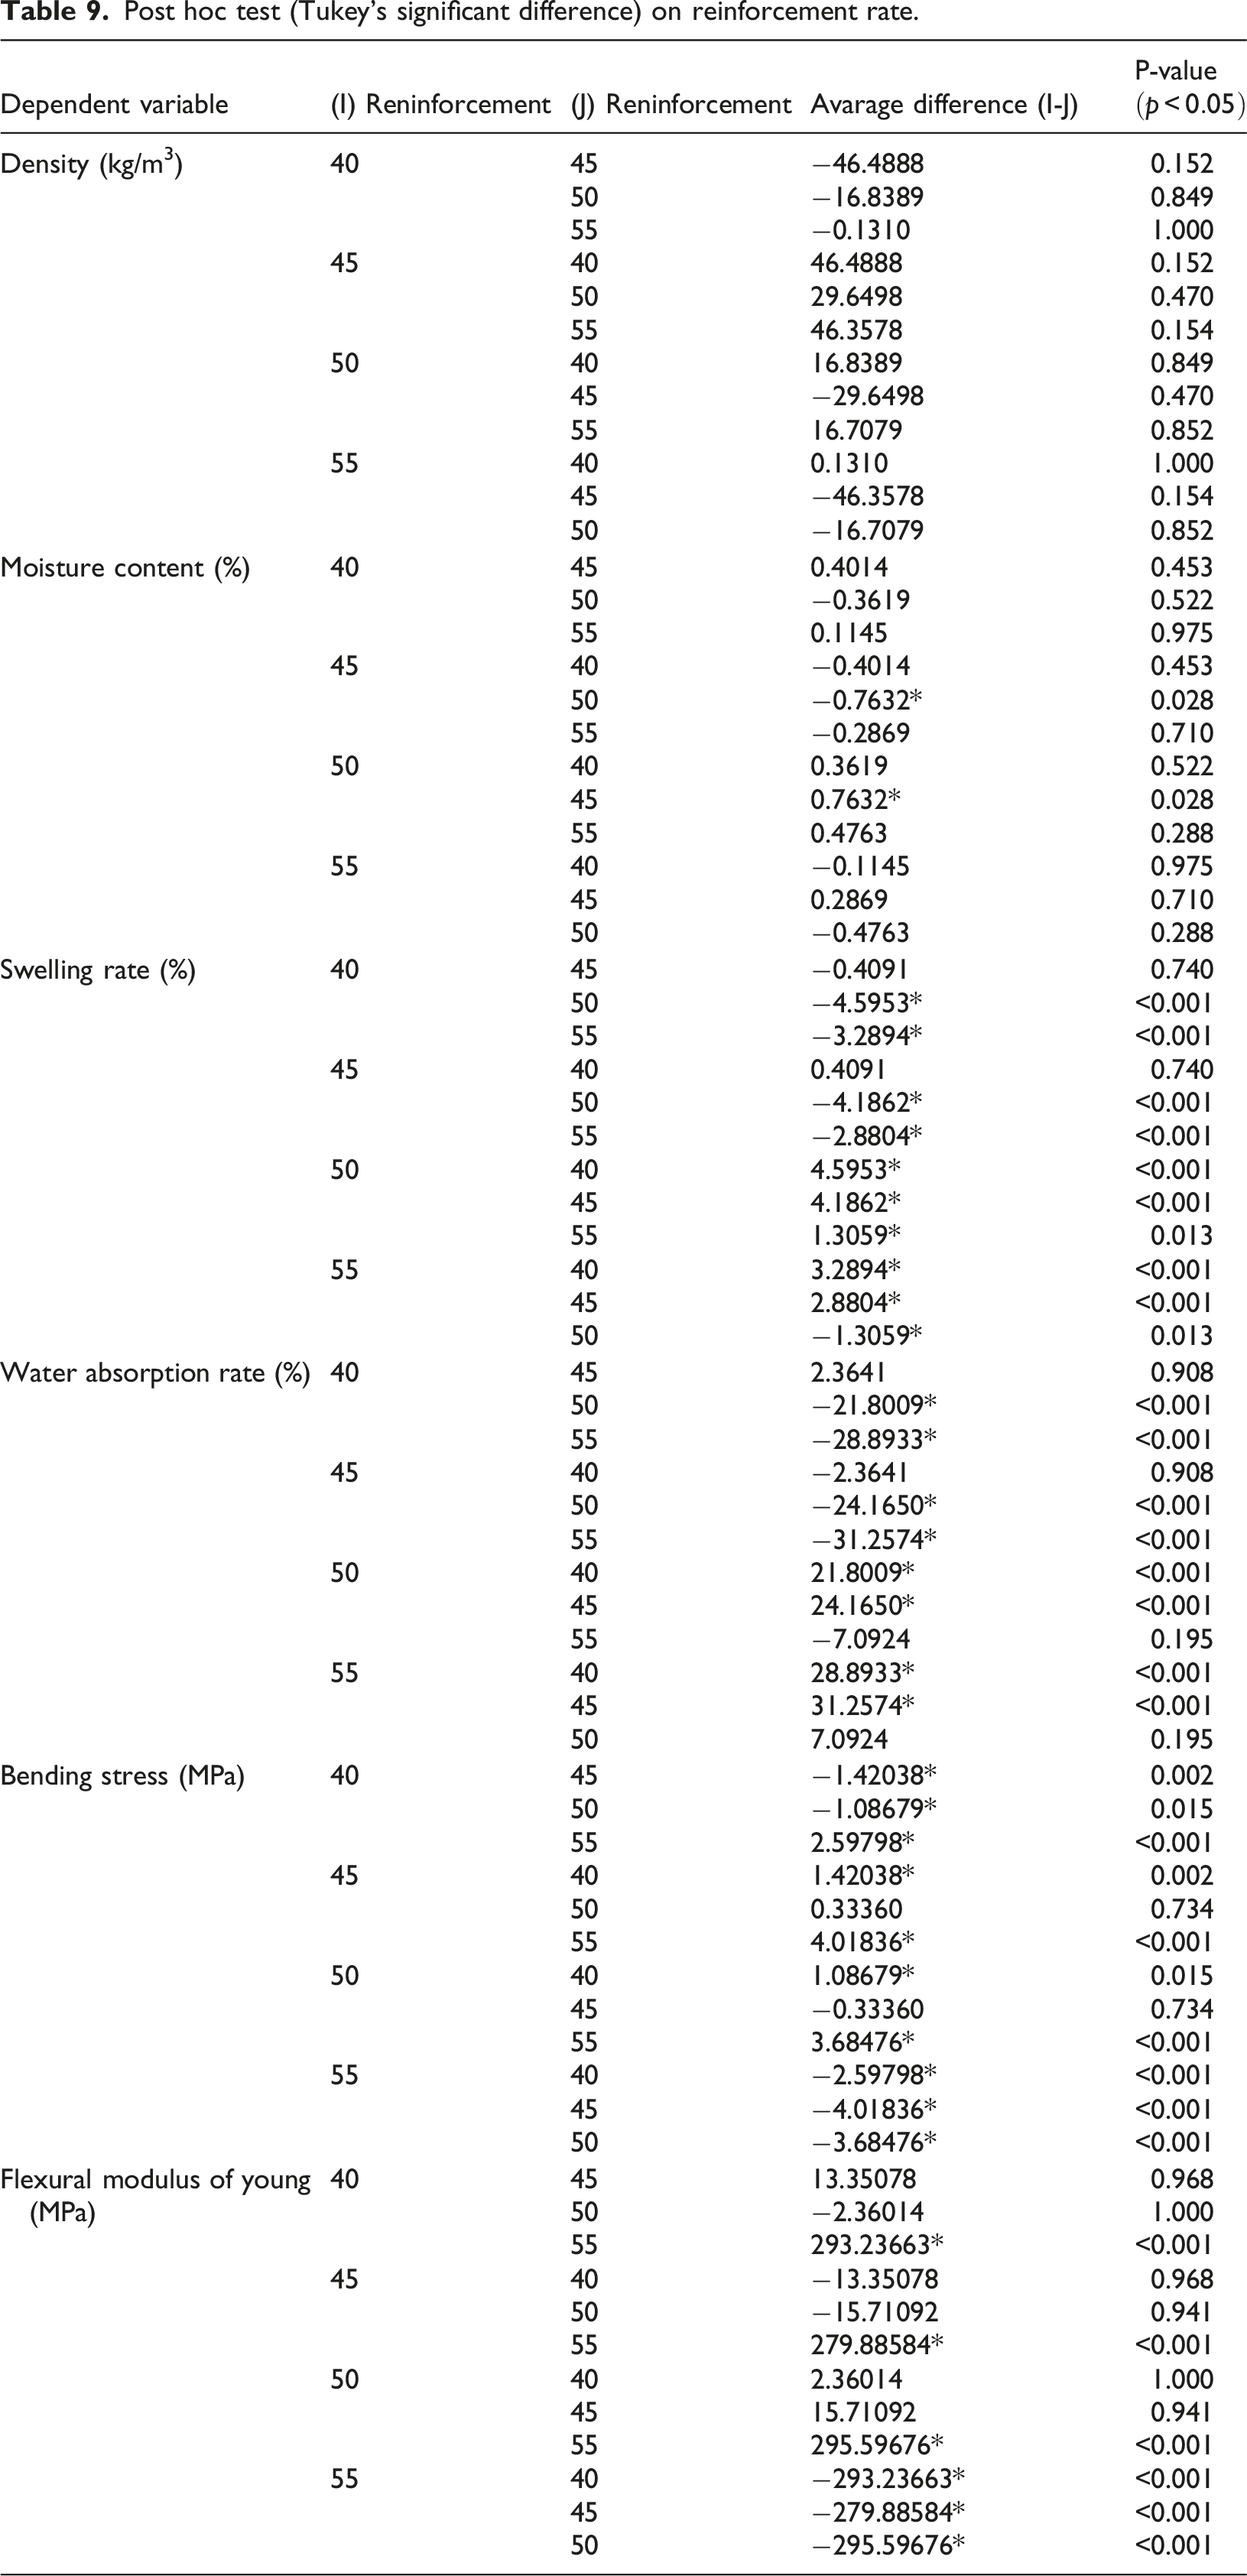
Post hoc test (Tukey’s significant difference) on reinforcement rate.
With regard to the effect of particle size, for density, significant differences were observed between [t – 0.35 [and 1.00 mm (Δ = 97.75; p < 0.001) and between [0.35 – 0.63 [and 1.00 mm (Δ = 54.93; p = 0.014), indicating more pronounced densification for the coarsest particles.
The moisture content decreases significantly between [t – 0.35 [and the larger sizes (Δ = −0.69 to – 1.22; p < 0.05), suggesting better water retention for fine particles.
The swelling rate shows very significant effects between all particle sizes (p < 0.001), confirming that particle size strongly influences the water behaviour of the material.
Similarly, the water absorption rate differs significantly between all sizes (p < 0.001), with increasing absorption for the coarsest particles.
With regard to flexural stress, all comparisons are significant (p < 0.05), with strength decreasing as particle size increases. However, no significant difference was observed for Young’s modulus (p > 0.05), confirming the limited role of particle size on the stiffness of the material.
With regard to the reinforcement rate, there were no significant differences in density and water content between reinforcement levels (p > 0.05), with the exception of the effect observed between 45% and 50% for water content (Δ = −0.76; p = 0.028).
The swelling rate increases significantly with increasing reinforcement, particularly between 40% and 50% (Δ = −4.60; p < 0.001) and between 40% and 55% (Δ = −3.29; p < 0.001). This suggests better dimensional stability at lower reinforcement rates.
The water absorption rate follows the same trend: highly significant differences are observed between 40% and higher levels (p < 0.001), reflecting a notable increase in absorption with increased reinforcement.
The bending stress varies greatly depending on the reinforcement levels. The differences are significant between 40% and 45% (Δ = −1.42; p = 0.002), between 40% and 55% (Δ = 2.60; p < 0.001) and between 50% and 55% (Δ = −3.68; p < 0.001). These results confirm the mechanical contribution of reinforcement, which is particularly marked at 55%).
Finally, Young’s modulus shows significant differences only between 55% and the other levels (p < 0.001), confirming that stiffness increases significantly only at maximum reinforcement levels.
Conclusion
This study demonstrates the possibility of producing a new material using coconut fibre particles as reinforcement and polystyrene waste dissolved in chloroform as a binder. The composites were produced by manual pressing with four reinforcement ratios and three reinforcement sizes. The density, absorption rate, swelling rate and moisture content classify it as lightweight and suitable for use in dry and humid areas, with the exception of the formulation with a reinforcement rate of 55%. The thermal characteristics classify the material as a thermal insulator. The mechanical performance is lower than that of natural wood and softwood. Microscopic visualisation shows better interfacial cohesion with low visible porosity for the lowest particle and reinforcement rates. The composites produced can be used innovatively in various fields such as furniture manufacturing, false ceilings, partitioning materials in housing construction, thermal insulation materials and non-structural materials such as telephone booth doors and computer stands. Mechanical performance can be improved by developing multilayer materials, hybrid materials or by reducing the hydrophilic nature of the particles through chemical treatment. FTIR and ATG tests should be considered to understand the bonds created between the particles and the matrix, as well as the service temperature or thermal stabilisation temperature.
Footnotes
Acknowledgements
The authors would like to thank the LAMMA Laboratory and Civil Engineering Department of ENSET at the University of Douala, which contributed to the development of the tests that led to this manuscript. The authors are particularly grateful to Bitete Richard Hervé, Tatchum Ulrich Martial, and Metang Landry, Edu Mba, who contributed to the physical, mechanical, and thermal testing.
Funding
The authors received no financial support for the research, authorship, and/or publication of this article.
Declaration of conflicting interests
The authors declared no potential conflicts of interest with respect to the research, authorship, and/or publicationof this article.
Data Availability Statement
The data will be made available upon request.