
Abstract
This article presents the results from exploring the impact of using a parametric design tool on designers’ behavior in terms of using design patterns in the early conceptual development stage of designing. It is based on an empirical cognitive study in which eight architectural designers were asked to complete two architectural design tasks with similar complexity, respectively, in a parametric design environment and a geometric modeling environment. The protocol analysis method was employed to study the designers’ behavior. In order to explore the development of design patterns in the empirical data, Markov model analysis is utilized. Through Markov models analysis of the parametric design environment and geometric modeling environment results, it was found that there are some significantly different design patterns being used when designing in a parametric design environment compared to designing in a geometric modeling environment. The article articulates these differences and draws conclusions from these results.
Introduction
Parametric design has become increasingly prevalent in architectural design. However, there is a lack of empirical evidence supporting an understanding of designers’ behavior in parametric design environments (PDEs). In a PDE, designers often adopt existing design patterns based on their experience in using their design knowledge and in using parametric tools. This phenomenon has not been adequately studied and evaluated in architecture design. To improve our understanding of the possible use of design patterns while designing, the results of a cognitive study in which designers were asked to complete two architectural design tasks with similar complexity, respectively, in a PDE and a geometric modeling environment (GME) are presented. Protocol analysis1,2 was employed to study the designers’ behavior. Utilizing a technique that finds patterns in sequential data (Markov model analysis), the results of how designers use design patterns in the PDE are presented and discussed. The remainder of this article introduces the background to the study briefly covering parametric design and design ontologies before proceeding to describe the research design and results. This is followed by a section that presents an analysis of the results in terms of empirically grounded design patterns. The article ends with a brief discussion of the implications of the results of this study.
Background
Parametric design
Parametric design is a dynamic, rule-based process controlled by variations and parameters, in which multiple design solutions can be developed in parallel. According to Woodbury, 3 it supports the creation, management, and organization of complex digital design models. By changing the parameters of an object, particular instances can be altered or created from a potentially infinite range of possibilities. 4 The term “parameters” means factors which determine a series of variations. In architecture, parameters are usually defined as building variables or environmental factors. In the architectural design profession, parametric design tools are utilized mainly on complex building form generation, multiple design solution optimization, as well as structural and sustainability control. Currently, typical parametric design software includes Generative Component from Bentley Corporation, Digital Project from Gehry Technologies, and Grasshopper from McNeel. Scripting tools include Processing based on the Java language, Rhino script, and Python script, based on Visual Basic (VB) language from McNeel. In this study, Grasshopper was chosen as the PDE. Grasshopper is both an advanced environment for facilitating conceptual design and is in relatively wide-spread use in the architectural profession.
Previous studies on designers’ behaviors in PDEs suggest that parametric tools advance design processes in a variety of ways. For instance, there is evidence that the generation of ideas is positively influenced in PDEs. In Iordanova et al.’s 5 experiment on generative methods, ideas were shown to be generated rapidly while they also emerge simultaneously as variations. Schnabel 6 showed that PDE is beneficial for generating unpredicted events and can be responsible for accommodating changes. However, researchers have typically studied design behavior in PDE mostly by observing students interactions in PDEs in design studios or workshops. Arguably, this approach cannot provide an in-depth understanding of professional designers’ behaviors. This empirical gap is addressed in this study by adopting the method of protocol analysis to produce empirical results. In 2014, Lee et al. 7 presented a pilot study using protocol analysis to evaluate creativity in PDEs. Results from their study identified some conditions that potentially enhance creativity in the PDE. Using the same method, Chien and Yeh 8 explored “unexpected outcomes” in a PDE. However, without a basis for comparison, it is difficult to suggest how parametric tools enhance or hinder creativity in comparison with traditional design methods. In order to allow results to be compared, they need to be grounded in the same representation. In empirical studies, it is common to develop a representation for the results that is uniquely shaped to the experiment. The disadvantage of that approach is that it does not allow comparisons with other studies. In order to overcome that disadvantage, this study employs a widely used design ontology as the basis of its representation.
Function–Behavior–Structure ontology
As one of the main design ontologies, Gero’s 9 Function–Behavior–Structure (FBS) model has been applied in many cognitive studies.10–13 Researchers argue that it is potentially capable of capturing most of the meaningful design processes, 13 and the transitions between design issues are clearly classified into eight design processes. The FBS ontology contains three classes of variables, called design issues: Function (F), Behavior (B), and Structure (S). Function (F) represents the design intentions or purposes of the artifact being designed; behavior (B) represents the behavior derived (Bs) or expected from the structure (Be) of the artifact; and structure (S) represents the components that make up an artifact and their relationships. The model includes two external design issues: requirements (R) and descriptions (D). The first of these represents design issues that come from outside design, commencing with those articulated by the client, and the second, descriptions, is any documentation of the design. These two additional design issues can be expressed in terms of F, B, or S and do not require an expansion of the ontology. Transitions between design issues are design processes and do not require a separate ontology as they are directly derivable from the FBS ontology. Figure 1 presents the FBS ontology indicating the eight design processes—formulation, analysis, evaluation, synthesis, documentation, and three reformulations I, II, III. Among the eight design processes, the three types of reformulation processes are suggested to be the dominant processes that potentially capture innovative or creative aspects of designing by introducing new variables or new directions. 12 The FBS ontology is claimed to be a universal coding scheme for various design environments. 13 In this study, the FBS ontology was used as the model for developing the coding scheme in the protocol study that was used to capture and produce behavioral data of designers as they are designing. The FBS ontologically based coding scheme consists of the six design issues of requirements (R), function (F), expected behavior (Be), structure (S), behavior from structure (S), and description (D).
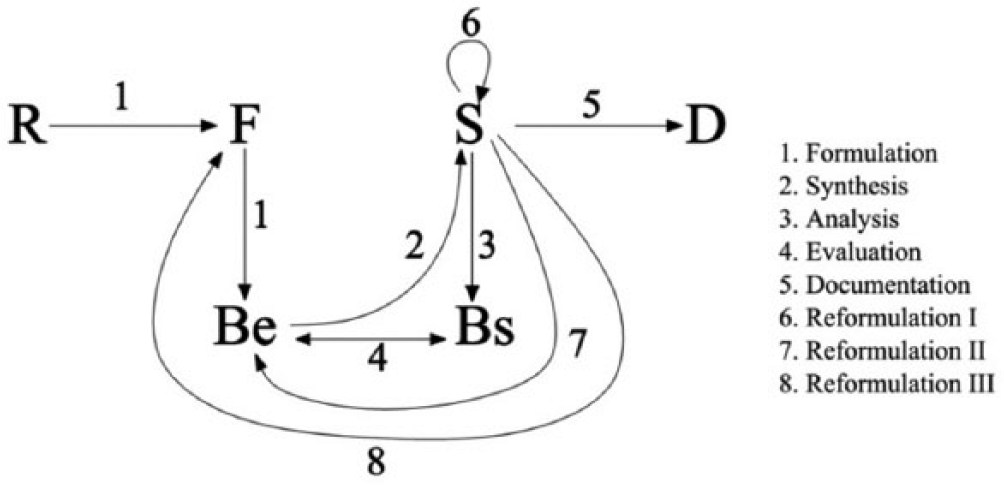
The FBS ontology. 14
Research design
Research method—protocol analysis
Protocol analysis is a method for turning qualitative verbal and gestural utterances into data.1,2 It has been used extensively in design research to develop an understanding of design cognition.12,15,16 According to Akin, 17 a protocol is the record of behaviors of designers using sketches, notes, videos, or audio. After collecting the protocol data, a coding scheme is applied to categorize the collected data, enabling detailed study of the design process in the chosen design environments. As Gero and Tang 18 state, protocol analysis has become the prevailing experimental technique for exploring the understanding of design.
Usually in protocol analysis, concurrent and retrospective protocol collection methods can be applied in design experiments.1,19 A concurrent protocol involves participants in an experiment verbalizing their thoughts when working on a specific task—also called the “think aloud” method—whereas a retrospective protocol explores what designers were thinking while designing, a process which is applied as soon as they have finished the design task. Some studies have compared these two protocol collection methods. For instance, Kuusela and Pallab 20 argue that concurrent protocols are more suitable for examining the design process and can generate larger numbers of segments, while retrospective protocols are more suitable for examining design outcomes. Another example of this comparison is Gero and Tang’s 18 study exploring design processes. Their results show that concurrent and retrospective protocols lead to very similar outcomes in terms of exploring designers’ intentions during design processes. But they also conclude that concurrent protocols are an efficient and applicable method by which to understand design processes. Retrospective protocols are commonly believed to be less intrusive to the design processes.
Importantly, protocol analysis of this type deals with a relatively small number of samples, but it enables an in-depth exploration of the samples. Thus, a study of the cognitive behavior of eight designers is both acceptable and in keeping with past research in this field because of the quality and depth of information that is recorded and analyzed. However, for this reason, we also cannot generalize the results of this research to describe the actions or behaviors of a much larger population of designers. Nevertheless, from such studies, important patterns, which are repeated by designers, can be used to provide an increased level of understanding of the design process.
Experiment setting
Eight designers participated in the experiment, each of whom was a professional architect with an average of 8 years of experience in architectural design, and no less than 2 years of experience using parametric design.
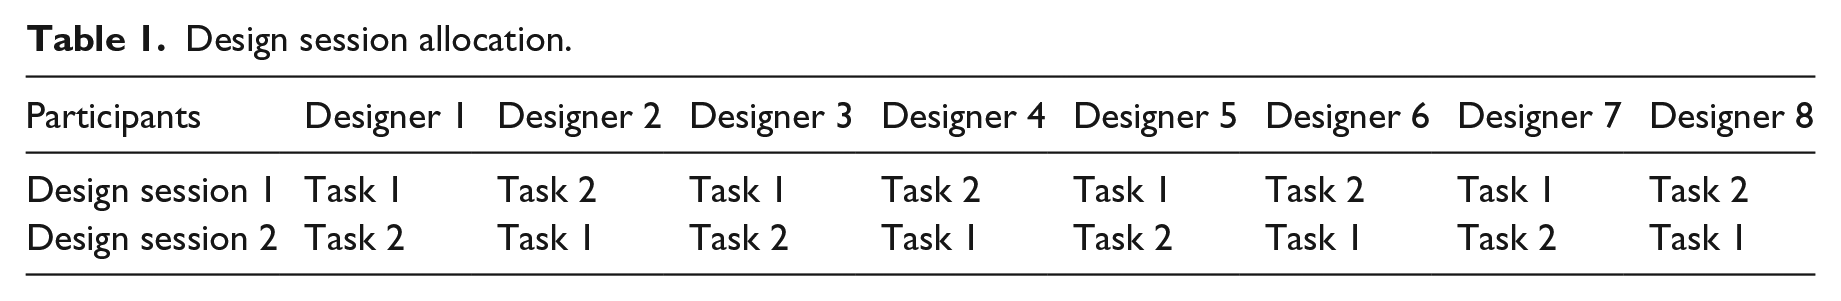
The experiment consisted of two design sessions: one session used Rhino as the GME, and the other session used Rhino and Grasshopper as the PDE. Designers were given 40 min for each design session. Task 1 is a community center design, and Task 2 is a shopping center design, both containing specific function requirements. A pre- modeled site was provided to the designers (Figure 2). Because this study was focused on exploring designers’ behavior at the conceptual design stage, designers were only required to consider concept generation, simple site planning, and general function zoning. No detailed plan layout was required. The design sessions and tasks were randomly assigned to the different designers. The order of design sessions was also randomly arranged, as shown in Table 1. During the experiment, designers were not allowed to sketch manually so that almost all their actions happened on the computer to ensure that the design environment is purely within the PDE and GME. This allows us to minimize the impacts of other variables and focus on the two different design environments for comparison during the comparative analyses. During the experiment, both designers’ activities and their verbalizations were video-recorded.
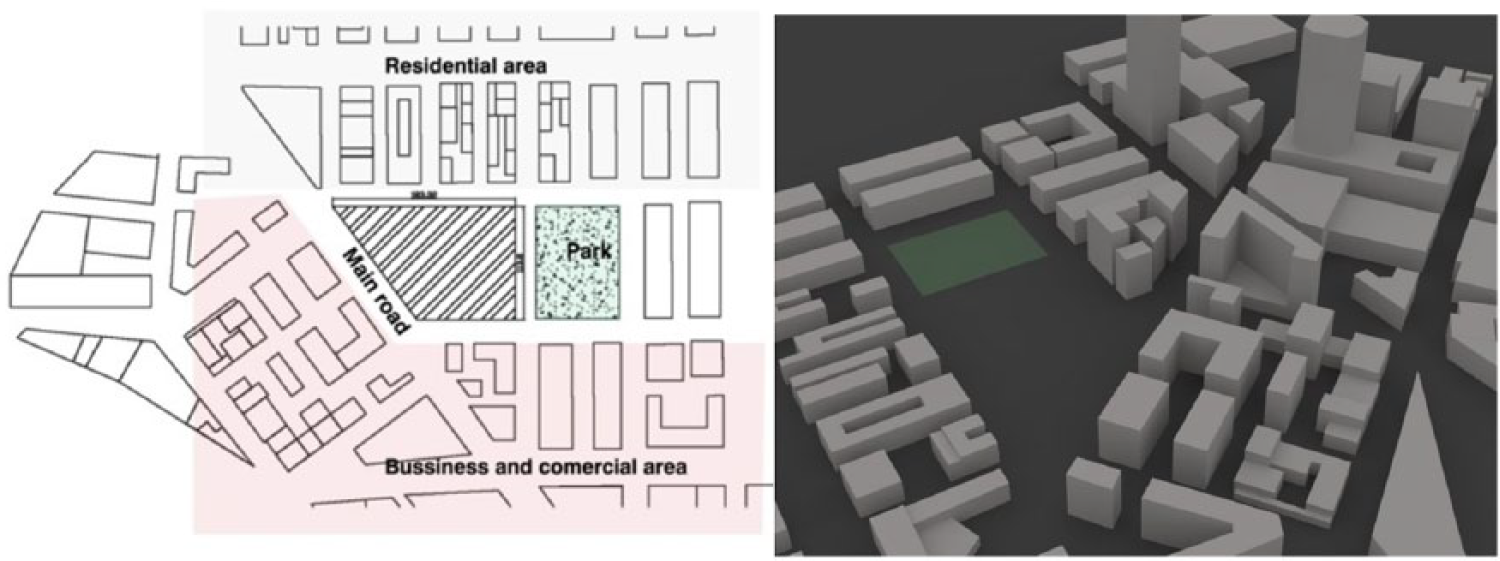
Site model provided to the designers during the experiments.
Design session allocation.
Analysis results
General results
The protocol analysis takes the video and verbal utterances of the participants and transforms them into a sequence of semantic symbols, called design issues, based on the FBS coding scheme. This sequence of design issues becomes the basis for all quantitative results that follow.
This protocol study employed an integrated segmentation and coding method. Segmentation is the process of breaking utterances into blocks that contain a single design issue. The segmentation and coding process are based on the “one segment one code” principle. 21 This means there is no overlapped code or multiple codes for one segment. If there are multiple codes for one segment, the utterances in that segment will be further divided until there is only one code per segment, that is, one design issue in a segment. Table 2 contains the general information of the coding coverage. The numbers shown in Table 2 are the mean values and standard deviations of the eight protocols. The mean numbers of segments are, respectively, 244 in the PDE and 224 in the GME. Designers also spent more time in the PDE session (48 min) than in the GME (44 min). On average, over 92.2% of segments were coded as FBS codes. Segments not coded included those associated with communication and software management.
General coding information expressed as mean values and standard deviations of the eight participants.
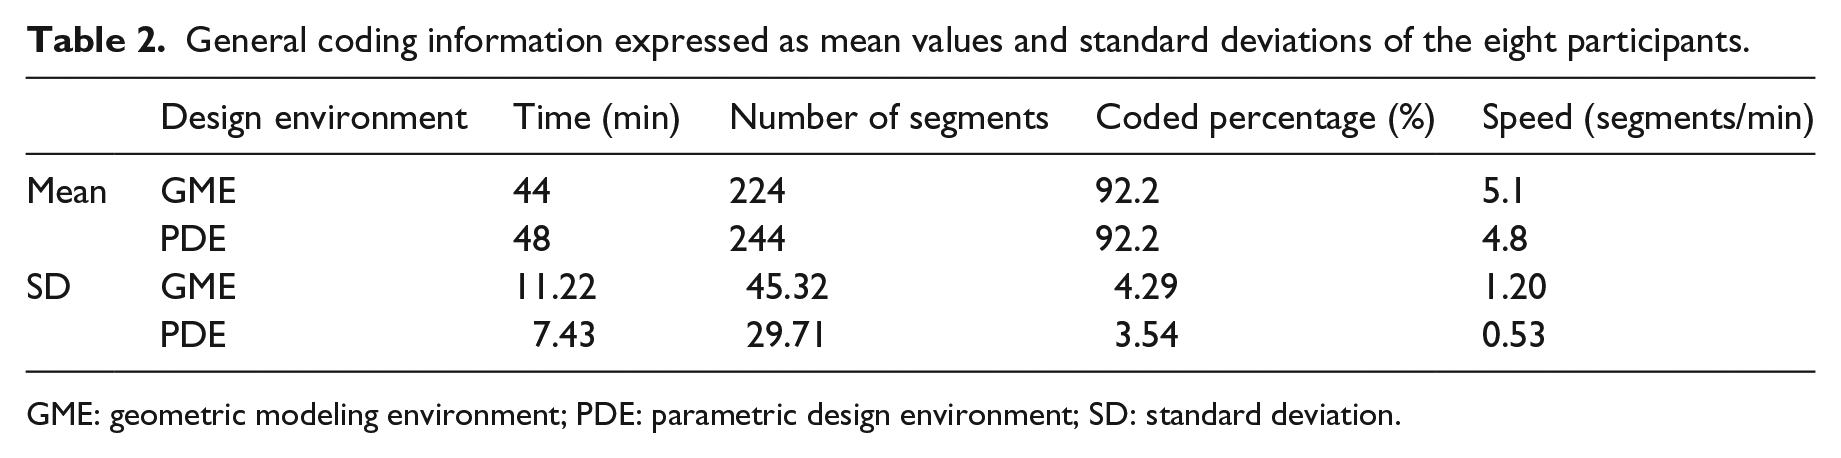
GME: geometric modeling environment; PDE: parametric design environment; SD: standard deviation.
First-order Markov analysis results
The segments in a coded protocol may be thought of more generally as states in the design thinking of the designer. A Markov model describes the probabilities of moving from one state to another.22,23 When used in design research, it describes the tendency of future design moves using the data gathered from that design session. Kan and Gero13,24 adopted the Markov model using the FBS ontologically based coding to describe cognitive design processes. Within the context of the FBS ontology, the Markov matrix is a quantitative tool to study design activities based on the transition probabilities between design issues. It can also be used to study transitions between design processes. There are two types of Markov models of interest here: the first-order Markov model and the second-order Markov model. The first-order Markov model expresses the probability of moving to a future design issue depending only on the current design issue, without considering the past design issue (Figure 3). The second-order Markov model expresses the probability of moving to a future design issue depending on the current design issue and the previous design issue that led to the current design issue. This article only presents the results of the first-order Markov model that is calculated using more transitions than the second-order Markov model, producing a rich and reliable dataset.
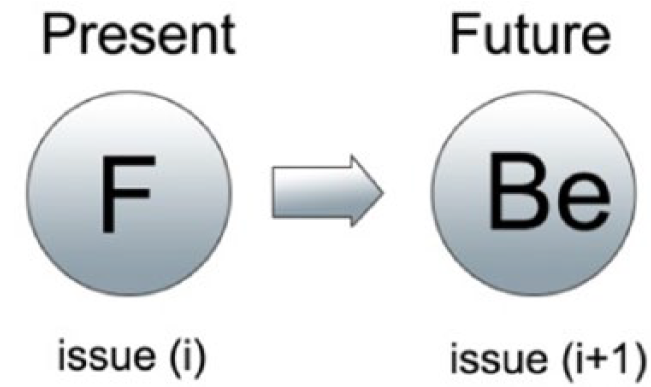
An example of the first-order Markov model using the FBS ontology, where the arrow contains the probability of the next segment after an F is Be.
The values in the Markov model are calculated using LINKODER, a software tool used in protocol analysis. 21 The results of the first-order Markov model in the GME and the PDE are presented in Table 3. The numbers in the table are the average values of the eight designers of the transition probabilities of moving from one design issue to another design issue. Table 3 is read as follows: if a designer is currently at the design issue designated by the code in the left-hand column, each column in that row shows the probability of moving to the design issue designated in the column label in both the GME and PDE.
The first-order Markov model analysis.
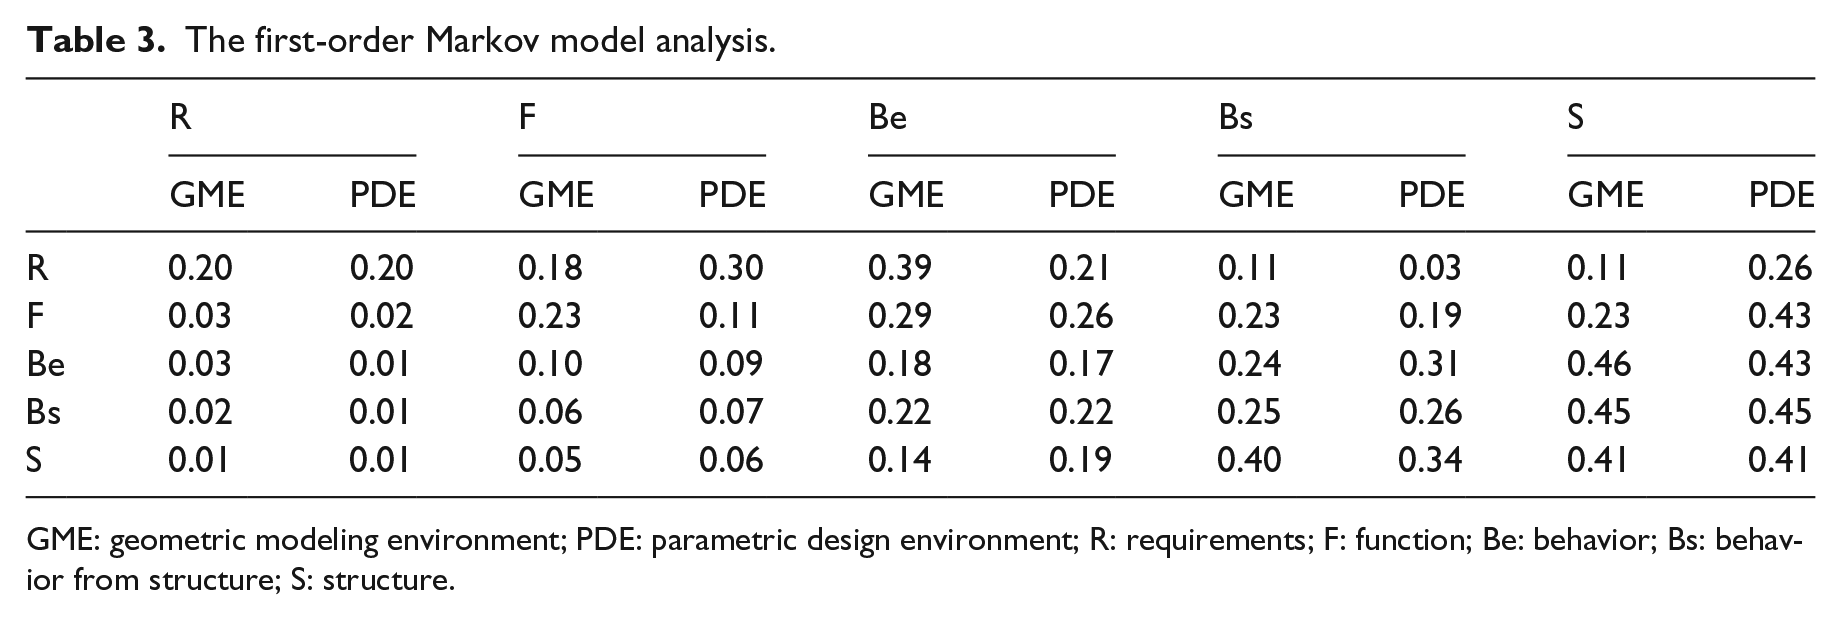
GME: geometric modeling environment; PDE: parametric design environment; R: requirements; F: function; Be: behavior; Bs: behavior from structure; S: structure.
In order to determine whether the numerical values in Table 3 are different in a statistically significant way, paired sample t-tests are carried out. The results of this are shown in Table 4. This analysis indicates that there is no significant difference between the two design environments except for the transition of function (F) to structure (S) (p = 0.04 < 0.05), indicating that there are relatively more F-S transitions in the PDE than in the GME. From this, we can infer that designers’ tendency of moving from one design issue to another does not vary because of the method used, except for the move from F to S.
Paired sample t-test of first-order Markov model analysis between GME and PDE.
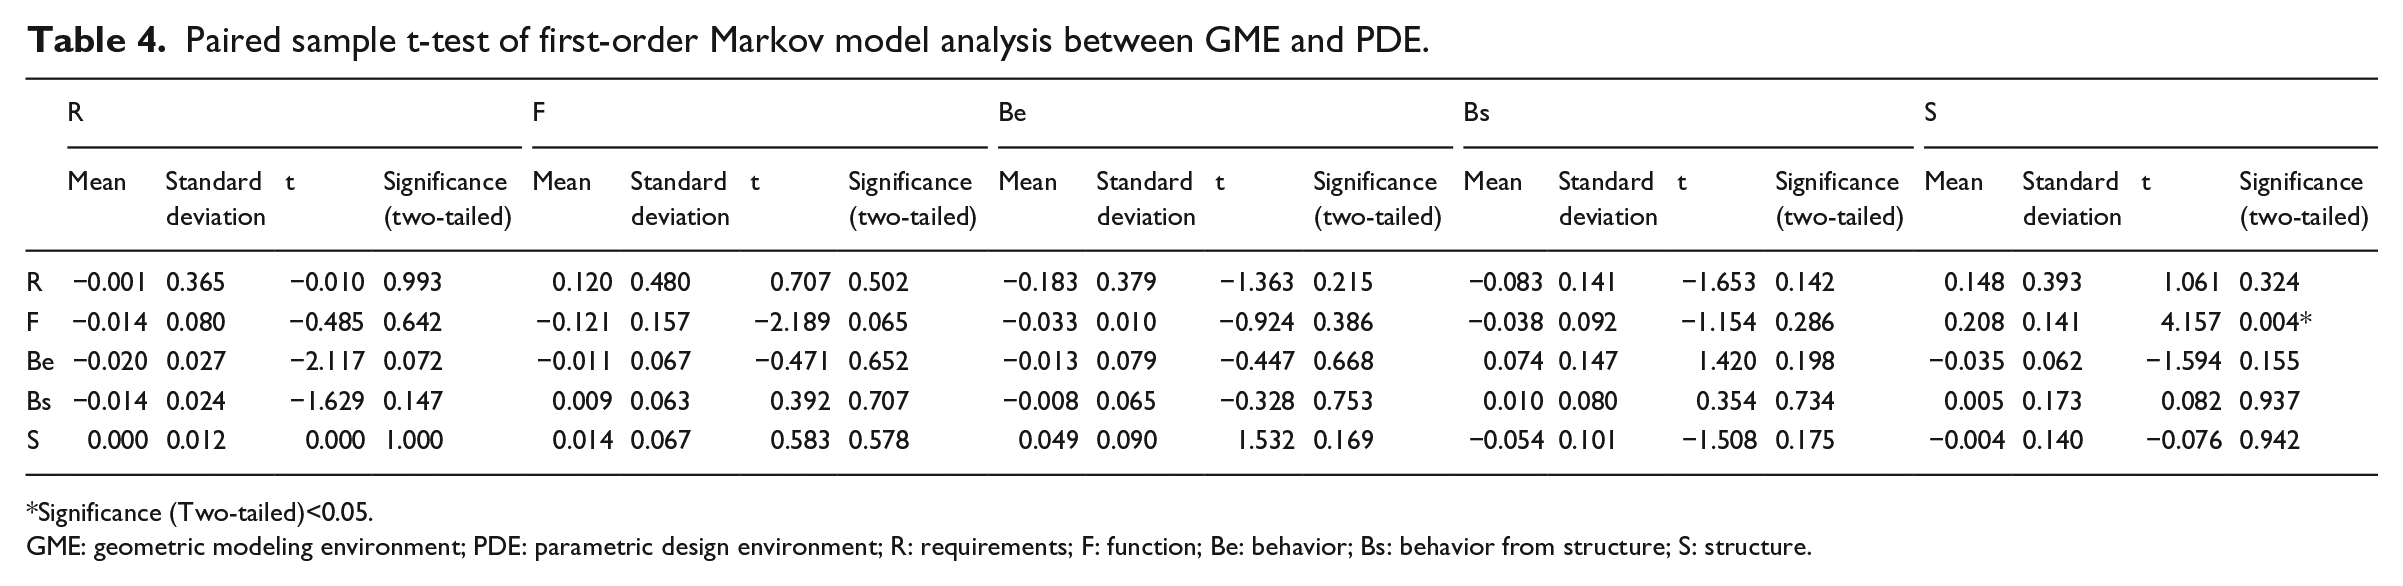
Significance (Two-tailed)<0.05.
GME: geometric modeling environment; PDE: parametric design environment; R: requirements; F: function; Be: behavior; Bs: behavior from structure; S: structure.
Markov analysis at different design stages
Treating a design session as a single unit of activity may mask behavior that is more localized. Therefore, we divide the protocols into thirds and carried out the same analysis on each third. Tables 5–7 show the paired sample t-test of first-order Markov model analysis at these three different design stages labeled early, mid, and end stages. From the results in these three tables, we can see that at the early design stage, there are no statistically significant differences between GME and PDE in terms of design issue transitions. At the mid-design stage, the transitions from function (F) to structure (S) and from behavior from structure (Bs) back to behavior from structure (Bs) exhibit statistically significant differences between GME and PDE. While at the end design stage, there is a statistically significant difference found in transitioning from F to S transitions. The p value for F-S transition decreases from p < 0.062 in the early stage through p < 0.038 in the mid-stage to p < 0.007 at the end stage. This suggests that the difference of the F to S transition between PDE and GME tends to increase toward the end of design session.
Paired sample t-test of first-order Markov model analysis at early design stage.
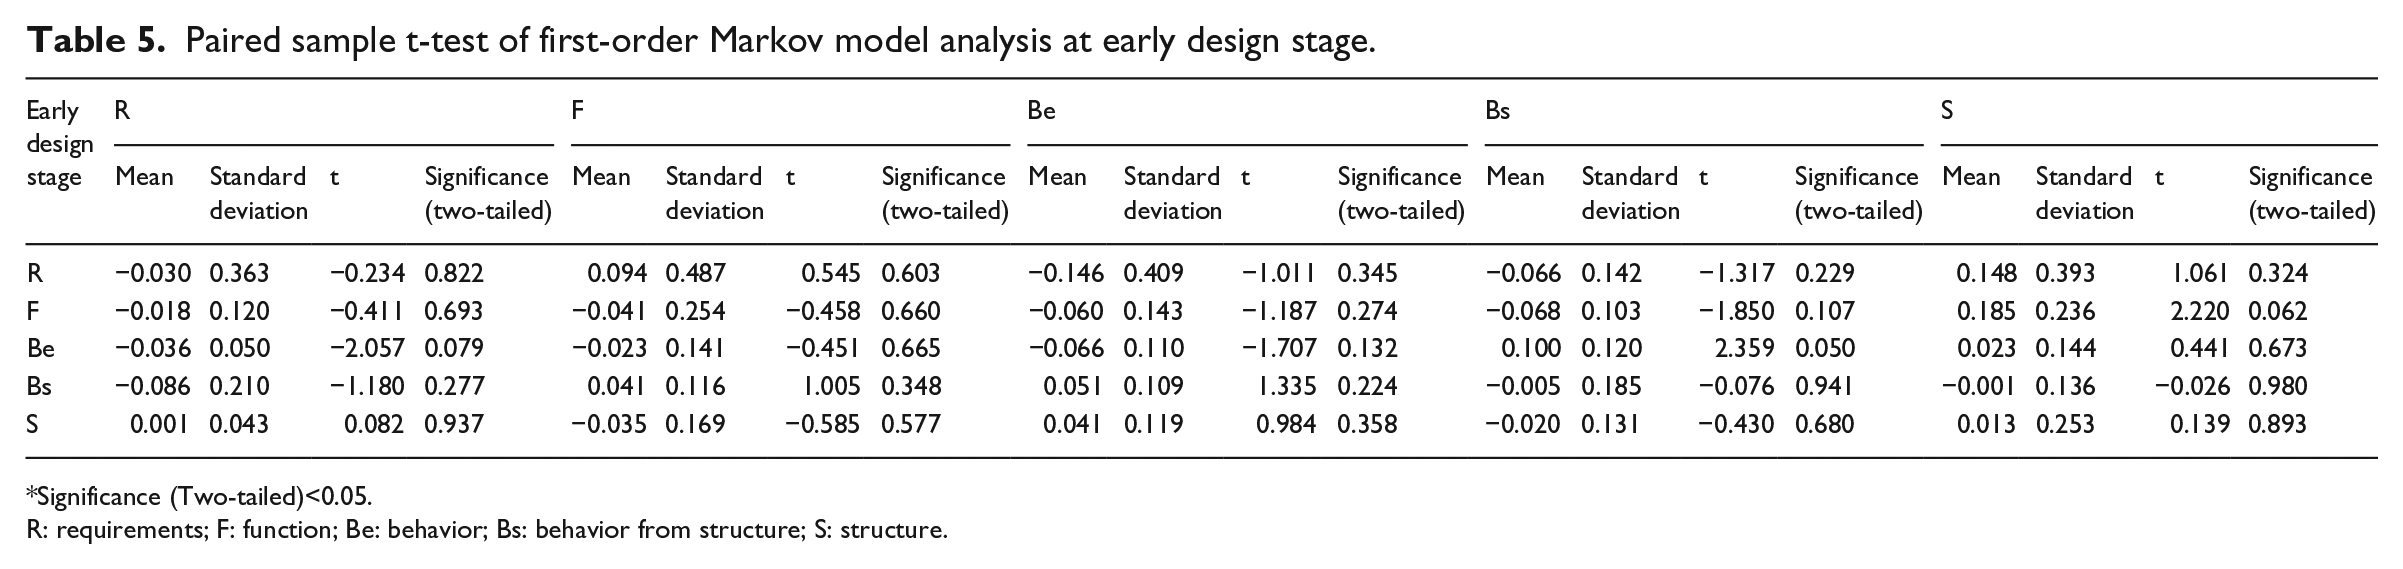
Significance (Two-tailed)<0.05.
R: requirements; F: function; Be: behavior; Bs: behavior from structure; S: structure.
Paired sample t-test of first-order Markov model analysis at mid-design stage.
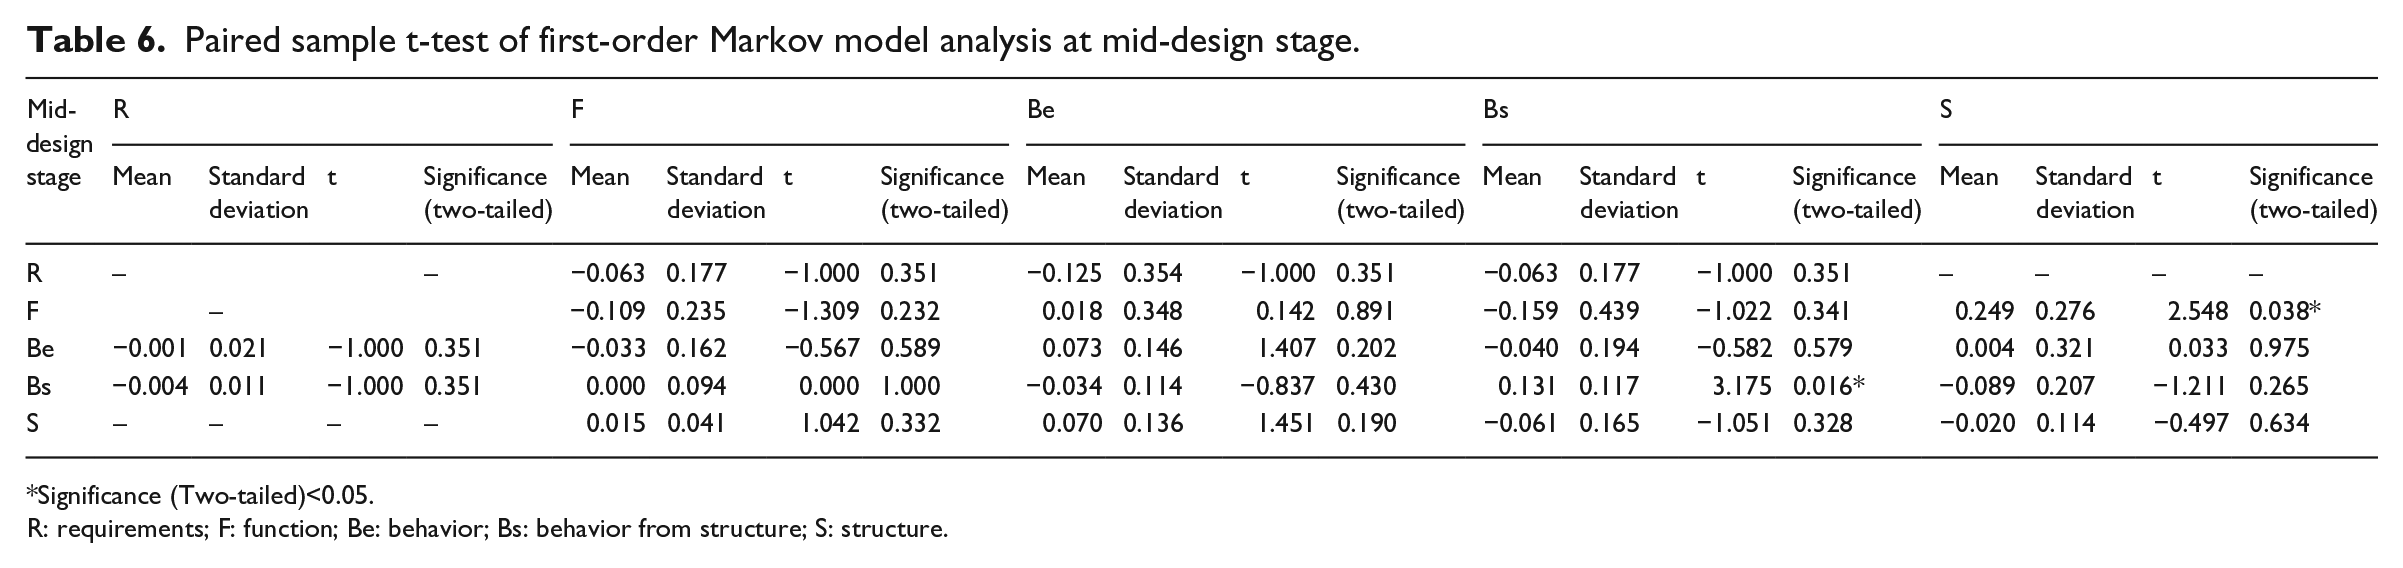
Significance (Two-tailed)<0.05.
R: requirements; F: function; Be: behavior; Bs: behavior from structure; S: structure.
Paired sample t-test of first-order Markov model analysis at end design stage.
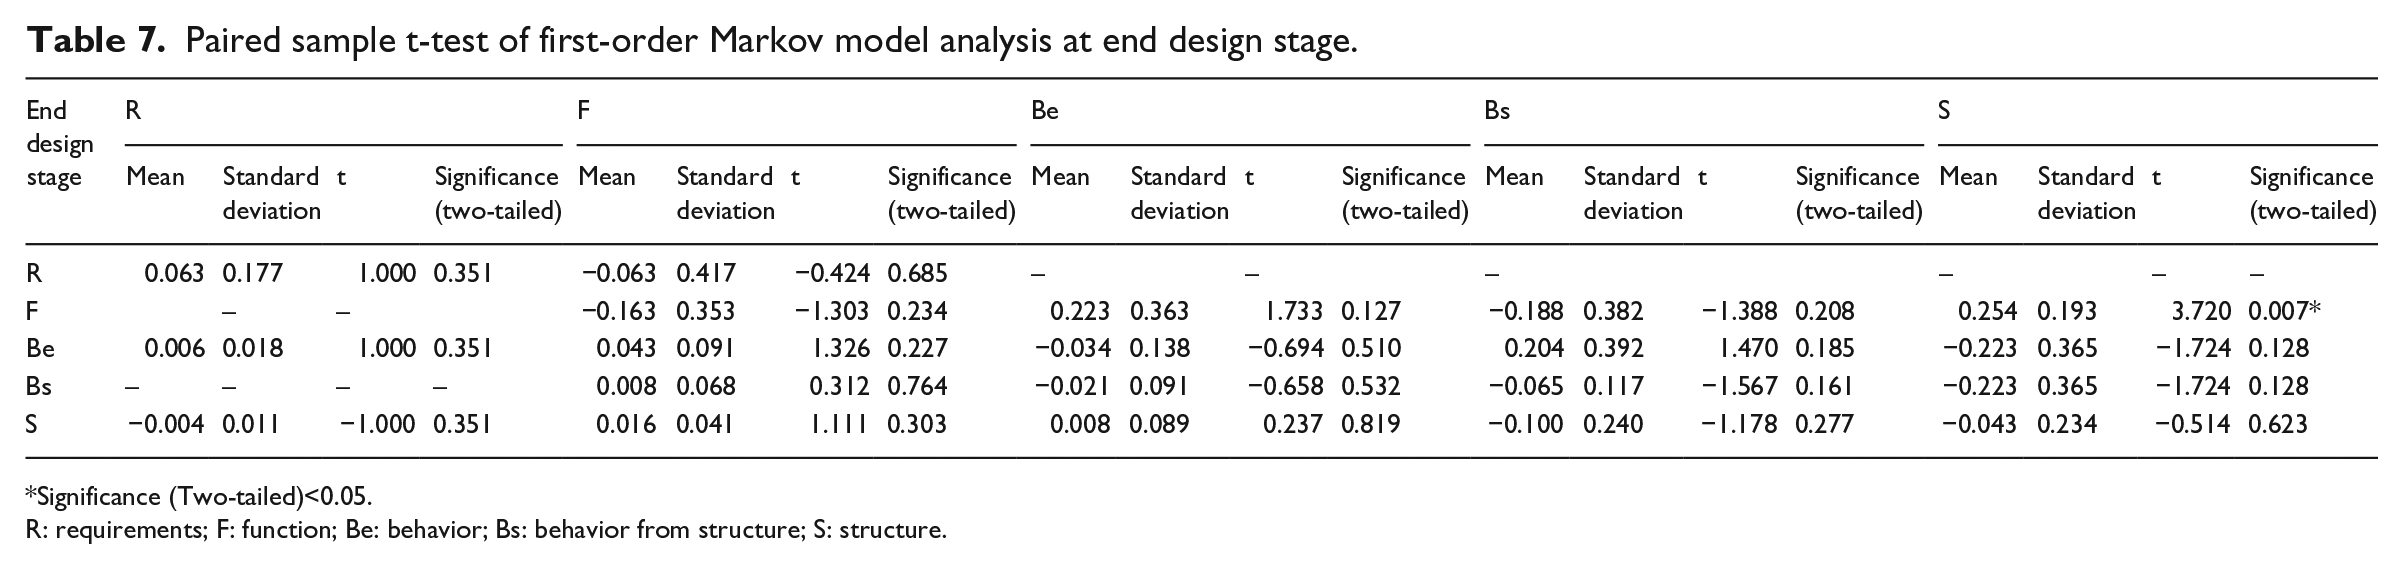
Significance (Two-tailed)<0.05.
R: requirements; F: function; Be: behavior; Bs: behavior from structure; S: structure.
Design patterns in the PDE
F to S design transition
A descriptive diagram of the first-order Markov model analysis in the GME and the PDE is given in Figure 4. The circles labeled with the FBS codes represent the design issues, and the size of a circle represents the frequency of occurrence of that design issue. Each arrow shows the transition from one state to the other, and the thickness of the line represents a measure of the transition probability between design issues. To demonstrate the main activities of the designers, we select the transitions with the probability value larger than 0.4 and present them in Figure 4. The probability of 0.4 is selected as the threshold to abstract the model; this threshold is twice the random transition probability. In the coding used, each variable has five other states to go to, which means that the random probability is 0.2. The graphs in Figure 4 show that the main patterns of design moves are Be → S, Bs → S, and S → S; the transition probabilities are very similar between the GME and the PDE. The primary difference between the GME and the PDE is that the transition probability from F to S is above the threshold in the PDE and below the threshold in the GME.
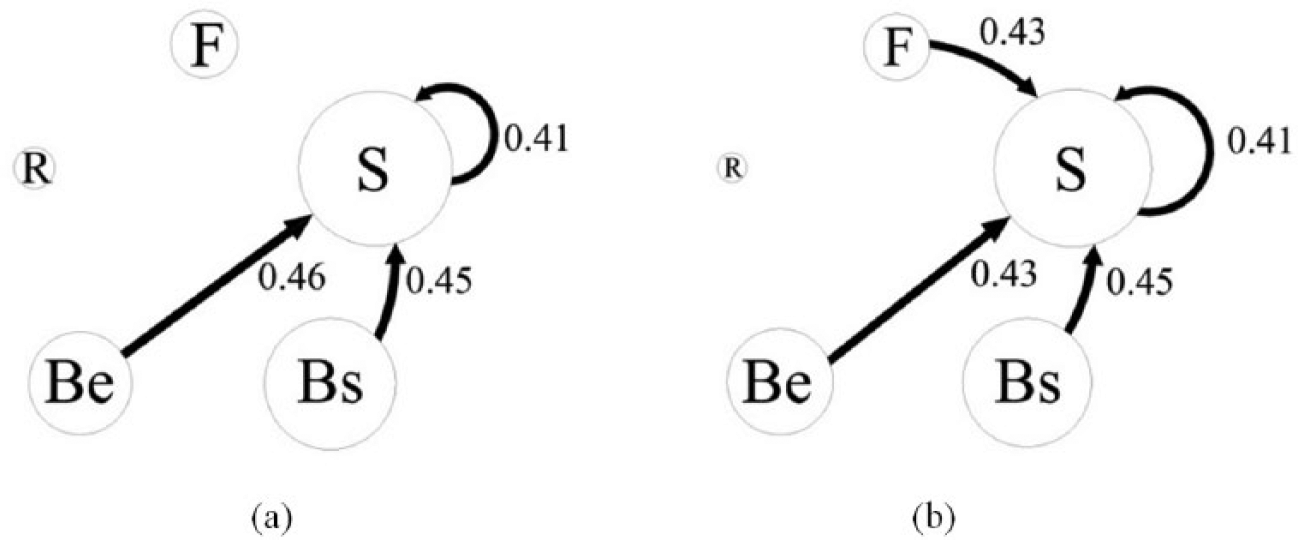
(a) Transitions above the threshold in the first-order Markov model in the GME. (b) Main transitions of the first-order Markov model in the PDE.
Within the context of the FBS ontology, this process of transitioning directly from function (F) to structure (S) is excluded from routine ways of design (excluded from the eight design processes expressed in FBS model). Previous research suggests from the study of software designers’ behavior that the transition from F to S is a typical design process that occurs frequently. During the F-S process, designers select an existing structure/solution for the particular function/design problem based on their experience or knowledge, which is the process of applying a learned, existing design pattern to the problem rather than a design reasoning process.
Software designers use design patterns when programming and scripting.25,26 We can infer that when architects apply programming and scripting in their design, such as in a PDE, they exhibit a similar characteristic of using design patterns. Design patterns are an important concept in both architectural design and software design. In software design, it assists software designers in working more efficiently and makes programming and scripting process traceable. In the PDE, if we can generalize these transitions to design patterns, it would be of assistance to architects in conceptualizing their scripting process. The Markov model provides empirical evidence for the existence of a design pattern when the transition probability is above 0.4.
Design patterns in the PDE
From the Markov model analysis results, we found that design patterns are adopted more frequently in the PDE than in the GME. The idea of design patterns was first introduced by Christopher Alexander:
27
each pattern describes a problem which occurs over and over again in our environment, and then describes the core of the solution to that problem, in such a way that you can use this solution a million times over, without ever doing it the same way twice.
That is, a pattern is a documentation of a solution suitable for certain kind of design problems that may occur frequently.
Patterns usually come from a designers’ experience, 26 which can be seen as an induction process. Designers generalize examples from their own design experience or from observations of other designers, and abstract the problem-solution pair, and formalize these into “patterns” which can be reused. Those generated patterns can be improved and combined into a network of connections depending on their design purpose. 28 Woodbury 3 defines that “A pattern is a generic solution to a well-described problem. It includes both problem and solution, as well as other contextual information.” A design expert has accumulated a large number of examples of problems and solutions in a specific domain. 29 The pattern itself is abstract; when a designer applies a pattern, the designer can revise the pattern to their own preference, or to the specific context of designing.
In the software design domain, educators have found that Alexander’s work on design patterns provided a strong foundation for re-usable software design. For instance, Gamma et al. 25 define patterns as a tool to describe compositional ideas in computer programming. This matches our analysis results that in parametric design, more design patterns were used than in geometric design alone. Therefore, we can infer that a feature of programming in a parametric design might affect the utility of design patterns during computational design process. The design patterns identified in the PDE suggest possibilities of using programming-based design patterns. These encode computational thinking and are therefore potentially generalizable. 30
Conclusion
This article has presented the results of a protocol study that explores the phenomenon of using design patterns in a PDE and GME. From the study, we found that there are more design patterns used in the PDE than in the GME, and this difference increases toward the end of design session implying either that there are more opportunities to apply patterns as the design proceeds or that learning takes place during the design activity. The difference between the two environments is in the additional design pattern in the PDE of F → S, that is, going from function to structure, which is only possible as a consequence of experience as there is no direct design reasoning link between them when designing. Since the main difference between the two design environments is that rule algorithms are used in the PDE and not in the GME, we can assume that the rule algorithm feature affects the development and use of design patterns more during the design process. That is to say in a rule algorithm–related design environment, designers tend to adopt and use existing patterns based on their experience.
In software design, design patterns are used both in education and in practice. The use of design patterns by practicing architects as shown by the empirical evidence presented from these protocol studies implies, if the results are generalizable, that the opportunity exists to involve design patterns in teaching parametric modeling in design.
Further analysis of the empirical data in the protocol is needed to determine whether these patterns re-use existing patterns or are developed during the design session as a consequence of the designer’s current activity.
Footnotes
Declaration of conflicting interests
The author(s) declared no potential conflicts of interest with respect to the research, authorship, and/or publication of this article.
Funding
This research has been supported in part by the National Science Foundation grants CMMI-1161715 and EEC-1463873 to the second author (J.S.G.). Any opinions, findings, and conclusions or recommendations expressed in this material are those of the authors and do not necessarily reflect the views of National Science Foundation.