
Abstract
Liveability can be accepted as an umbrella term covering all the factors that make a place to live. We recognize the versatility of urban liveability and focus on the vibrancy aspect. Regarding the literature, we compile variables affecting urban liveability under the economic, image, and use value of place. This article aims to present a data-driven decision support system to evaluate different dimensions of vibrancy-focused liveability. We adopt a knowledge discovery process to handle the complexity of the liveability concept. This study develops a conditional-based relationship network of vibrancy parameters through the Bayesian Belief Network (BBN). Then, we assess the BBN's correlations with statistics and causal relations with the survey in this study.These results mostly agree with the findings of the relevant literature. The economic value results show that the high density, diversity and accessibility add a premium to the land value of properties. The use value results also demonstrate that the diversity and density of activities, cultural attributes, and high accessibility support place attractiveness. The selected streetscape variables improve image value, except for building enclosure and condition. The study has the potential for urban planners to vitalize neighborhoods by considering urban activities and urban physical attributes.
Introduction
With the ubiquity of data, the digital paradigm has become a dominant feature of urban planning. Integrating digital information with physical localities creates a new type of mediated environment named a hybrid locality. 1 Data-driven analysis methods disclose urban dynamics using hybrid localities' data. Revealing urban dynamics support urban planning decisions for urban resilience in an emergency, such as pandemics and natural disasters. We take advantage of data from physical and digital localities to investigate liveability in developing historical city centers. The case study area is Istanbul Historical Peninsula which has a dilemma between conservation and development affecting urban dynamics. This research hypothesizes that “the big data supported knowledge discovery process can unravel multiple dimensions of urban dynamics.” This study aims to present a data-driven decision support system through the knowledge discovery process (KDP) to evaluate multiple liveability dimensions regarding vibrancy. In the KDP process, the researchers conduct data analysis using the Bayesian Belief Network (BBN) to reveal the relationship network between vibrancy-focused liveability factors. The research questions address:
1. What are the measures of vibrancy-focused liveability;
2. How to establish a relationship network for liveability measures with the use of big urban data;
3. How to evaluate the relationship network in terms of causality and correlation for decision support;
4. What implications can be made about the urban vibrancy level in the site?
The literature review section describes the vibrancy-focused liveability measures and the case study area addressing the first question. The relevant urban studies in locative data (LBSN) crowdsourcing and the knowledge discovery process form the study's context. Regarding the second question, the methodology section includes data collection and analysis methods for the variables of place measures. The BBN relation network is evaluated with expert participation in response to the third question. The results section reveals urban vibrancy in the site through descriptive and BBN analysis, as addressed in the fourth question. The study's contribution is the combination of different methods: knowledge discovery process (KDP) of multiple urban data through BBN, supported with the survey and statistical methods. The conceptual model of this study is shown in Figure 1. The conceptual model of the research.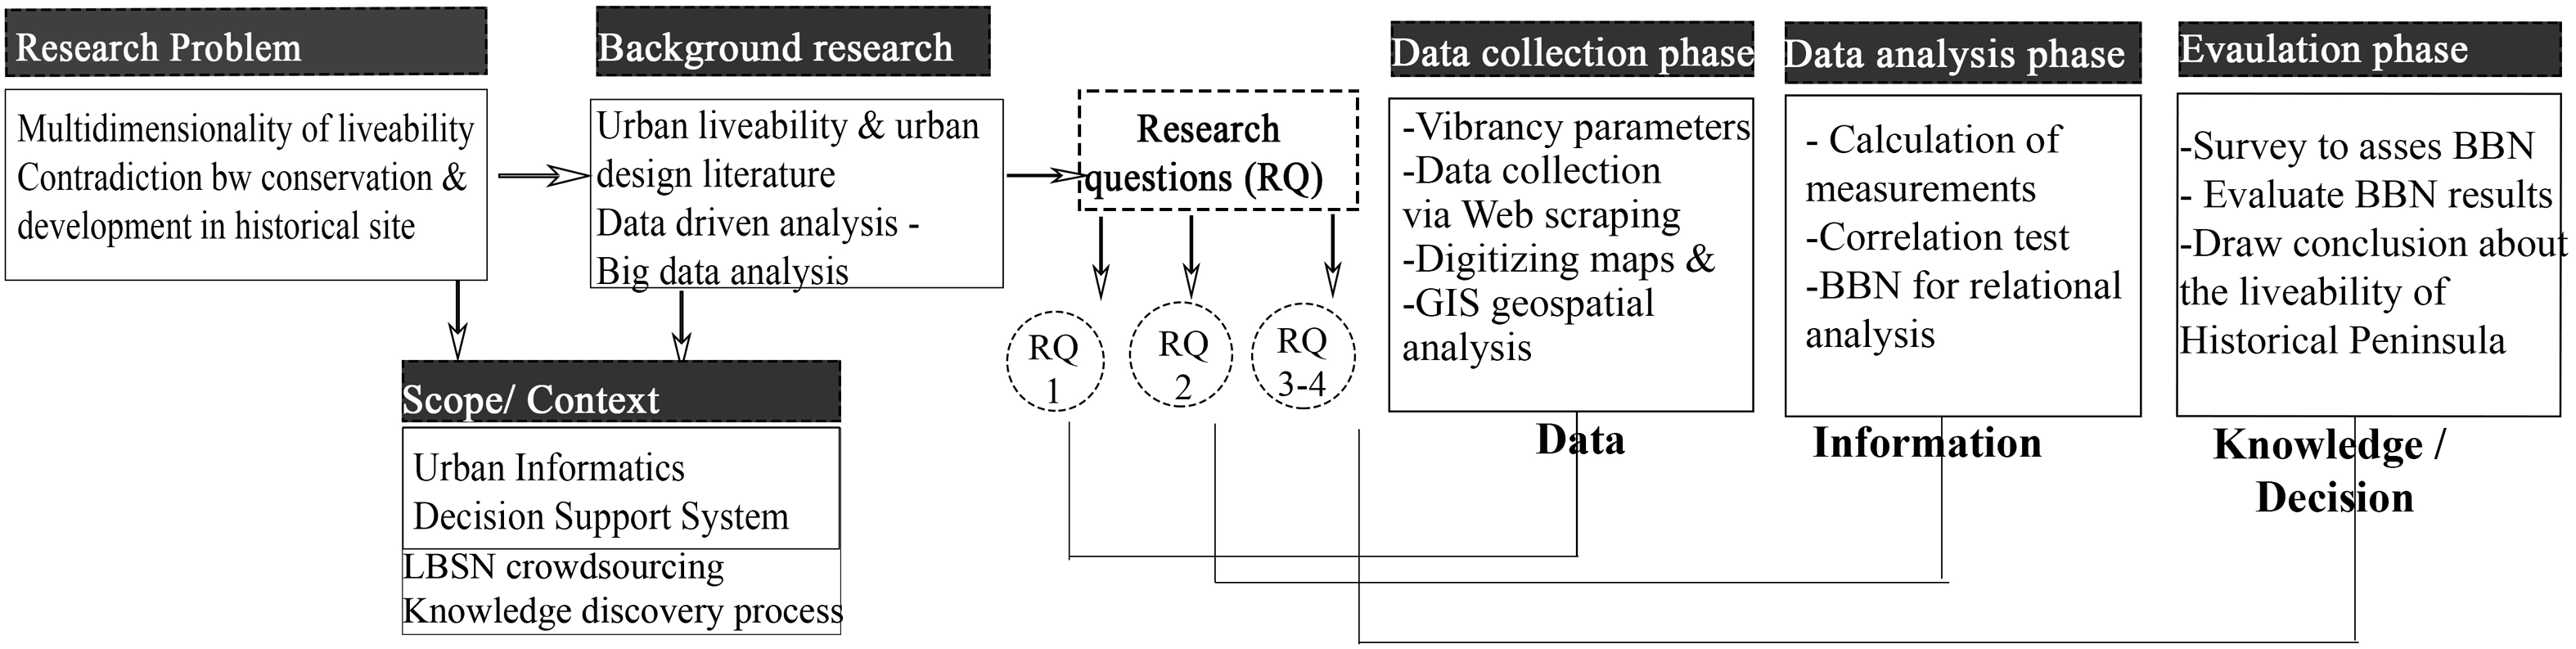
Literature review
Urban liveability measures within the context of vibrancy
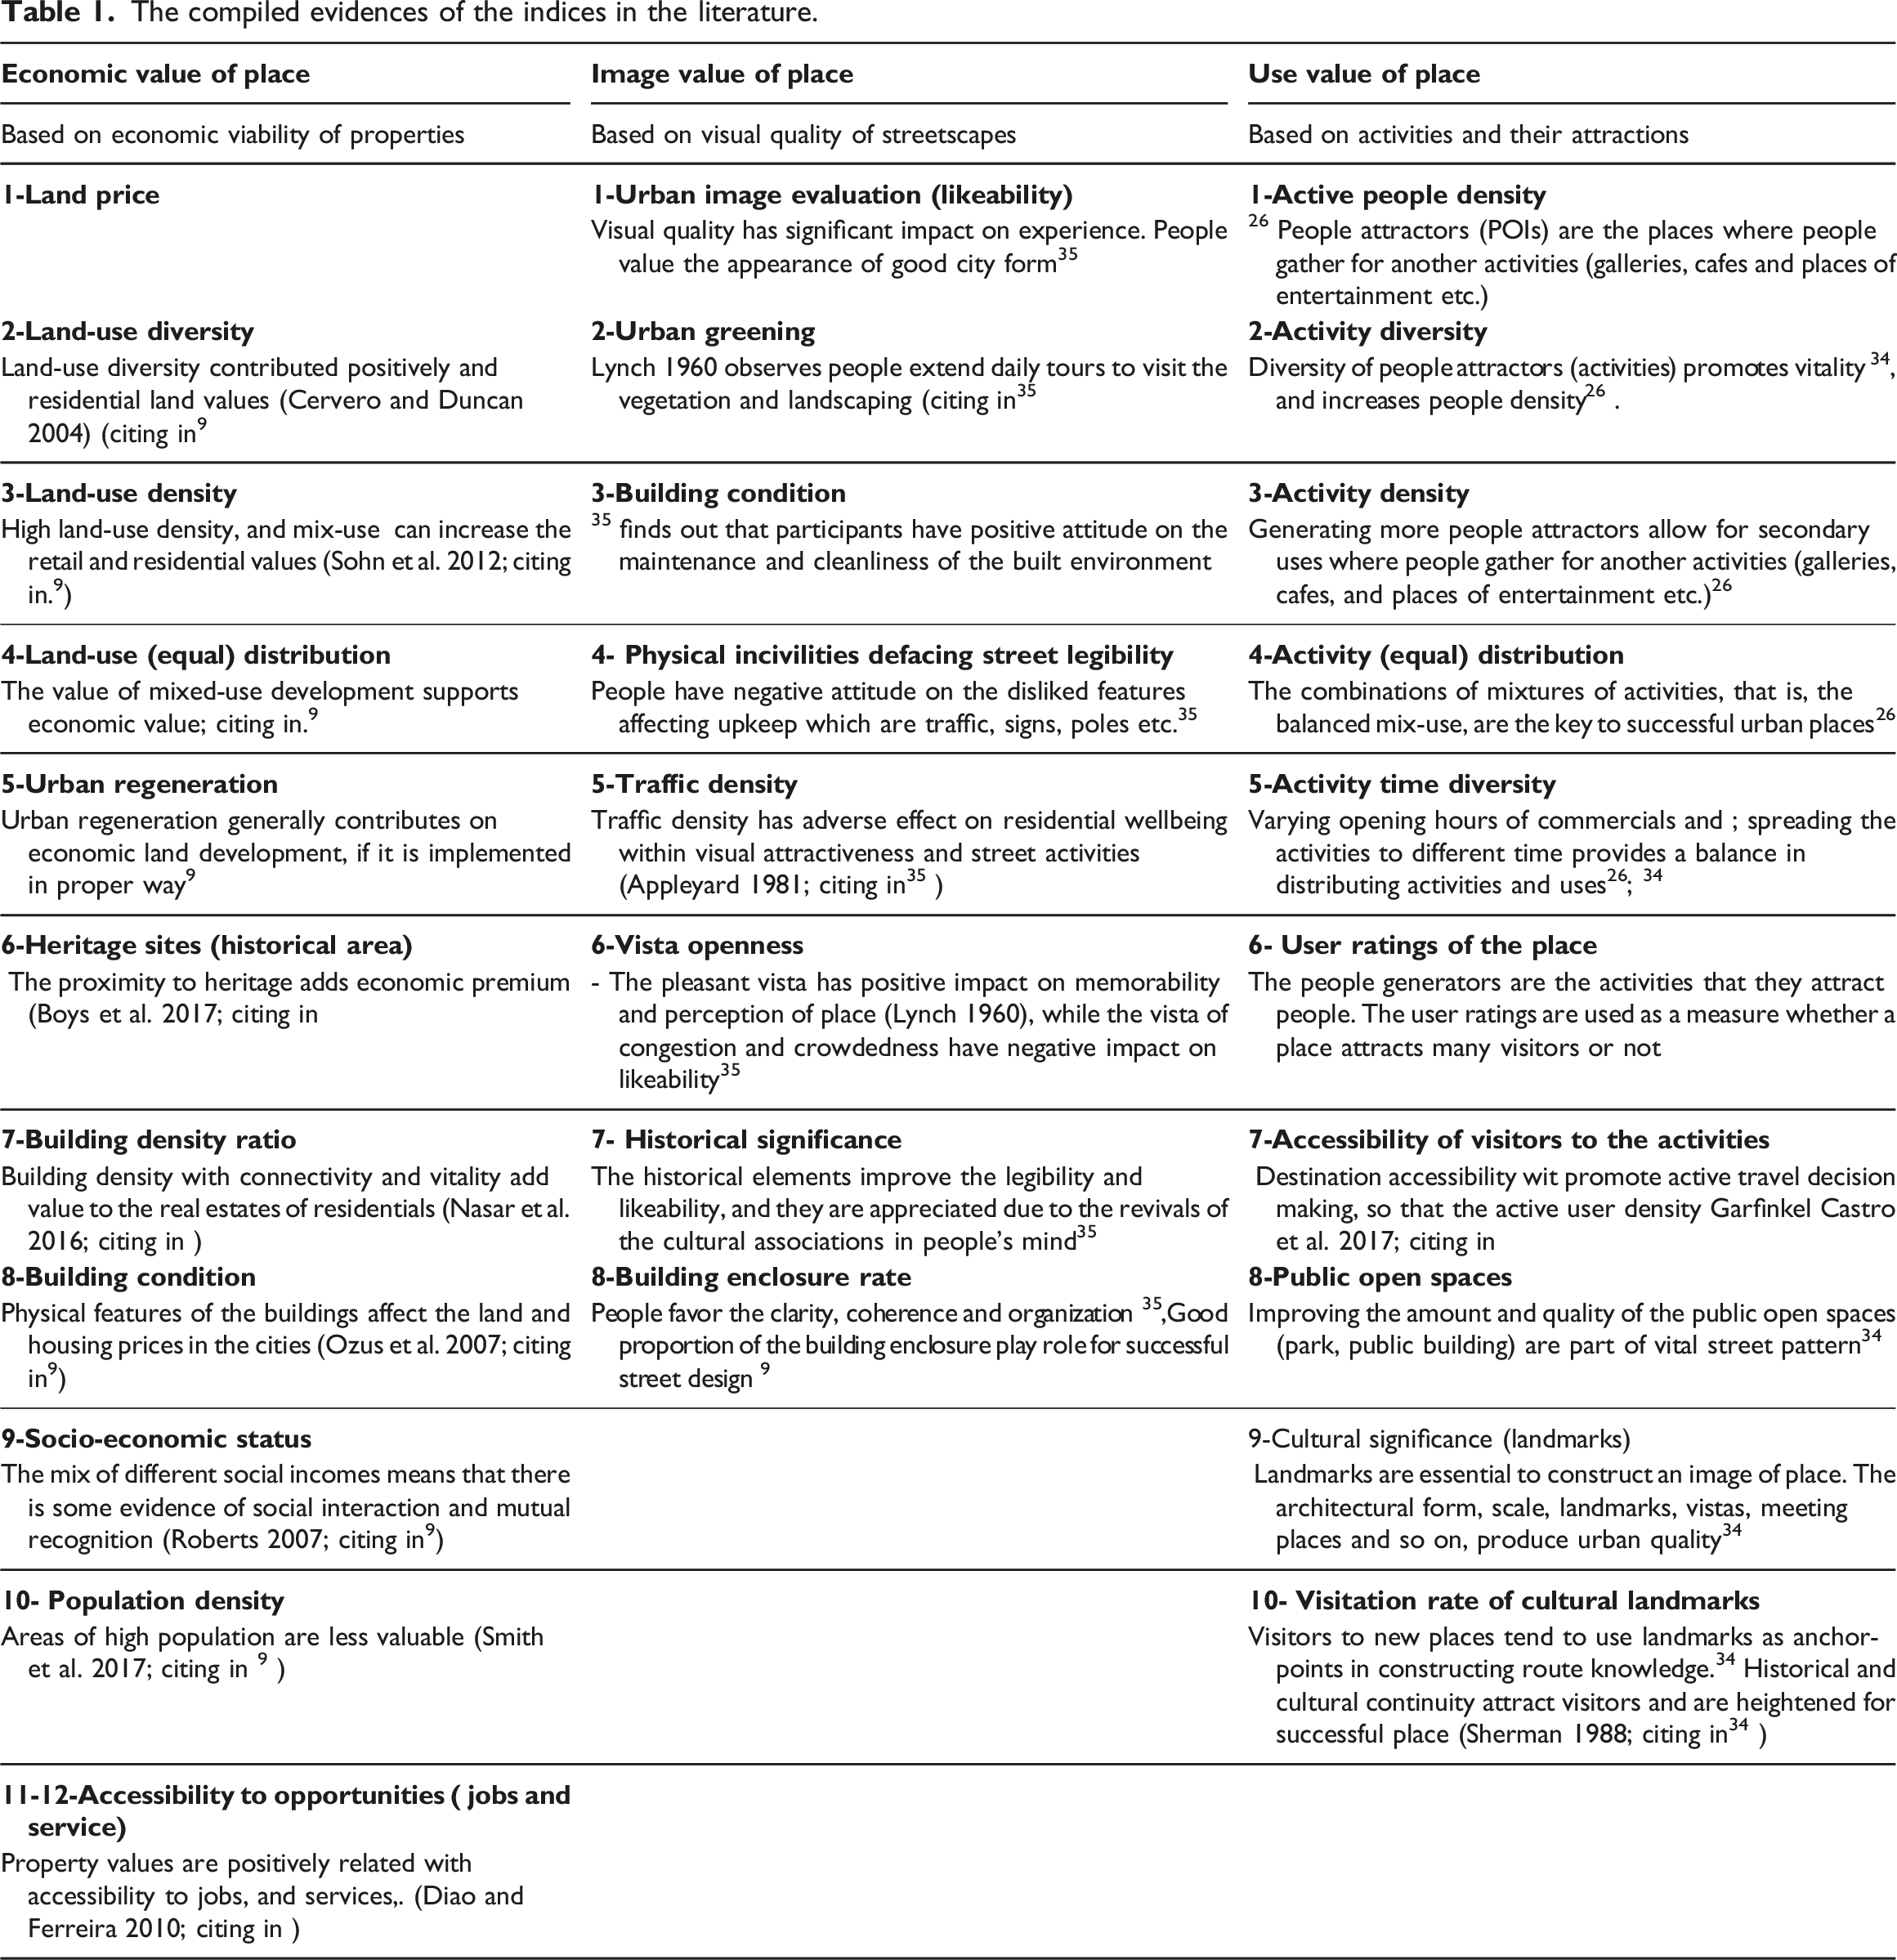
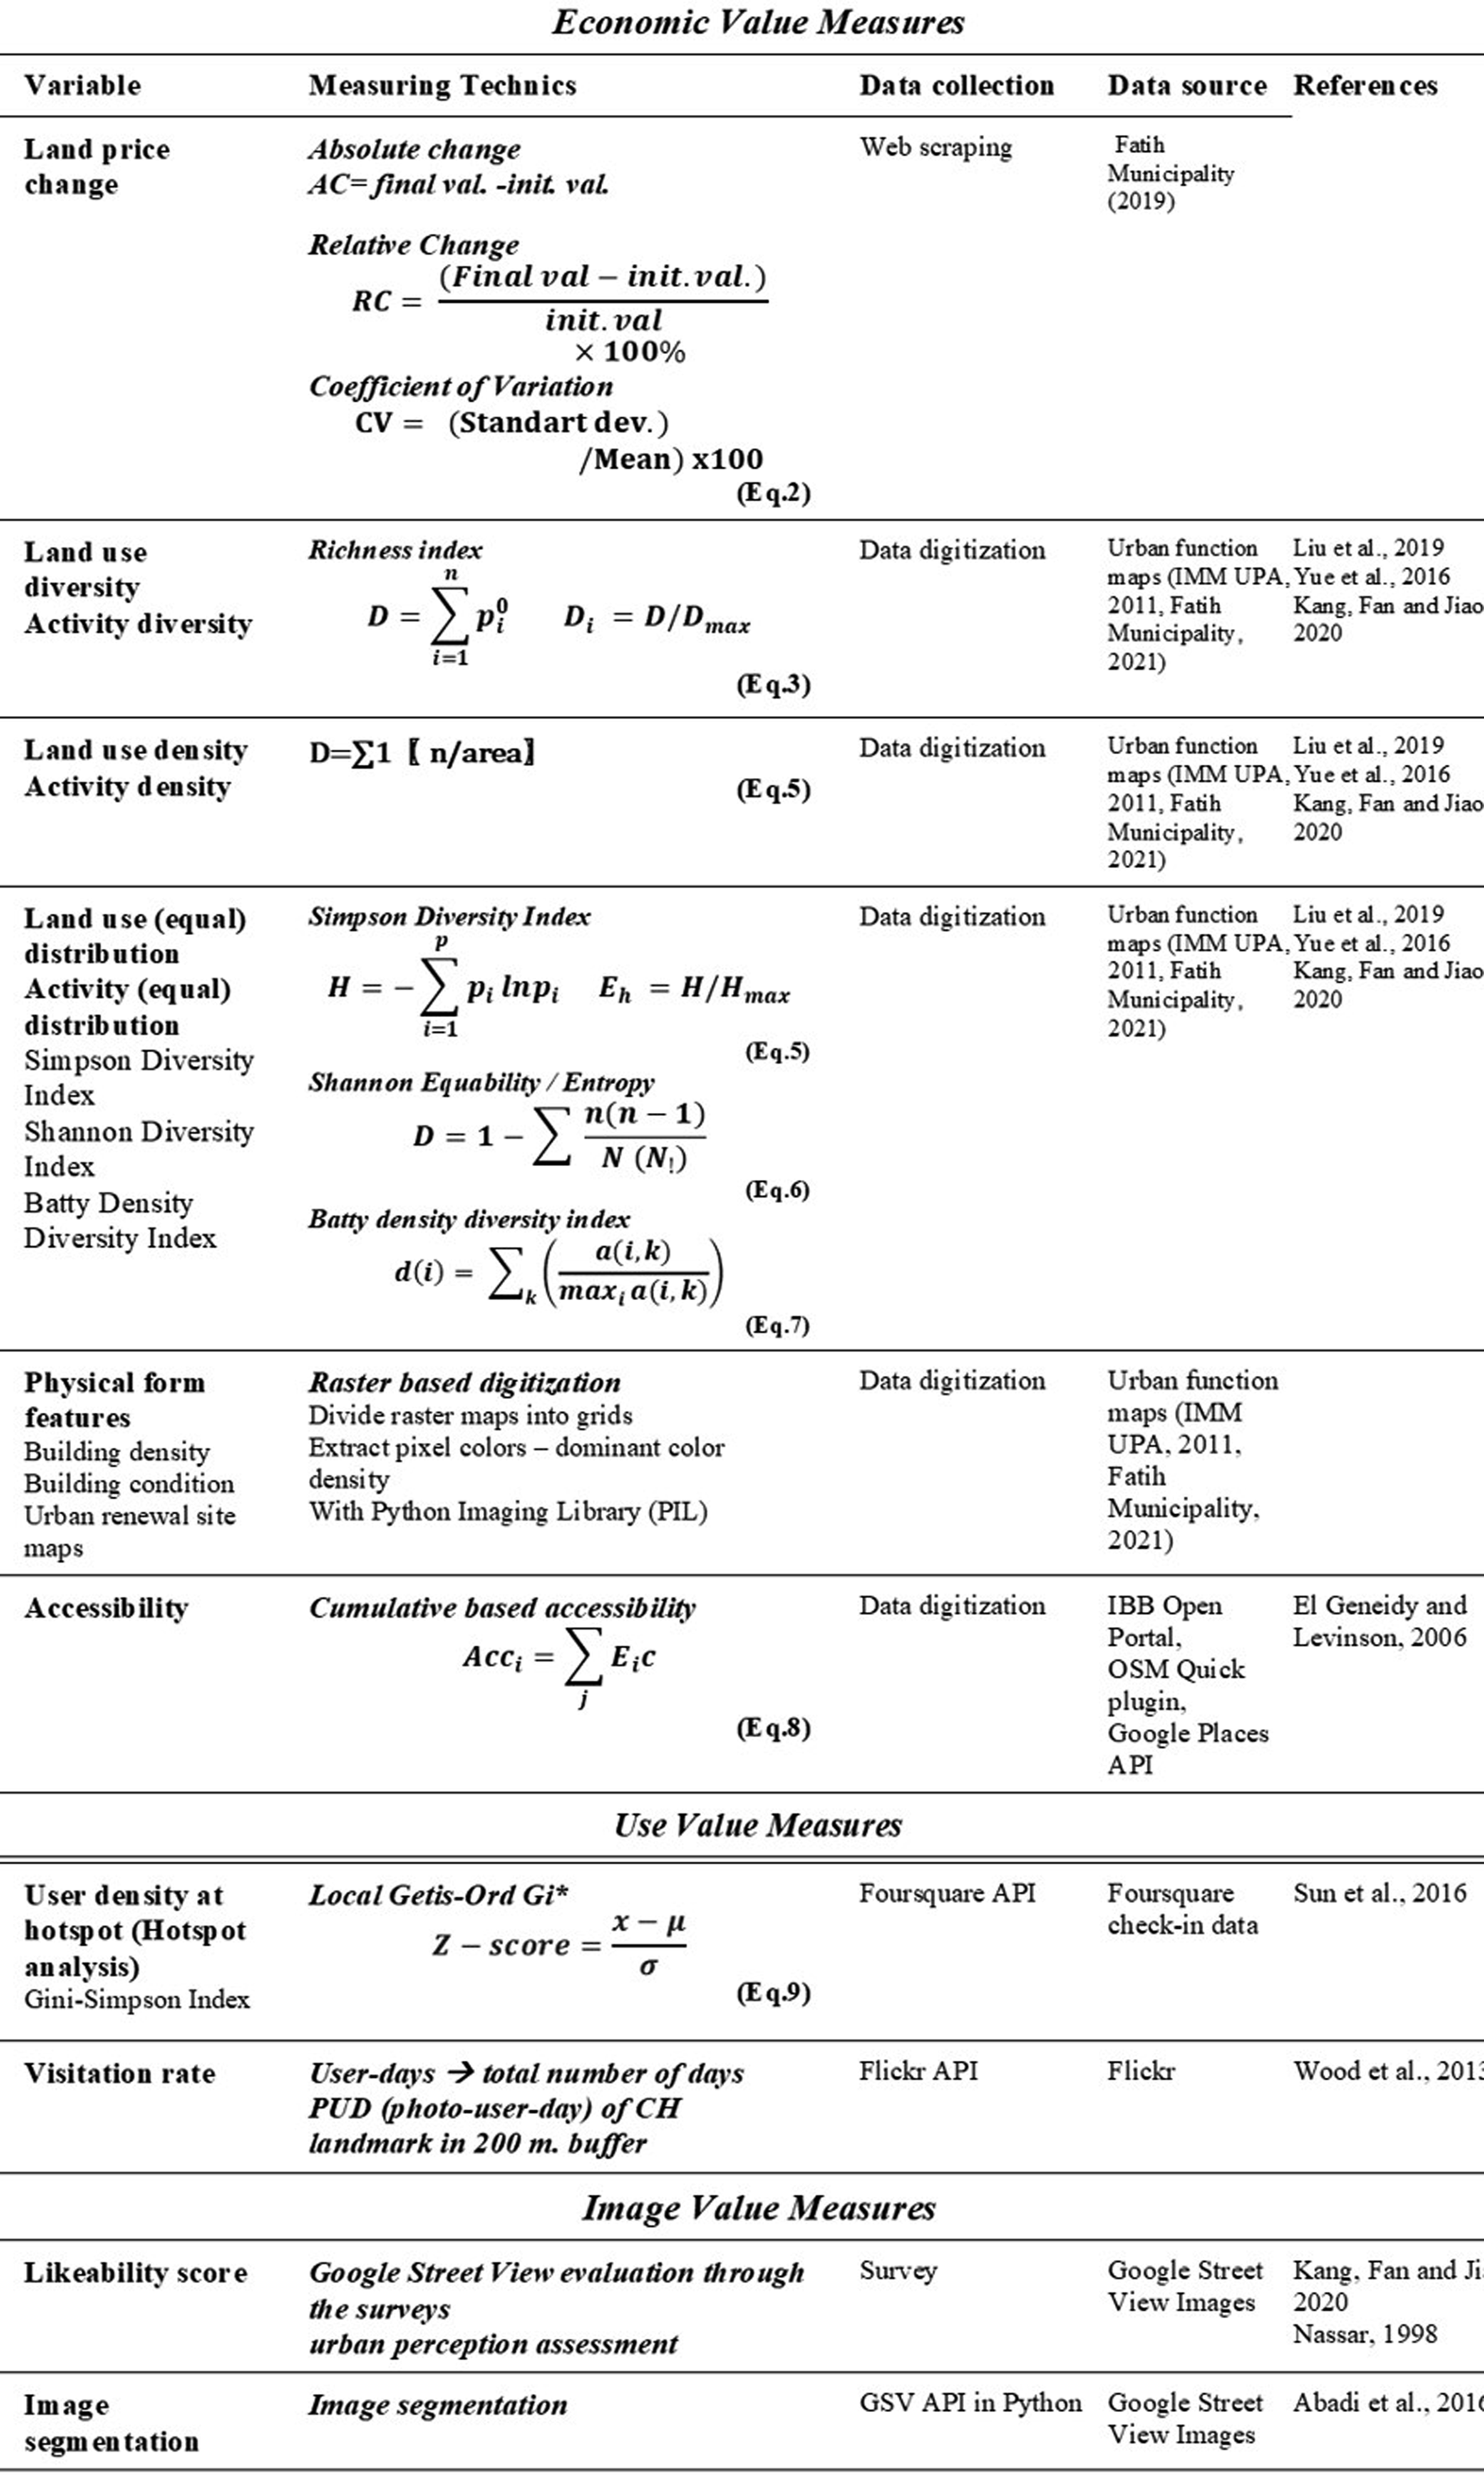
The livability concept emerged together with the awareness of sustainability and well-being in the 1980s. Liveability is an umbrella term covering all the factors that make a place attractive to live and visit. Liveable neighborhoods are walkable, accessible, affordable, green, attractive, mixed-use, high-density, sociable, and human-scaled. 2 This study recognizes the versatility of liveability and focuses on the vibrancy aspect. Jacobs 3 associates urban vibrancy with the diversity of uses, people, urban forms, and building types. Diversity promotes urban vitality by accommodating different users and uses at different times. 4 Jacobs 3 favors diversity generators, which combine diverse uses, building types and ages, and the concentration of activities. This study focuses on the diversity of economic opportunities, the streetscape features, and the activities for vibrancy-focused liveability. CABE's 5 place values, supported by Carmona's place value evidence, were used to categorize the vibrancy-focused dimensions. The selected categories are the economic, image, and use values of place. This study asserts that good physical attributes impact economic viability, visual perception (image value), and attractivity (use value) with activities. By using these factors as references, we set the guidelines of economic, image, and use value of place to investigate urban vibrancy.This study utilizes Carmona's 9 compiled evidence for economic value. The urban function and urban form features within public open spaces and heritage sites add a premium to property values, according to evidence in Carmona's 9 study. This study defines use value by applying Jacobs' 3 diversity generators and Montgomery's 6 activity principles for attractiveness. This study involves Nassar's 7 likeability features for the image value of place, which focuses on the visual perception of the physical qualities of city elements. Nassar 7 addresses which physical attributes influence people to like or dislike an urban environment. Accordingly, Nassar 7 sets forth the evaluative criteria, known as likable features. The likable features are naturalness, upkeep, openness, historical significance, and order. 7 In this study, land price is used as the indicator for economic value. Urban function (land use) and form factors such as accessibility and socio-demographic features are the independent variables to measure this value. Active user density is a measure of use value. The use value variables are activity characteristics, temporal diversity, place ratings, accessibility, heritage and visitation, and public open spaces. What differentiates land uses from activities is that land use represents the standard function of the plot. 8 Activities represent the specialized function of each building: for instance, the land use is commercial, but activity can be shopping, accommodation, or office. 8 For image value, the indicator is likeability. The image value variables are traffic density and physical incivilities in the streetscape, building enclosure, urban greening, vistas, and cultural value, based on Nassar’s 7 likable features. Table 1 shows the relevant literature indicators to measure a place's economic, image, and use value.
The compiled evidences of the indices in the literature.
Case study area: Istanbul Historical Peninsula
Eminonu Central Business District in the Istanbul Historical Peninsula is the testbed for this study. The area is a unique district with a unique silhouette, historic urban fabric, remarkable monuments, and topography. 35 This area has also been a focal point of commerce, history, culture, and education. 10 However, the urban development implementations caused dense traffic, decay in the traditional urban fabric, and dominance of commercials. 10 As a result, these urban interventions damage the area's historical integrity and bring problems that decline liveability in the site. Low urban quality, place attachment, social cohesion, and awareness within high visitor concentration are the main problems threading liveability. 35 The uniqueness of historical and urban cultural fabric has been partially protected in the Eminonu Surici area. This area is in-between of being historical and dynamic cosmopolitan city center. This contradiction creates problems and opportunities that affect urban dynamism and generate a research potential. Although a considerable number of urban studies focus on the site, little research deals with data analysis methods to understand the site's vibrancy. This study employs multiple data types to produce meaningful results since the site coverage is too limited for big data analyses. We analyze urban vitality over a place's economic, use, and image value by crowdsourcing LBSN data.
Crowdsourcing big locative data
This study utilizes big urban data and conducts a knowledge discovery process to reveal valuable patterns for evidence-based decisions in urban liveability. Crowdsourcing big urban data has become an urban research hotspot in urban informatics as a decision support tool. The big data concept implies a high volume, velocity, and variety of data, which are the 3Vs for efficient decision-making and better insight. Urban studies take advantage of big data to collect evidence and support decisions. A greater variety and amount of data results in more knowledge and more informed decisions. Location-Based Social Network (LBSN) data denotes data obtained from locative technologies ranging from the online services, platforms, and mobile applications, as defined in Springer dictionary. 11 Urban researchers have increased interest in using locative data from LBSN in urban analysis to generate valuable knowledge about cities' functioning. Based on the reference studies, the most commonly used LBSN platforms are Flickr, Foursquare, Instagram, and Twitter for urban geospatial analysis. The geospatial analysis with LBSN is valuable for capturing hotspot places and their mixed-use levels 12 and user travel patterns 13 within spatial and temporal distribution patterns.,14,37 These case studies present a guideline for the methodology.
Causal knowledge discovery with BBN
Knowledge discovery from databases (KDD) reveals valuable data patterns based on data-mining methods. 15 The knowledge discovery process involves data preparation (cleaning, integration, standardization), pattern searching for information, knowledge evaluation, and presentation stages. 15 We conduct a causal knowledge discovery process with Bayesian Belief Network (BBN) in the methodology. A Bayesian Belief Network (BBN) is “a compact model representation for reasoning under uncertainty, which is represented through conditional probabilities”. 16 BBN is a probabilistic graphical model shown with conditional probability tables (CPT) and directed acyclic graph (DAG). BBN originated from probability and graph theories. The directed acyclic graph represents the causal relationship between the nodes based on probabilistic dependence. The conditional probability table describes the conditional probability distribution of each node. 16 BBN relies on Bayes Theorem, which formulates the conditional probabilities' relationship to extract a belief. The formula for conditional probability is shown below at Equation 1a, and Bayes Theorem 17 is at Equation 1b:


Equation 1a: where P (A|B) is the probability of A given B, P (A∩B) is the probability of occurring events A and B occurring P(B) is the probability of occurring event B. Equation 1b: where P (H|E) denotes the belief or posterior probability and P (H) is the prior probability, P (E|H) is the likelihood (the probability of A given B), and P (E) is the evidence or marginal probability.
Automated learning algorithms and expert knowledge are two ways of constructing the Bayesian Belief Network. The learning algorithms rely on conditional independence (CI) and search-and-scoring algorithms. 18 The first algorithm measures the conditional independencies of nodes. 18 The second algorithm selects the highest scoring relationship pair whose correlations are calculated by statistical tests for BBN formation. 18 This study uses the Necessary Path Condition (NPC) algorithm among CI learning algorithms. NPC algorithm measures the conditional independencies between the nodes (variables) through statistical tests to resolve the uncertainty in the PC learning algorithm. 19 The NPC algorithm allows experts to select the related pair from among the alternatives to resolve any inconsistencies. This study utilizes the NPC learning algorithm and resolves inconsistencies in the BBN via bivariate correlation tests. The BBN network is triangulated with the survey results. In urban studies, BBN has been employed to reveal the relationship between determinants of travel satisfaction, 20 social interaction, 21 and neighborhood popularity. 22 Expert inclusion has been used to calibrate the causal BBN relationships based on participants' evaluation. 20 This study opts to use the HUGIN software which is an appropriate tool for knowledge discovery.
Methodology
The methodology of this study has a quantitative nature. This study presents exploratory research through the use of big data and BBN analysis to examine the vibrancy focused liveability with spatial, functional and perceptual attributes. The consultation of expert opinion and calibration of the BBN relational networks support explanatory purposes of the research. The causal knowledge discovery process involves data collection, information retrieval, and data analysis phases. Web-scraping methods and master plan digitization are the techniques for data collection. We apply different quantitative methods ranging from entropy-based indices, and clustering algorithms to image segmentation and surveys to gauge the measures in information retrieval. Data analysis involves the BBN analysis of the parameters based on conditional dependence to reveal the probabilistic relationship between the variables, which are categorized in Figure 2. We discretize data and employ spatial statistical methods to data to derive spatial information on a grid scale.
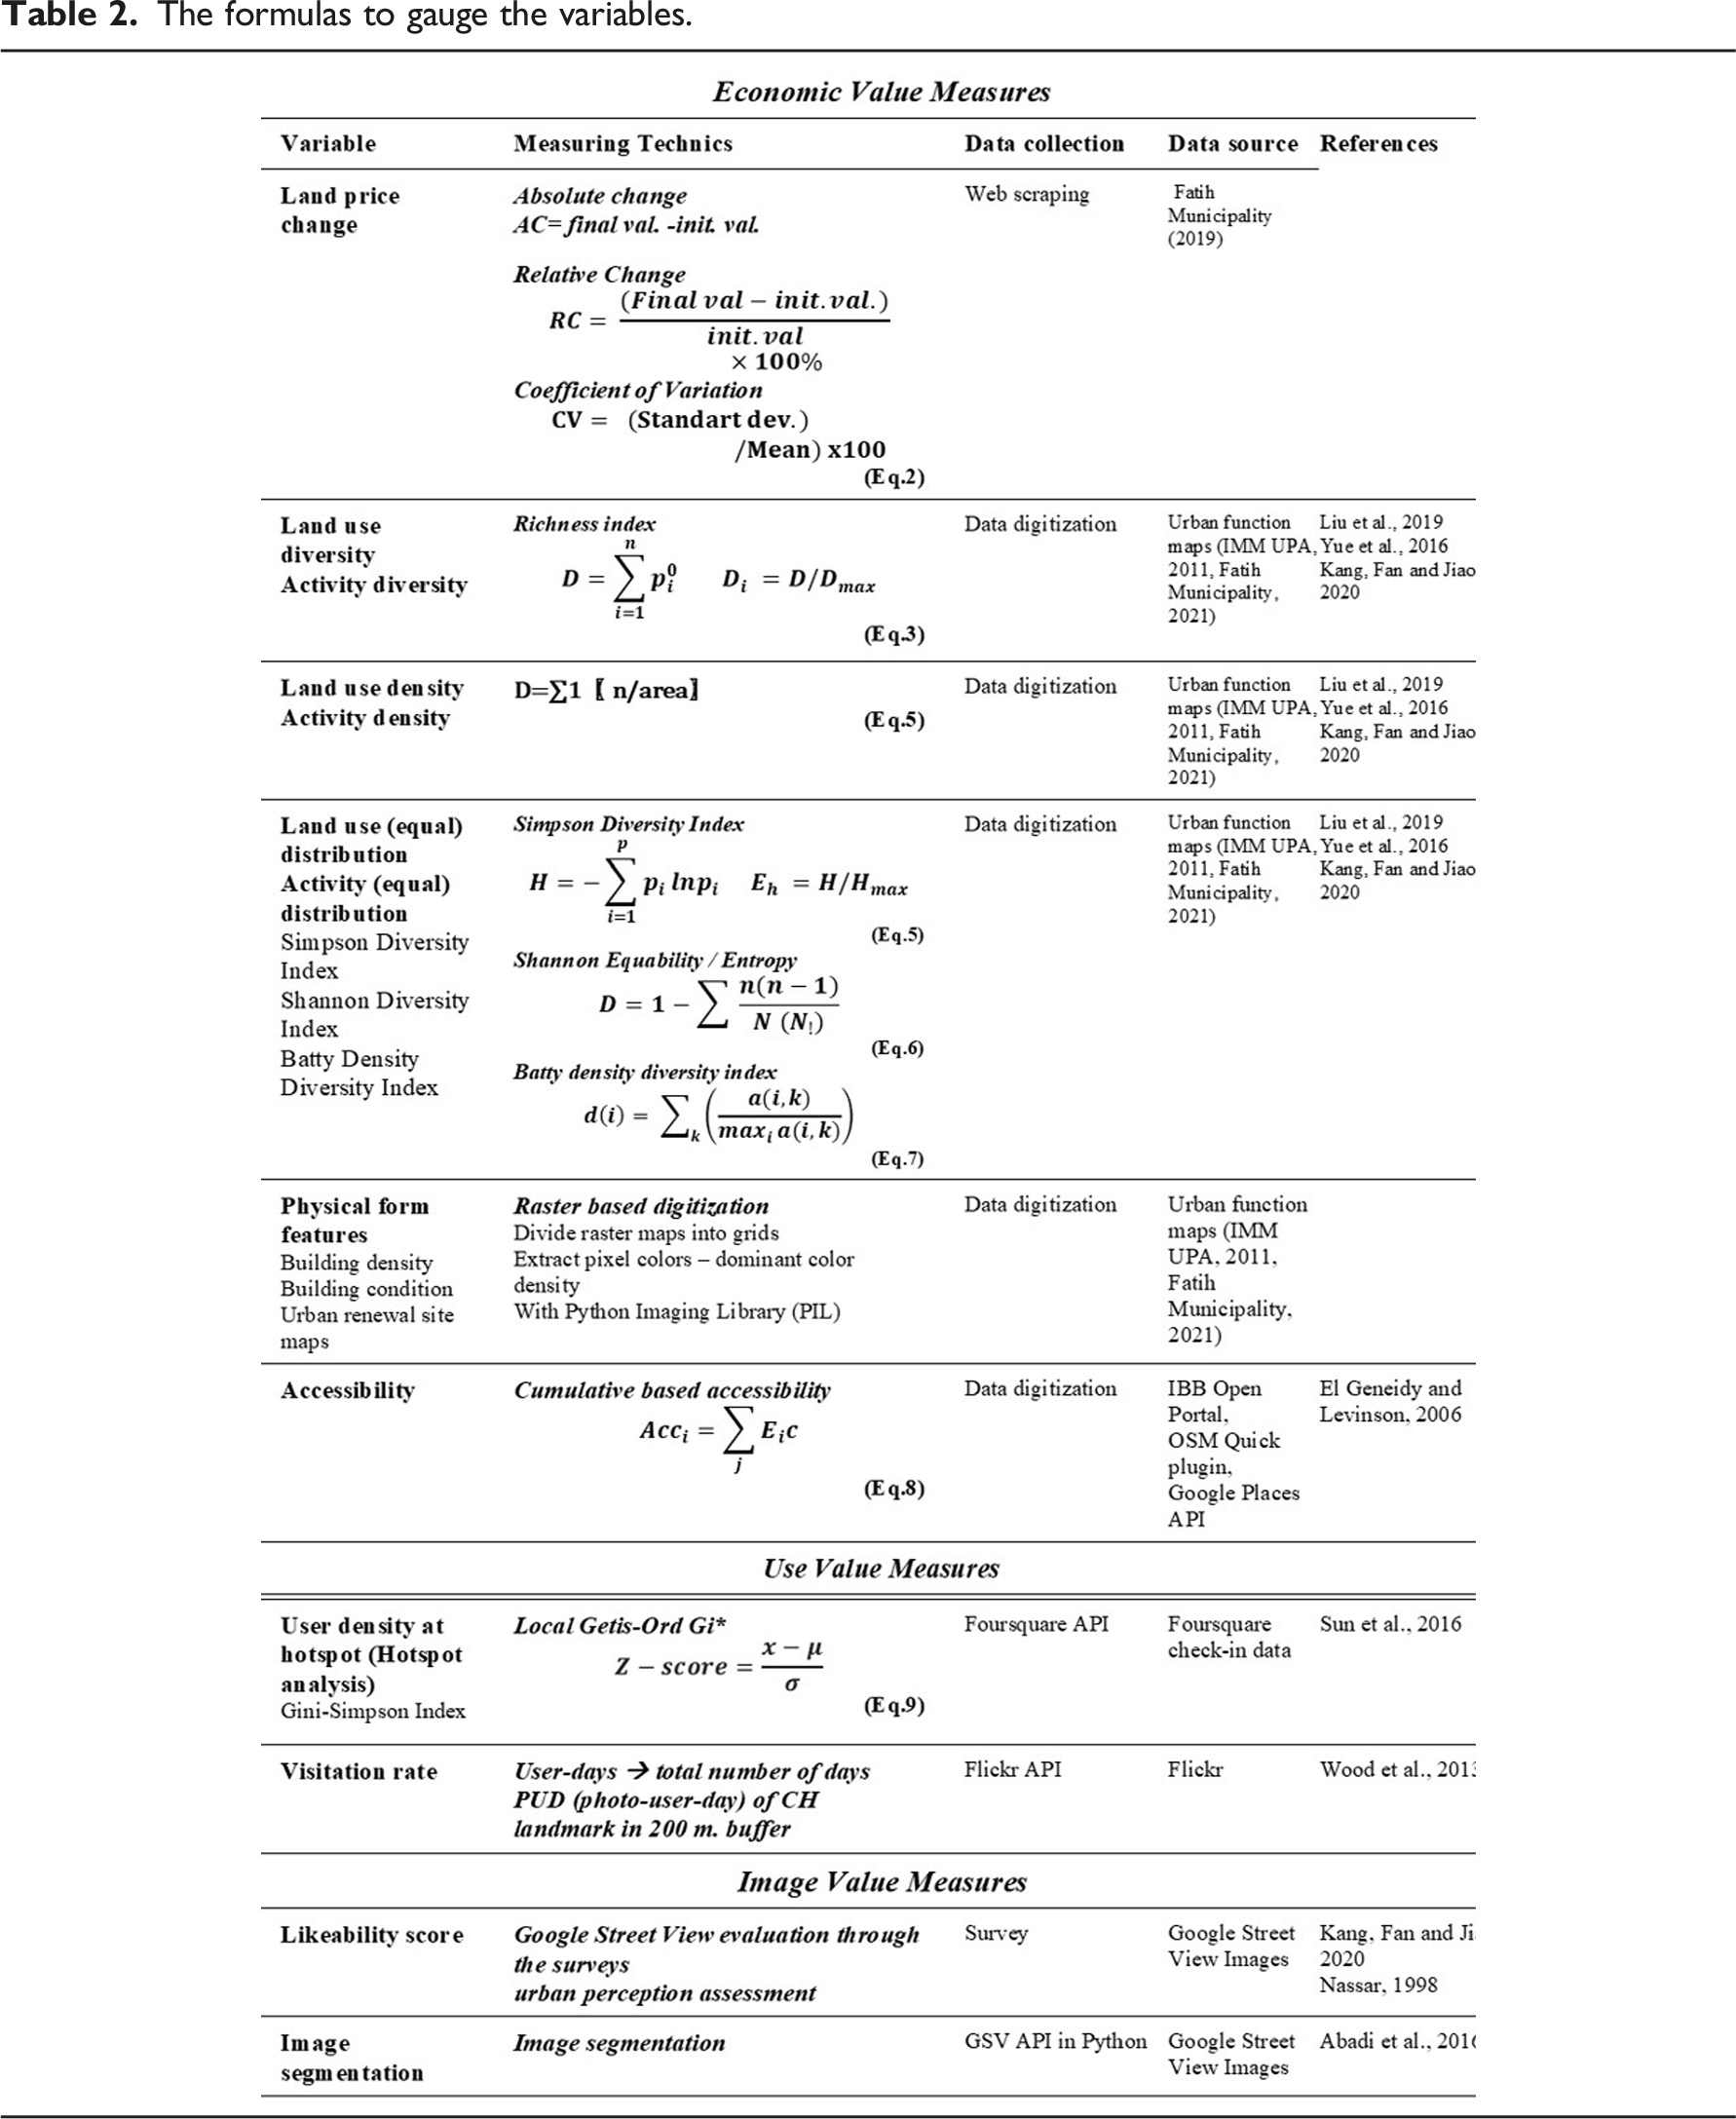
The liveability focused vibrancy measures. The formulas to gauge the variables.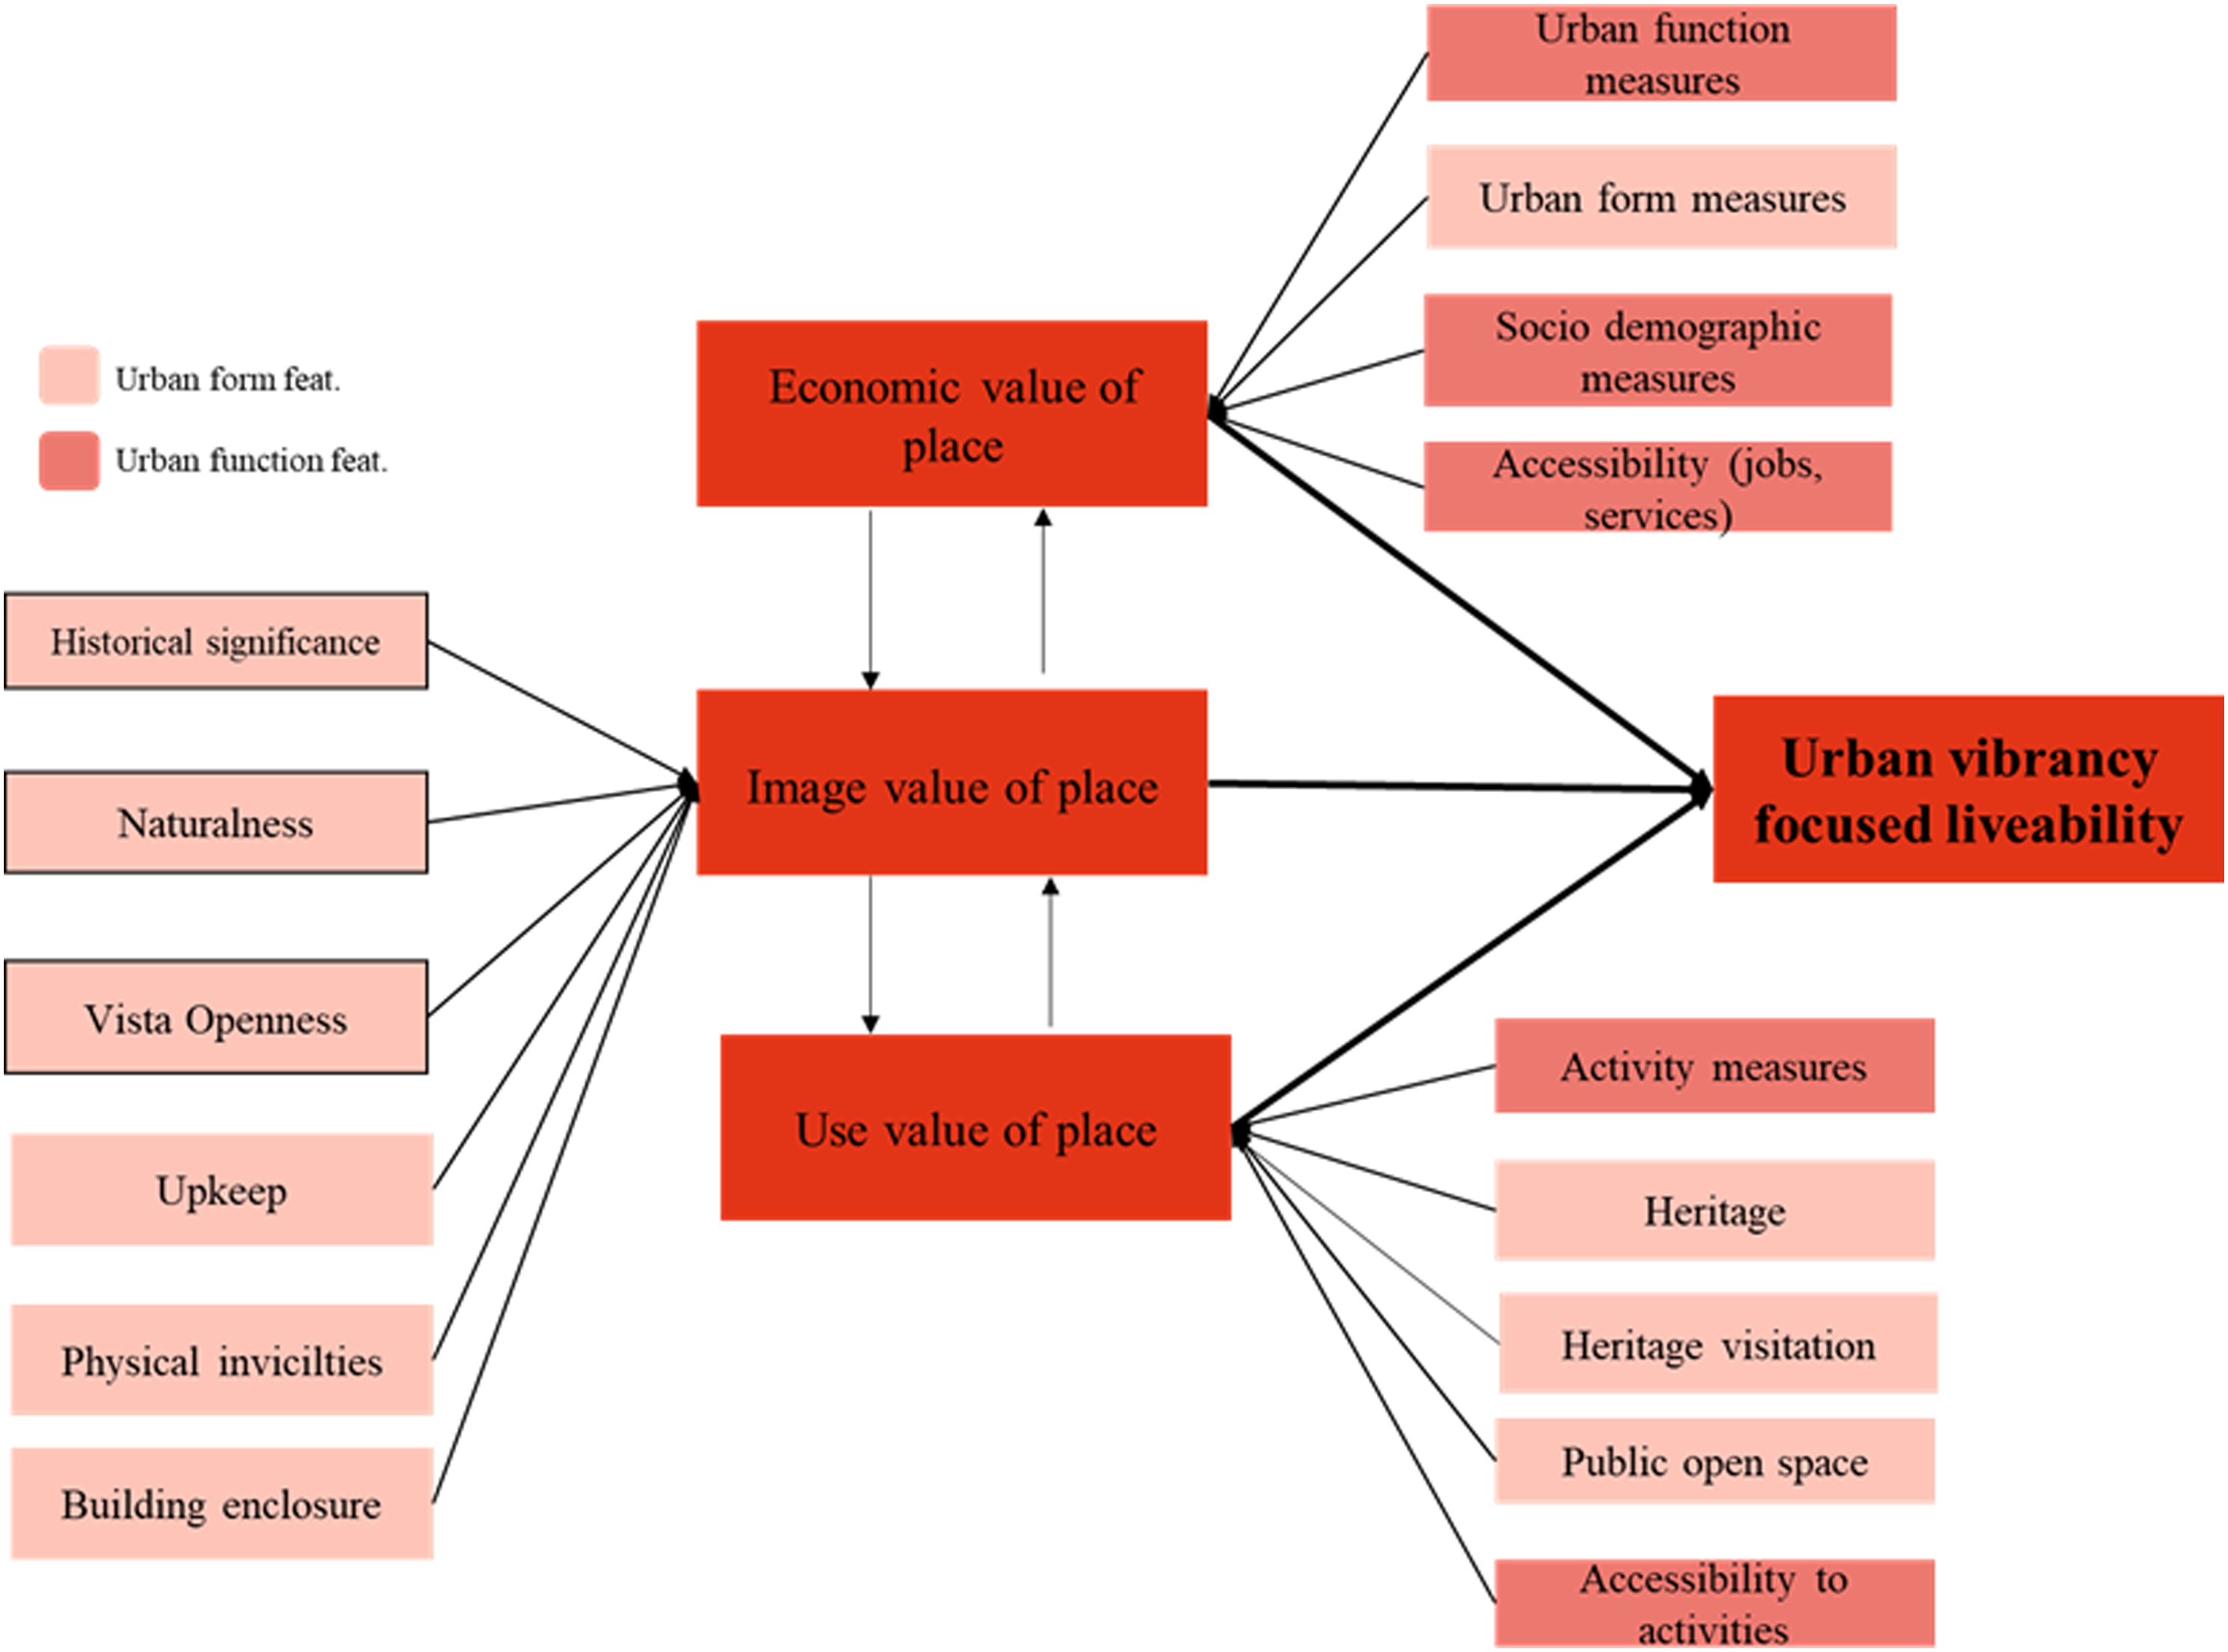
Data collection phase
The dependent variable of economic value is the land price per square meter of the properties. Urban function characteristics, urban form features, and socio-demographic features are independent variables based on the reference. 9 We scrap land price data along the street from the Fatih Municipality Database (2019) between 2015-2019. We apply online data sources (IBB Open Data and OSM Quick Plugin, Google Place API) for public transportation data. Afterward, we digitize urban form and urban function maps.23–25 We used 26 population density database and Mahallem Istanbul 27 SES score for socio-demographic features. In use value measures, the active people density is the dependent variable. Activity characteristics, accessibility to activities, and the attractiveness of activities within cultural landmarks are the independent variables affecting active people density. We take the activity principles 6 and good neighborhood indicators 3 to determine the parameters of the use-value of place. We employ different LBSNs for data collection: Foursquare check-ins for active user density data, Google Places API places for activity (POI) data, and Flickr image data for visitation rate. We utilize the Cultural Inventory Map 24 for cultural landmarks and online data sources (Open IBB, Google Places API, Quick OSM plugin) for public open spaces. Likeability is the dependent variable to measure the image value of place, referring to Nasar (1998). The selection of independent variables relies on Nassar's 7 categorization of likable features. They are urban greening, vista, building condition, enclosure rate, physical incivilities and traffic density, and historical buildings/ landmarks. We extract street points in QGIS, create a spatial dataset, and scrap Google Street View (GSV) Images of these street points through Python's Google Street View API module. The GSV images have been used to extract streetscape attributes. The ways of data collection and sources have been tabularized in Table 2.
Information retrieval
We compare the absolute and relative change in land price (total change and change in percent) with the coefficient of variation of land price change. The coefficient of variation is a relative measure of variability that compares variability between different groups based on dispersion (Equation 2). The urban function (land use) characteristics are land-use diversity, density, and distribution, and measured with entropy-based diversity indices. Land use diversity is measured with the Richness index (Equation 3) and land use density with the Density Index (Equation 4). For land-use (equal) distribution, this study compares Simpson 28 (Equation 5), Shannon 29 (Equation 6), and Batty DDI 30 (Equation 7) indexes based on references. The cumulative opportunities-based accessibility (Equation 8) counts the number of opportunities reached within a determined travel time or distance. 30 We count the accessible commercials inside the buffers of 200 m walking distance for accessibility to jobs and services in 200 m for accessibility to services. We conduct automatic linear regression modeling (ALRM) on several variables to understand which variable fits the model. The result shows that the coefficient of variation (CV) of land price fits the model with 71 percent accuracy for land price and Simpson Index for land-use distribution with 61 percent accuracy
We utilize different measuring techniques to gauge the use-value measures: Getis-Ord Gi* for active user density, the entropy-based diversity indices for activity characteristics, cumulative opportunities for accessibility, and photo-user-day (PUD) for visitation rate. For activity characteristics, we implement richness index (Equation 3), density index (Equation 4), Simpson 28 (Equation 5), Shannon 29 (Equation 6), and Batty DDI 30 (Equation 7) in parallel with urban function. We calculate each place's weekly average working hours for time diversity. We classify the place's working hours as extended (> 12 hours) or conventional (< 12 hours) working time. For place rate, we take the average user ratings for each activity. We count the accessible activity places inside the buffers of 200 m walking distance for accessibility using Equation 6. 31 Wood and others' study 32 used Flickr as a data source to calculate the number of photo user-days, called the 'photo-user-days' (PUD) measure, as shown in Equation 9. We employ the PUD measure for the visitation rate. We counted the users inside cultural landmarks buffer zones (20 m) for each day. We averaged a year to find the visitation rate. For active user density, we utilize the hotspot level. We apply Getis Ord Gi* 33 clustering algorithm to find the hotspot and coldspot places based on user density through the Hotspot Plugin of QGIS. The ALRM test shows that the Simpson Index fits the model with 33 percent accuracy for activity distribution.
We used the GSV images to extract street attributes and assess street likeability using 34 algorithms to extract image value measures. In the survey, we request respondents to evaluate the GSV images with 5 points Likert scale evaluation. We asked 60 participants and obtained ten responses per 100 questions. We get the mean of the responses' scores from the survey as the likable score of the streets. We utilize the image segmentation method for GSV images to audit the likable features. The image segmentation method uses a convolutional neural network to extract image features. The building rate, urban greening, physical incivilities feature, and traffic density are the parameters whose ratios are measured through the image segmentation method. We opt to employ Tensorflow to extract the image features. We assign semantic labels (building features) with color to every pixel in the image and calculate the ratio of the labeled building element. Figure 3.
The likeability survey, and image segmentation of GSV.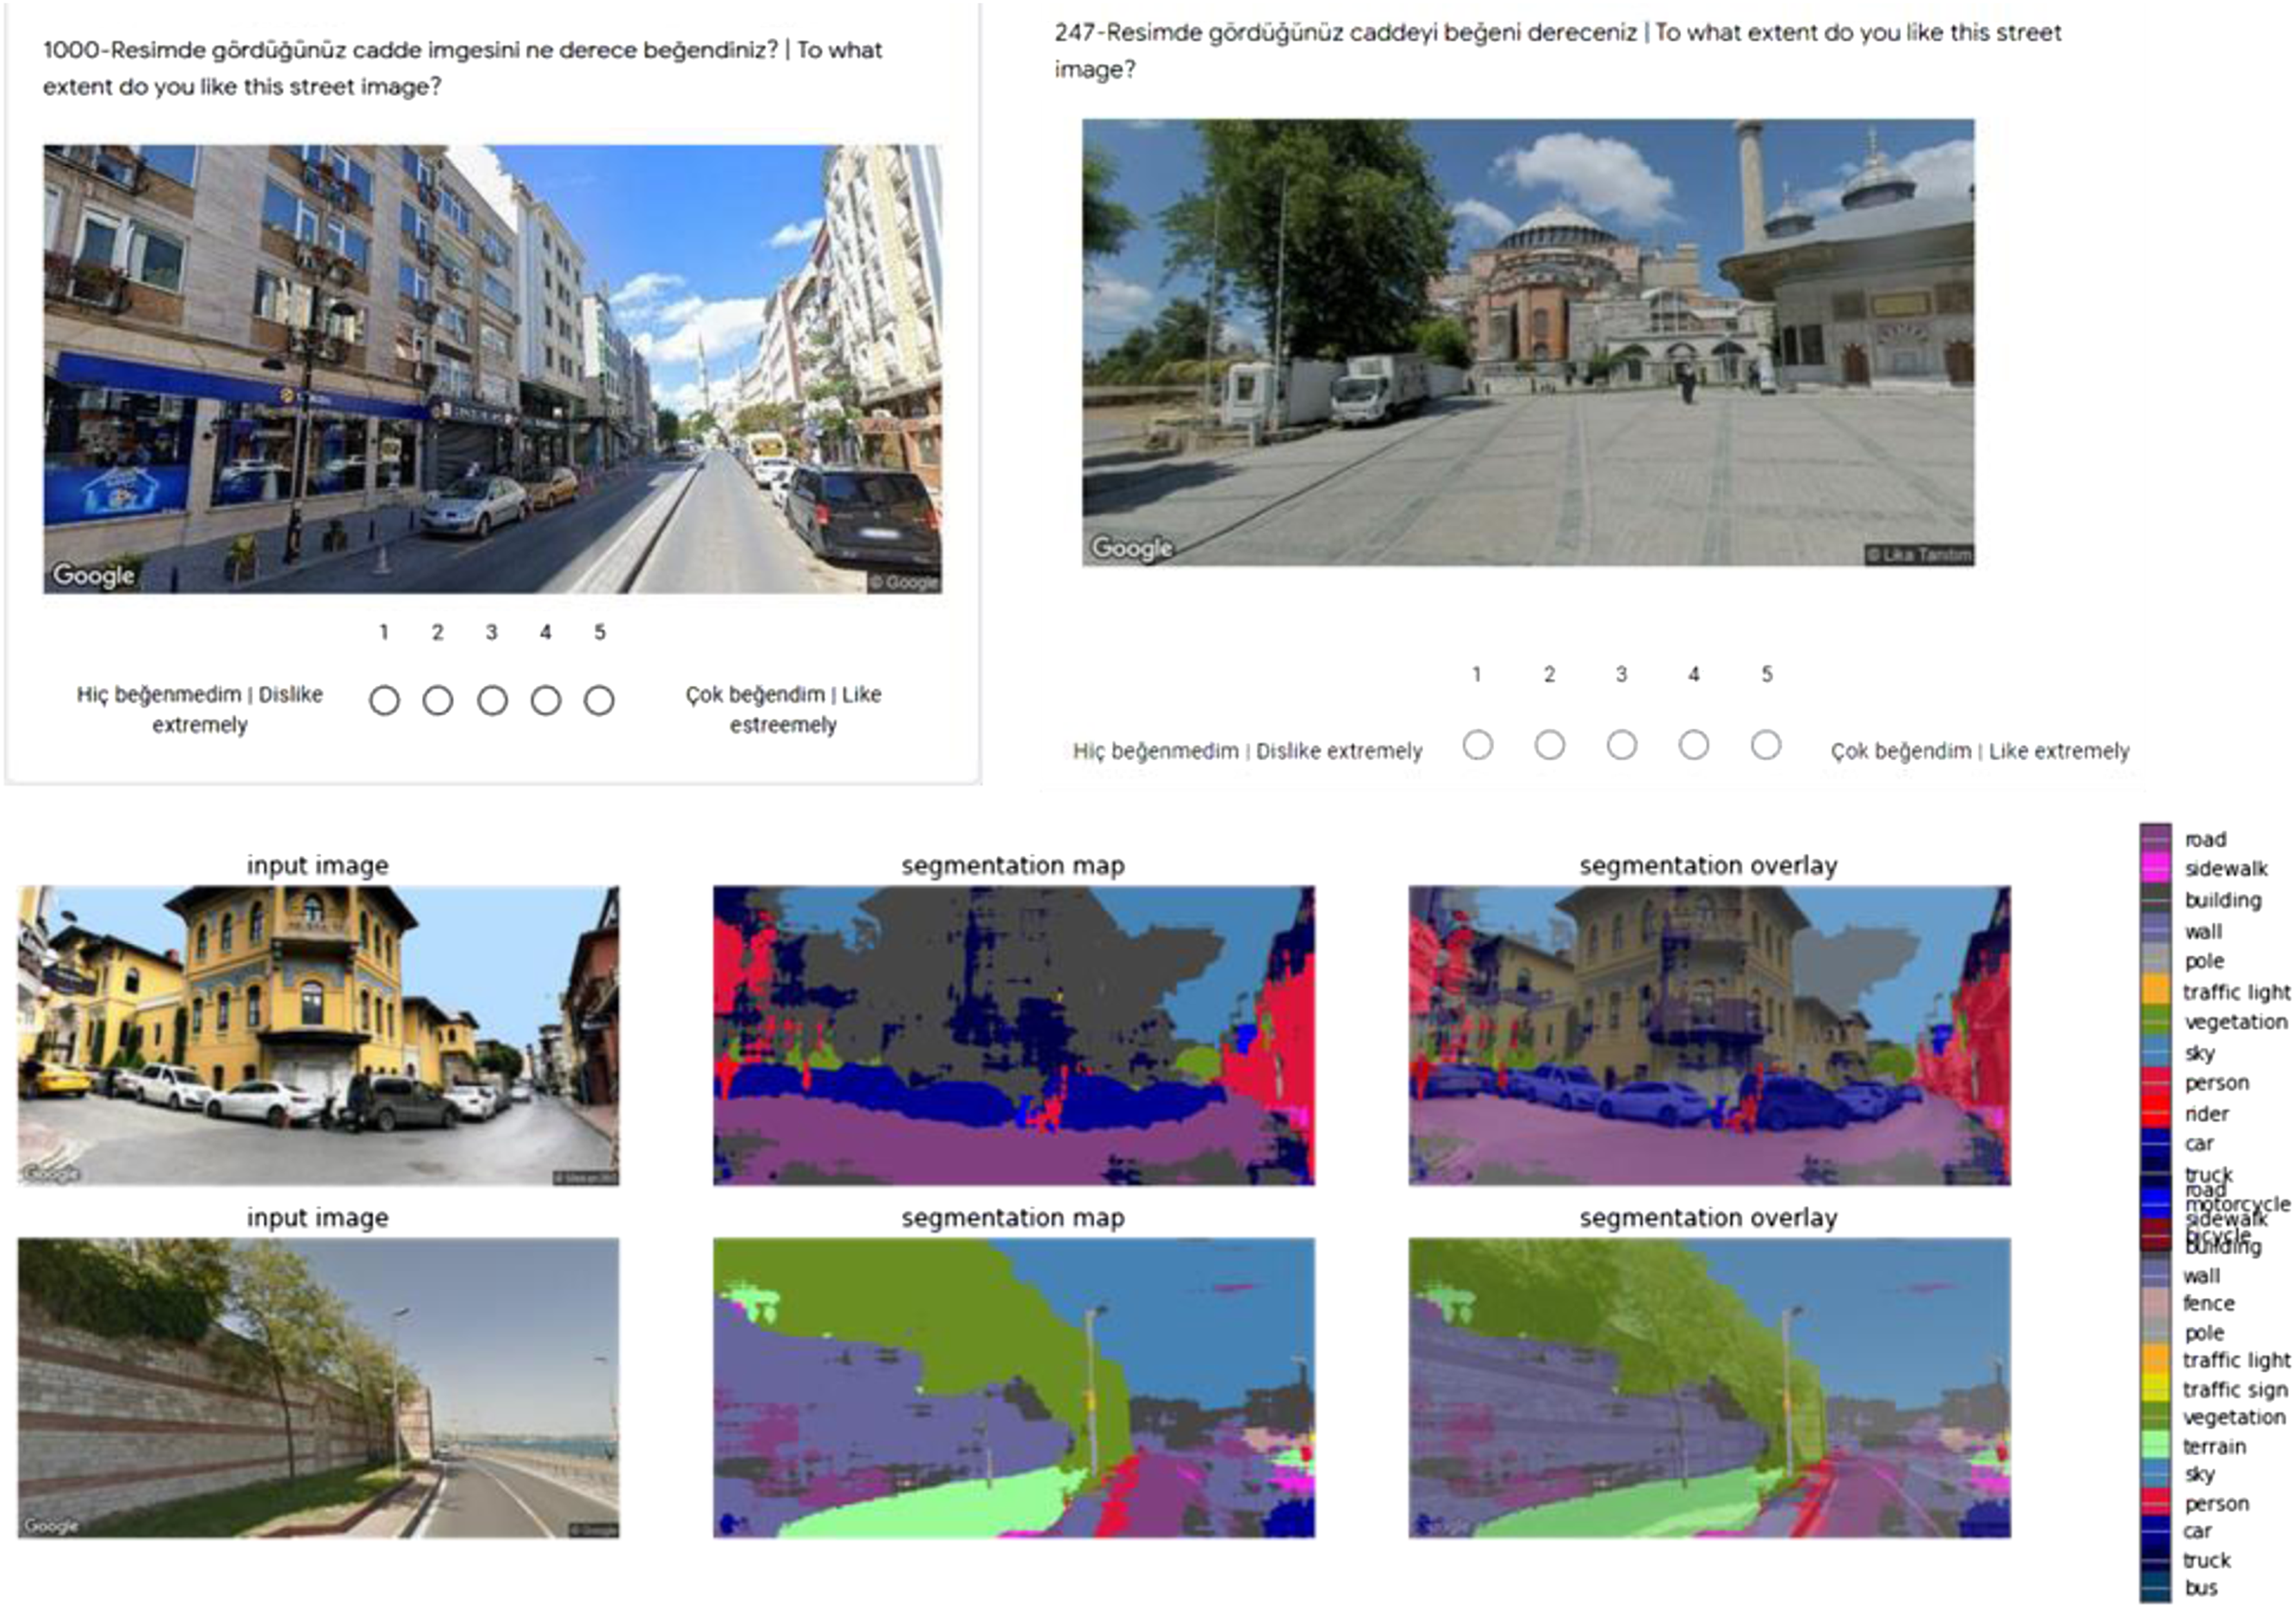
BBN analysis of Urban vibrancy measures
Before starting BBN analysis, this study conducts statistical analysis to evaluate the correlation between the measures, whose results are in
The BBN model of economic value contains twelve nodes with eleven independent and one dependent node, connected with 21 edges. Per node has 1.75 parents on average. The land price change (target node) has the maximum number of parents (7 parents) in the constructed BBN model. The NPC algorithm found most of the relationships in the correlation test; only one relationship was added to the network (urban renewal—land price change). Among the different models, the log-likelihood of the selected model is calculated as −720.270. The analysis results of the constructed BBN are satisfactory, with an 8.05% error rate and 91.66% of parameter sensitivity. The BBN model has a high complexity level (total CPT for discrete nodes: 17,785). The constructed BBN is displayed in Figure 4 with the probability distribution. BBN network monitoring node probabilities of economic value indices.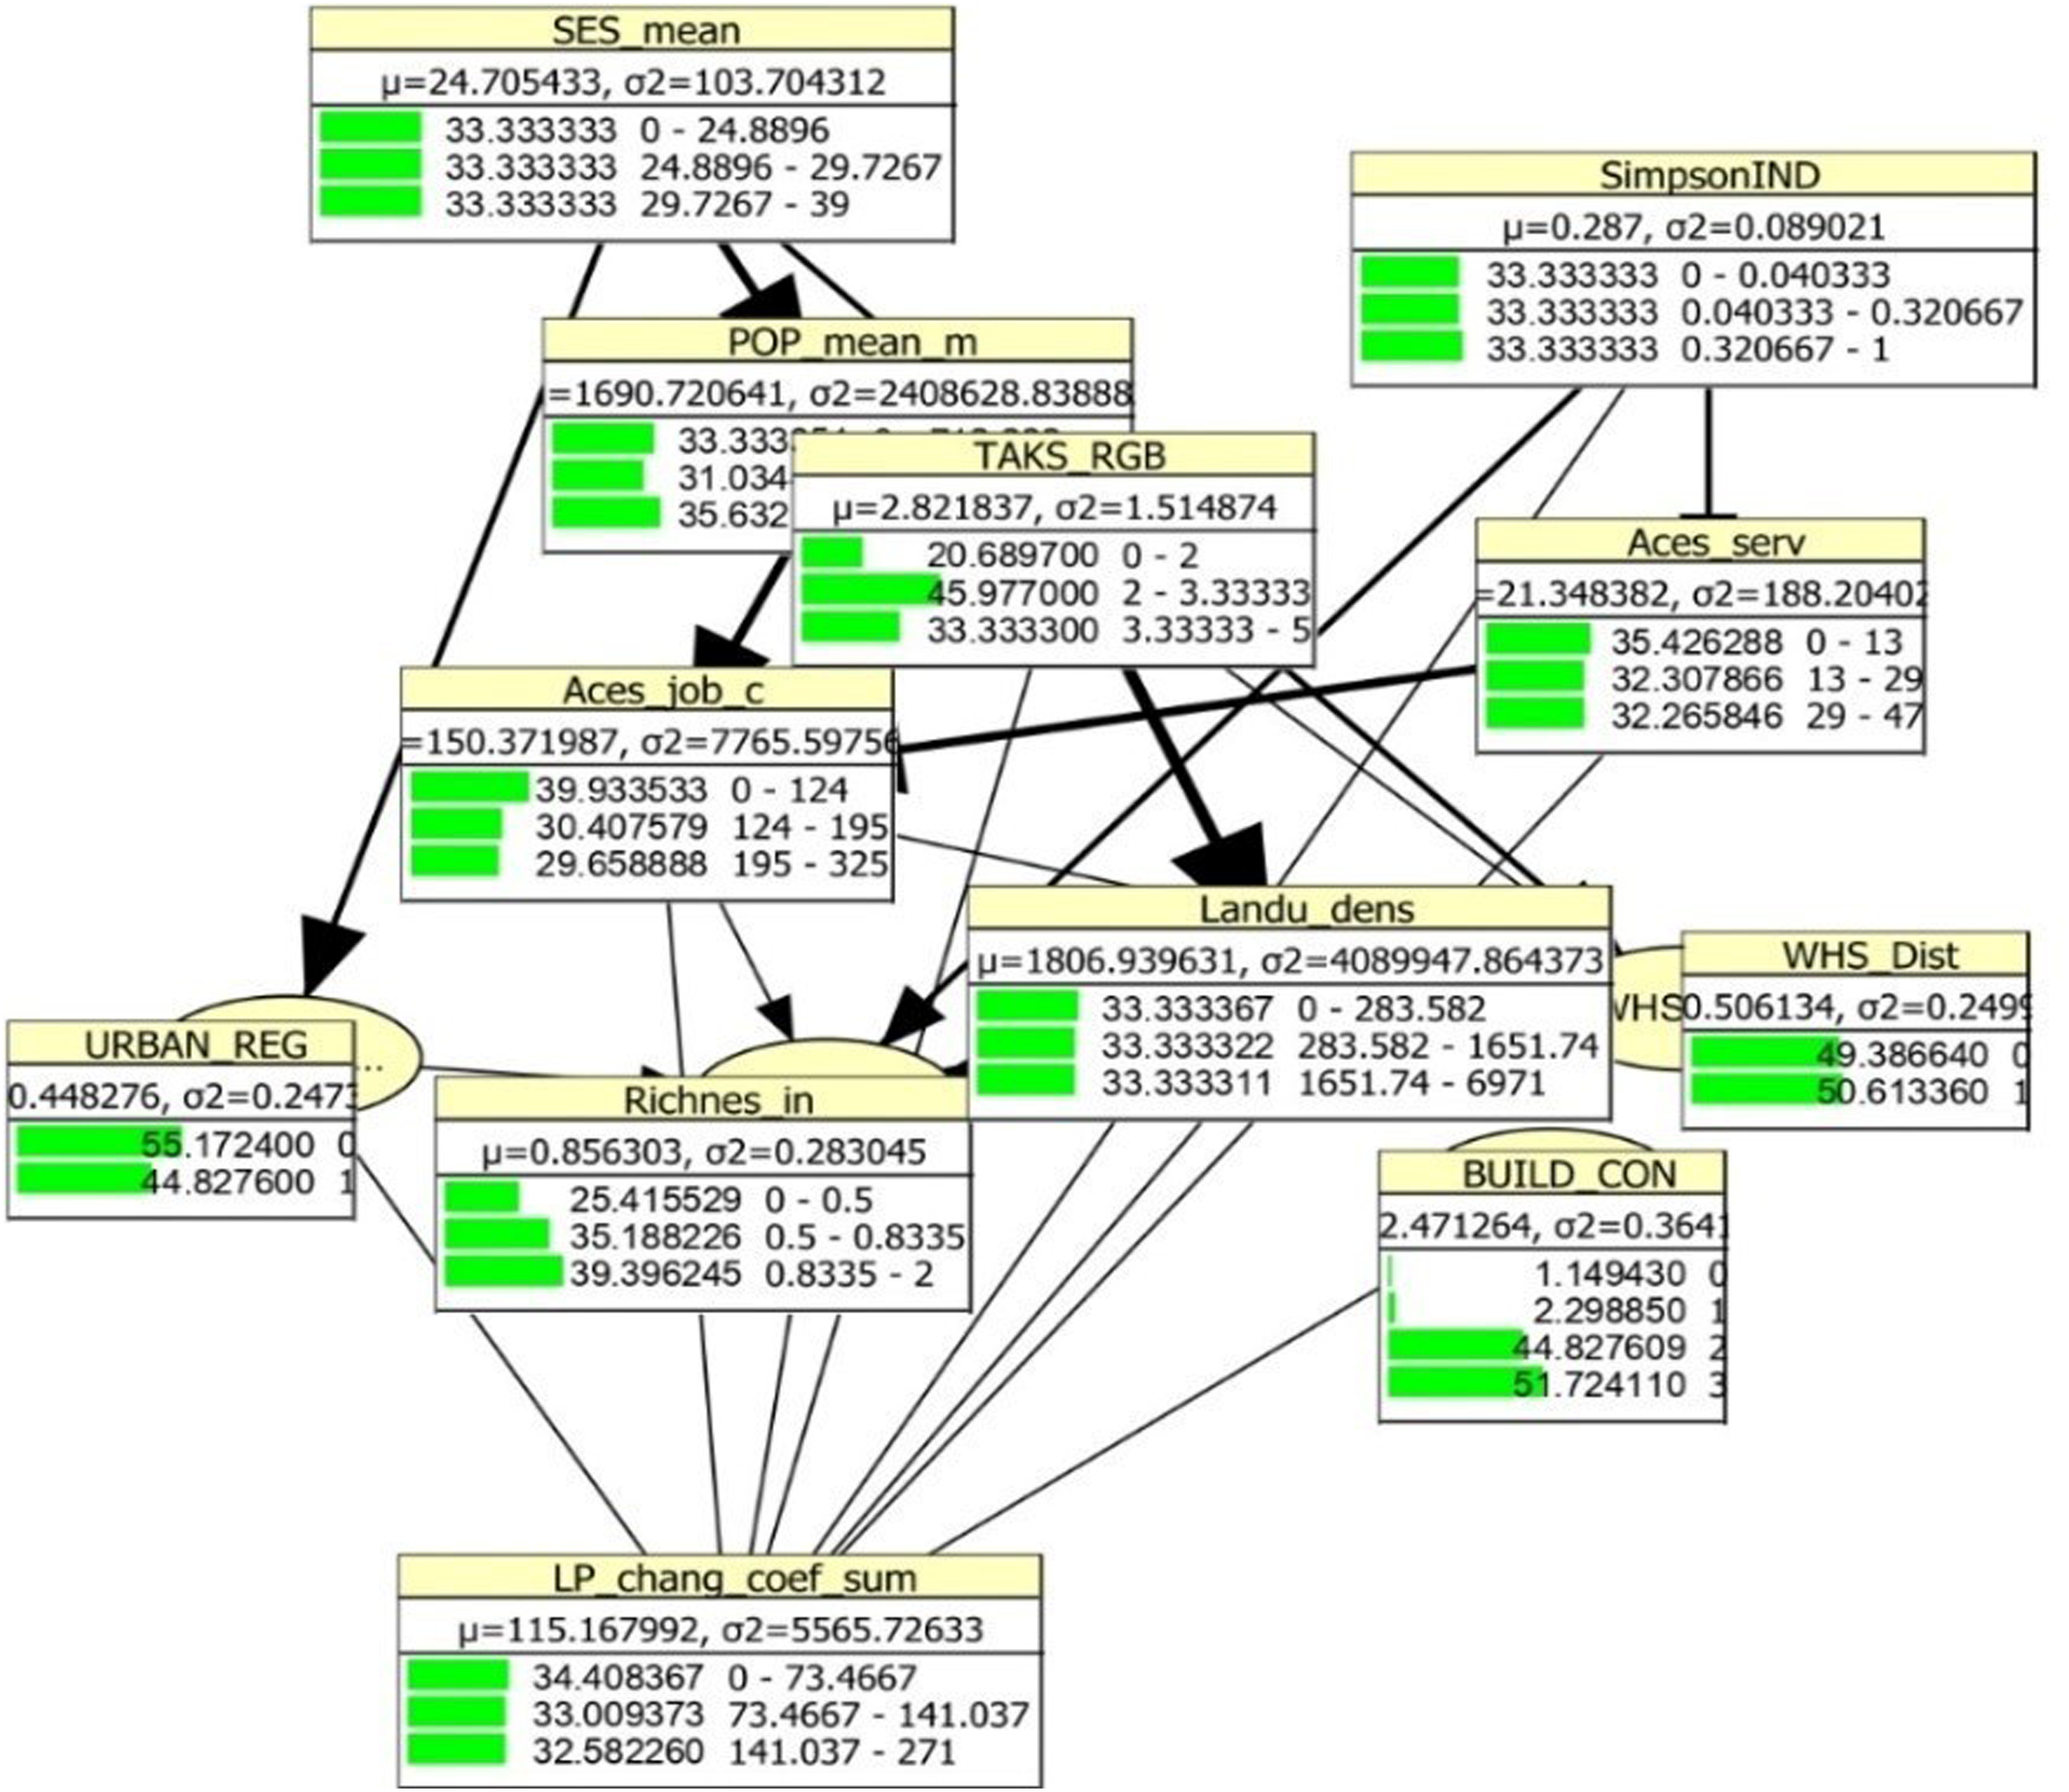
The BBN model of use-value contains ten nodes with nine independent and one dependent node connected with 16 edges. Per node has 1.60 parents on average. Active user density in the hotspot (dependent node) has the maximum number of parents (5 parents). The NPC algorithm found most of the relationships in the correlation test; only one relationship was added to the network (activity diversity-hotspot level). We construct different models using value measures and select the model whose log-likelihood score is high with −641.361. The analysis results of the constructed BBN are satisfactory, with a 12.64% error rate and 100% parameter sensitivity. The BBN model has a moderate complexity level (total CPT for discrete nodes: 279). The probability distribution of BBN is displayed in Figure 5. BBN network monitoring node probabilities of use value indices.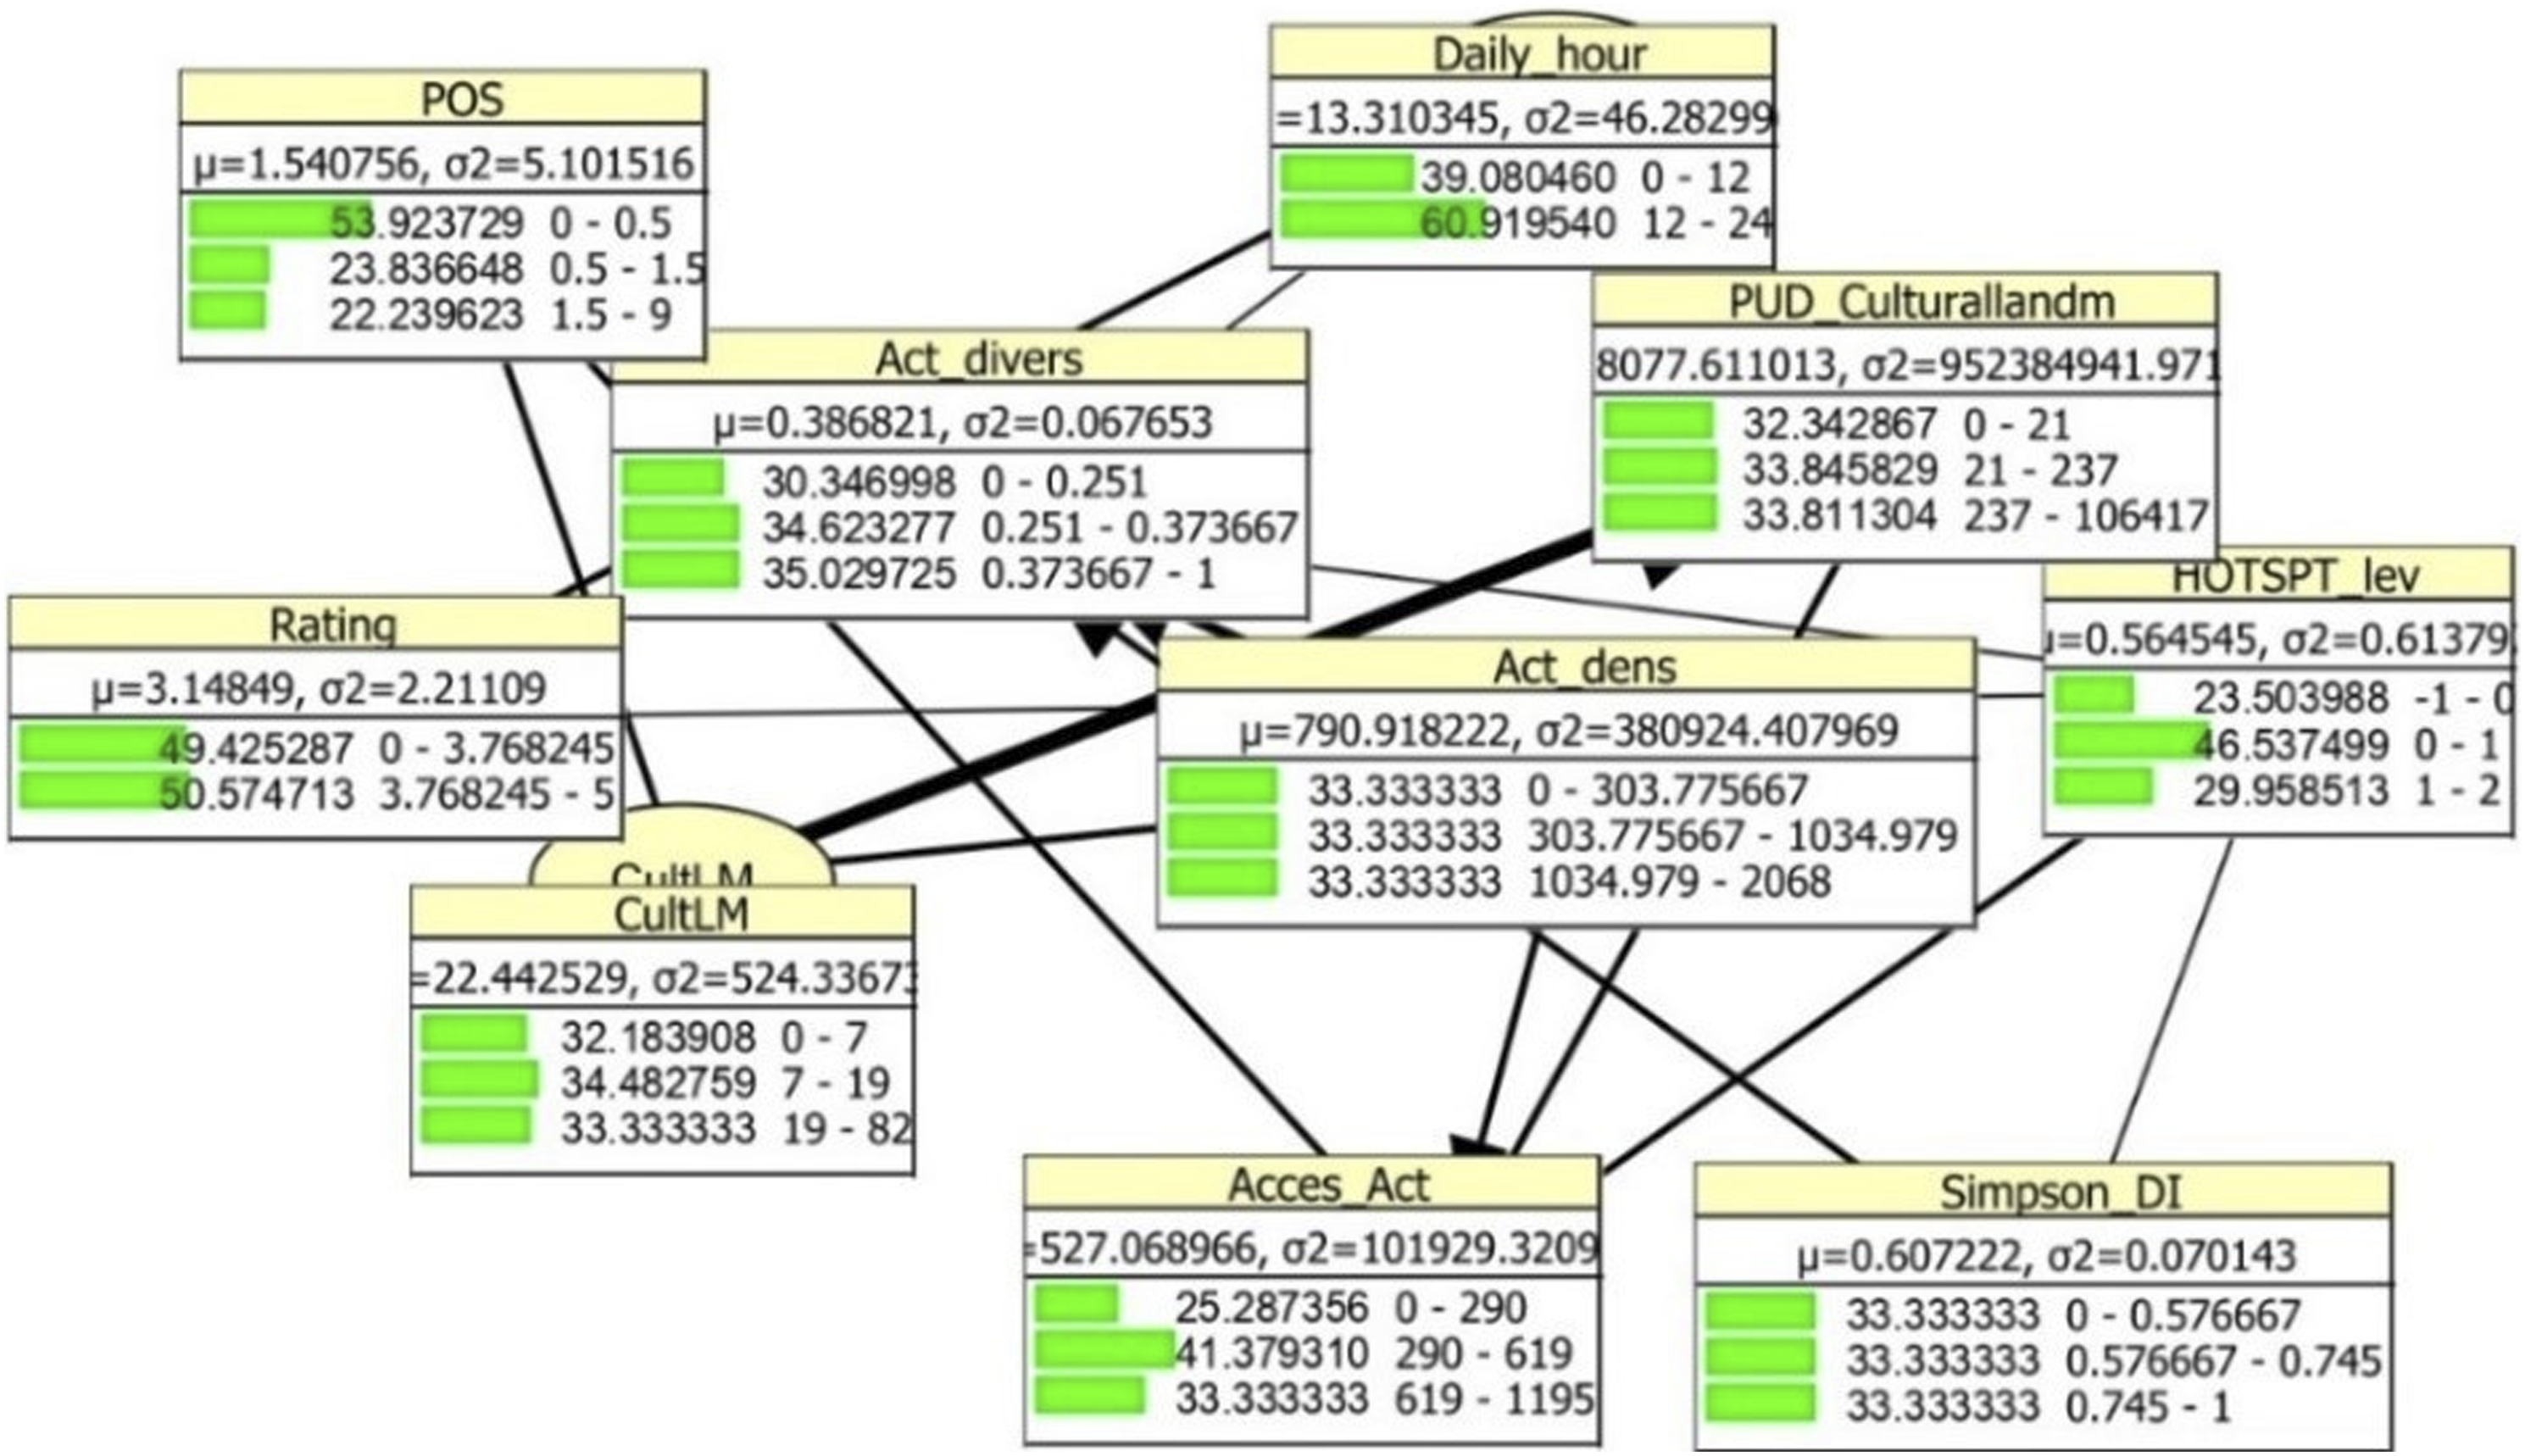
The BBN model of image value contains eight nodes with seven independent and one dependent node, connected with 10 edges. Per node has one parent on average. The target node (likeability) has the maximum number of parents (4 parents). The NPC algorithm found most of the relationships; only one relationship has been added based on the correlation test (traffic-nature score) result to fit the model to statistical analysis with minimum intervention. The log-likelihood score is −523.839. The analysis results of the constructed BBN are satisfactory, with a 4.10% error rate and 100% parameter sensitivity. The BBN model has a low complexity level (total CPT for discrete nodes: 162). The constructed BBN is displayed in Figure 6 with the probability distribution. The building condition variable represents the upkeep feature, but it is removed since there is no significant correlation with that variable both in the correlation test and BBN analysis. When we compare the models, we can state that the image value BBN has the highest likelihood score, with the use-value BBN in the second place and the economic value BBN in the third place. The order is reversed if we compare the network complexity and variable numbers. Image value BBN has the most minor complicated network with fewer variables, while the use-value BBN is the second, and economic value is the most complicated with more variables. Accordingly, we can indicate that the number of variables increases the complexity and decreases BBN’s likelihood performance. BBN network monitoring node probabilities of image value indices.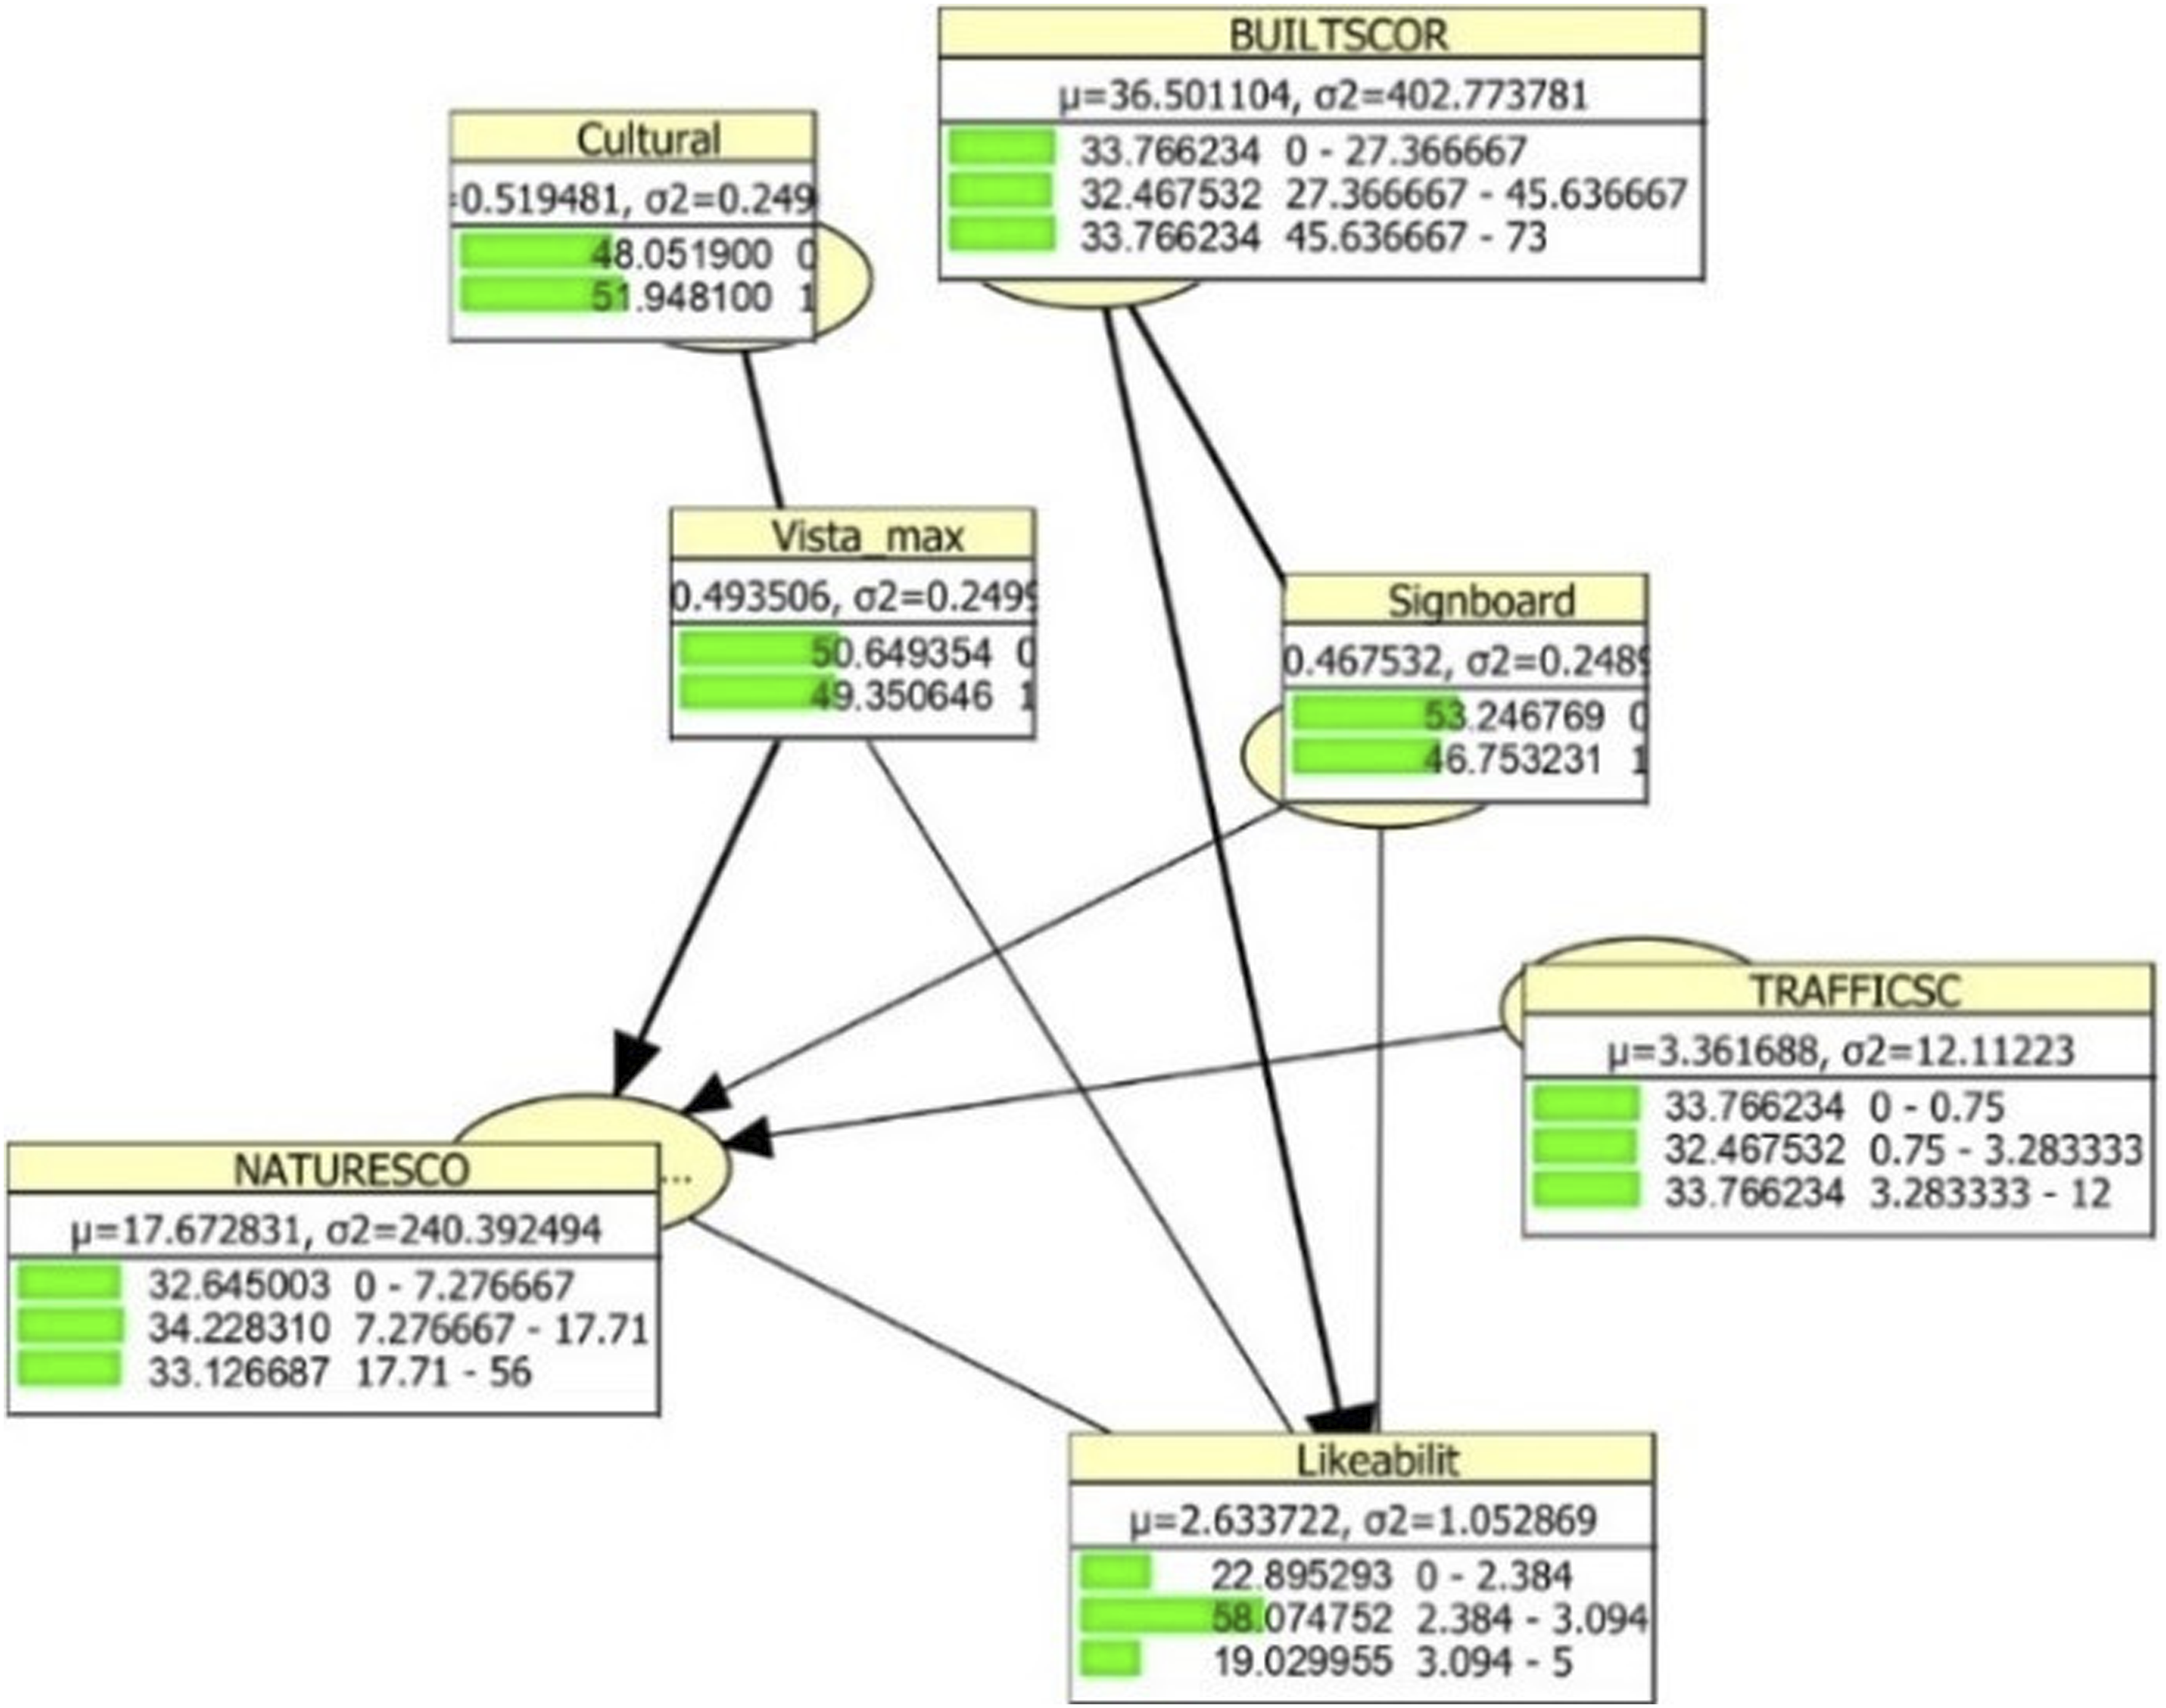
Results
Case study results
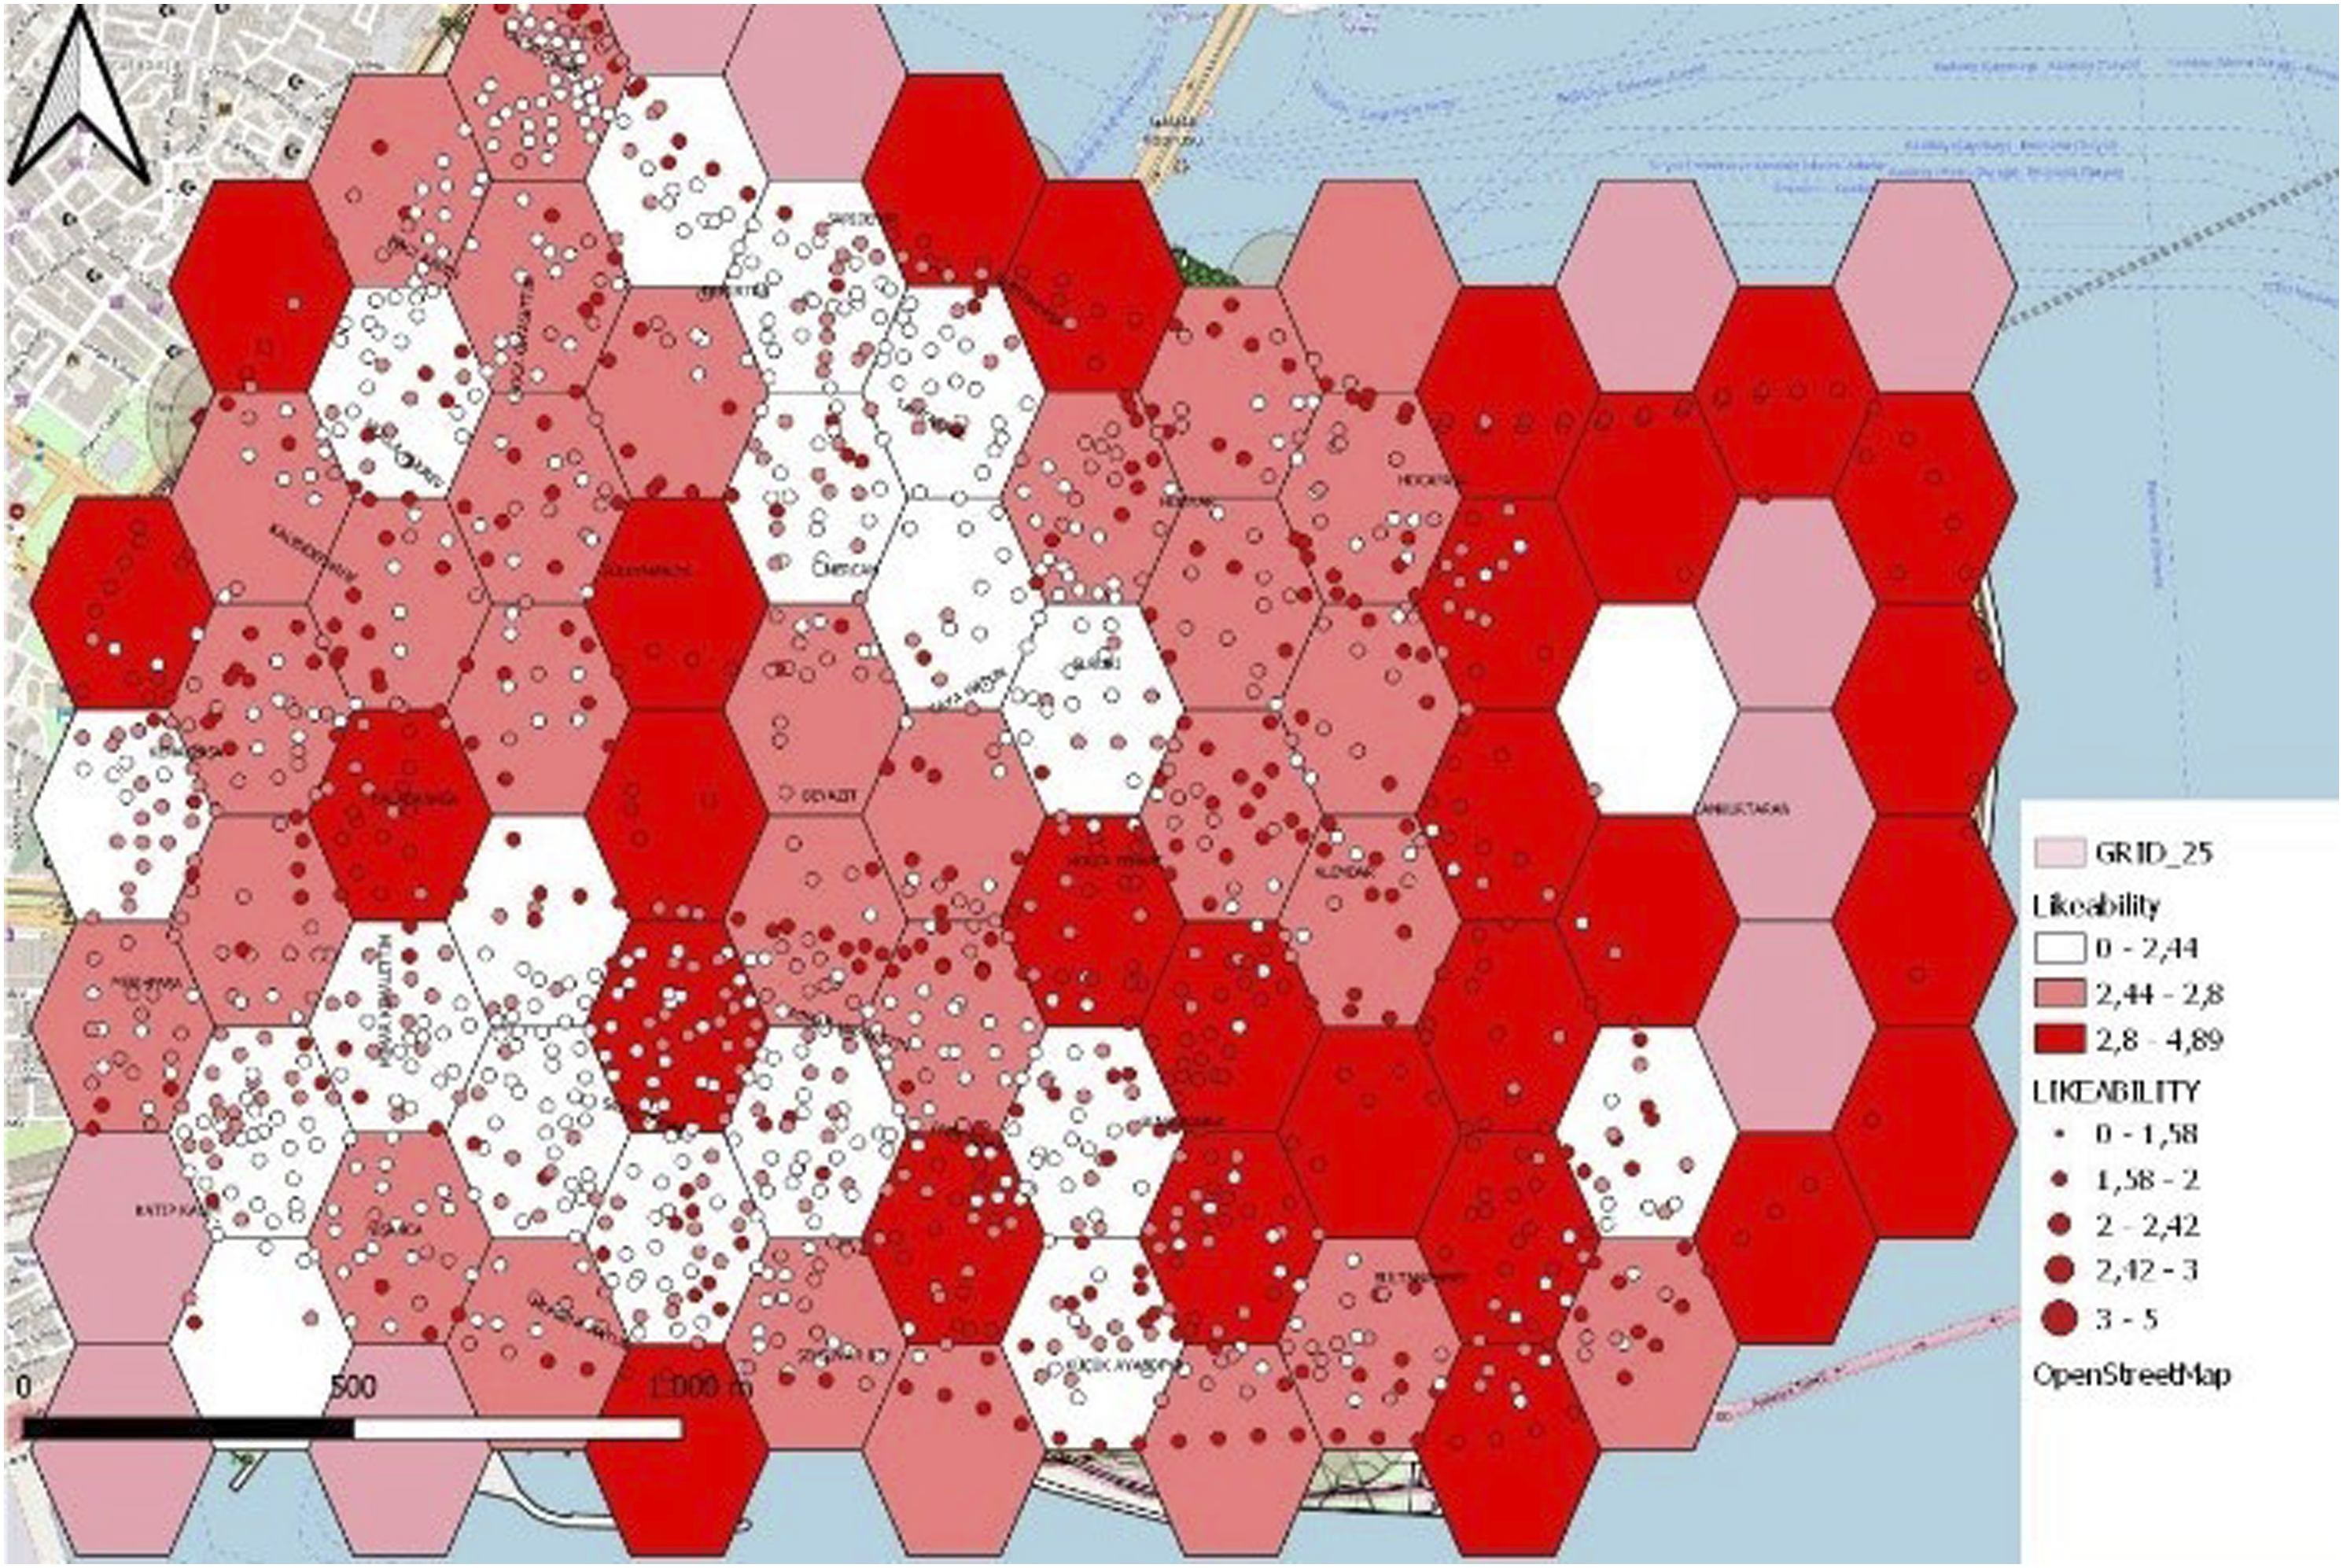
The case study area has shown in Figure 7. The change in land prices is the biggest around the peninsula’s coastline and commercial focal points (Tahtakale and Beyazit Districts) (Figure 8). The results demonstrate that land use density, diversity, accessibility, heritage, and urban renewal add a premium to land prices; however, the impact of building conditions and demographic attributes are slight. Consequently, the urban function (land-use) characteristics have more importance for the land price than urban form features. Regarding the results of spatial analysis, the study states that land use features and accessibility become significant indicators to add economic value to the site. Istanbul Historical Peninsula map.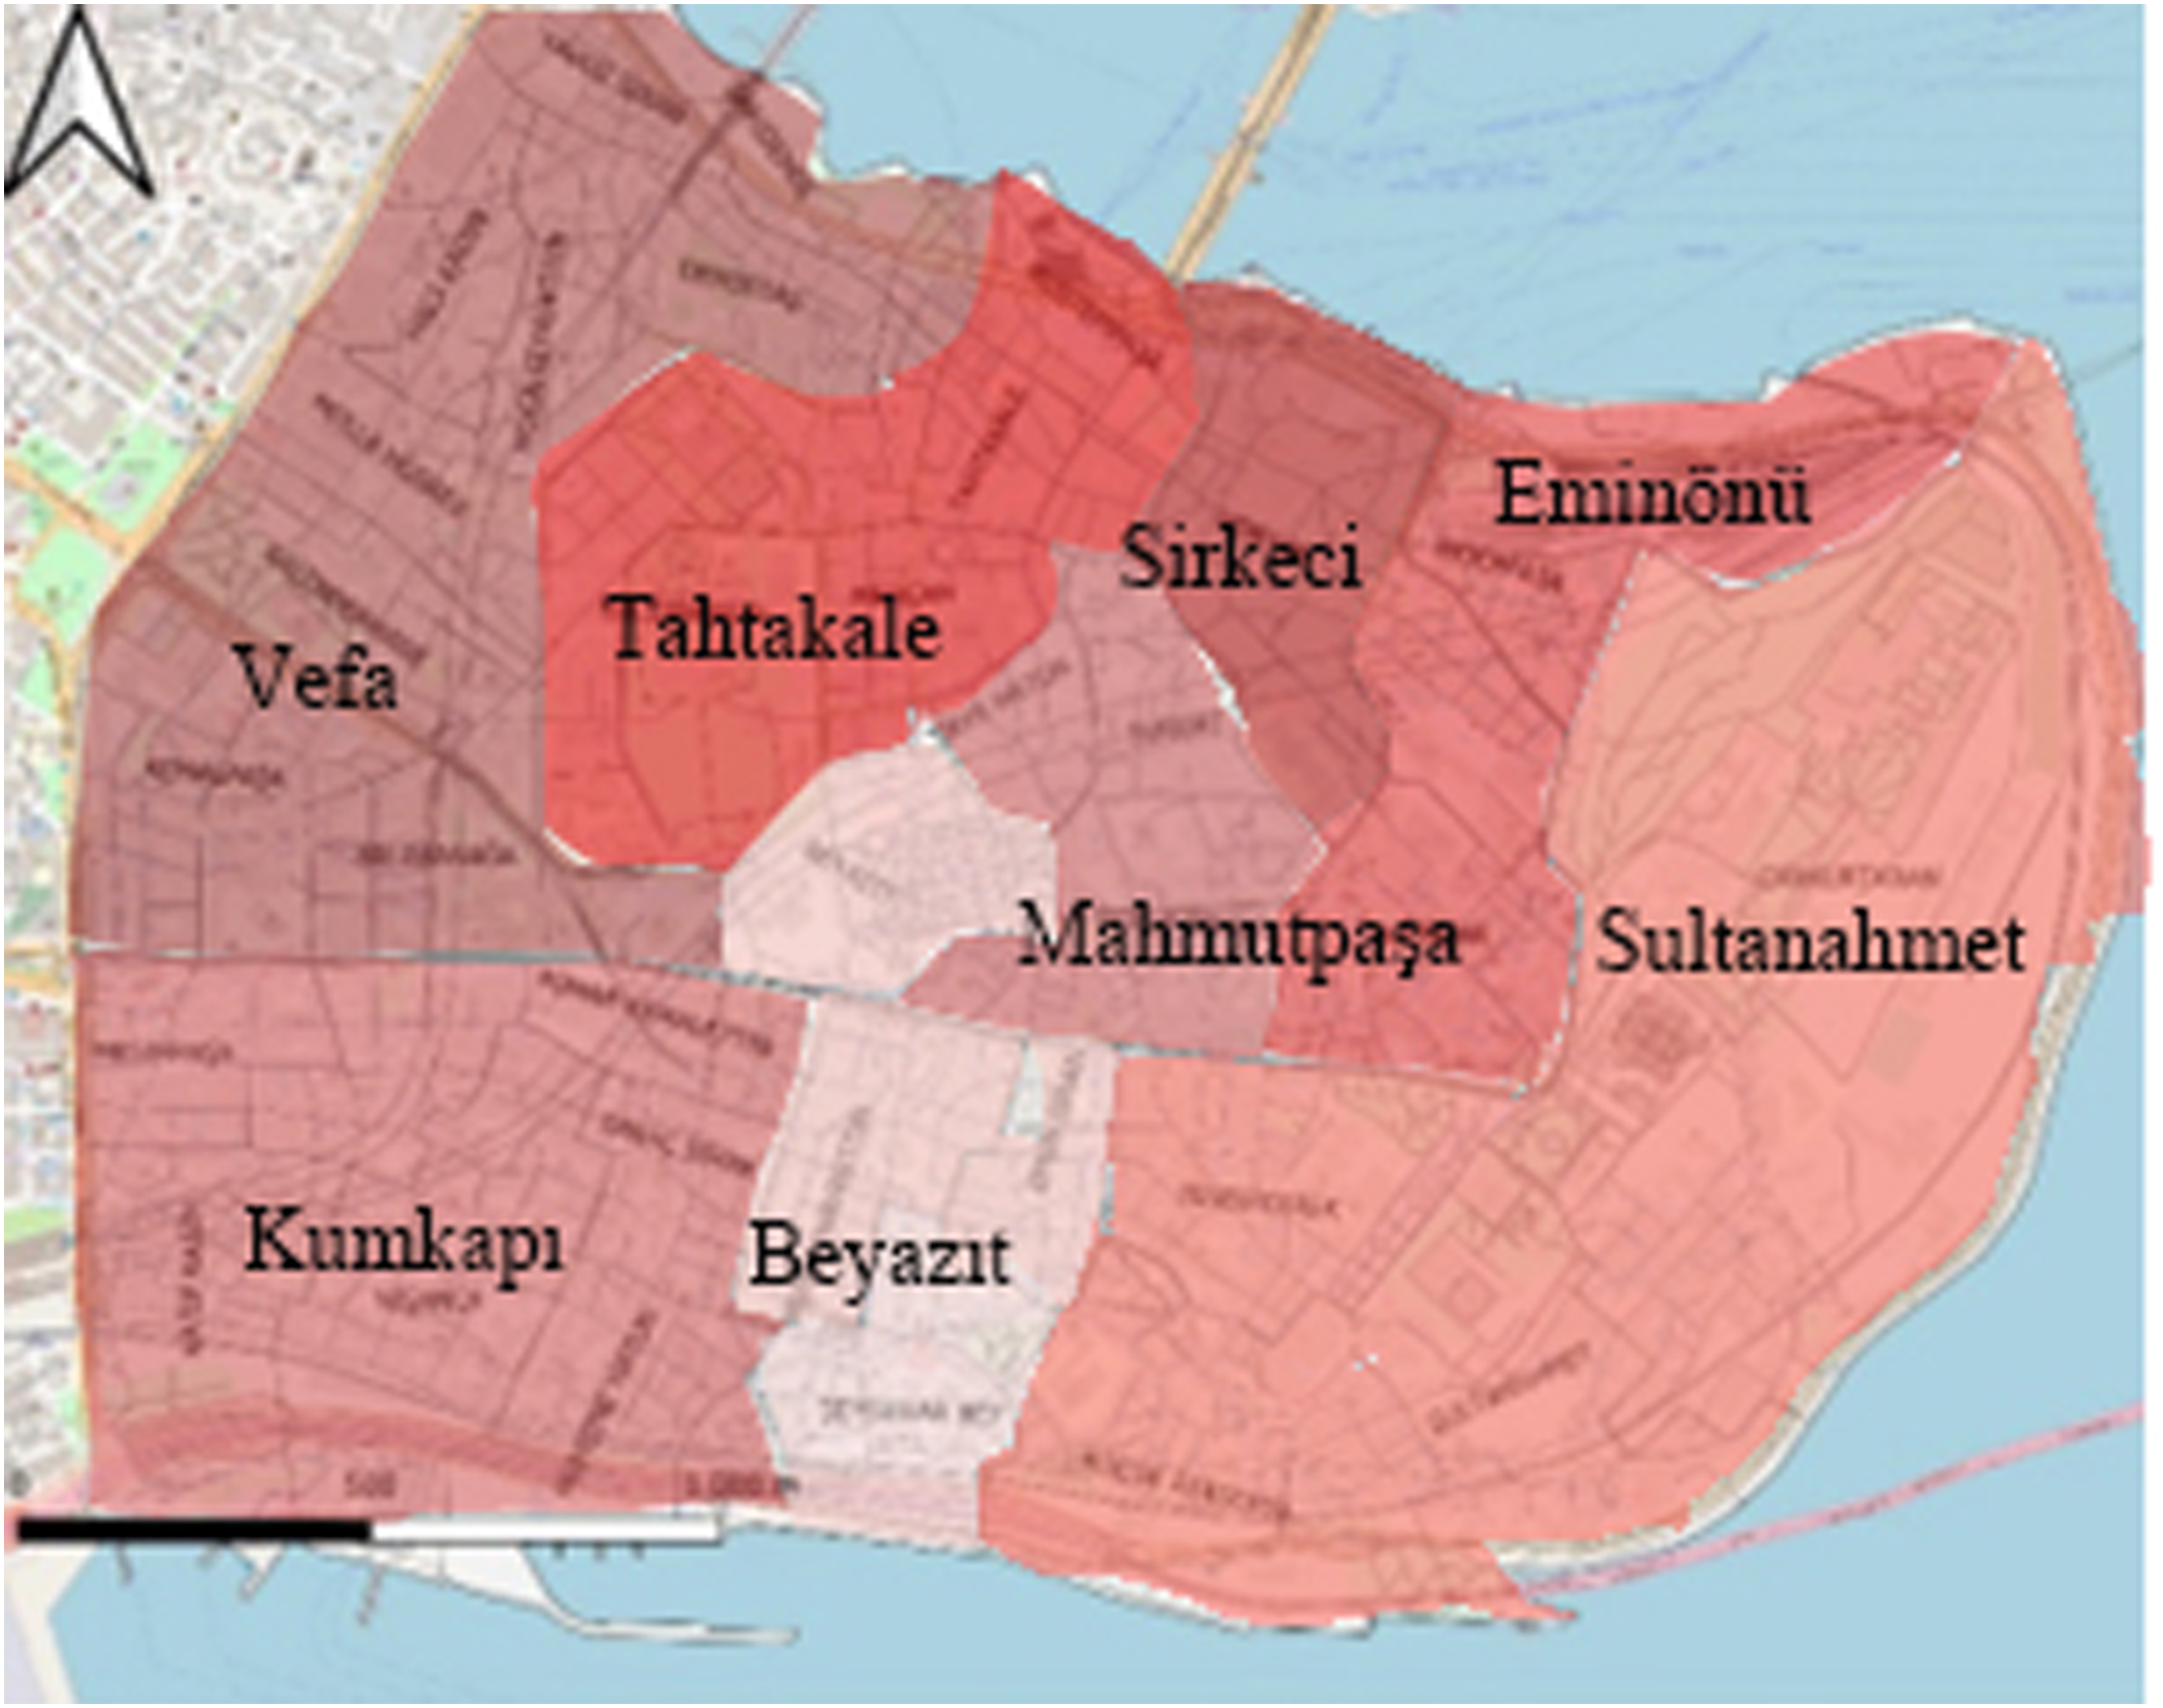
The use-value displays to what extent the area is saturated in terms of activities and user density. The coldspot places with lower user density are residential zones in Kumkapi and Vefa Districts, whereas hotspot places with higher user density are cultural touristic zones Sultanahmet and (Figure 8). Based on the results, people are clustered in the successful mixed-used areas with high activity density, diversity, and equal distribution. Despite the unbalanced land use distribution, the activities present more variety with equal distribution. The results indicate that activity features and accessibility opportunities, the cultural landmarks, and their attractivity (visitation rate) also positively affect user density. Spatial analysis results show that activity characteristics and heritage (cultural landmark) add value to place attractivity and promote the use-value of place. Land price change results.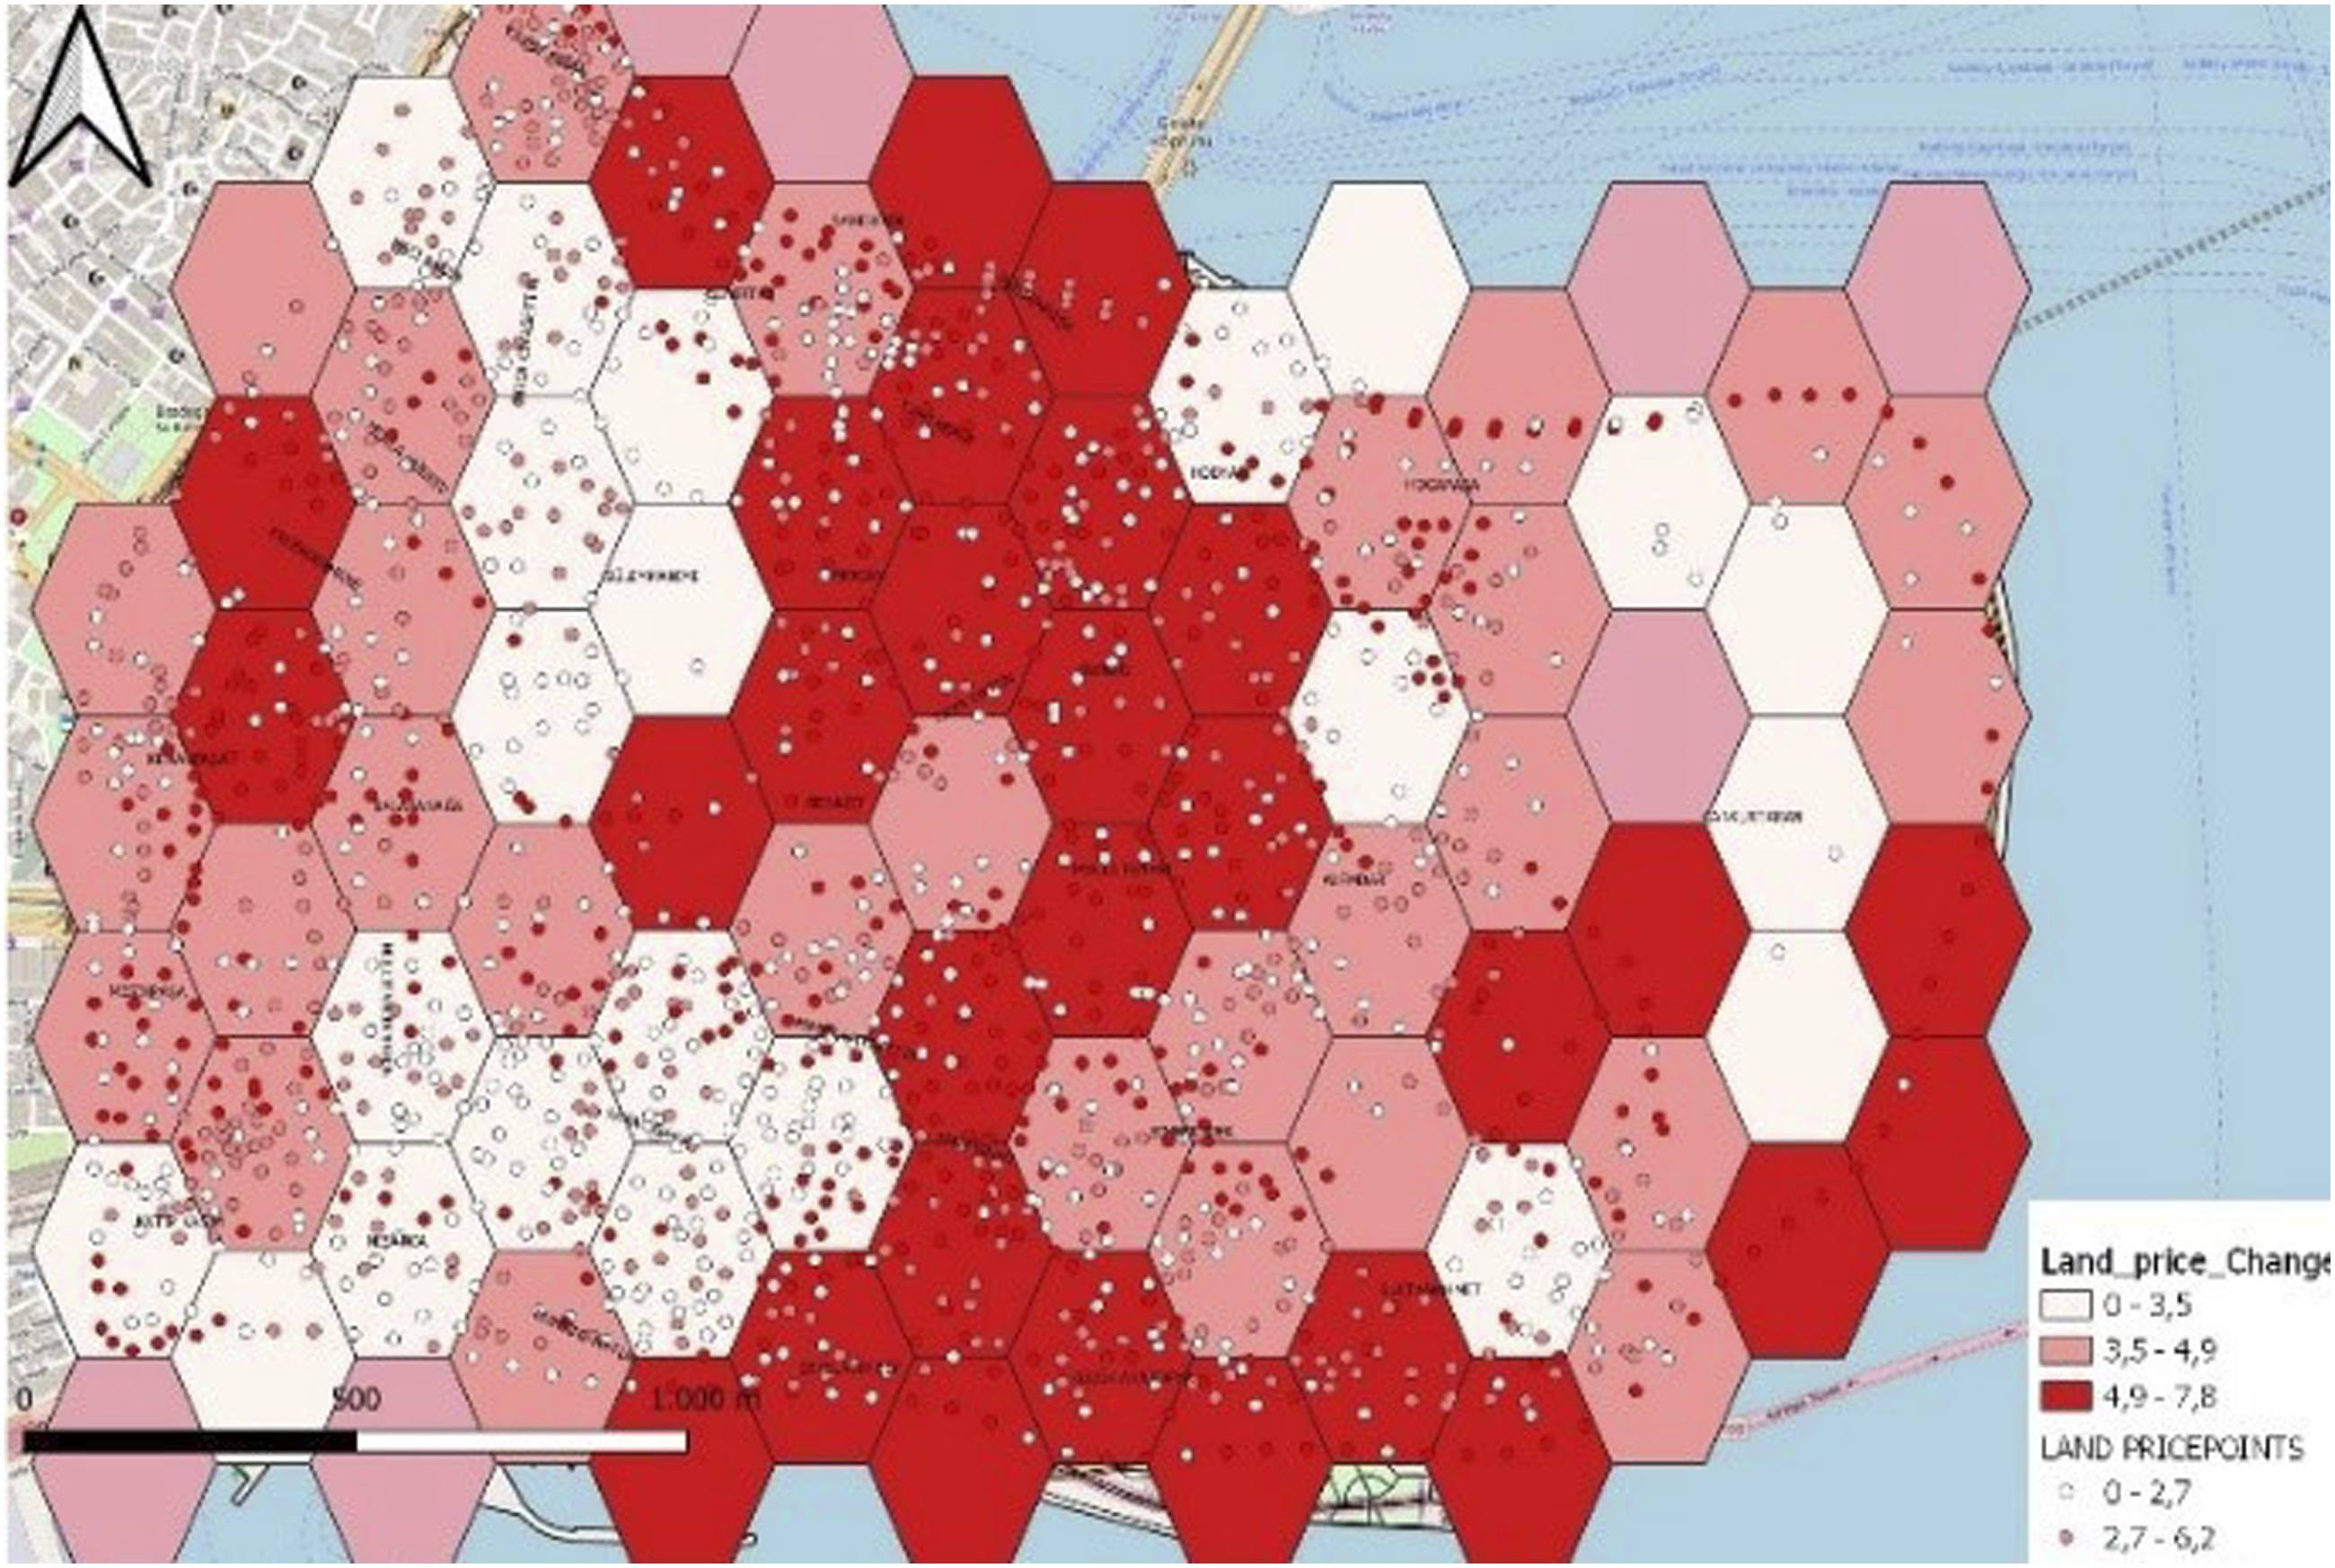
The likeability score is higher on main (Figure 9), especially on the streets that lead to the landscape or cultural scape. The results of spatial analysis present that natural and cultural element have a positive effect. In contrast, traffic density, building enclosure, and facade signboard negatively affect the streetscapes' likability. Urban greening and landscape have the most significant effect among the likable features. Based on the spatial analysis, the results show that the cultural and natural elements add value to the image of the streetscapes. The likeability score is higher on main streets (Figure 10) especially on the streets that lead to the natural and cultural landscape, such as Cankurtaran coastline. The spatial analysis outcomes present that natural and cultural elements have a positive effect on streetscapes' likeability. In contrast, traffic density, building enclosure, and facade signboard have a negative effect on it. Urban greening and landscape have the most significant effect among the likable features. According to the results, the cultural and natural elements add image value to the streetscapes. Hotspot level (active user density)results. Likability of streets results.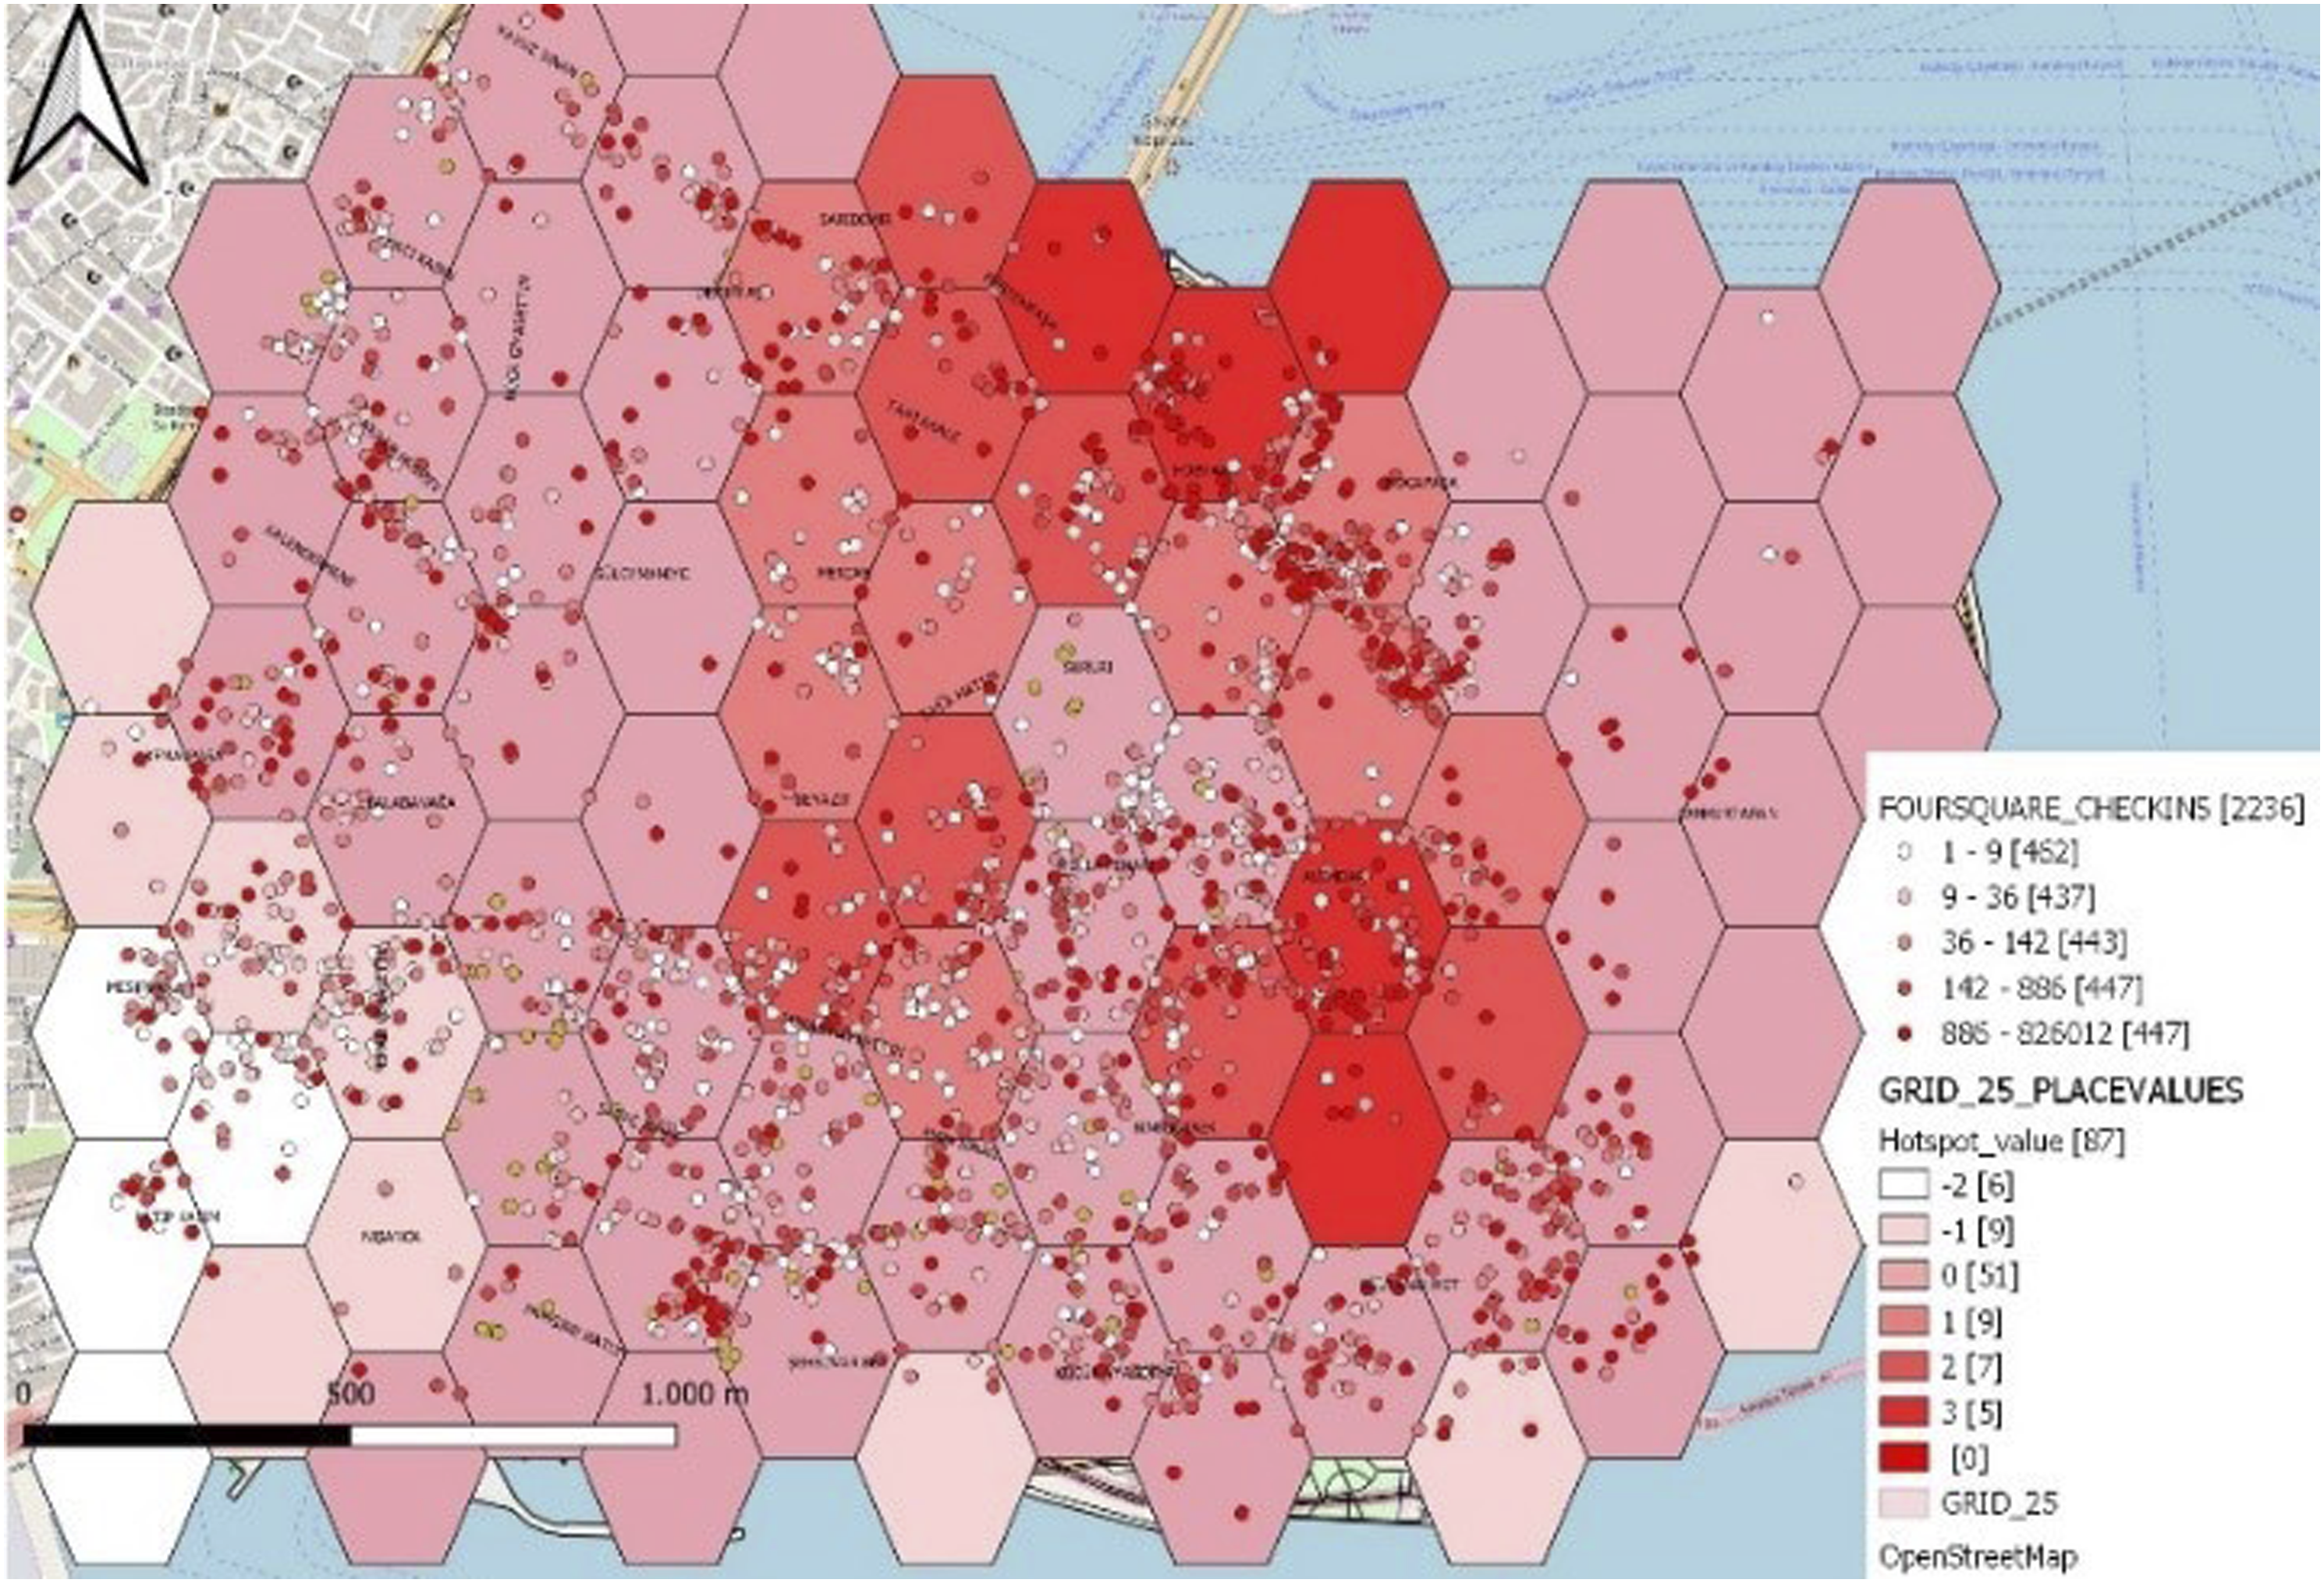
BBN analysis results
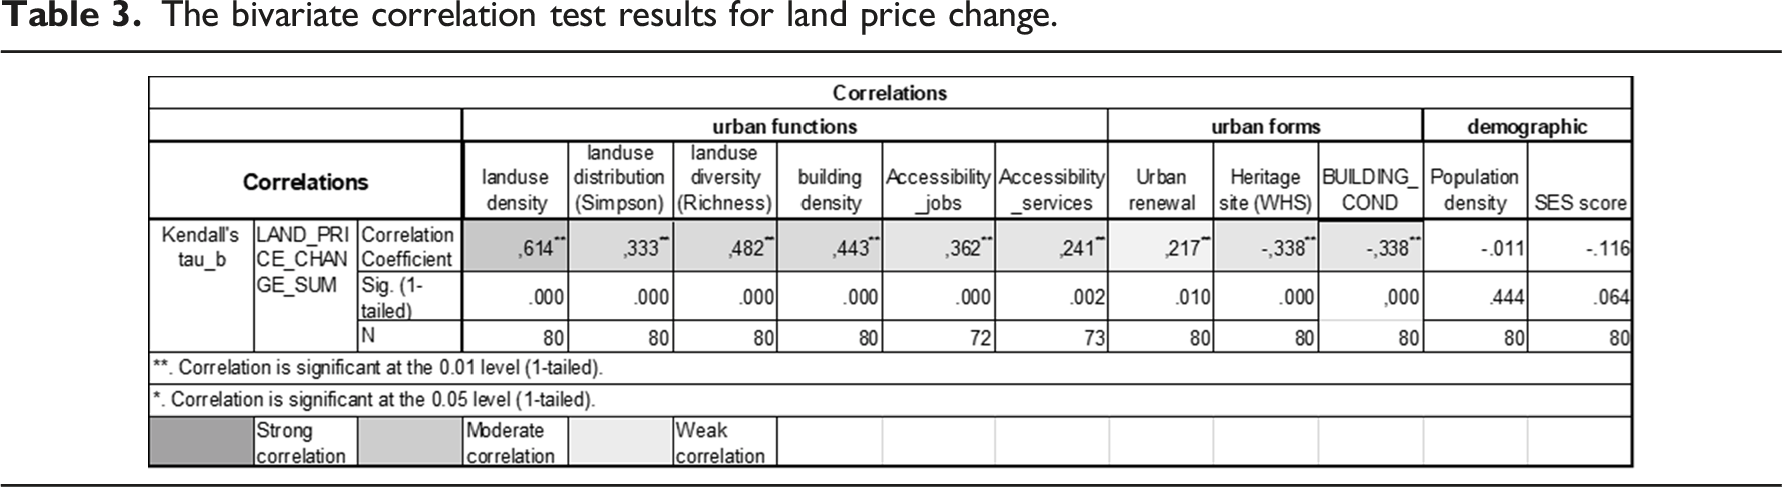
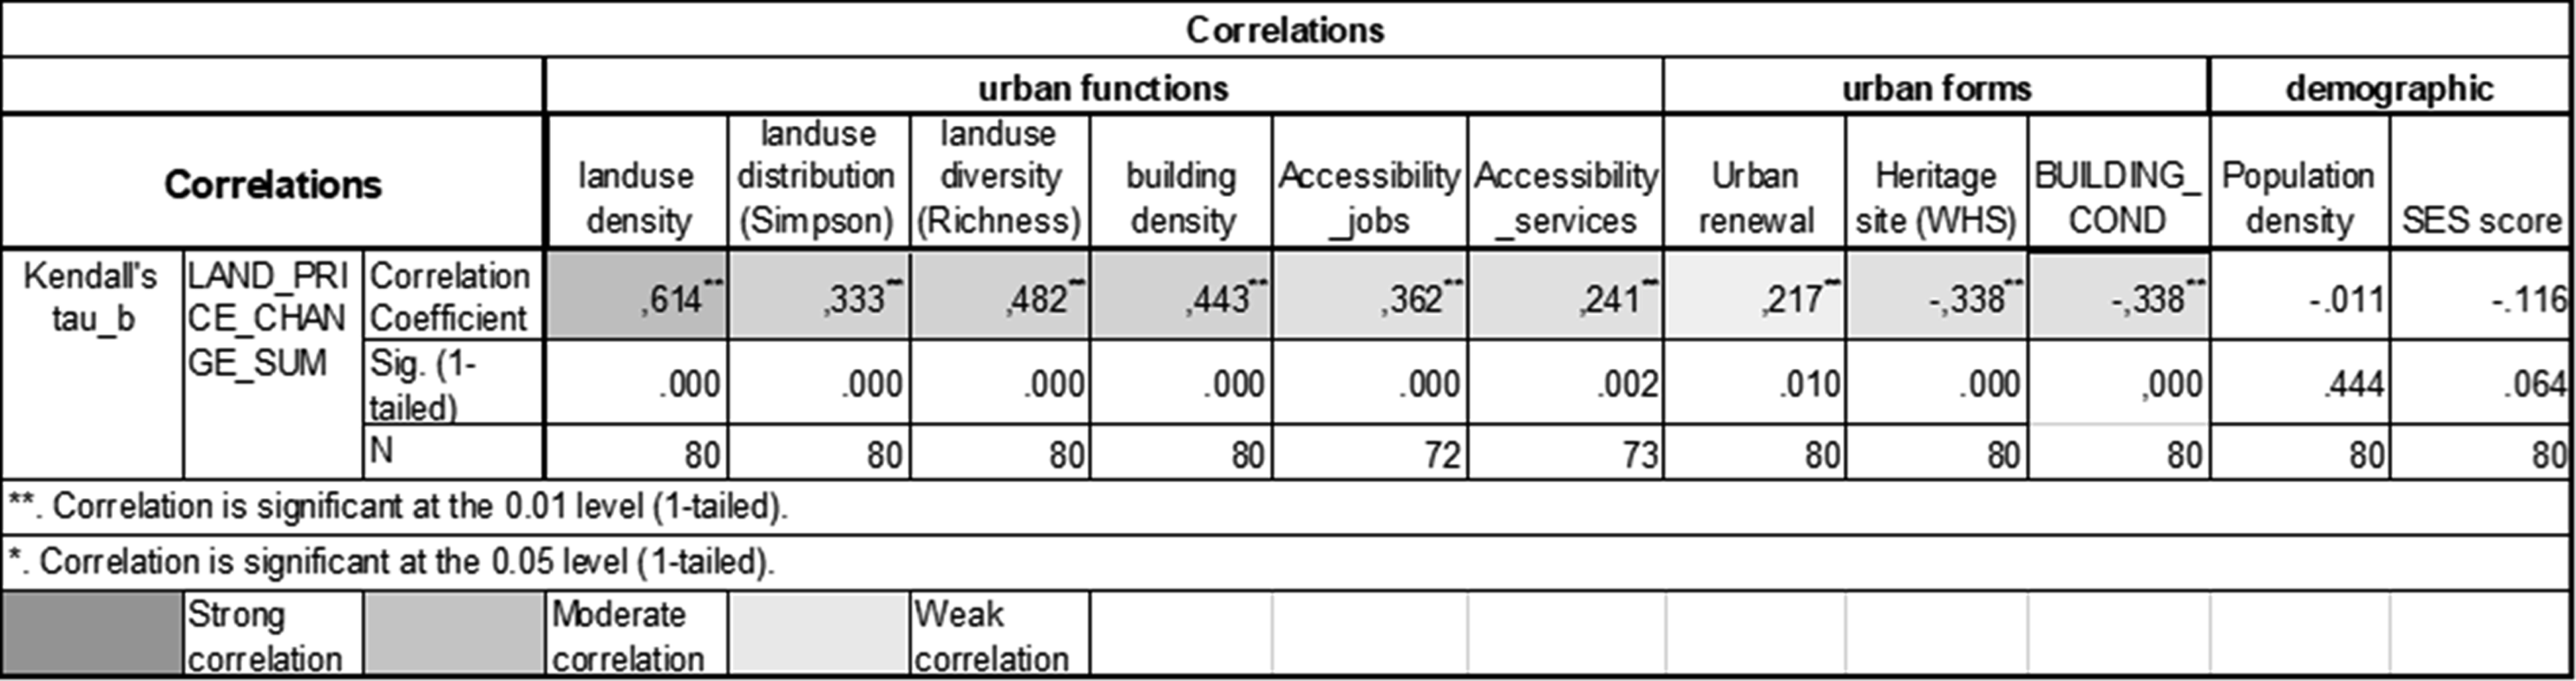
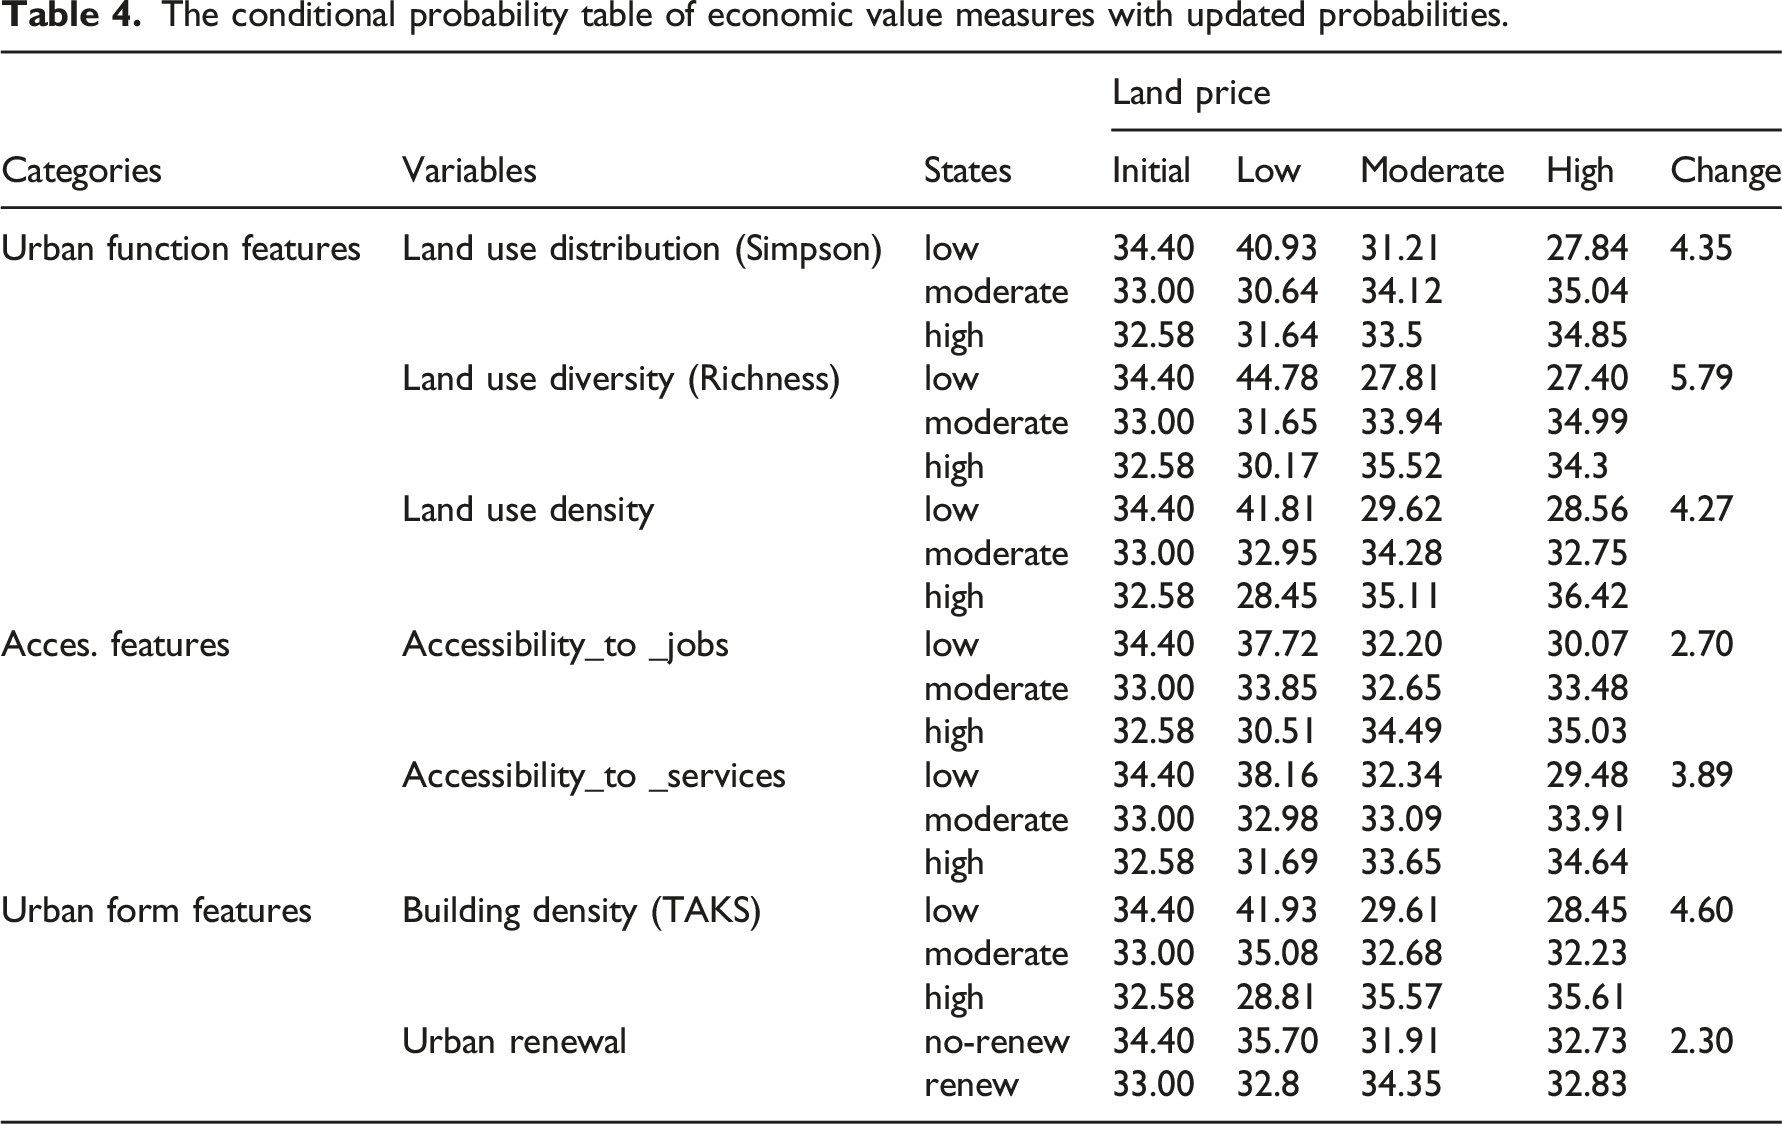
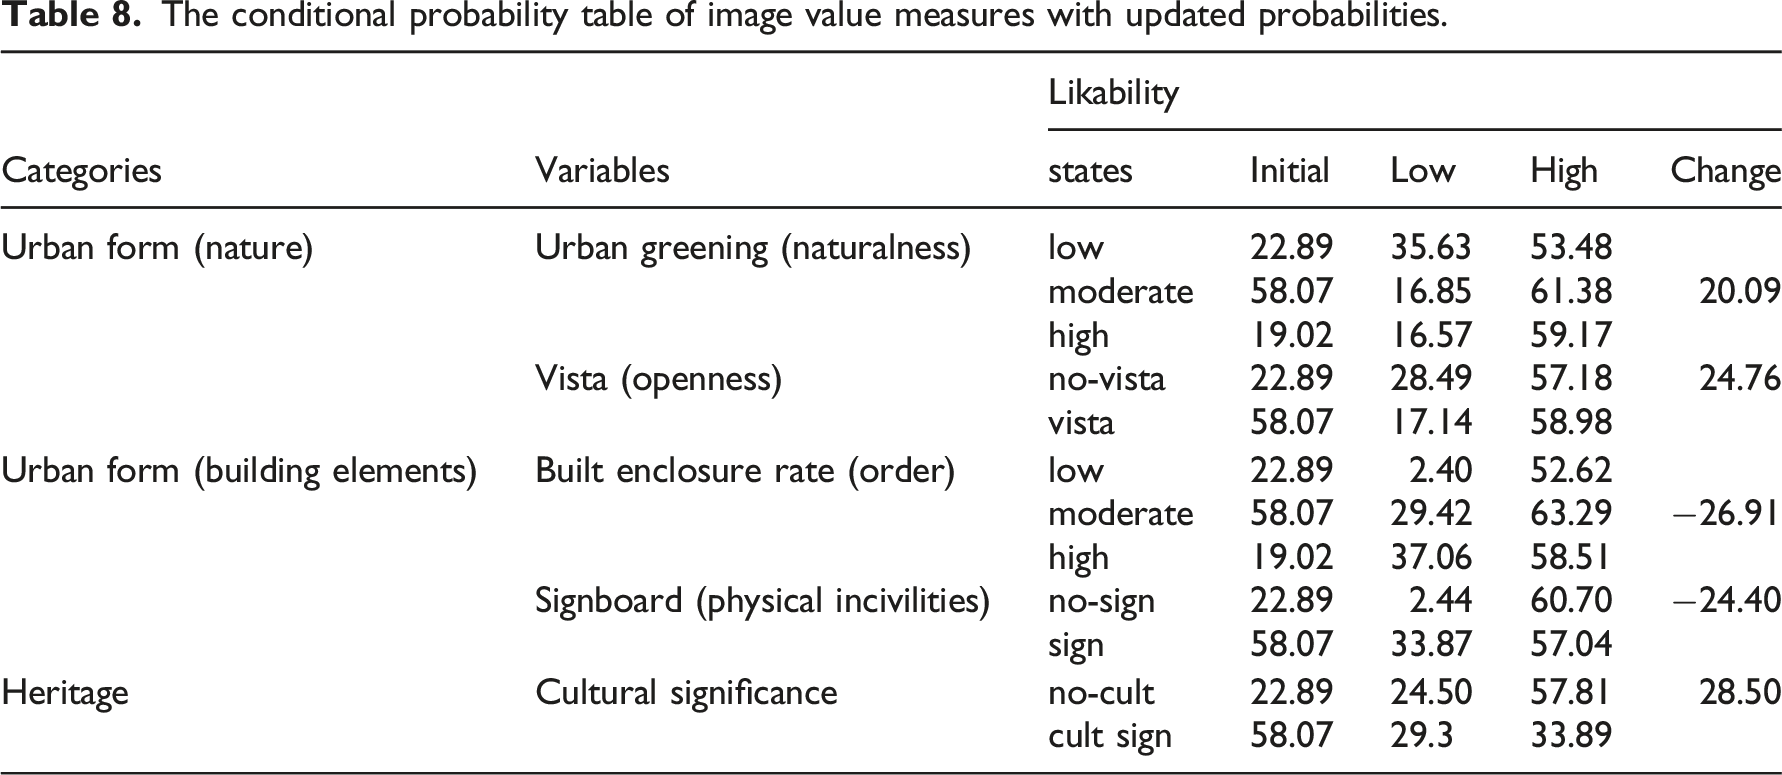
In this section, we give place to the BBN graphic model, and conditional probability table results to understand to what extent independent variables affect dependent variables. Kendall tau nonparametric test of bivariate correlation test has been applied since the dataset includes both ordinal and ratio scales within the non-normal data distribution. The bivariate correlation provides resolving the inconsistent networks of the BBN. The conditional probability table (CPT) shows how the change influences the states of the selected (child) variables. 21 CPT shows the updated probabilities in the dependent variable if the condition of an independent variable has been set at 100%. The CPT tables are helpful for what-if analysis that questions what happens to the child node if the state of a parent node is set as evidence (with 10% probabilities).
The bivariate correlation test results for land price change.
The conditional probability table of economic value measures with updated probabilities.
In the correlation test of
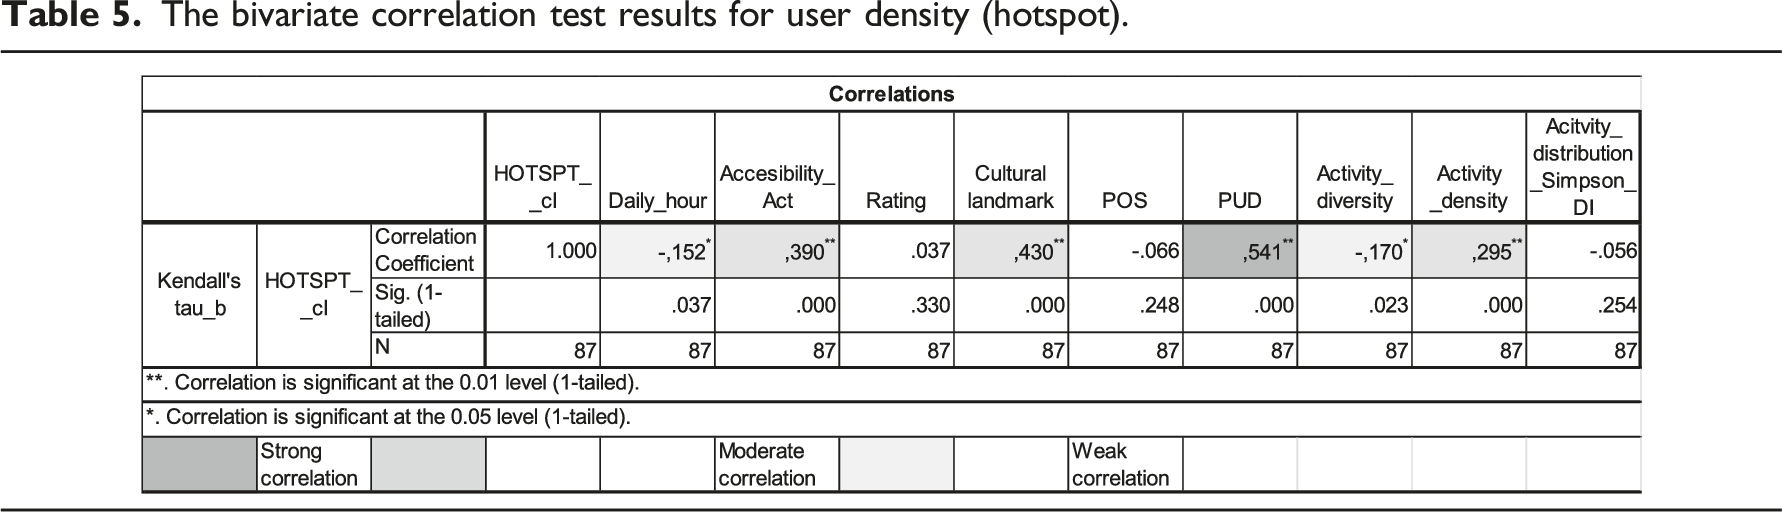
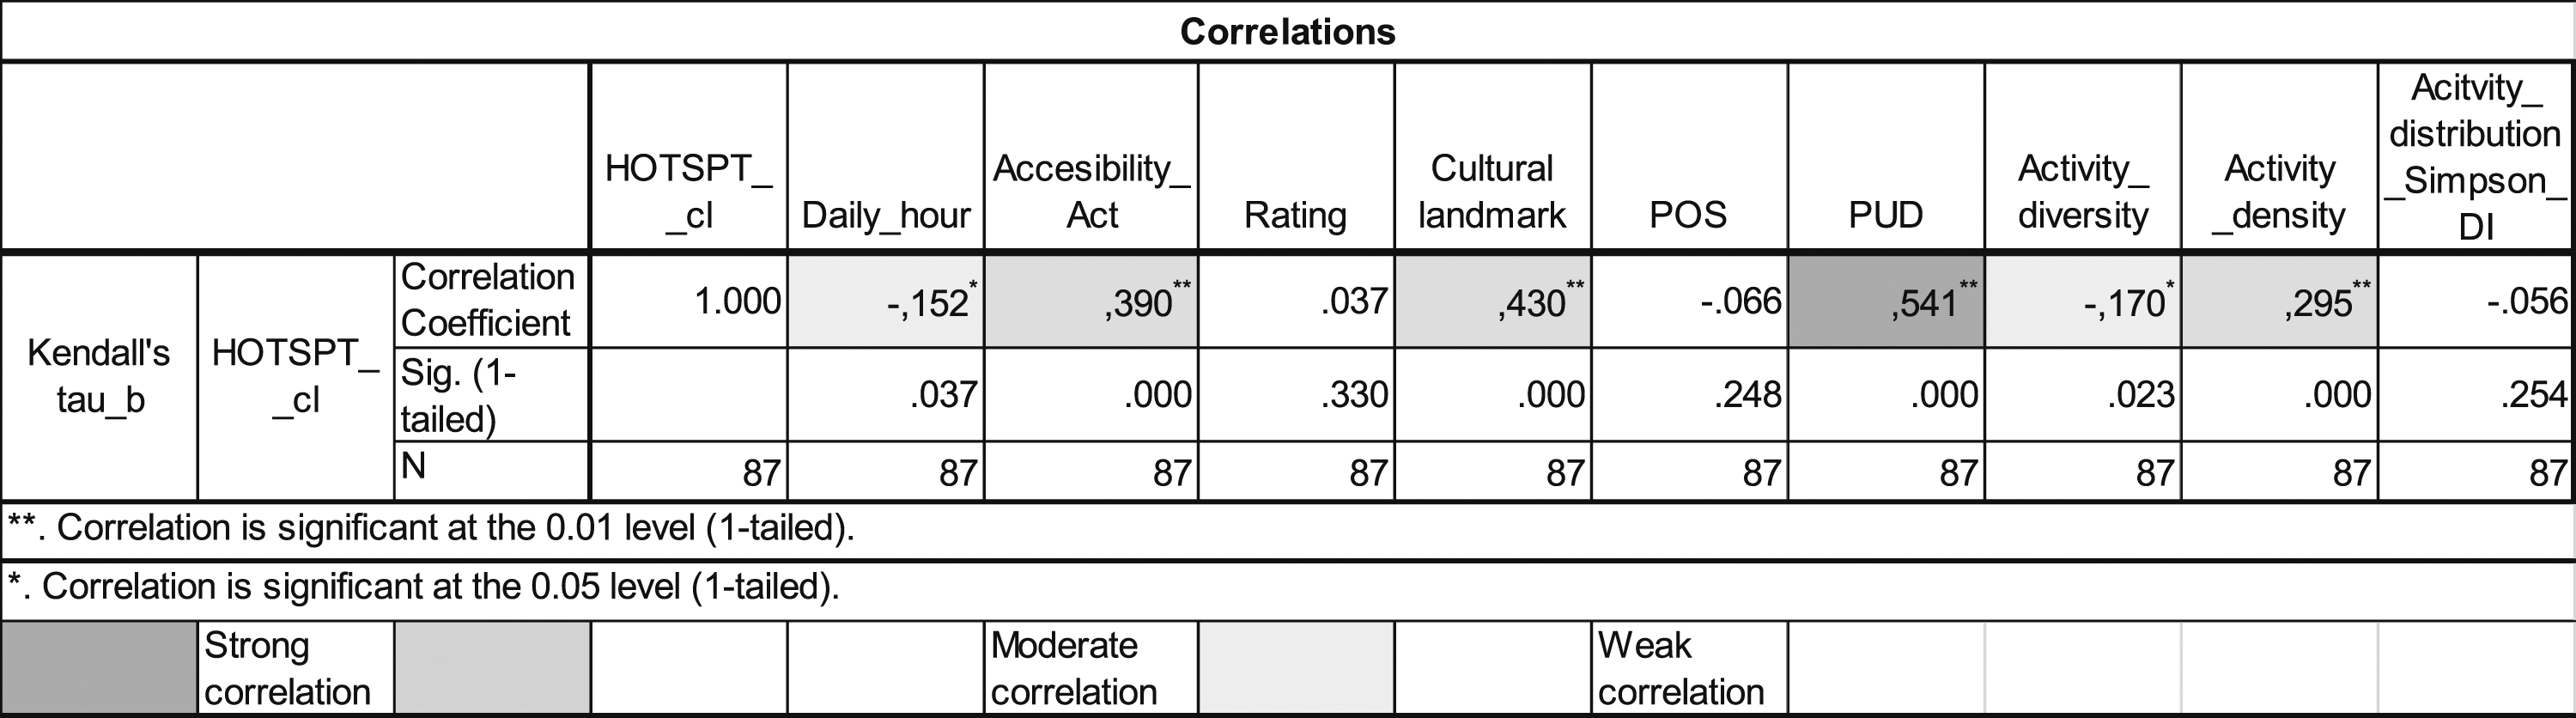
The bivariate correlation test results for user density (hotspot).
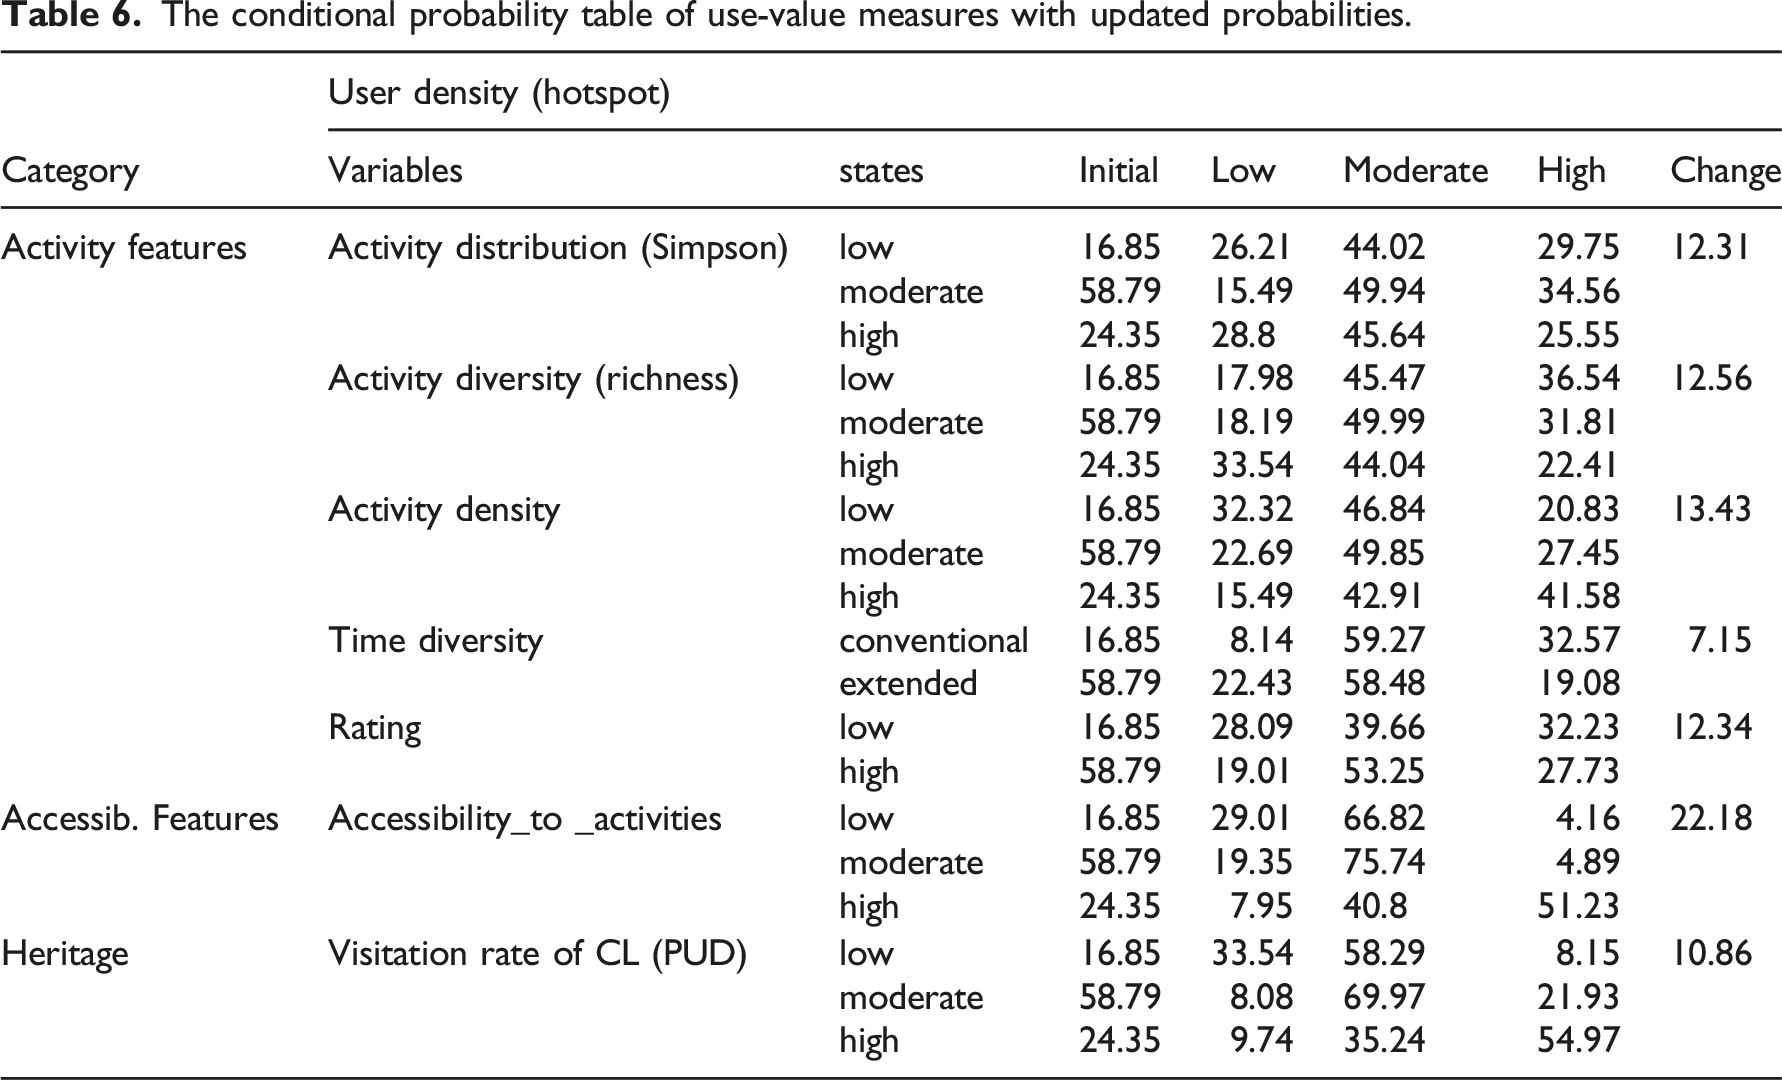
The conditional probability table of use-value measures with updated probabilities.
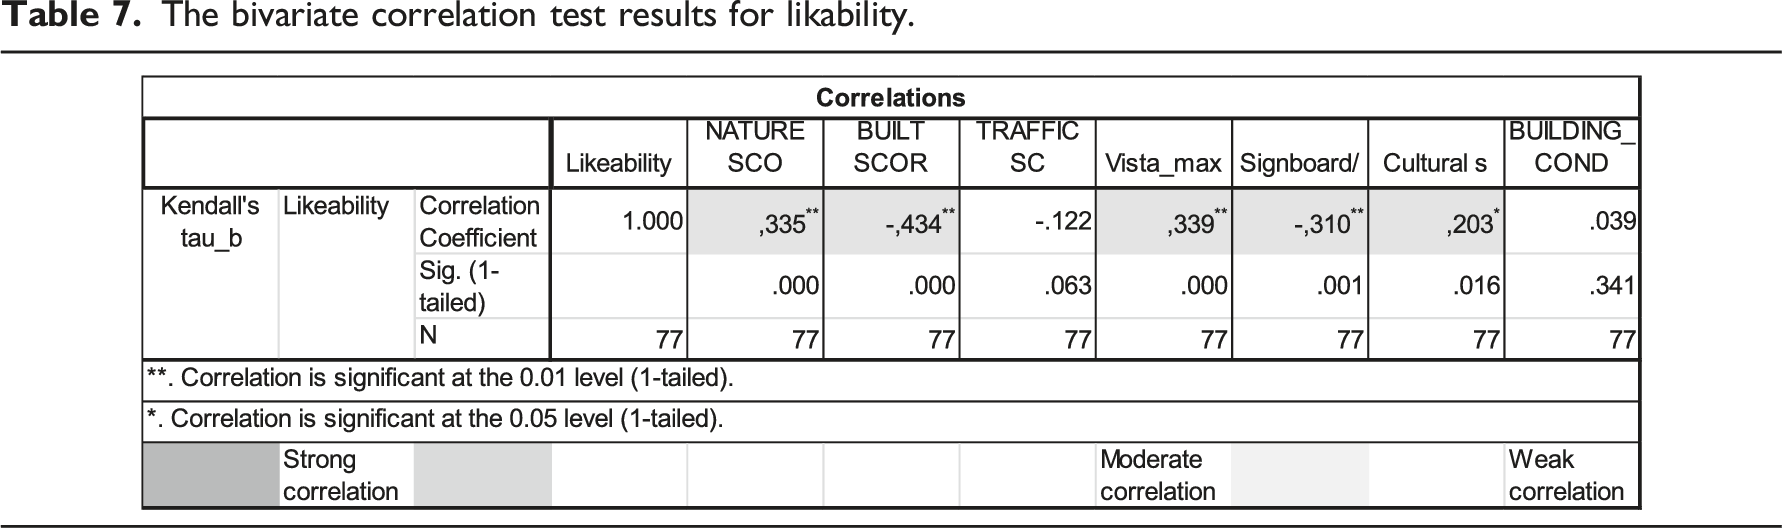
The bivariate correlation test results for likability.
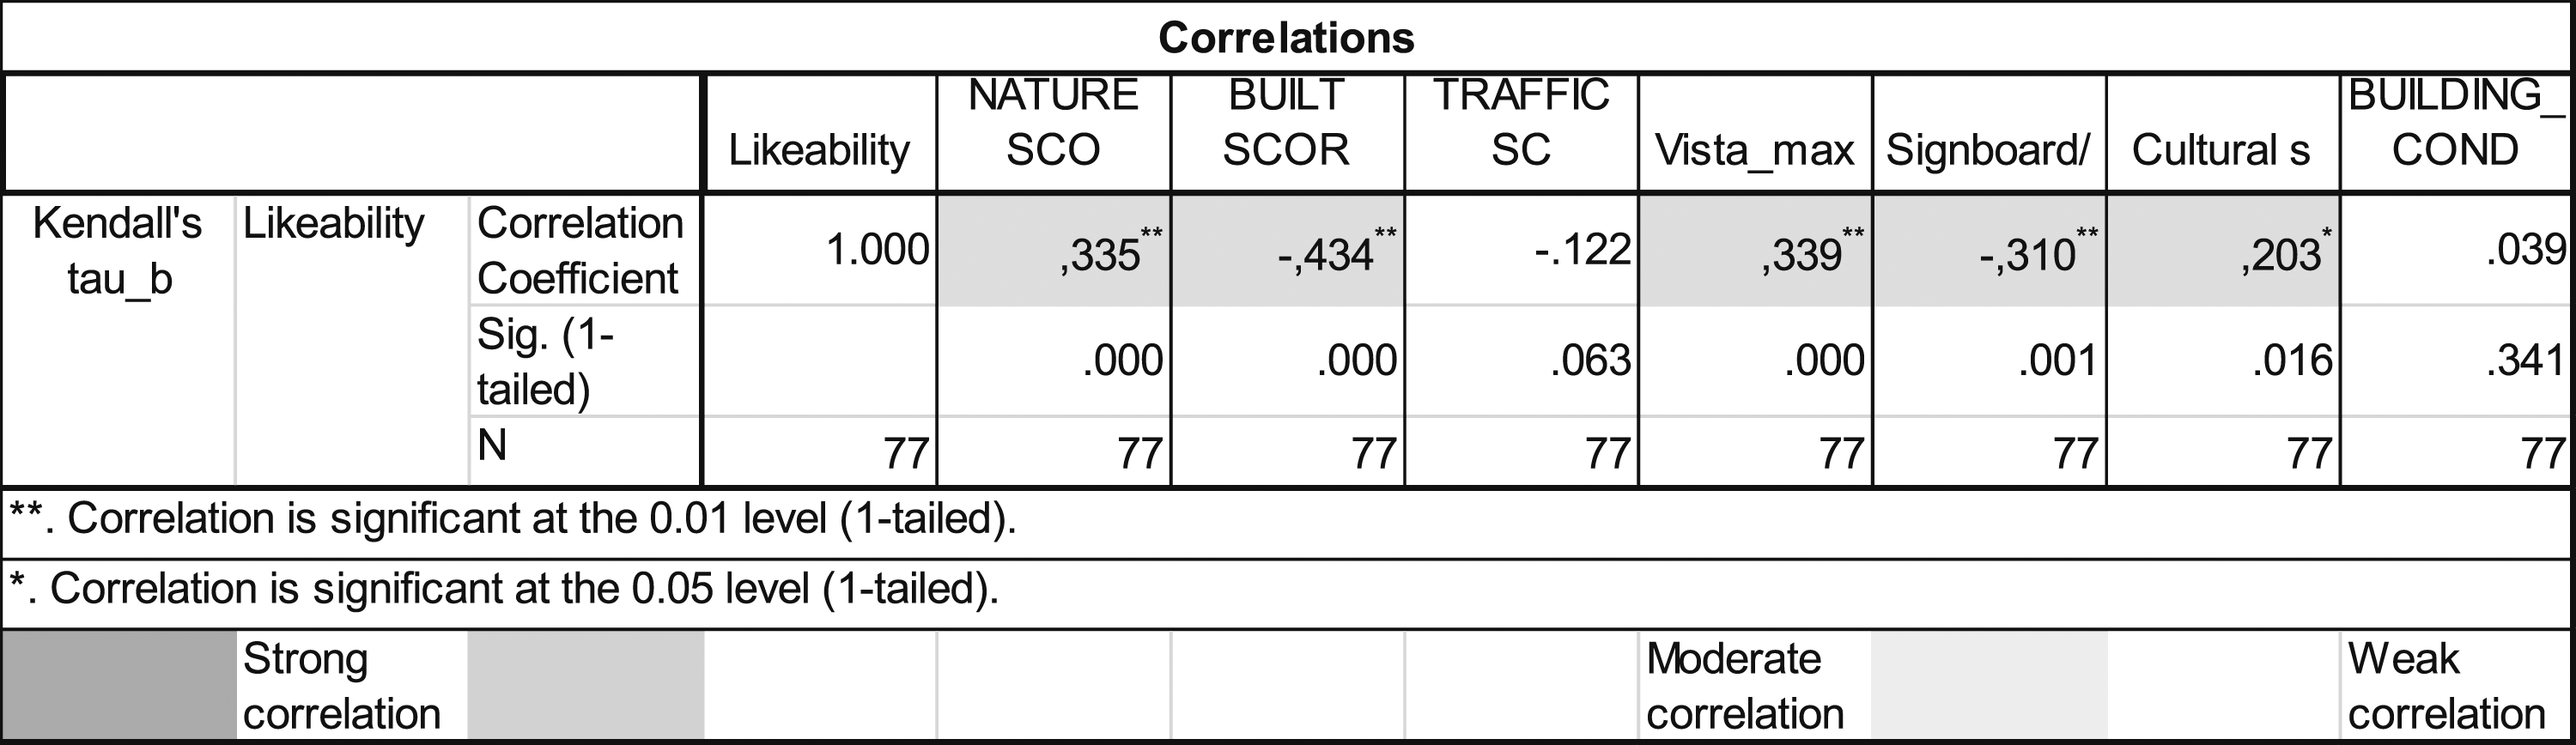
The conditional probability table of image value measures with updated probabilities.
Survey results
We evaluate the BBN analysis with survey results to test the reliability of Bayesian networks in terms of relationship nature (correlation-causality). The aim is to triangulate the BBN results with the survey for informed decision-making. This evaluation is valuable for decision-makers to develop strategies in urban vibrancy regarding relationships of urban concepts. We conduct a survey study to assess the causality and correlation in the relationship between variables. The survey was implemented on a small sample consisting of ten researchers who have engaged in urban studies in a doctorate (50%) or master's degree (30%). Their educational background ranged from architecture (50%), urban planning (30%), and landscape architecture (20%). Participants' research topics range from sustainability (60%), walkability (20%), and life quality and liveability (20%).
We request the participants evaluate the causality and correlation in the pairwise relationship matrix. We convert responses to numerical code. 0 represents no relationship, 1 correlational, and 2 causal relationships. We also code the BBN analysis network: 2 represents the direct relationship (if A affects B directly), and 1 represents the indirect relationship (if C affects E indirectly over D). In the correlation test coding, 0 represents no correlation, 1 low correlation (p-value < .30), 2 high correlation (p-value > .30). We apply Cronbach's alpha measurement to test the internal consistency of the survey and then its consistency with other methods (BBN and correlational test). 38
Statistic results for different place measures.
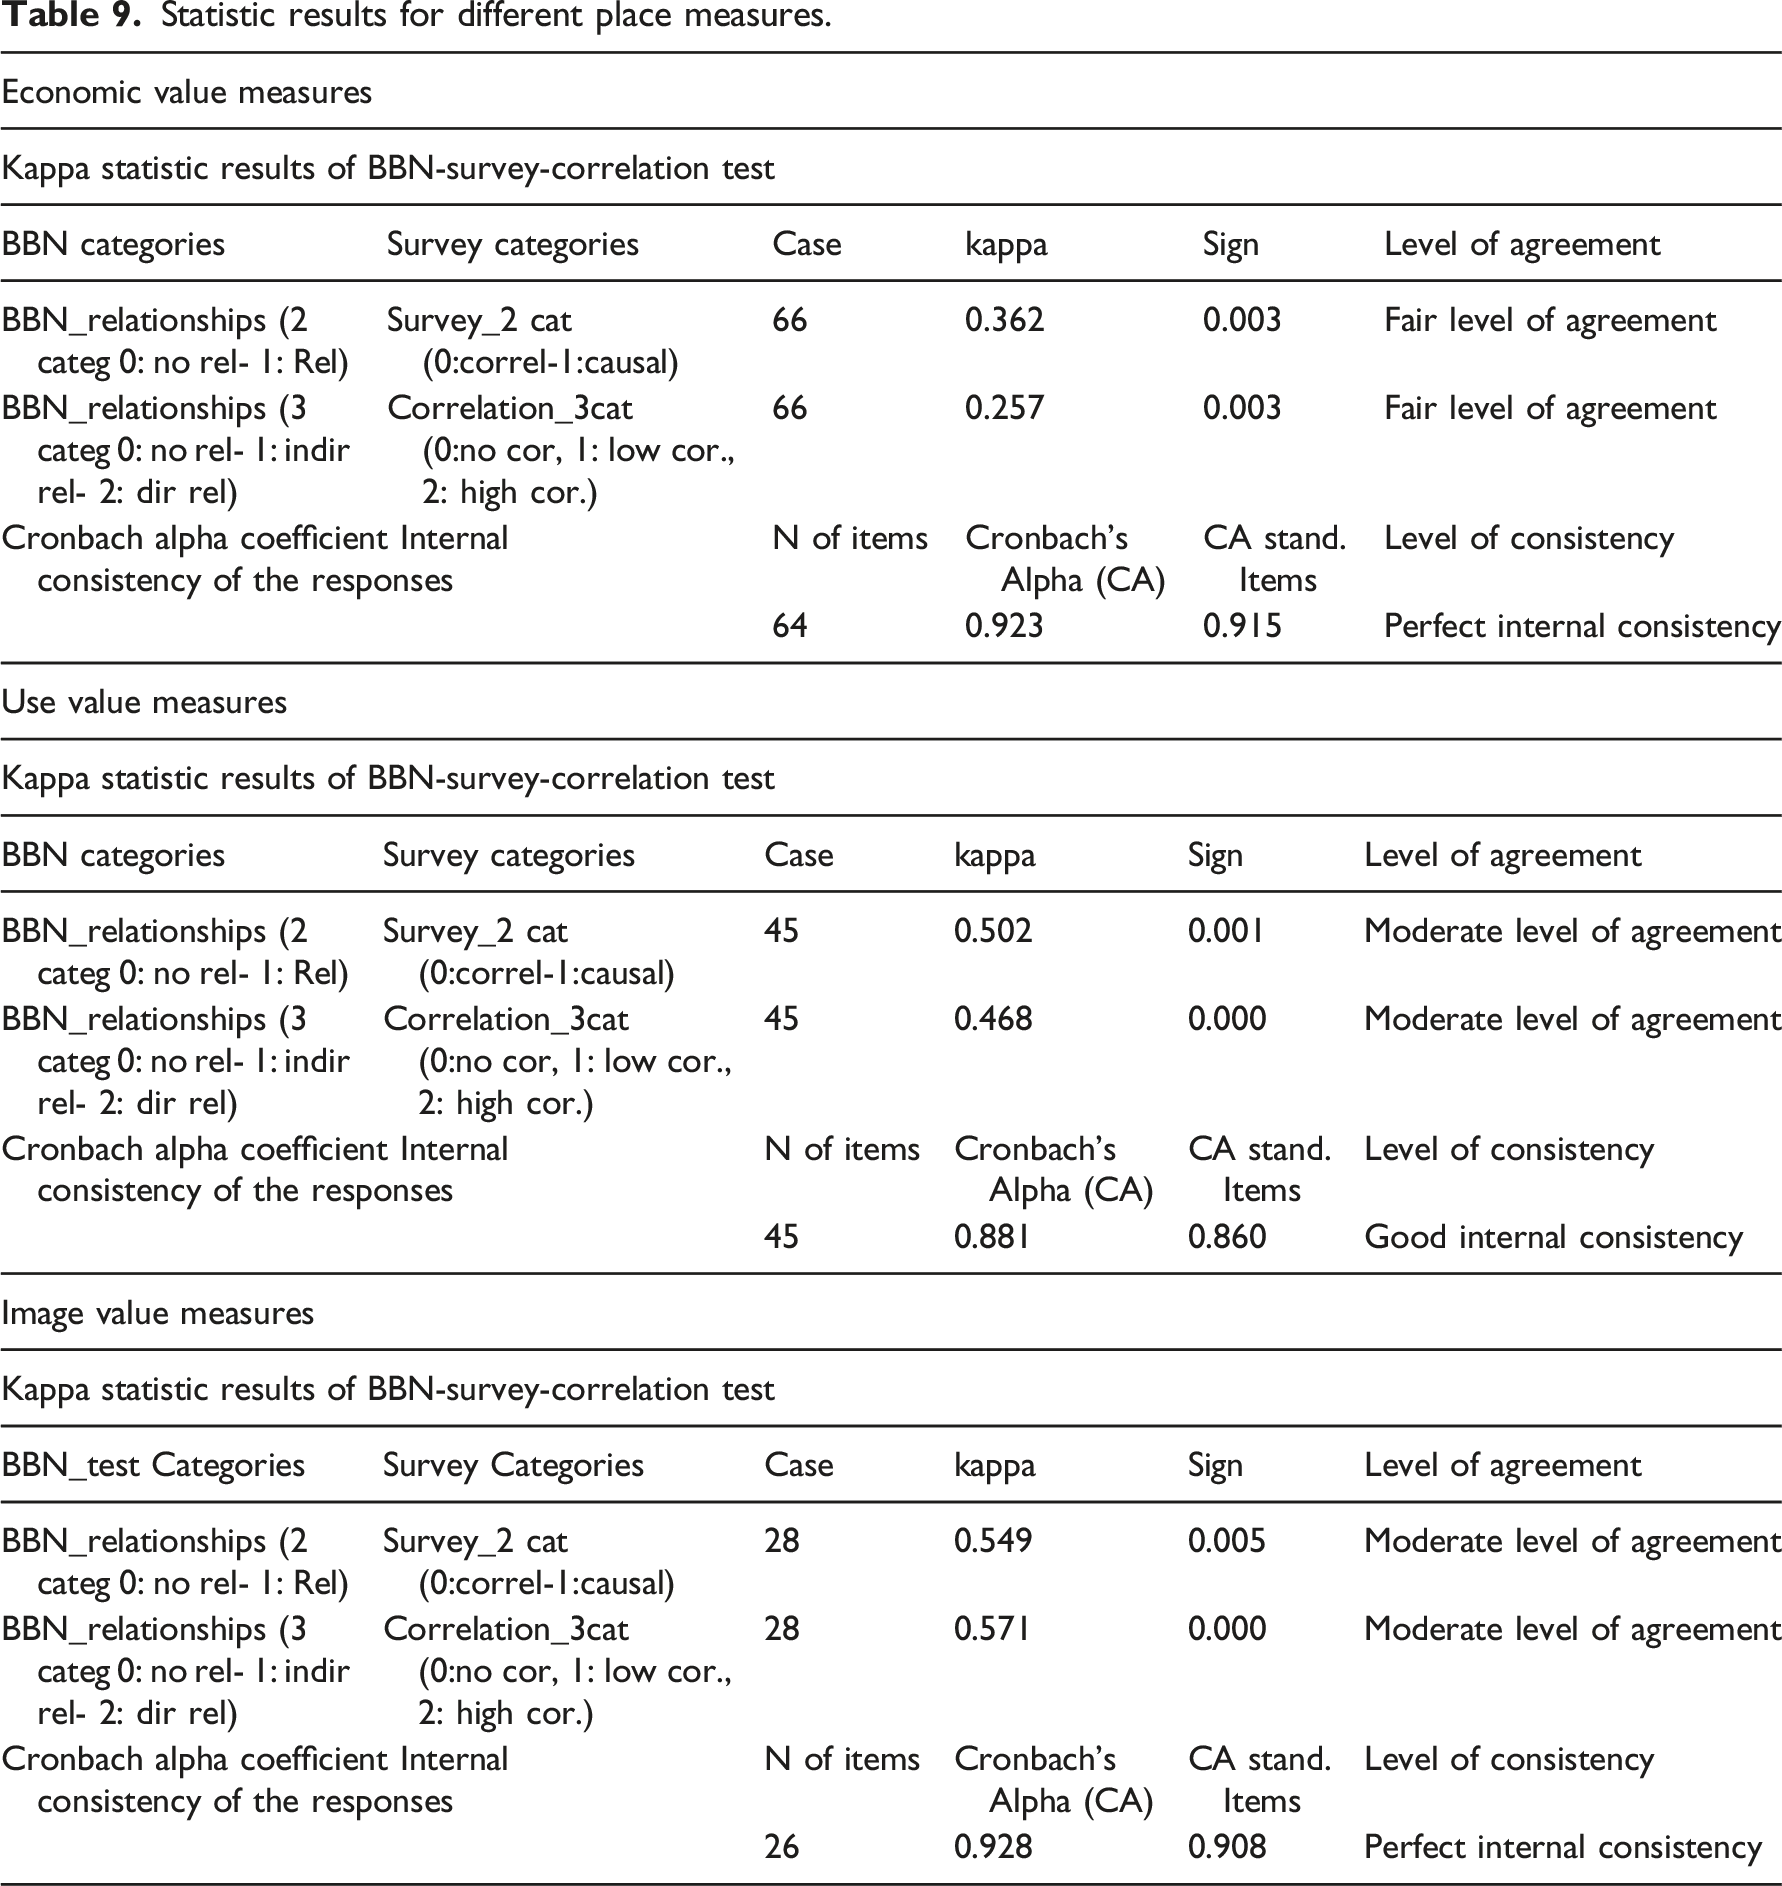
After these statistical measurement tests, we compare the relationships found by BBN and the survey to elicit a causal map, as shown in Figure 11. The results show that economic value variables have the most causal relations (67% causal- 33% correlation), use-value variables are the second (58% causal- 42% correlation), and image value variables are the least (38% causal- 62% correlation). However, the level of agreement on economic value measures is the lowest. Accordingly, it can be stated that a large number of variables negatively affect the level of agreement of different evaluation methods. We accept the level of agreement as to the performance of predicting causality. Accordingly, the performance of predicting causality is considerably high in the image and use-value variables compared to economic value. For further stages of the study, economic value variables can be decreased for more consistency of BBN and survey responses. Image value variables can be reconsidered in terms of causality. The causal BBN network of economic (1), use (2), image, and (3) value measures.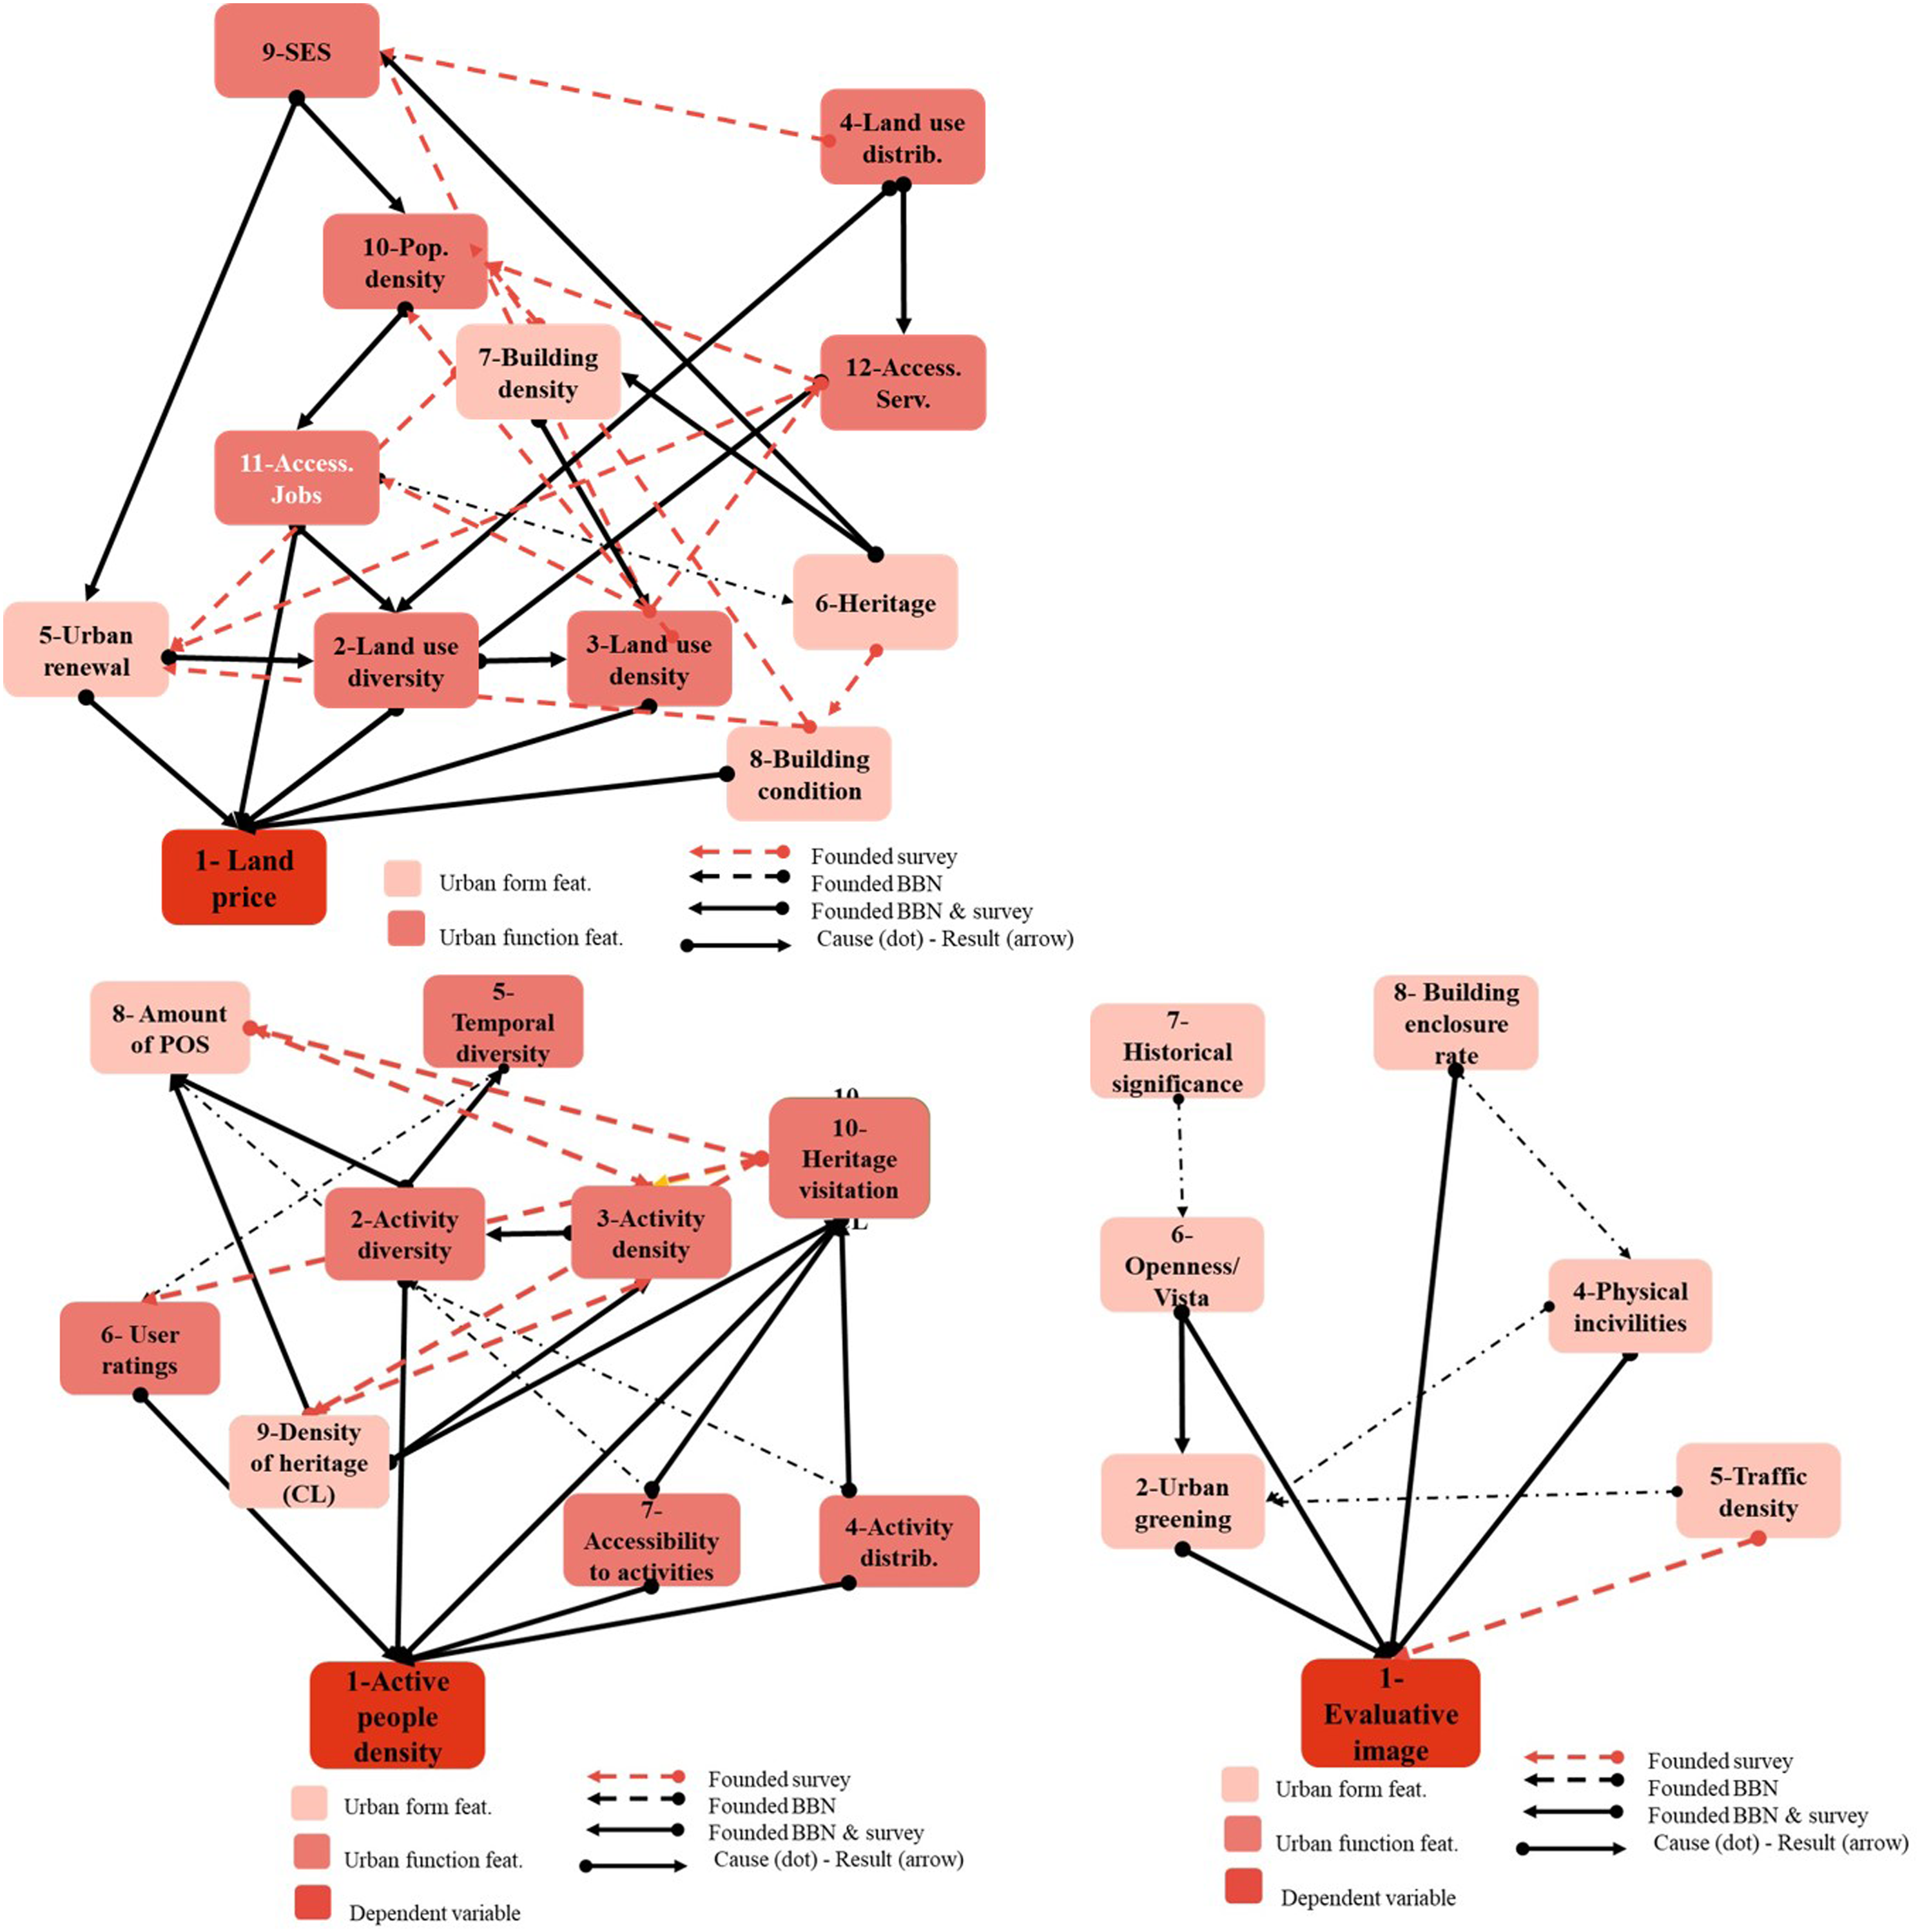
Conclusion
The researchers review the critical remarks on livability in the literature and focus on evaluating place value gauges. In this study, we conduct a knowledge discovery process with BBN from a different perspective by evaluating the causality. The study aims to support decision-makers in creating vibrant neighborhoods through data-driven methods.
The results of the study mostly agreed with evidence in the literature. The impact of urban form and function attributes within accessibility on land value validates 9 findings on land value. However, the impact of heritage on land value is not apparent in this study. Use-value results indicate that more dense and diverse activity, higher accessibility, and more attractive heritage boost user density. The results support 6 assumption that historical and cultural attributes increase vitality and high accessibility promotes a dense pedestrian flow. The activity results justify 3 statement on a good mixture of activities and spreading to daytime to attract people. Interestingly, the effect of activities on user density is not as apparent as the effect of land use characteristics on land prices. A streetscape’s cultural and natural elements upgrade likability based on image value results. In contrast, physical incivilities, traffic density, and building enclosure degrade likability. These results support 7 determinations regarding likable features, except for building conditions and enclosure rate.
This study has limitations derived from the multiplicity of data sources. Different data sources require different methods for collection, standardization, and processing. For instance, user entries in Google Place have challenges in terms of data standardization. The image segmentation algorithm of GSV images has challenges in recognizing several traffic elements and building details. We have to customize data collection and processing technics, which is labor-intensive. Apart from technical limitations, this study has social challenges due to biases in LBSN use. The literacy of digital technology is unequally distributed in society and concentrated in the young generation. This inequality causes bias in the age group. Moreover, people tend to share the attraction points more than other locations to get more likes and comments, and this causes bias in place sharing. The gamified locative applications may cause people to share places they do not visit. This study adopts an inclusive approach by integrating user data. However, we are aware that this inclusiveness is limited to active LBSN users. Accordingly, we indicate that this research reflects the LBSN media users' tendency. Therefore, the focus group is the young population who are actively engaged in locative media technologies.
The further stages focus on how to adapt the BBN-based knowledge discovery approach to the urban planning decision-making process. This study is intended to be useful for urban planners by offering them a means to develop inclusive spatial strategies based on human activities for vibrant neighborhoods. The study’s findings contribute to revitalizing cultural destinations with higher urban quality, prosperity, and diverse activities. The outcomes of this study can also be useful for the spatial attractiveness strategies reported in Fatih Municipality Strategy Report (2021).
Footnotes
Declaration of conflicting interests
The author(s) declared no potential conflicts of interest with respect to the research, authorship, and/or publication of this article.
Funding
The author(s) disclosed receipt of the following financial support for the research, authorship, and/or publication of this article: This work was supported by the Istanbul Technical University Scientific Research Project Coordination Unit, 42708. The authors would like to thank you Prof. Anders Madsen and other developers of HUGIN software, within Fatih and İMM Municipalities for their support.