
Abstract
Five Fe-based composite coatings with different weight ratios of Nb were prepared by laser cladding on 0Cr13Ni5Mo substrate. As the Nb content imposes, the NbC content gradually increases; the microstructure was refined; and the NbC morphology changed from quadrangle carbides to petaloid and papilionaceous carbides. Meanwhile, the microhardness and wear resistance of the composite coating gradually improve. The S3 coating exhibited a high microhardness of approximately 610 ± 12.2 HV and an excellent wear resistance. The S3 coating showed the highest corrosion resistance in 3.5 wt-% NaCl solution with Ecorr and Icorr of −179.3 mV and 9.258 × 10⁻⁸ A/cm2, respectively. The improvement in the corrosion resistance could be attributed to the fact that the forming NbC would consume amounts of C in the matrix; thus, the Cr atoms were released from its carbide state, and then dissolved in the matrix.
Introduction
With the rapid development of hydroelectric generation in the world, more attention has been paid to hydraulic machinery materials with high corrosion resistance.1,2 In particular, components, such as hydraulic machinery turbine blades, propellers and water pump impellers, operate in environments containing silt and various ions. In such severe conditions, wear and electrochemical corrosion on the surface of these components are exceedingly common.3,4 The premature failure of overflowing materials caused by wear, cavitation erosion and electrochemical corrosion has become a hot point under discussion and an urgent trouble to be solved in the hydraulic engineering field. 5 The 0Cr13Ni5Mo martensite stainless steel is usually chosen as the hydraulic material due to its good wear–corrosion resistance, easy weldability and outstanding comprehensive mechanical properties; however, if it still suffers from serious cavitation erosion due to the relatively low hardness, and its applications are somehow limited in environments where the collapsing of bubbles in liquid at the surface of materials is present. 6 However, resistance to wear and electrochemical corrosion are surface phenomena mainly influenced by the surface properties of materials. 7 Therefore, selecting appropriate surface treatment processes and coating materials can effectively prevent the occurrence of various surface damages in hydraulic materials.
Laser cladding (LC) is a kind of surface strengthening and repair technology performed through cladding material melting and solidifying rapidly deposited on the substrate surface under laser irradiation, which contributes to forming a fine-grained microstructure and a high hard surface coating.8,9 It is widely applied in many aspects, such as surface protective coating and repairing parts in machine, because of its low dilution rate, small heat-affected region and good metallurgical bond. 10 The LC materials are alloy or single metal powder, including Fe-, Ni- and Co-based powder, and extensive efforts have been made to develop Fe-based coating due to inexpensive cost, high strength and excellent wear and corrosion resistance compared with other metal powders. 11 Lu et al. 12 prepared Fe-based coatings with different WC contents on an H13 model steel substrate using the laser cladding technology and thoroughly analysed the microstructures and the wear behavior. They reported that laser cladding coatings have higher wear resistance and lower friction coefficient compared to substrates.
Nowadays, the single-metal powder material has significantly restricted the property and application of surface coating that can be studied and utilised. Henceforth, ceramic particles, such as TiC, 13 WC, 14 VC, 15 NbC, 16 ZrC 17 and TaC, 18 have been incorporated into metal matrix composite coatings as reinforcing phases. This inclusion serves to significantly enhance strength, wear resistance, cavitation and corrosion resistance. As a common ceramic reinforcing phase additive, NbC has high melting point (3600°C), high elasticity modulus (338–580 × 103 MPa) and hardness (>235 GPa) and excellent thermal expansion coefficient (6.65 × 10⁻⁶/K).19,20 In addition, due to the density of NbC being very close to the density of Fe (7.87 g/cm3), NbC ceramic particles will not float or sink in a molten pool during laser cladding, forming a dense composite coating by the in-situ reaction of C and Nb. Liu et al. 21 prepared carbide reinforcing coating by adding Nb (0.2, 0.5, 1.0, 3.0, 5.0, 7.0 wt-%) to 316L stainless steel powder on Q235 substrate by laser cladding. They found that the addition of Nb was beneficial for hardness by grain refinement, and precipitation hardened and improved the corrosion resistance in 3.5 wt-% NaCl solution. In the research of Liu et al., 22 they found that the addition of Nb can promote the formation of a stable passivation film on the surface of low-carbon steel, effectively improving its corrosion resistance in high-alkaline experimental environments. According to the report of Teng et al., 23 the sensitive regions in the passive film of both Cr-rich carbides and σ-phase were harmful to the material surface of heat-resistant steel corrosion resistance, while Cr-rich carbide was a main factor. The heat-resistant cast steels with the addition of Nb showed a high corrosion resistance because of the reduction of Cr-rich carbides and the limitation of the Nb-rich corrosion products. Zhao et al. 24 reported that the corrosion resistance of the high-strength low-alloy steels was improved from the homogeneous microstructure resulting from precipitation of NbC in the substrate with the appropriate added amount of Nb. Moreover, the nanosized Nb carbide precipitates played a minor role in the corrosion behaviour of the high-strength low-alloy steels in simulated seawater.
Based on the preliminary work, the ceramic reinforcing NbC particle is widely used to improve the surface property of materials. However, rare research reported on the efforts of different-weight ratio V and Nb of in situ formation composite carbides on microstructure evolution, phase composition, wear and corrosion behaviours of high-carbon Fe-based composite coatings by LC. In the present study, five kinds of different-weight ratio V and Nb coatings were prepared on 0Cr13Ni5Mo martensite stainless steel substrate by LC with different Nb contents from 0.0 to 11.0 wt-%. The effects of the Nb content on the microstructure evolution, phase composition and crystal preferred orientation were characterised, and the microhardness, wear and corrosion resistance were investigated. The role of Nb in coating on wear and corrosion resistance was also discussed.
Experimental procedures
Materials and preparation
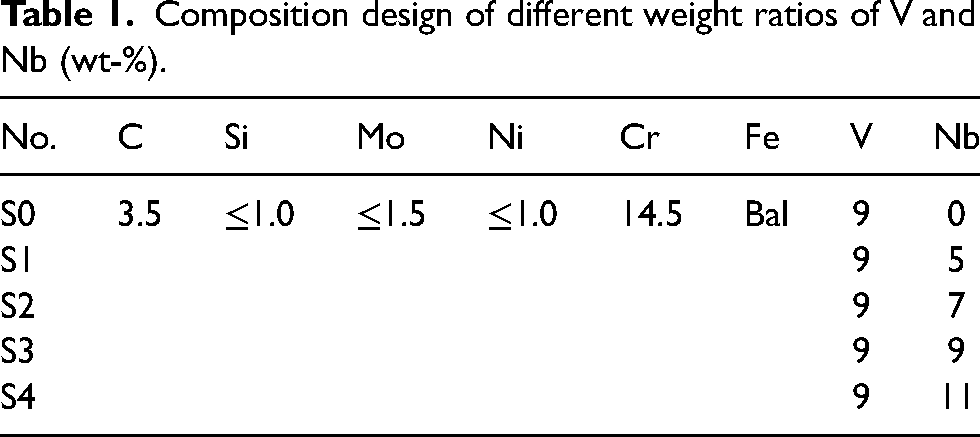
The 0Cr13Ni5Mo alloy normalised at 1000°C for 6 h and tempered at 600°C for 6 h was chosen as the substrate. It is a cylindrical shape with a diameter of 160 mm, and the nominal chemical compositions were as follows (in wt-%): 0.05 C, 0.70 Si, 0.95 Mn, 0.01 S, 0.03 P, 15.50 Cr, 5.50 Ni, 0.90 Mo and balanced Fe. The Nb powder was added to high-carbon Fe-based powder in the content of 0, 5, 7, 9, and 11 wt-%, and then physically mixed for 1 h using a planetary ball mill to ensure uniform dispersion. The chemical compositions of different-weight ratio V and Nb high-carbon Fe-based alloy powder are listed in Table 1. Figure 1 shows the powder morphologies of the S0 and S3 samples. From Fig. 1(a) and (b), it can be observed that the S0 powders are spherical, and the powder satellite is rare. Figure 1(c) and (d) exhibits that the Nb powders are uniformly mixed in composite powders. The coating was prepared using the ytterbium laser system (YLS-6000); the wavelength was 1070 nm; and the maximum laser output of the powder was 3000 W under the protection of argon. Figure 2 shows the scheme diagram of the laser cladding process in this experiment. The detailed laser processing parameters are as follows: laser power, 2900 W; scanning speed, 800 mm/min; beam size, 3.5 mm; powder feeding rate, 15 g/min; overlapping rate, 50%; and shielding gas flow: 15 L/min.
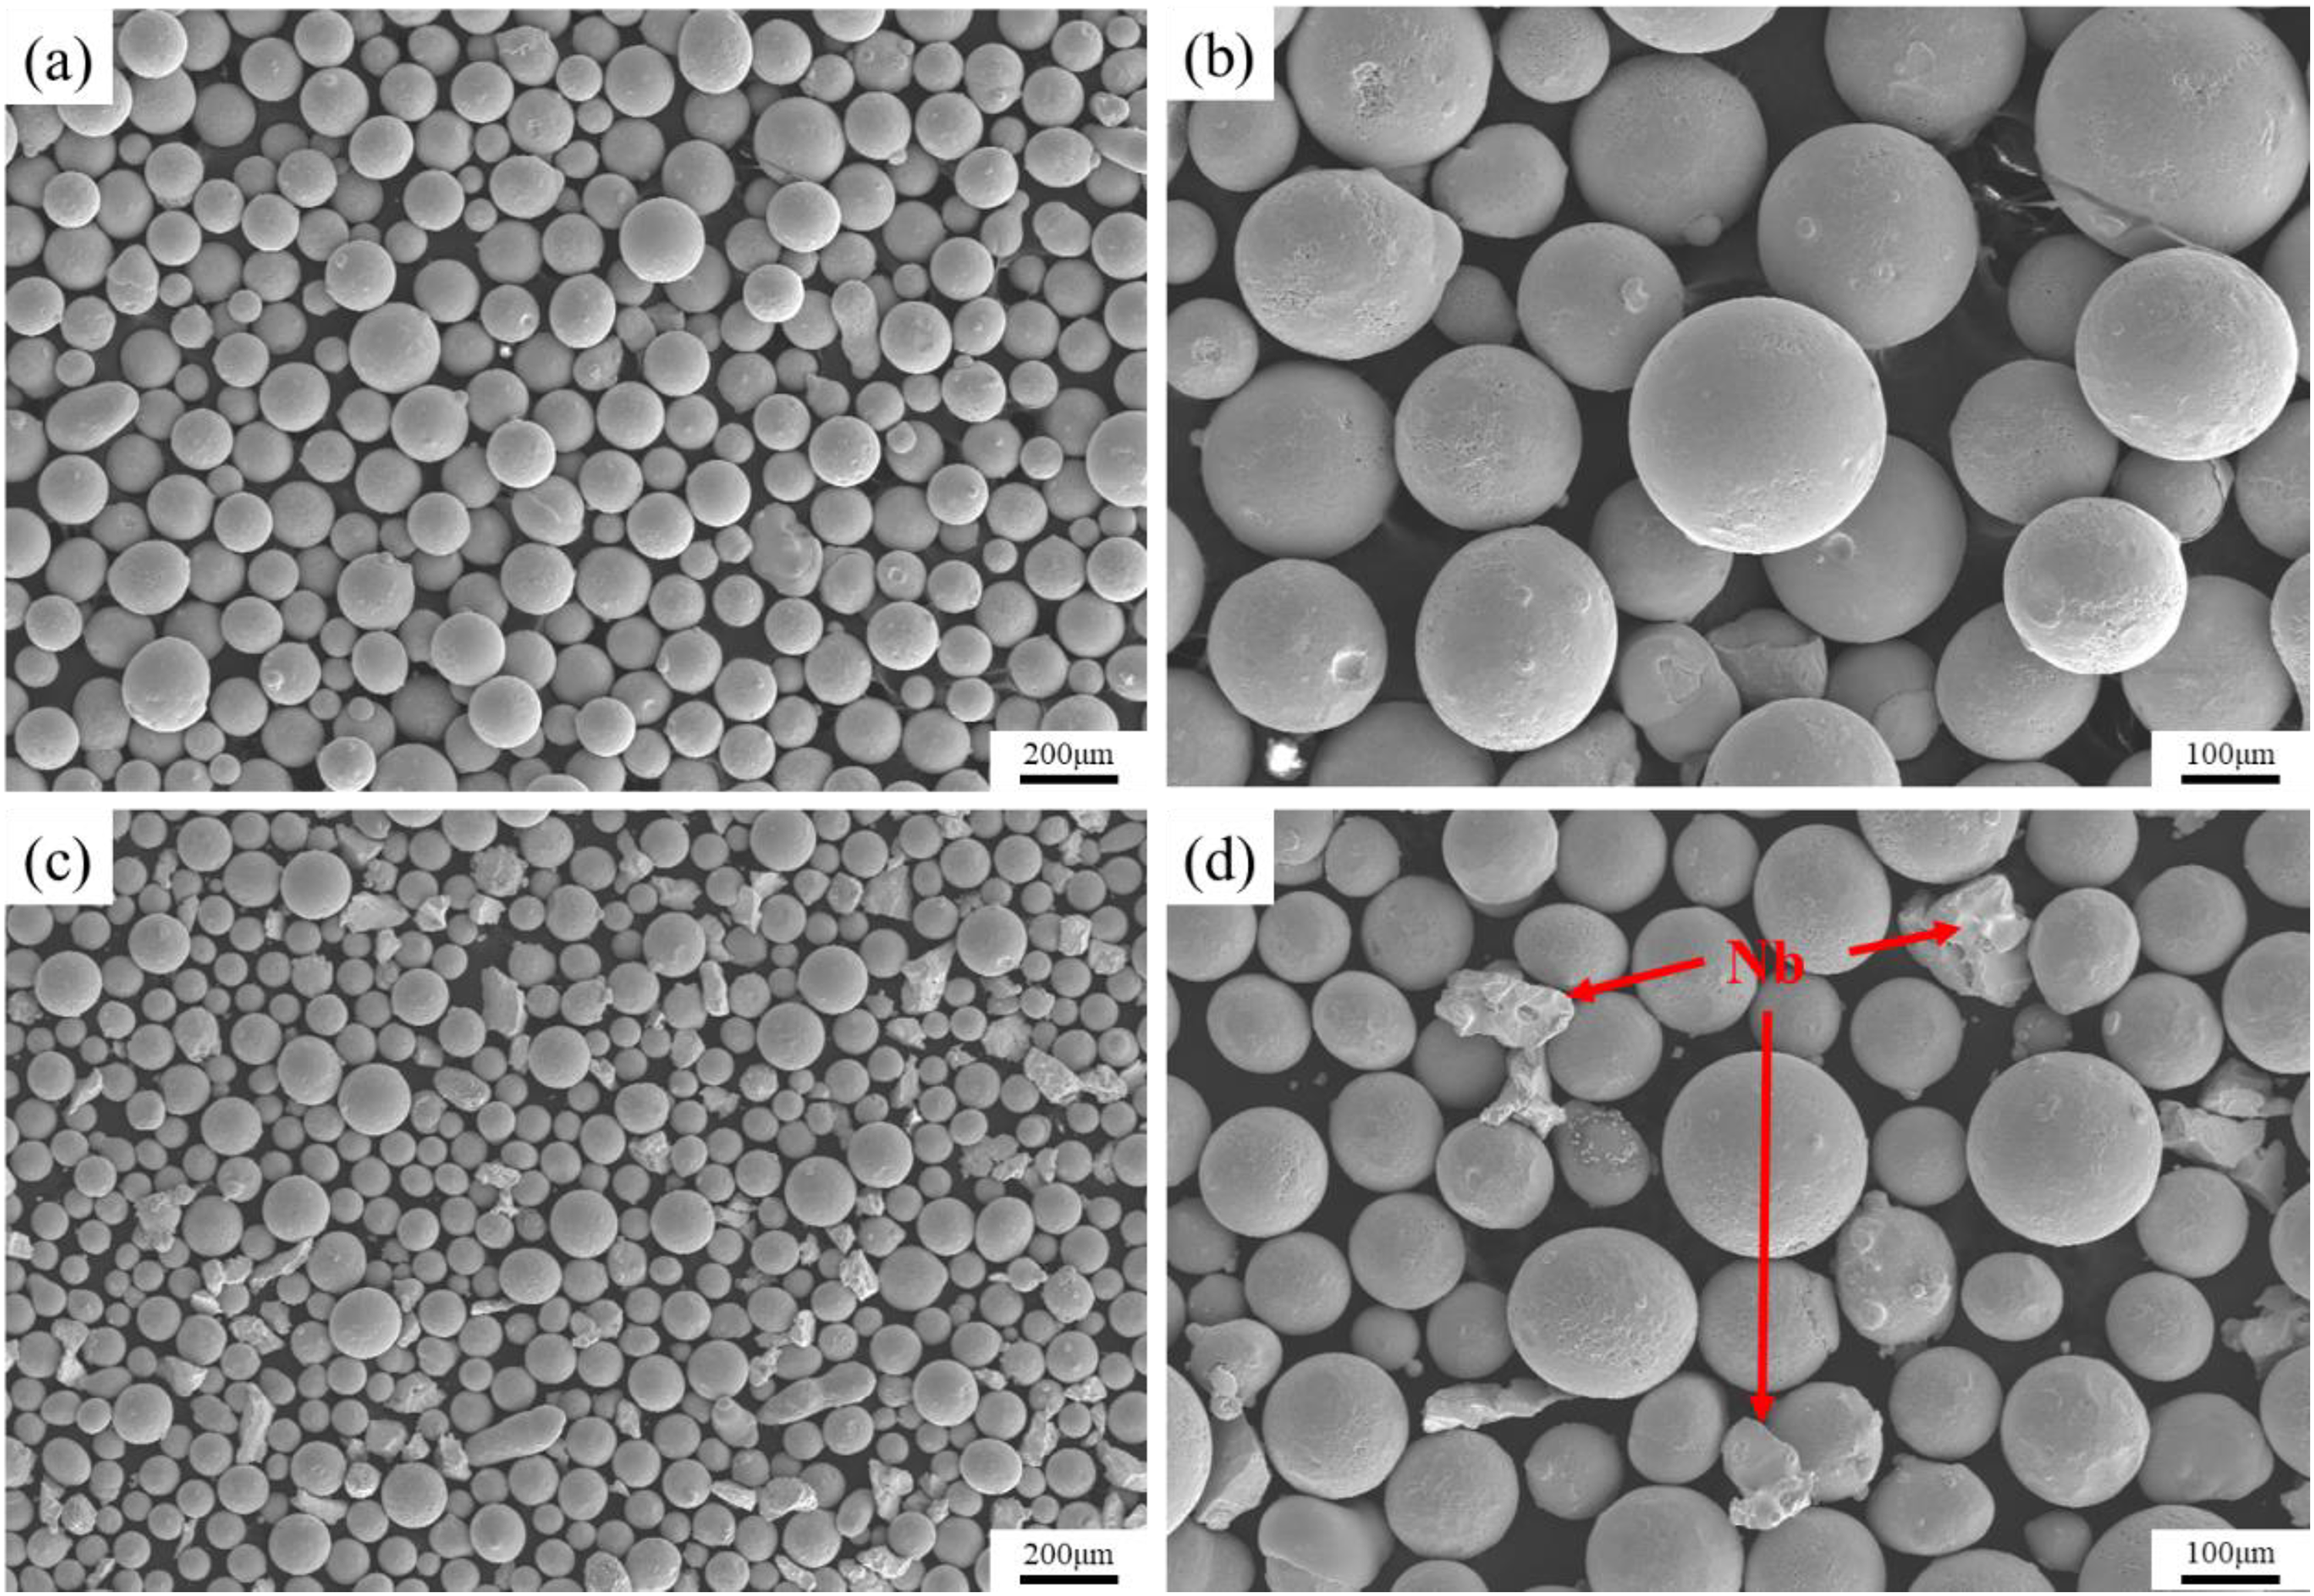
Powder morphologies of S0 and S3: (a) S0, (b) enlarged image of (a), (c) S3 and (d) enlarged image of (c).
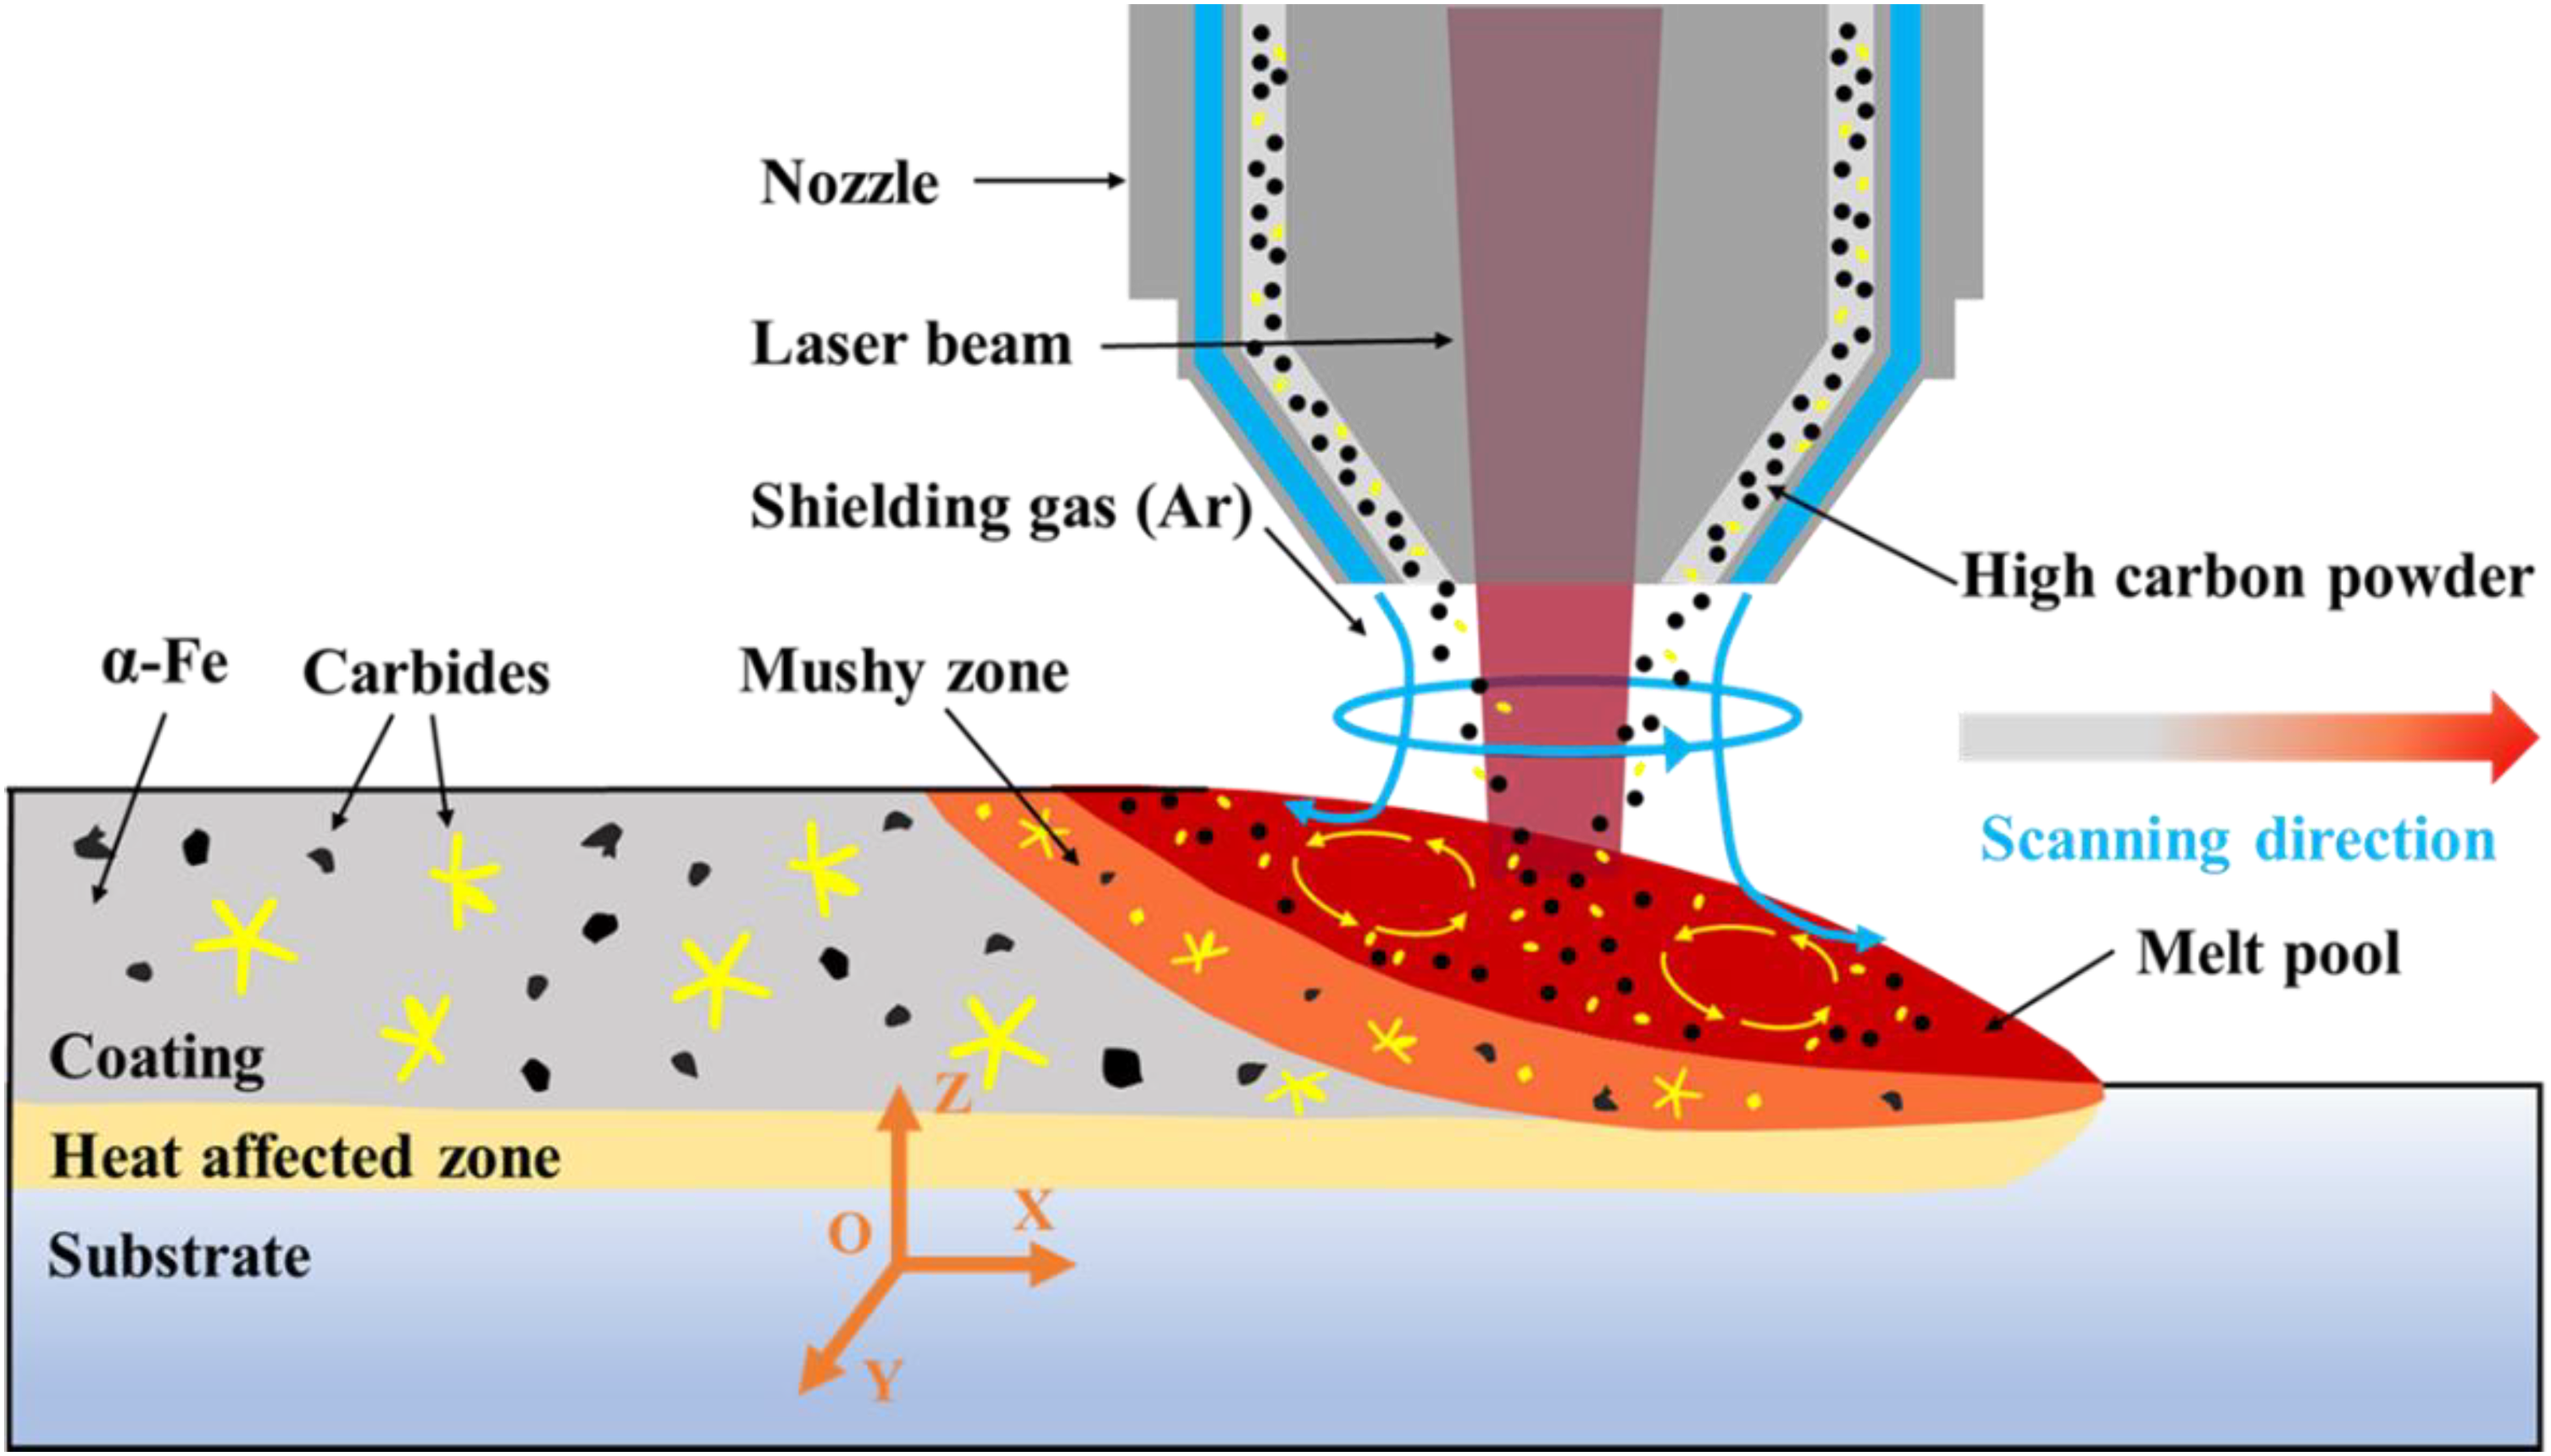
Scheme diagram of the laser cladding process.
Composition design of different weight ratios of V and Nb (wt-%).
Material characterisation
The synthesised coating specimens of different Nb contents were cut along the cross-section (XOZ) and the coating plane (XOY direction) by wire-electrode cutting for testing samples of phase analysis, microstructure observation, crystallographic structure analysis and performance characterisation, with the size of 10 × 10 × 5 mm. Prior to the experiment, all samples were ground and polished to remove oxides and contaminations. The phase analysis was carried out using an X-ray diffractometer (XRD-7000, target: Cu voltage: 40 kV, current: 30 mA, scanning rate: 4°/min) with a scanning range from 20 to 100°. The samples of the microstructure observation were etched with an aqua regia solution (nitric acid:hydrochloric acid = 1:3) for 5–8 s, and then the surface morphology and chemical composition of the material were studied and analysed through scanning electron microscopy (SEM, S-3400N, Hitachi) and energy dispersive spectroscopy (EDS). The electron backscatter diffraction (EBSD) was applied to determine the crystal orientation and the crystallographic microstructure.
Microhardness and wear
The Vickers microhardness tester (HVS-1000) was selected to measure the microhardness of cladding layer samples with different Nb contents. The microhardness test was carried out with a normal load of 200 g and a loading time of 10 s. The microhardness was measured every 200 μm from the top of the coating to the interface in a vertical line. Each position on the microhardness curve was measured at least five times to reduce the inevitable error.
The multifunctional material surface performance tester (MFT-4000) was utilised to investigate the wear behaviour and the wear mechanism of the coatings through a linearly reciprocating route. Prior to the experiment, the sample underwent polishing with SiC sandpaper (polished to 2000 mesh), followed by polishing with 2.5 μm polishing paste to mitigate the influence of surface roughness on the experimental results. In the wear test, Si3N4 balls with a diameter of 5 mm were used as the upper friction pair, and cladding samples with different Nb contents were used as the lower friction pair. The wear property of the cladding samples was evaluated by the ball surface contact method. The detailed test parameters are as follows: room temperature, 25 ± 1°C; normal loading, 15 N; sliding stroke, 5 mm; reciprocating rate, 120 mm/min; and test time, 60 min. During the wear test, the average wear coefficient (COF) of the sample was recorded and saved synchronously by a connected computer. To ensure the reliability of the experiment, measurements of three replications were performed for a specific sample. The XAM-3D profiler (New View™ 9000-ZYGO) was adopted to evaluate the three-dimensional (3D) wear tracks. In addition, SEM was used to observe the wear morphologies, and EDS was used to analyse the element distribution.
Electrochemical behaviour
The electrochemical workstation (Gamry Reference 600) was selected to determine the electrochemical behaviours of the coatings in 3.5 wt-% NaCl solution at room temperature (25 ± 1°C). For the tested sample, the connection wire was embedded in epoxy resin, exposing an experimental area of 10 × 10 mm. The packaged sample underwent polishing after grinding to prevent the surface roughness from affecting the electrochemical behaviour. The potentiodynamic polarisation parameters were implemented at a scanning rate of 0.5 mV/s with a starting potential of 500 mV below the open-circuit potential (OCP). The electrochemical impedance spectra (EIS) were investigated in the range of frequency of 105–10−2 Hz, and the results were analyzed by using ZSimpWin. The electrochemical corrosion morphologies of the coating samples were observed through SEM.
Results and discussion
Phase constituents and microstructure
Figure 3 shows a macro-morphology image of the five coatings. It is worth noticing that obvious cracks are found on the surface of the S0 coating, and no obvious flaws are detected with the addition of Nb. Figure 4 shows the XRD spectra of the five coatings with different Nb contents. It can be seen from Fig. 4(a) that the five cladding coatings have similar phase constituents, which are composed of a body-centred cubic (bcc) α-Fe martensite phase, a face-centred-cubic (fcc) γ-Fe austenite phase, a carbide-reinforced phase VC and Cr23C6. It is worth noting from the diffraction peaks of S1, S2, S3 and S4 that NbC has been found, indicating that the carbide-reinforced particle NbC is formed by the in-situ reaction between the C and Nb elements during laser cladding with the addition of Nb. Figure 4(b) shows a comparison between the strongest diffraction peak and the standard peak in the enlarged diffraction pattern. It is found that the actual diffraction angles of the five coatings are lower than the standard diffraction angle (α-Fe: PDF-85-1410; diffraction angle: 44.675°). This phenomenon is ascribed to the lattice distortion with the addition of the Nb element and can be explained by Bragg's equation
25
:
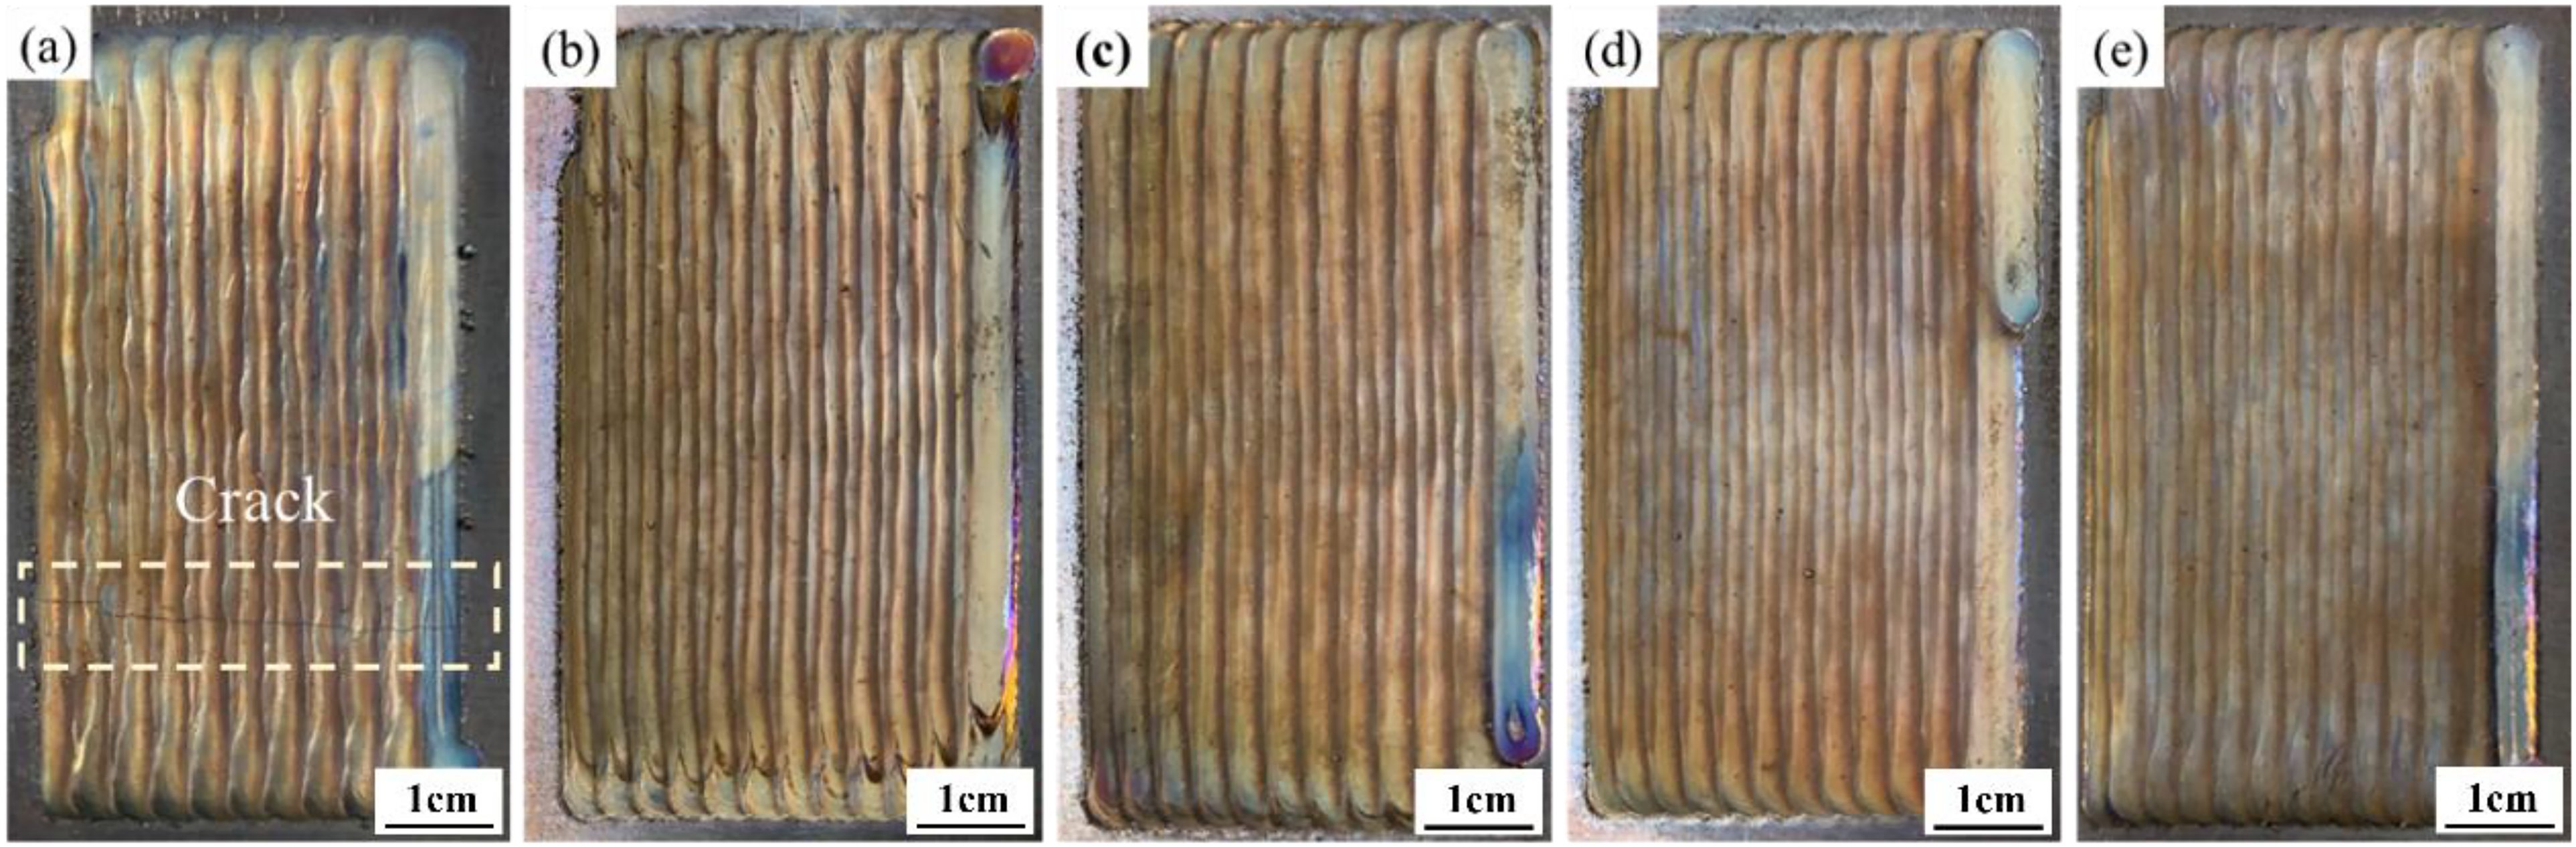
Macro-morphology image of the five coatings: (a) S0, (b) S1, (c) S2, (d) S3 and (e) S4.
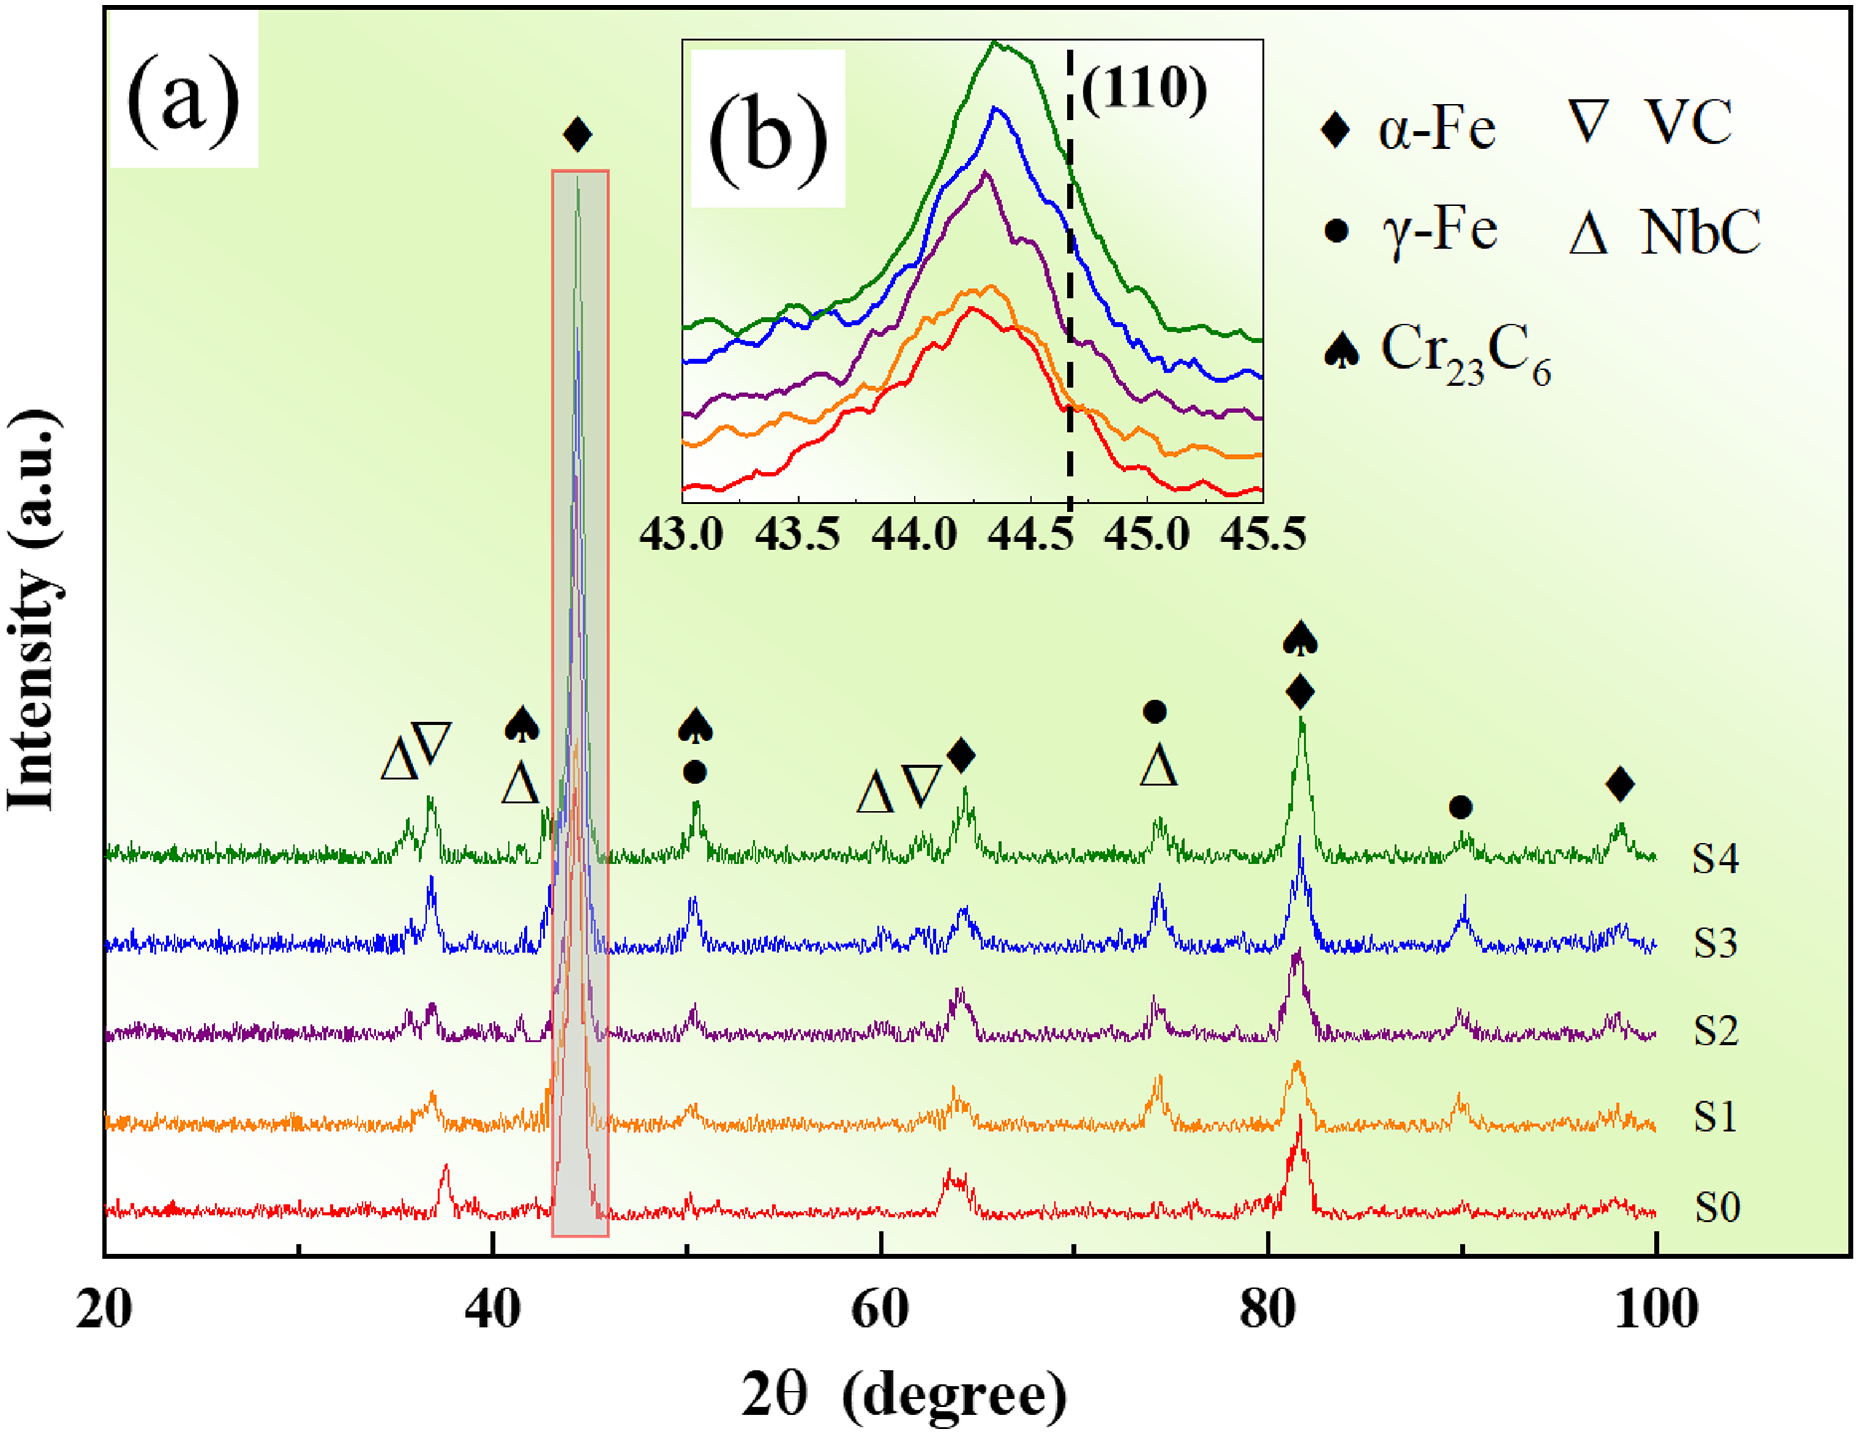
(a) XRD spectra of the coatings with different Nb contents and (b) an enlarged main diffraction peak.
In addition, the evolution of the strongest diffraction peak width can reflect the average grain size, and the corresponding relationship can be expressed as by Scherrer formula
26
:
Figure 5 shows the SEM image (coating plane) of the five coatings. It can be found that the microstructure morphologies of the five cladding coatings are composed of a grey matrix and carbides with different shapes. In order to further determine the compositional variation of the five coatings in different regions, EDS was used to determine the chemical composition (Fig. 5). The result is shown in Table 2. The composition analysis of regions 1 and 2 in Fig. 5(a) shows that the black quadrangle- and petaloid-shaped microstructures are VC-reinforced phases. In addition, the content of Nb gradually increased in the papilionaceous and petaloid (Nb, V) C carbide-reinforced phase with the addition of 9 and 11 wt-% Nb in the coating. Even regions (4, 6, … 10) detected that the Fe content is the highest value; hence, the grey microstructure is a matrix phase. Sun et al. 15 reported that (Ti, Nb) C was a multiple carbide with an NbC structure. It can be concluded that (Nb, V) C is also a multiple carbide with an NbC structure. It is noticed that the shape of (Nb, V) C gradually varied from a quadrangle to papilionaceous and petaloid shape with the content increase of Nb in the coating. This phenomenon was ascribed to the NbC structure of the face-centred cubic, which had a lower interfacial energy in the crystal plane to lead a larger growth rate in the [100] crystal direction and easily obtained an octahedron structure. 28 When the Nb content was lower, the number of NbC was fewer so as to cause the reduction in the heterogeneous nucleation sites and limit the nucleation and growth of NbC and other phases. With the increase of Nb, the abundant heterogeneous nucleation sites from the primary NbC promoted the transformation from the octahedral growth units of NbC along the [100] crystal direction. Hence, the NbC shape gradually changed from quadrangle to papilionaceous and petaloid with the addition of Nb. 19 It is worth noting from Table 2 that the Cr content increased in S0, S1, S2, S3 and S4 due to the frequent formation of carbide-reinforced particles, which consumed the C element in the coating to limit the formation of Cr carbide. Consequently, a higher amount of Cr dissolved in the matrix phase.
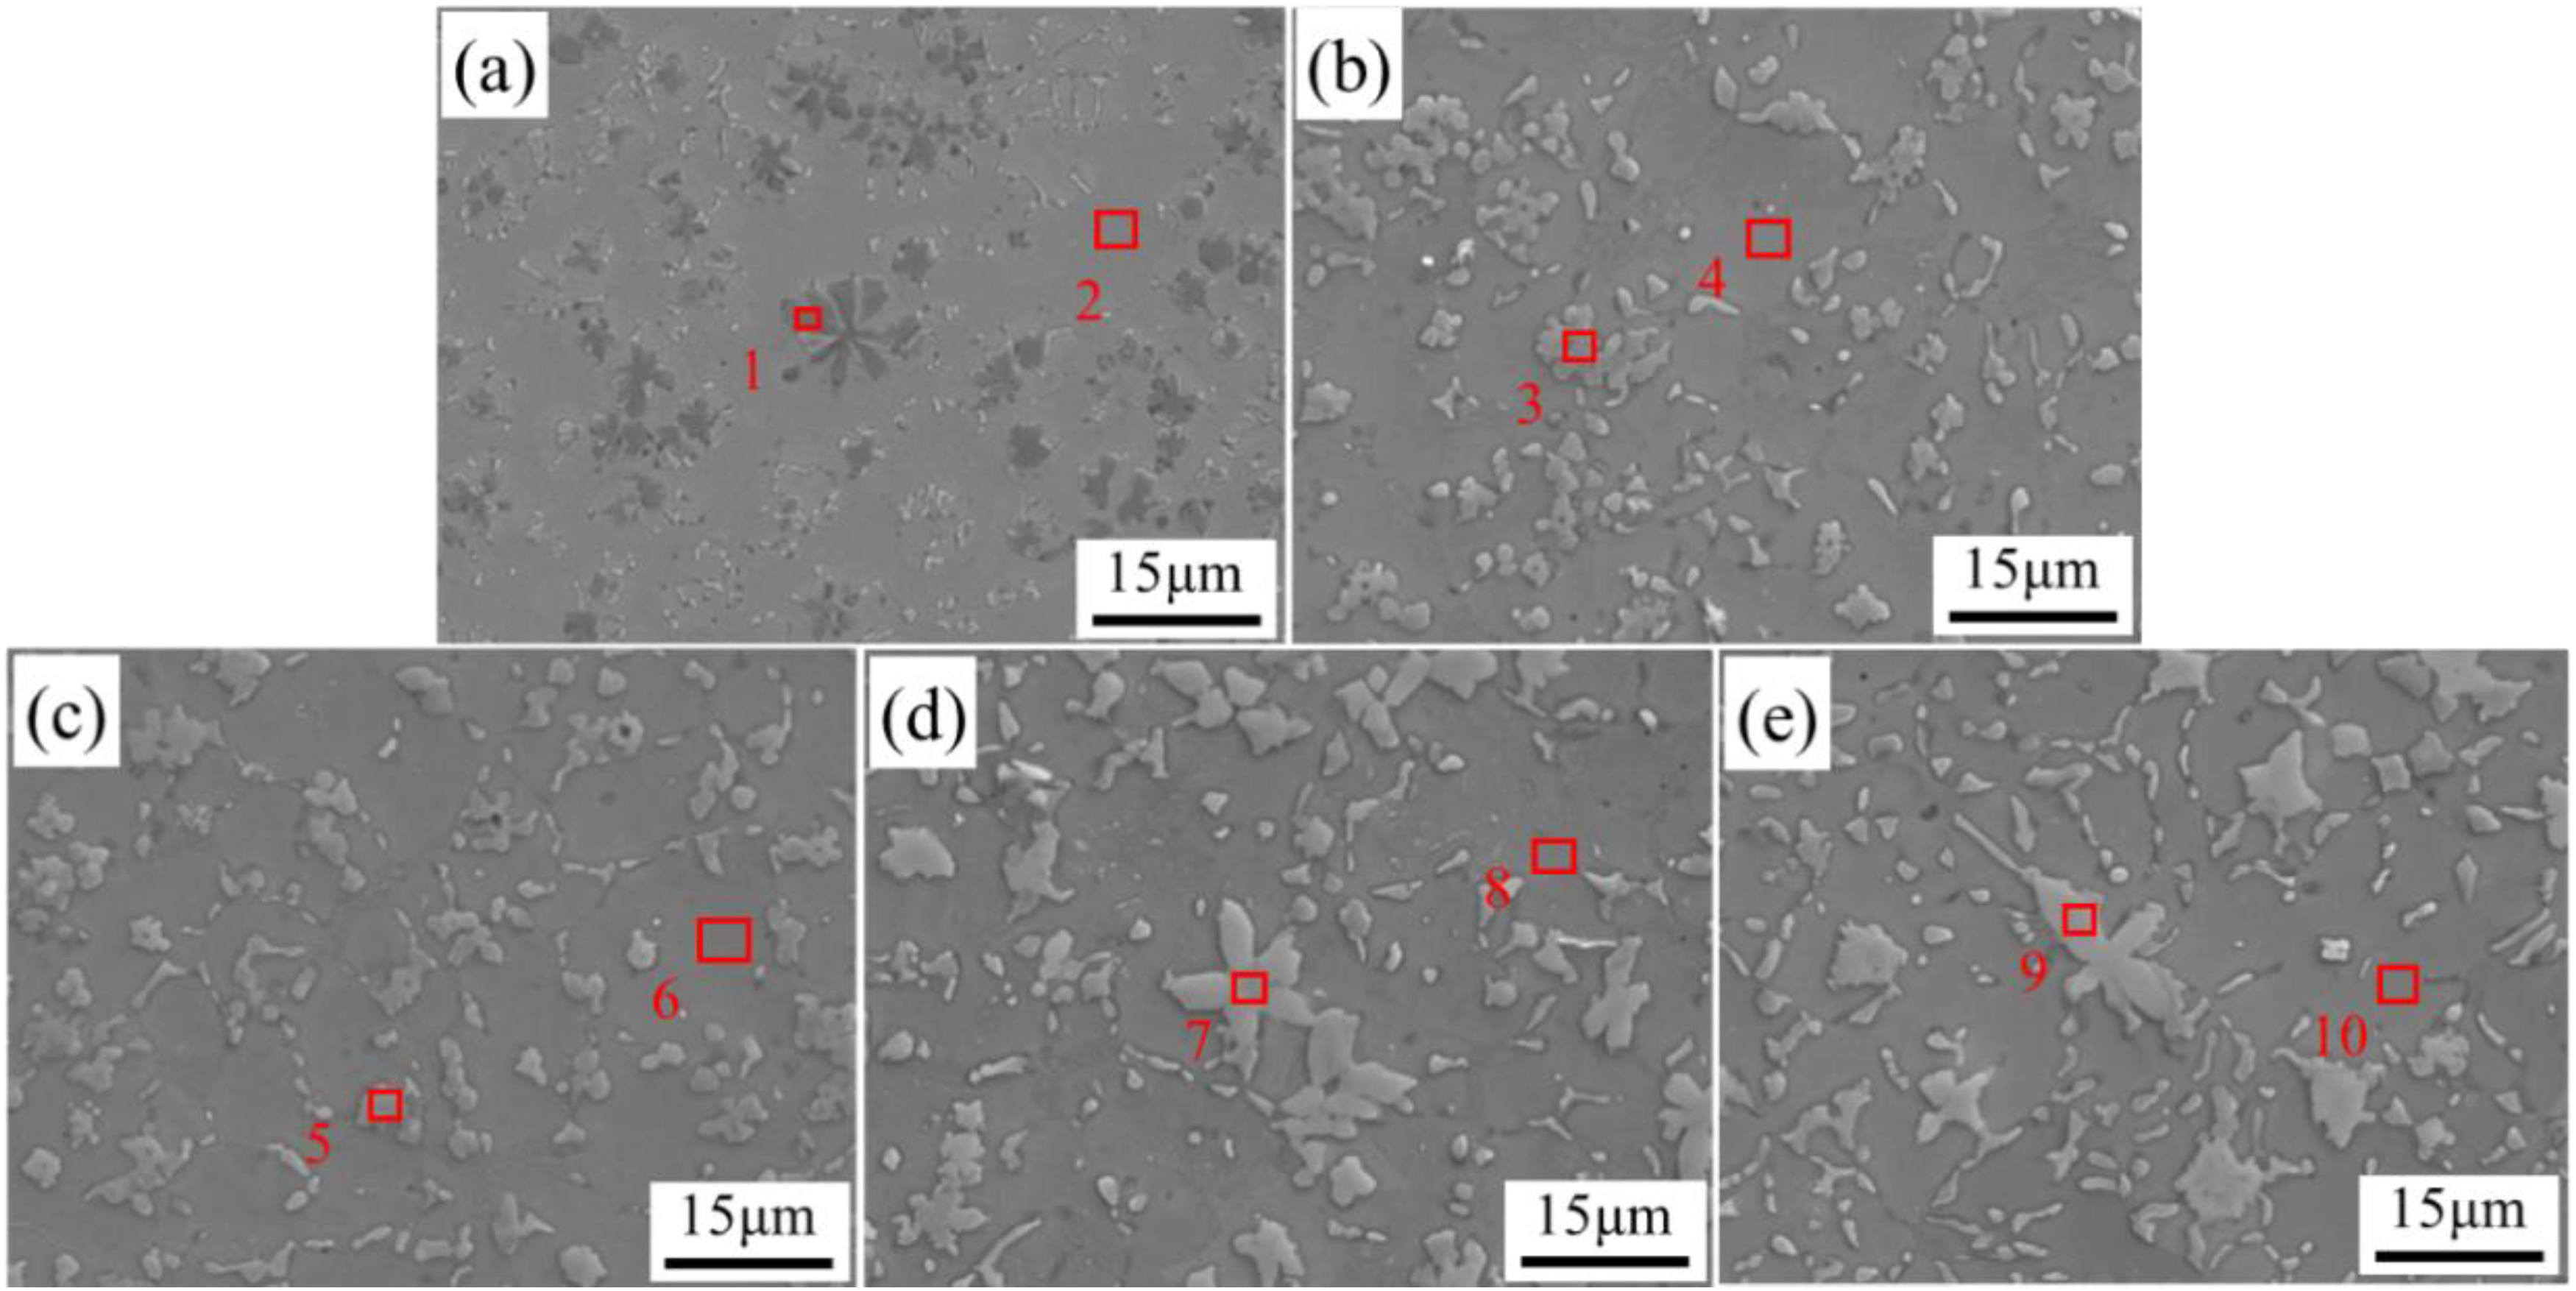
SEM images (coating plane) of the five coatings: (a) S0, (b) S1, (c) S2, (d) S3 and (e) S4.
Chemical composition of different regions in Fig. 4 (wt-%).
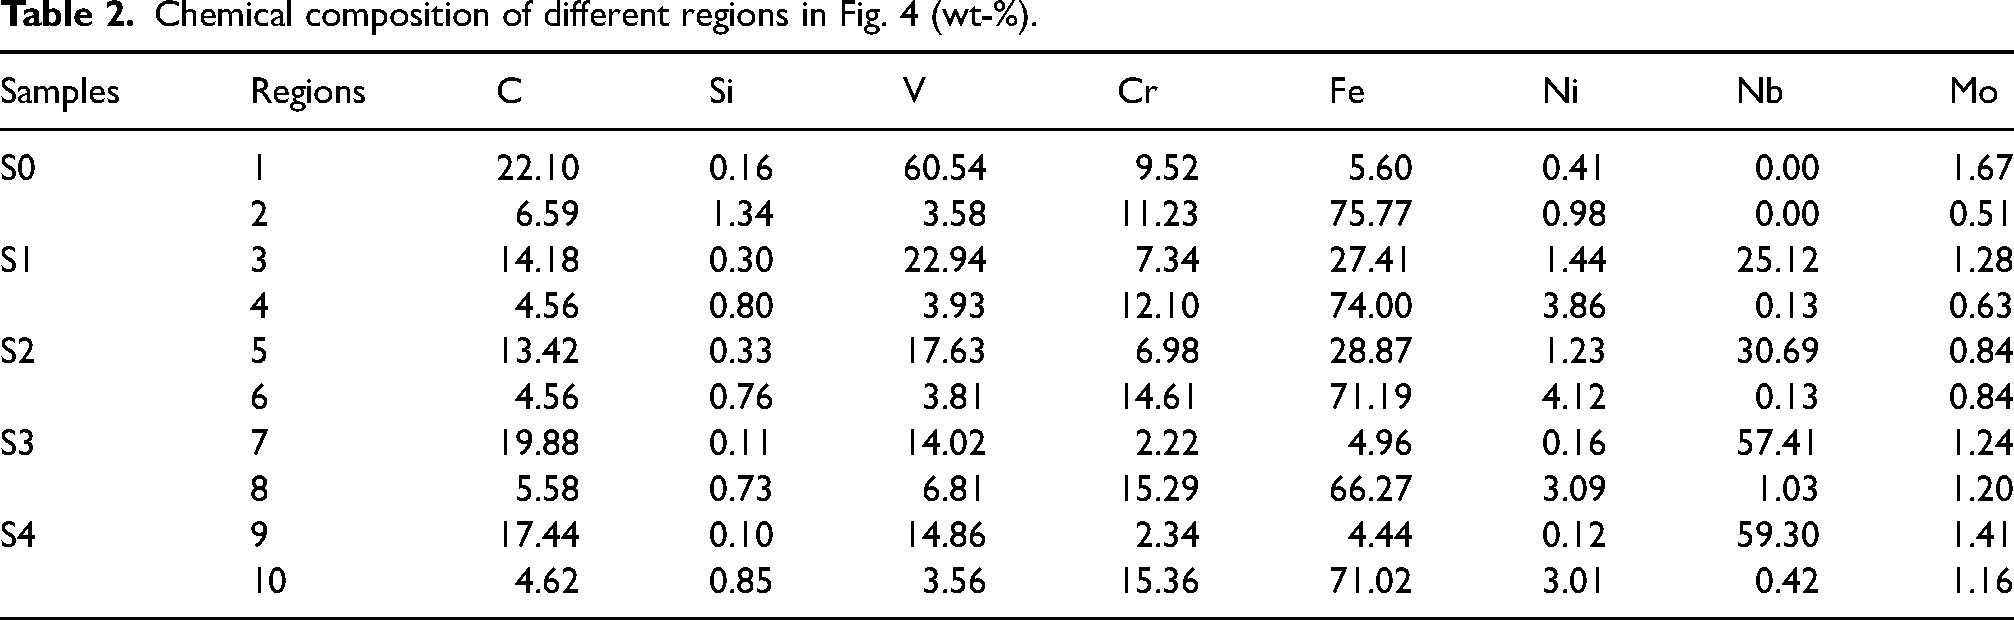
Figure 6 shows the element mapping of the five coatings in Fig. 5. It is noticed that the distribution of the Cr element on the surface of the coatings was in agreement with above forecast showing that a higher amount of Cr was released from Cr carbide and dissolved in the matrix. It can be clearly seen from Fig. 6 that the morphologies of NbC were quadrangle, papilionaceous and petaloid in accordance with the increase of the Nb content in the above analysis. NbC was rich in Mo, and the distribution of the V element was changed from petaloid to distribution around the Nb element. It can be determined that the primary NbC first precipitated as heterogeneous nucleation sites, and then VC dissolved in the NbC phase. The formation of the carbide-reinforcing phase in the laser cladding process was beneficial in enhancing the strength of materials and improved the wear resistance of the coatings in the wear environment.
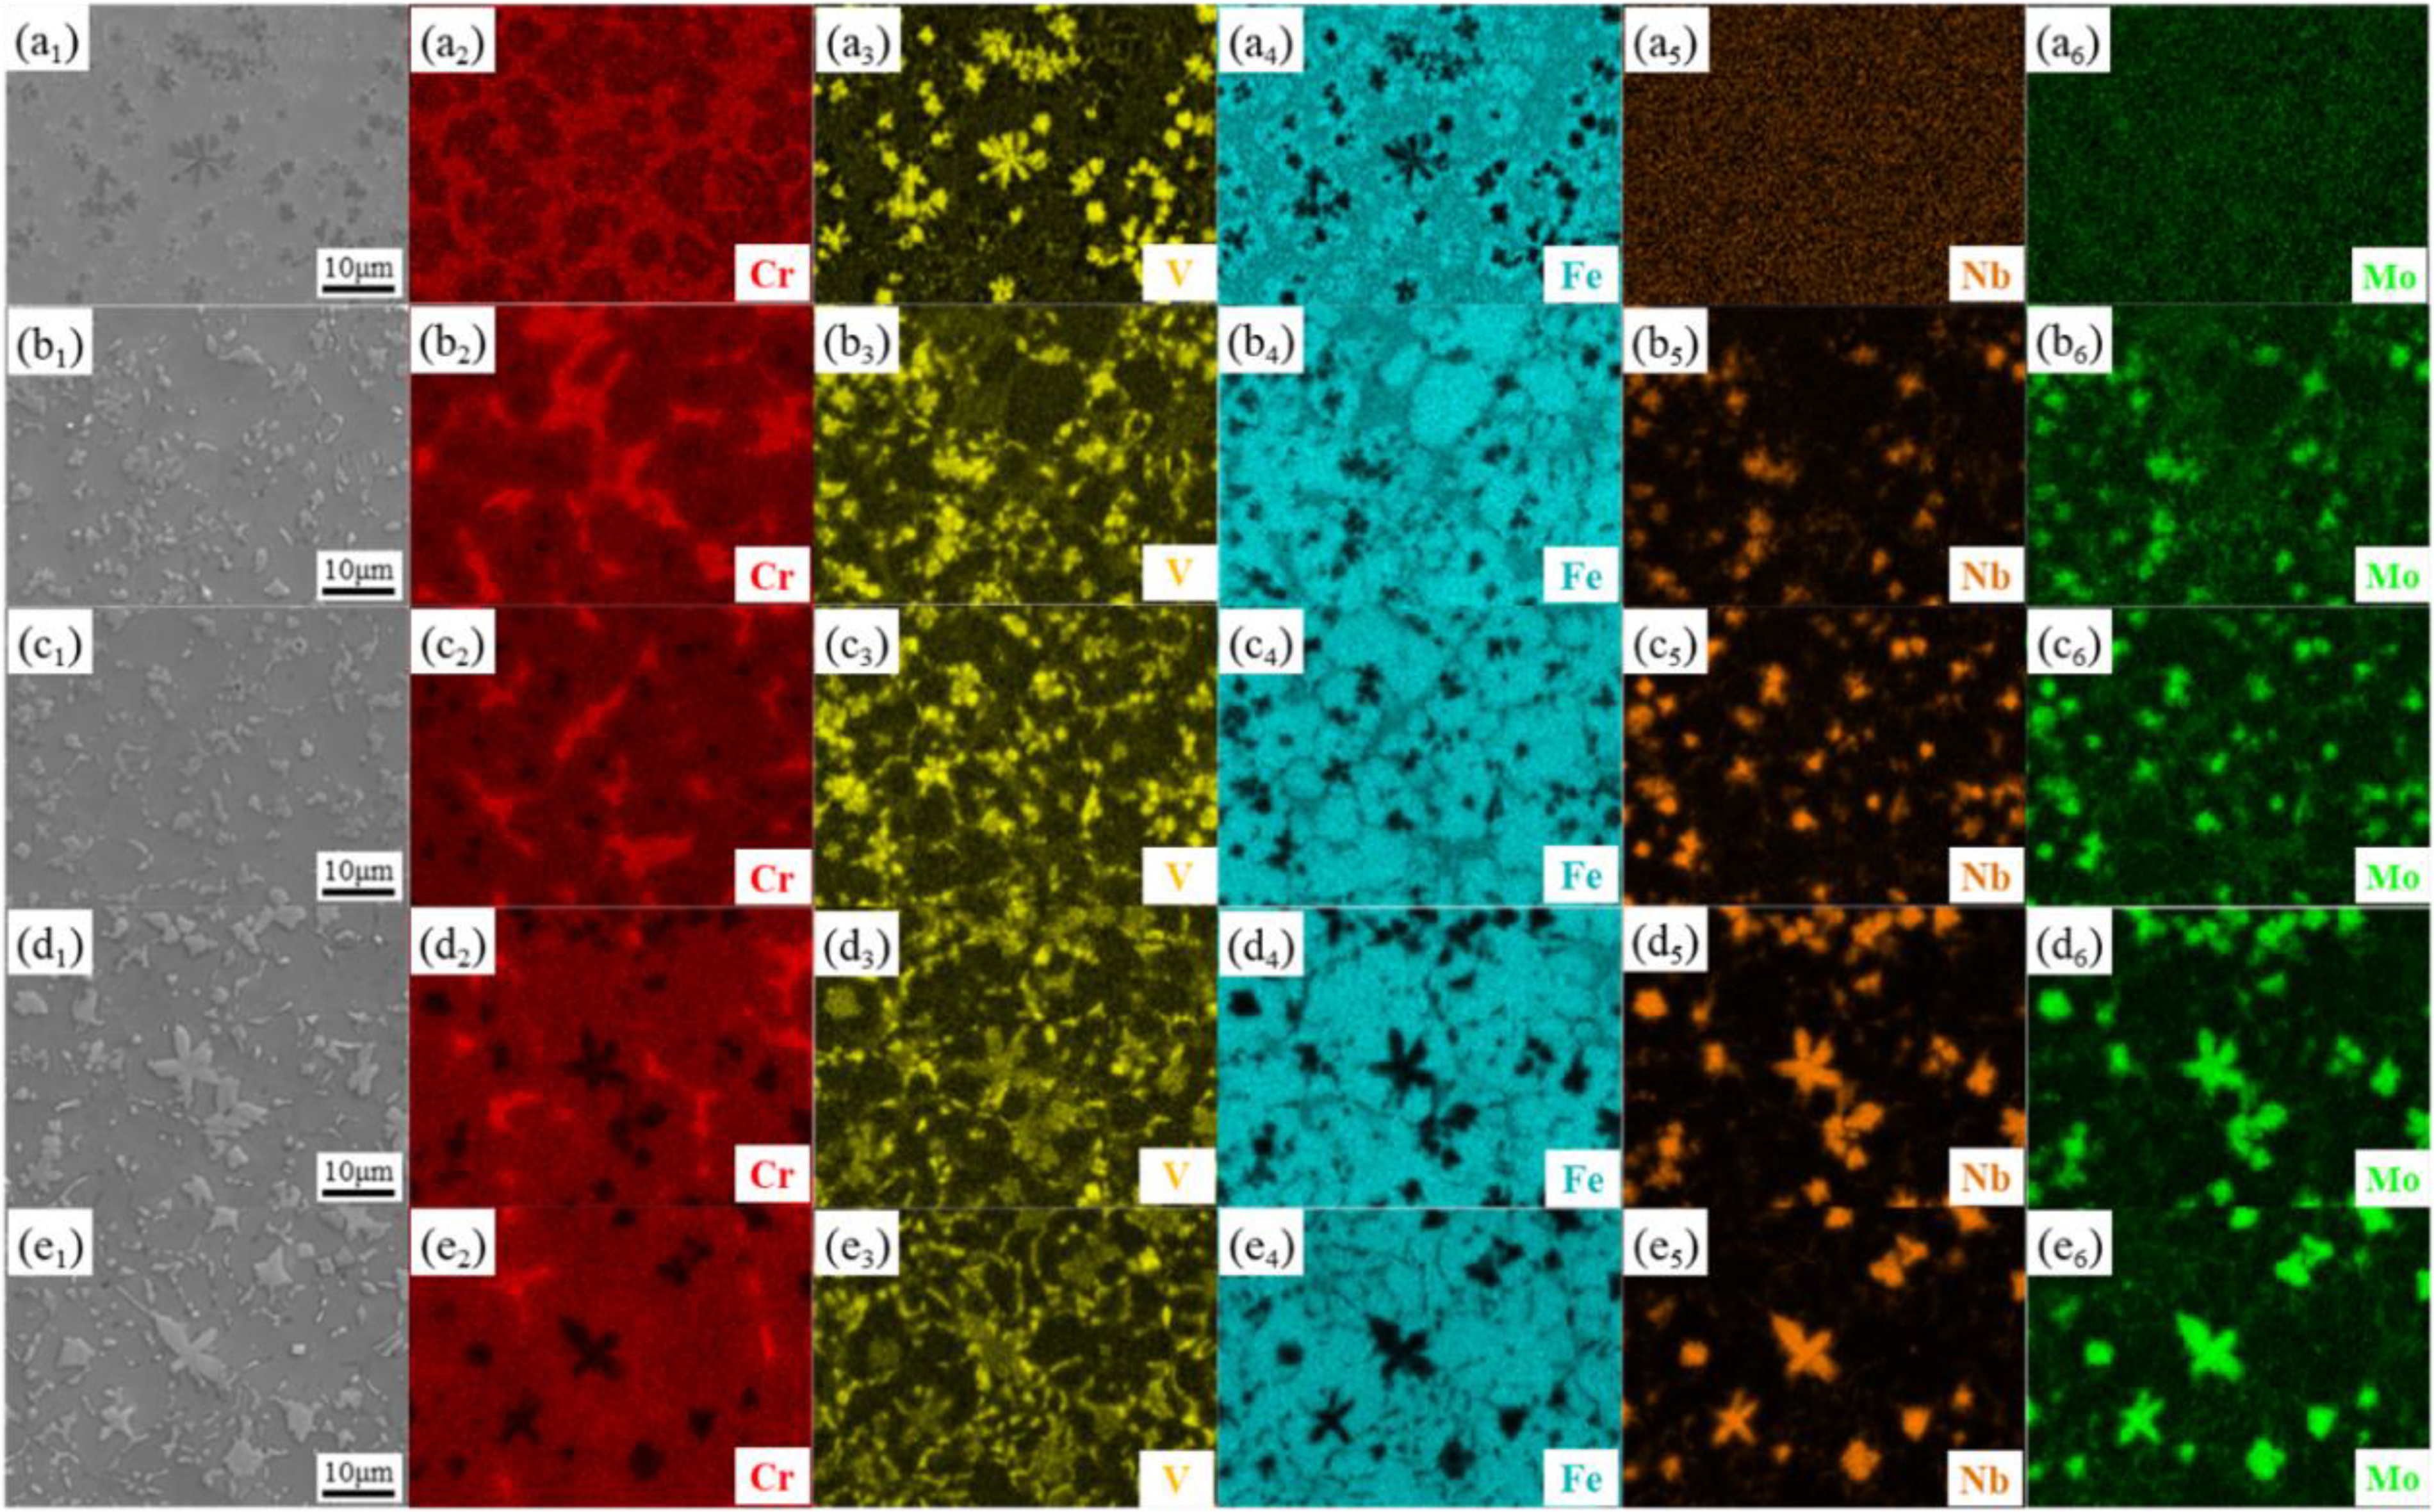
Element mappings of the five coatings: (a1)–(a6) S0, (b1)–(b6) S1, (c1)–(c6) S2, (d1)–(d6) S3 and (e1)–(e6) S4.
To further explore the microstructure of the near surface (cross-section), the SEM image of the five coatings along the XOZ direction is shown in Fig. 7. The microstructure morphology of the near-surface samples was similar to that of the surface samples composed of a grey matrix and carbides with different morphologies. As for S1 and S2 in Fig. 7(b) and (c), the small number of quadrangles (Nb, V) C were limited in the second phase strengthening. It can be found in Fig. 7(d) that the distribution of more (Nb, V) C particles in the S3 shows a good combination of large-sized papilionaceous and petaloid morphologies and a uniform-distribution small-sized quadrangle morphology in the matrix. The carbides of papilionaceous and petaloid (Nb, V) C can effectively inhibit the peeling off from the substrate, and the quadrangle (Nb, V) C is beneficial for dispersion strengthening in the coating. 29 For S4 from Fig. 7(e), an enormous strip precipitation is observed. EDS was used to investigate the constitution. The result is listed in Table 3. According to the EDS analysis, the strip precipitation was a carbide agglomeration of NbC that caused the excessive addition of Nb.
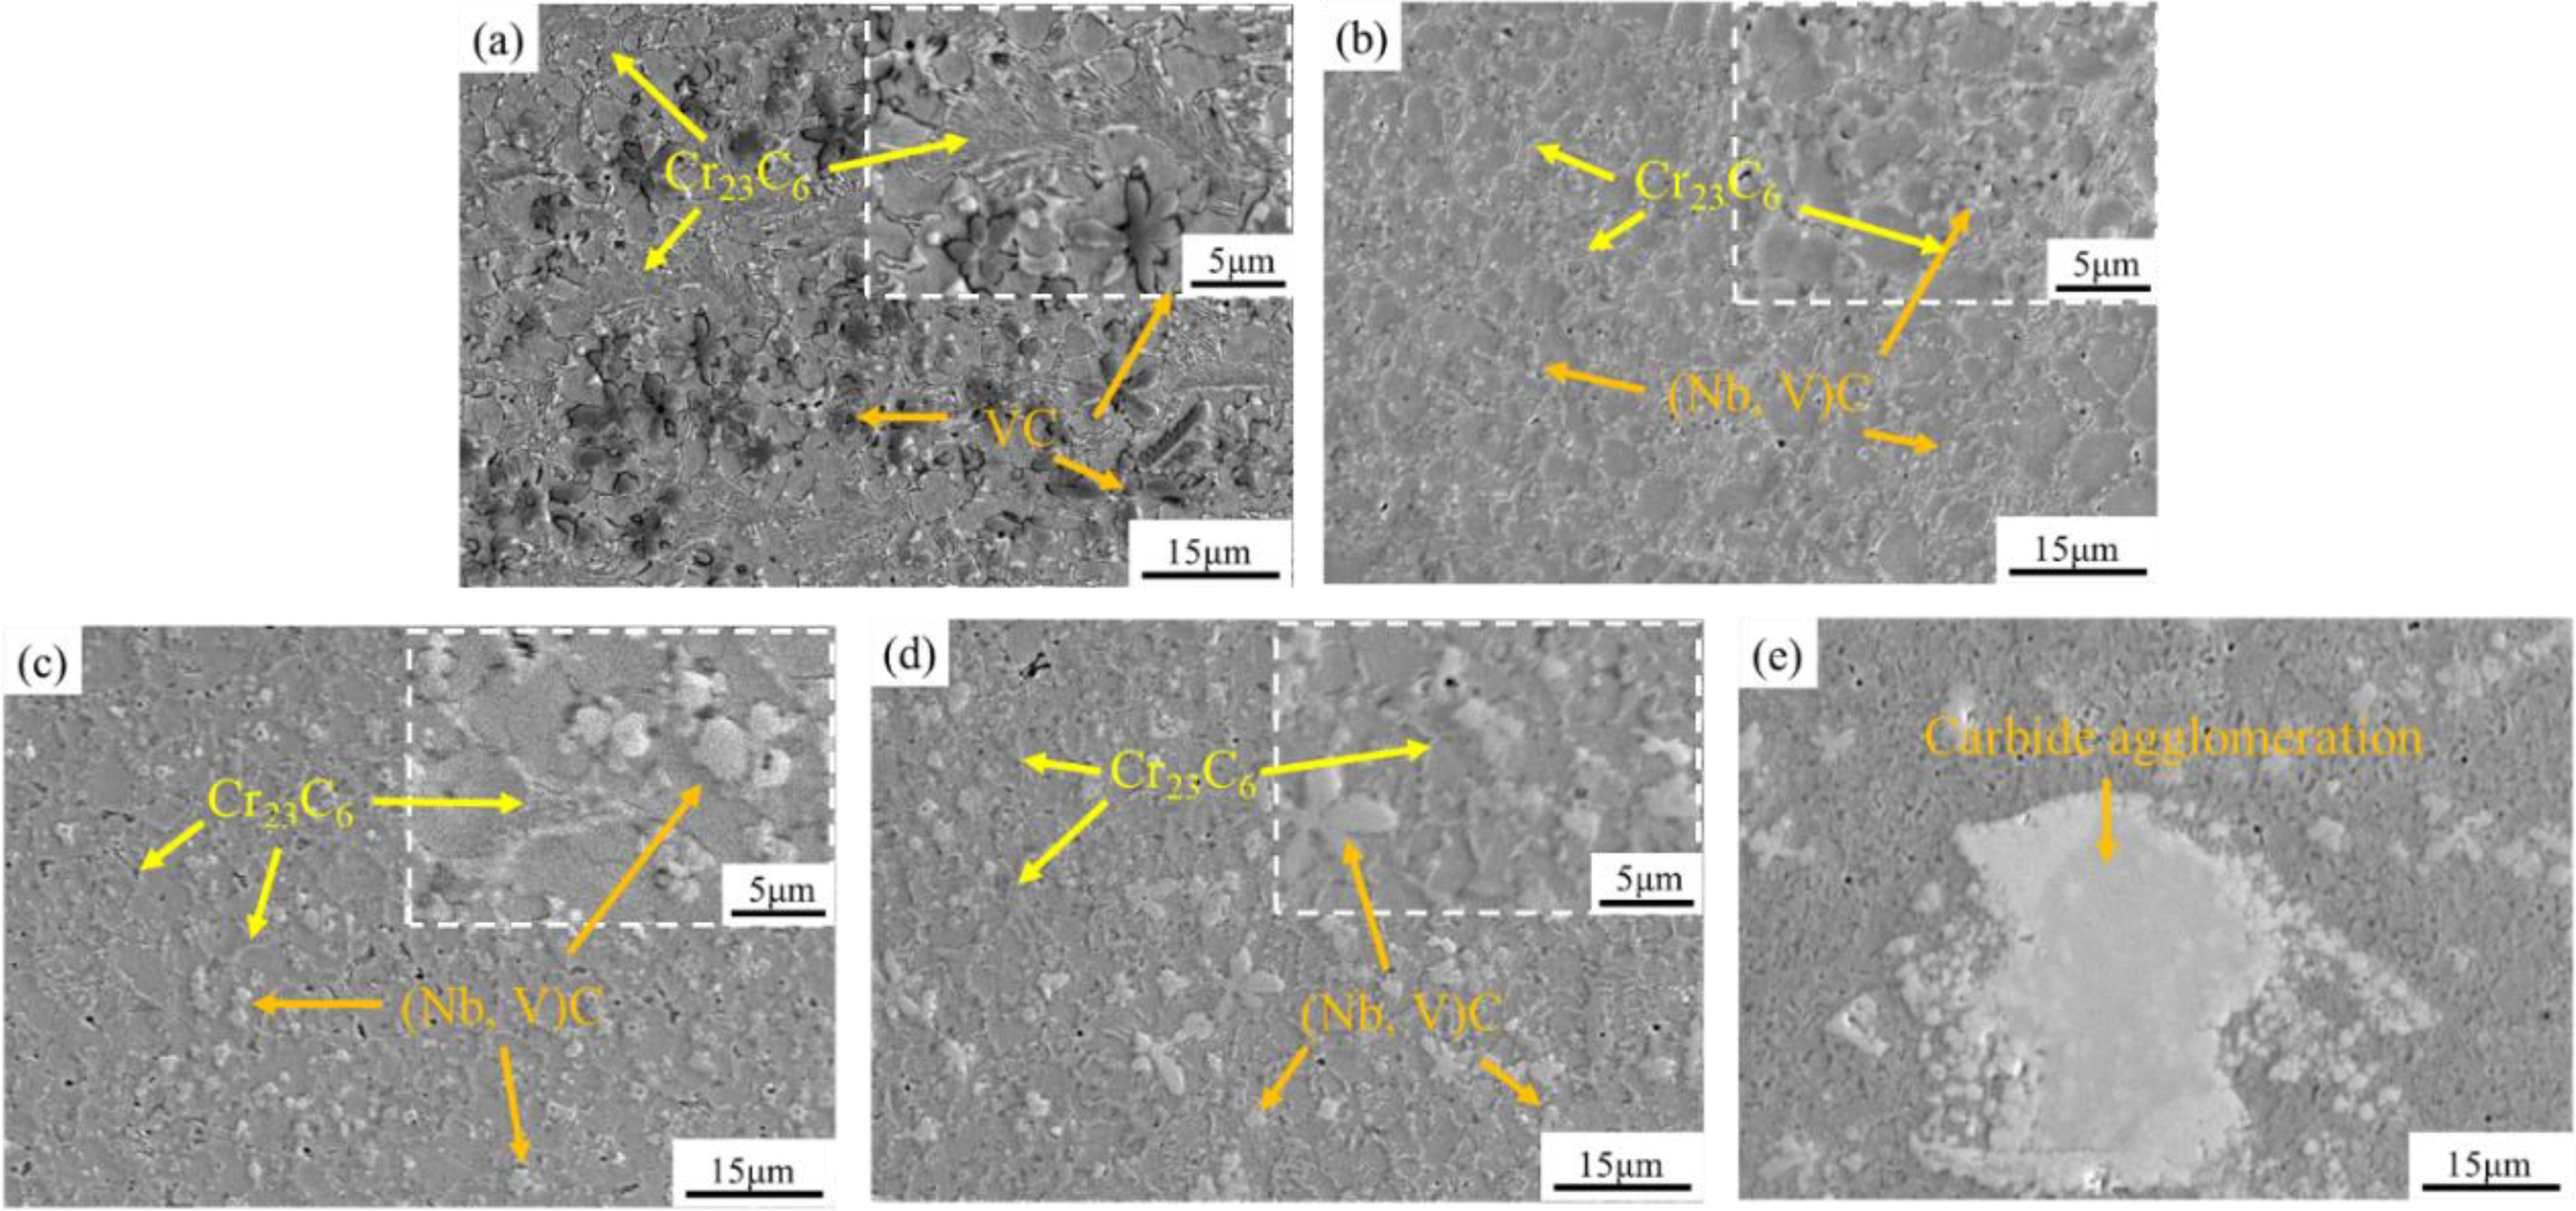
SEM images (cross-section) of the five coatings: (a) S0, (b) S1, (c) S2, (d) S3 and (e) S4.
Chemical composition of the corresponding region in Fig. 6(e) (wt-%).
Electron backscatter diffraction analysis
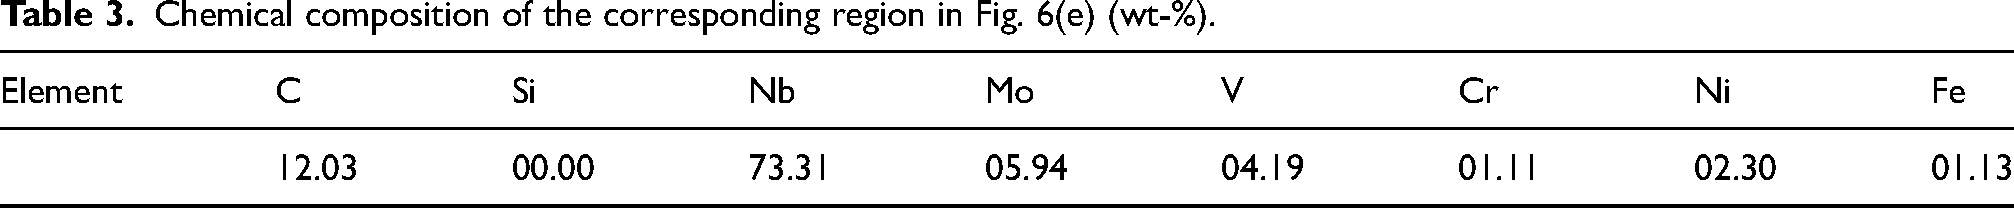
In order to further investigate the microstructure evolution, EBSD was utilised to study the crystal orientation. Figure 8 shows the orientation maps of S0, S1, S2, S3 and S4. The thermodynamic environment of the molten pool is an important factor affecting the grain orientation in the process of laser cladding. For polycrystalline materials, such as Fe-based alloys, there is a temperature gradient at the solidification front during the cooling process of laser cladding, which is generally perpendicular to the solid–liquid interface of the molten pool and parallel to the grain growth direction at the solidification front.30,31 In theory, the growth direction of the next layer of grains depends on the growth direction of the previous layer; thus, the grains in the cladding coating sample should preferentially grow along the direction of construction and heat flux. 30 As can be seen from Fig. 8(a), no obvious texture feature was seen in the coating without Nb, which benefited from the reciprocating scanning strategy to accelerate the variation of heat flowing and 50% overlapping rate by remelting and solidifying half of the previous cladding track to reduce the trend of preferred growth. There was also no obvious preferred orientation in the S1, S2, S3 and S4 from Fig. 8(b)– (e). Hence, it can be concluded that the addition of Nb plays a minor role in the variation of the grain orientation.
Orientation maps of the five coatings: (a) S0, (b) S1, (c) S2, (d) S3, (e) S4 and (f) scaleplate.
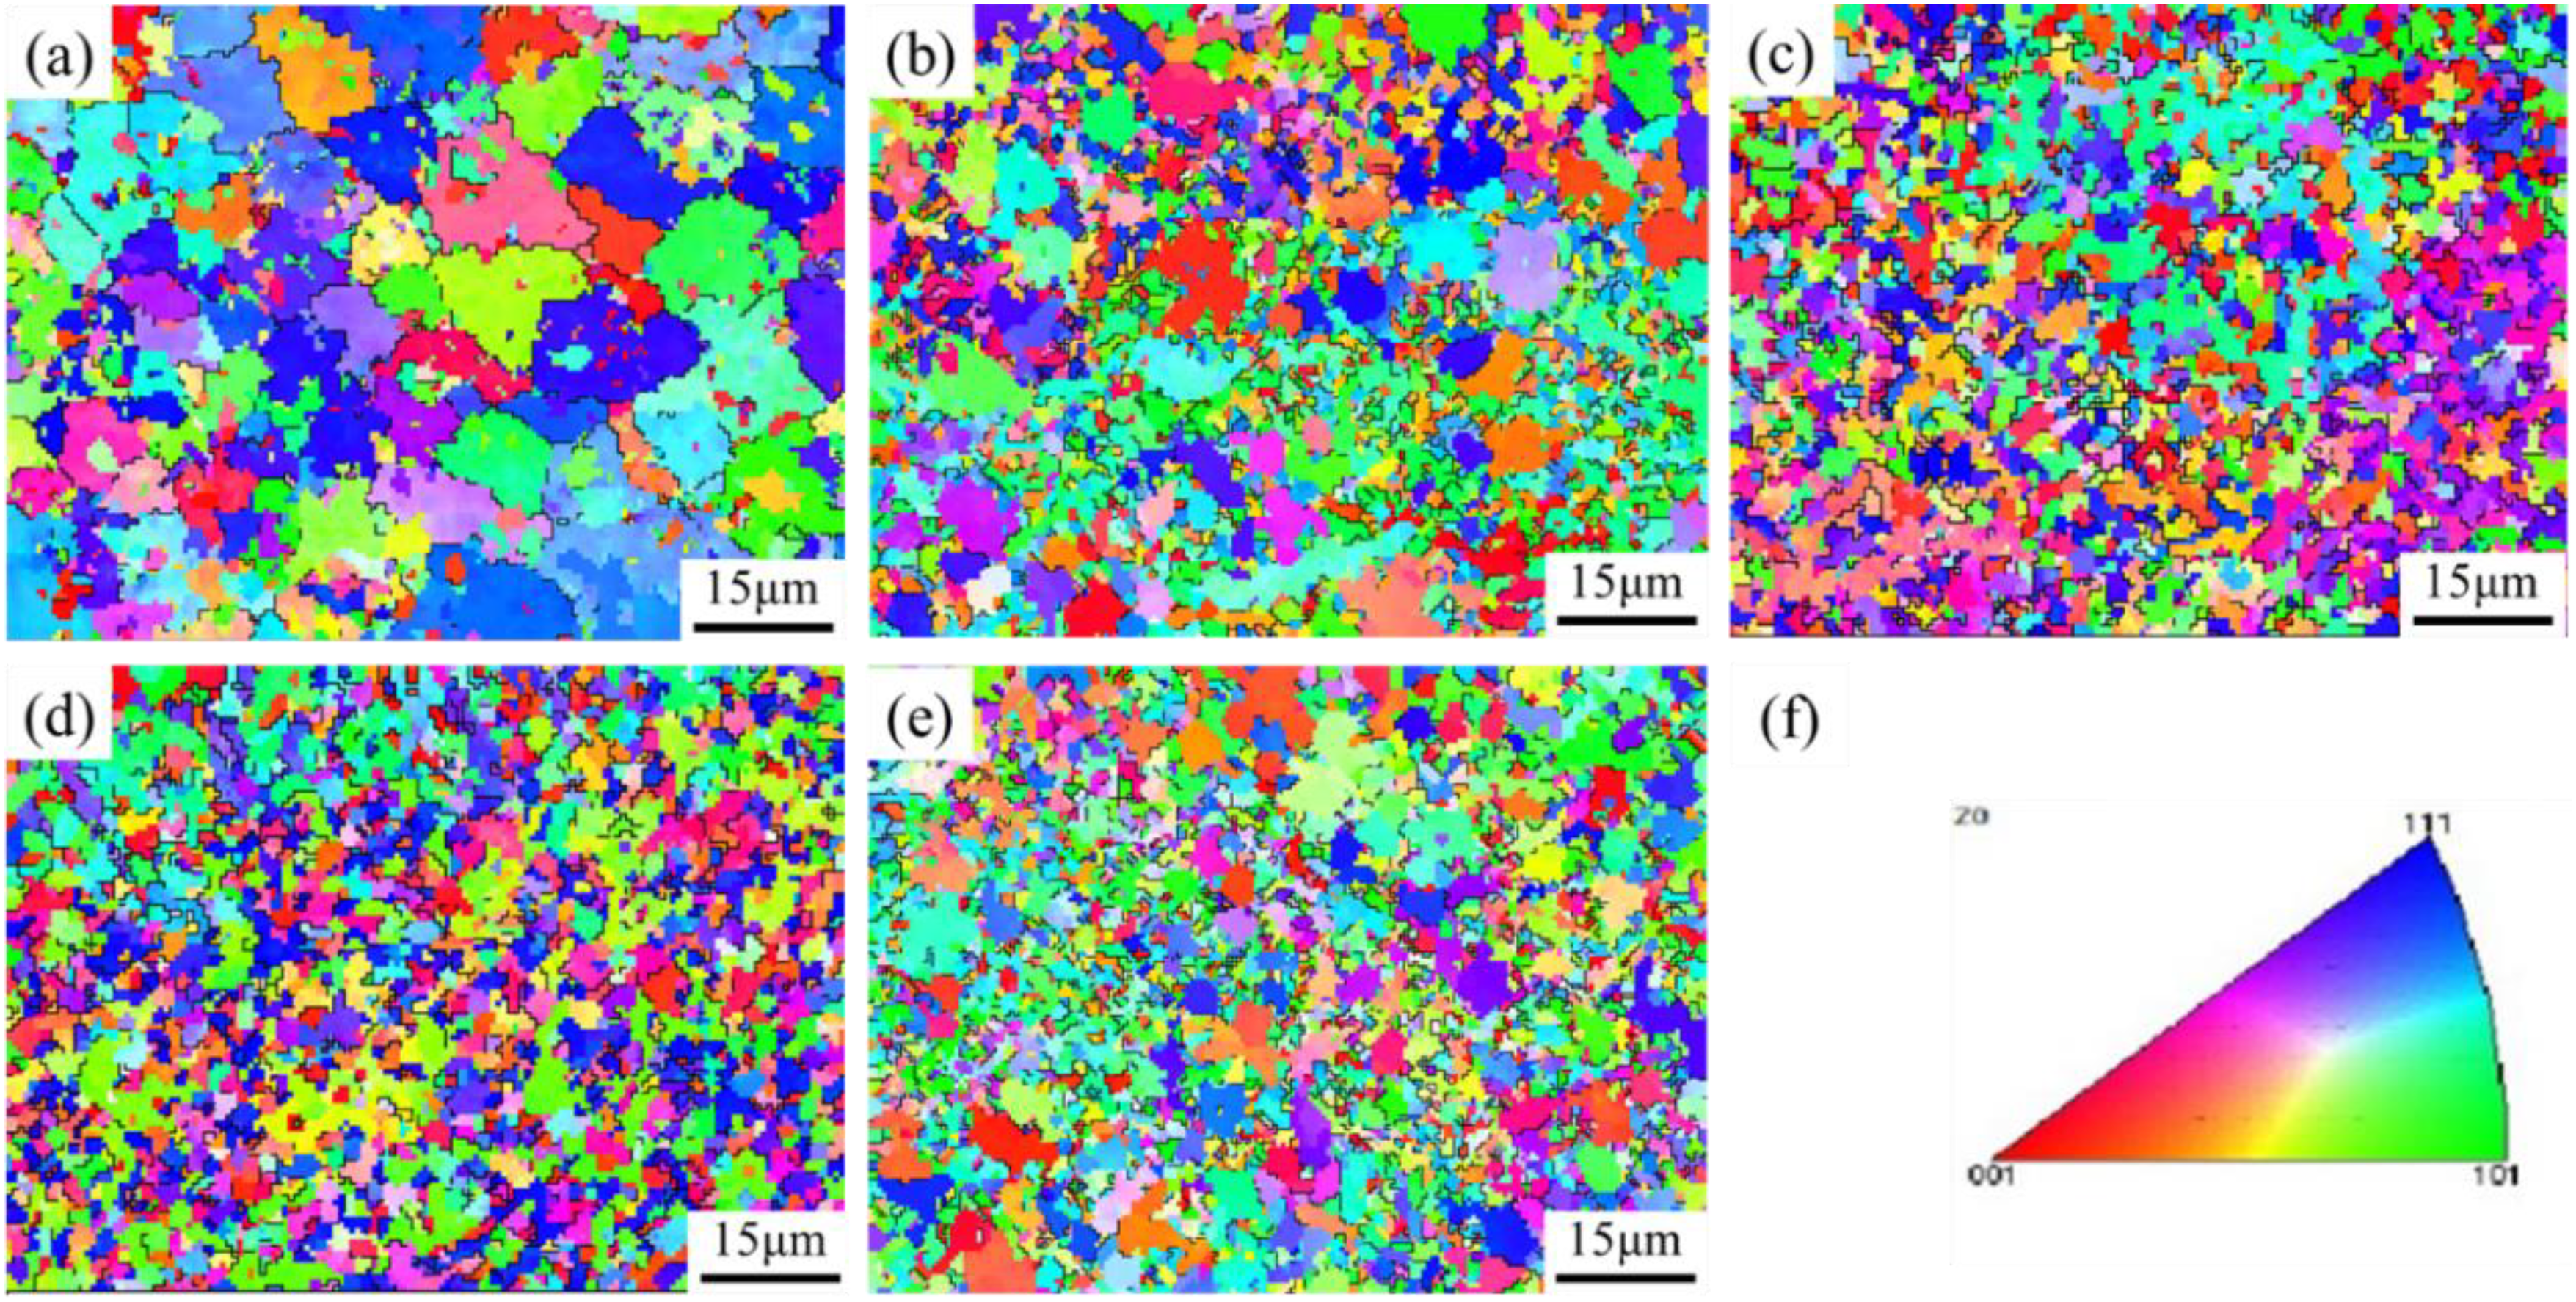
Figure 9 shows the inverse pole figures (IPFs). Texture is the sum of the grain orientations, and its formation is mainly affected by the heat transfer direction and the local temperature gradient, as shown in Fig. 9. According to the Channel 5 software analysis, the maximal texture strengths of S0, S1, S2, S3 and S4 were 2.15, 2.23, 2.49, 2.94 and 2.39, respectively. It showed that the texture strength of the five coatings was similar, and there was no preferred orientation due to the addition of the Nb element. The average grain sizes of S0, S1, S2, S3 and S4 were calculated to be 1.414, 1.172, 0.878, 0.782 and 0.929 μm, respectively, by the Channel 5 software. The average grain size of the coatings decreased with the addition of Nb, and then increased with the addition of Nb to 11 wt-%. The results of the EBSD grain size measurements were consistent with the grain size variation predicted by the FWHM in the analysis of the phase constituents.
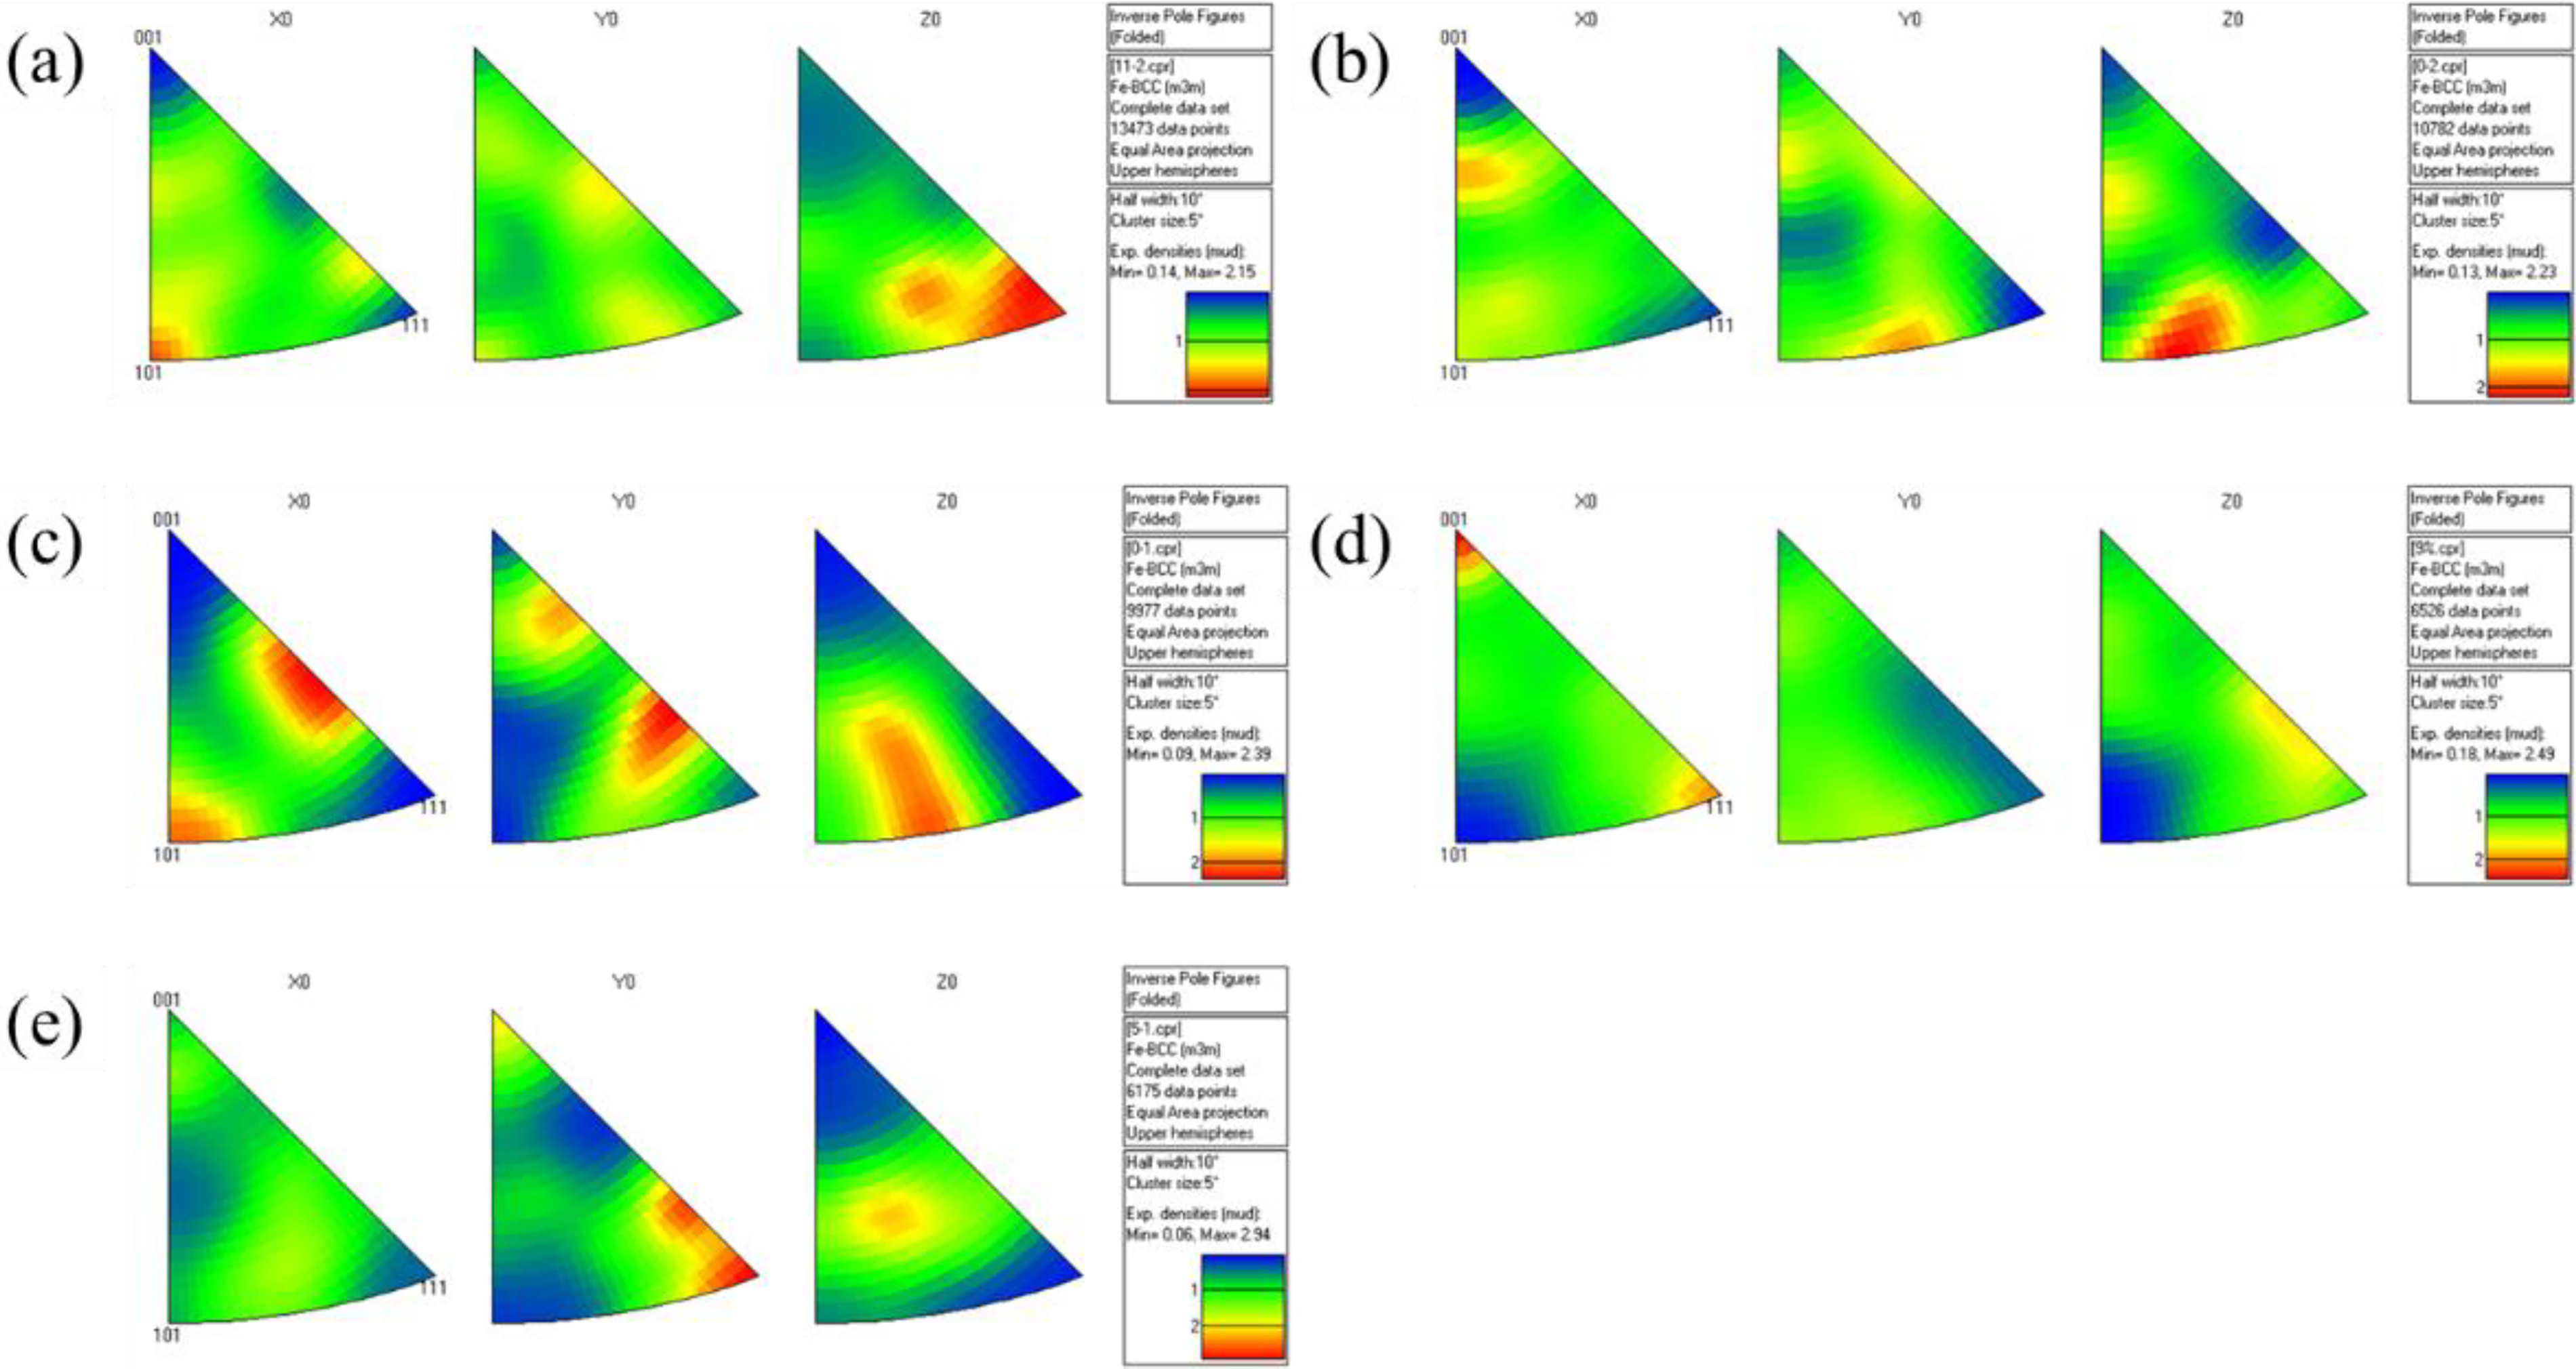
Inverse pole figures of the five coatings: (a) S0, (b) S1, (c) S2, (d) S3 and (e) S4.
Microhardness and wear properties
As the S0 coating displayed obvious cracks, it is not discussed in the subsequent analysis. Figure 10 illustrates the microhardness distribution of the S1, S2, S3 and S4 coatings along the cross-section plane. It can be seen that four microhardness curves showed a trend of decreasing gradually from the top to the substrate. It can be seen from Fig. 10 that the average microhardness values of S1, S2, S3 and S4 were 516 ± 10.5, 563 ± 11.3, 610 ± 12.2 and 552 ± 11.1 HV, respectively. It can be found that the average microhardness increased from 516 ± 10.5 (5 wt-%) to 610 ± 12.2 HV (9 wt-%) and decreased to 552 ± 11.1 HV (11 wt-%) with the increase of the NbC content. Owing to the increase of the NbC content, the microhardness was improved because of the increased size and the volume fraction of the hard NbC particles. The maximal average microhardness of the S3 coating with 9 wt-% Nb was 610 ± 12.2 HV, which is a 290 HV improvement compared to that of the substrate material (approximately 320 ± 8.9 HV). This phenomenon for the variation in the microhardness of the four coatings can be ascribed to the grain size effect discussed in Section 3.1, which can be expressed by the Hall–Petch equation31,32:
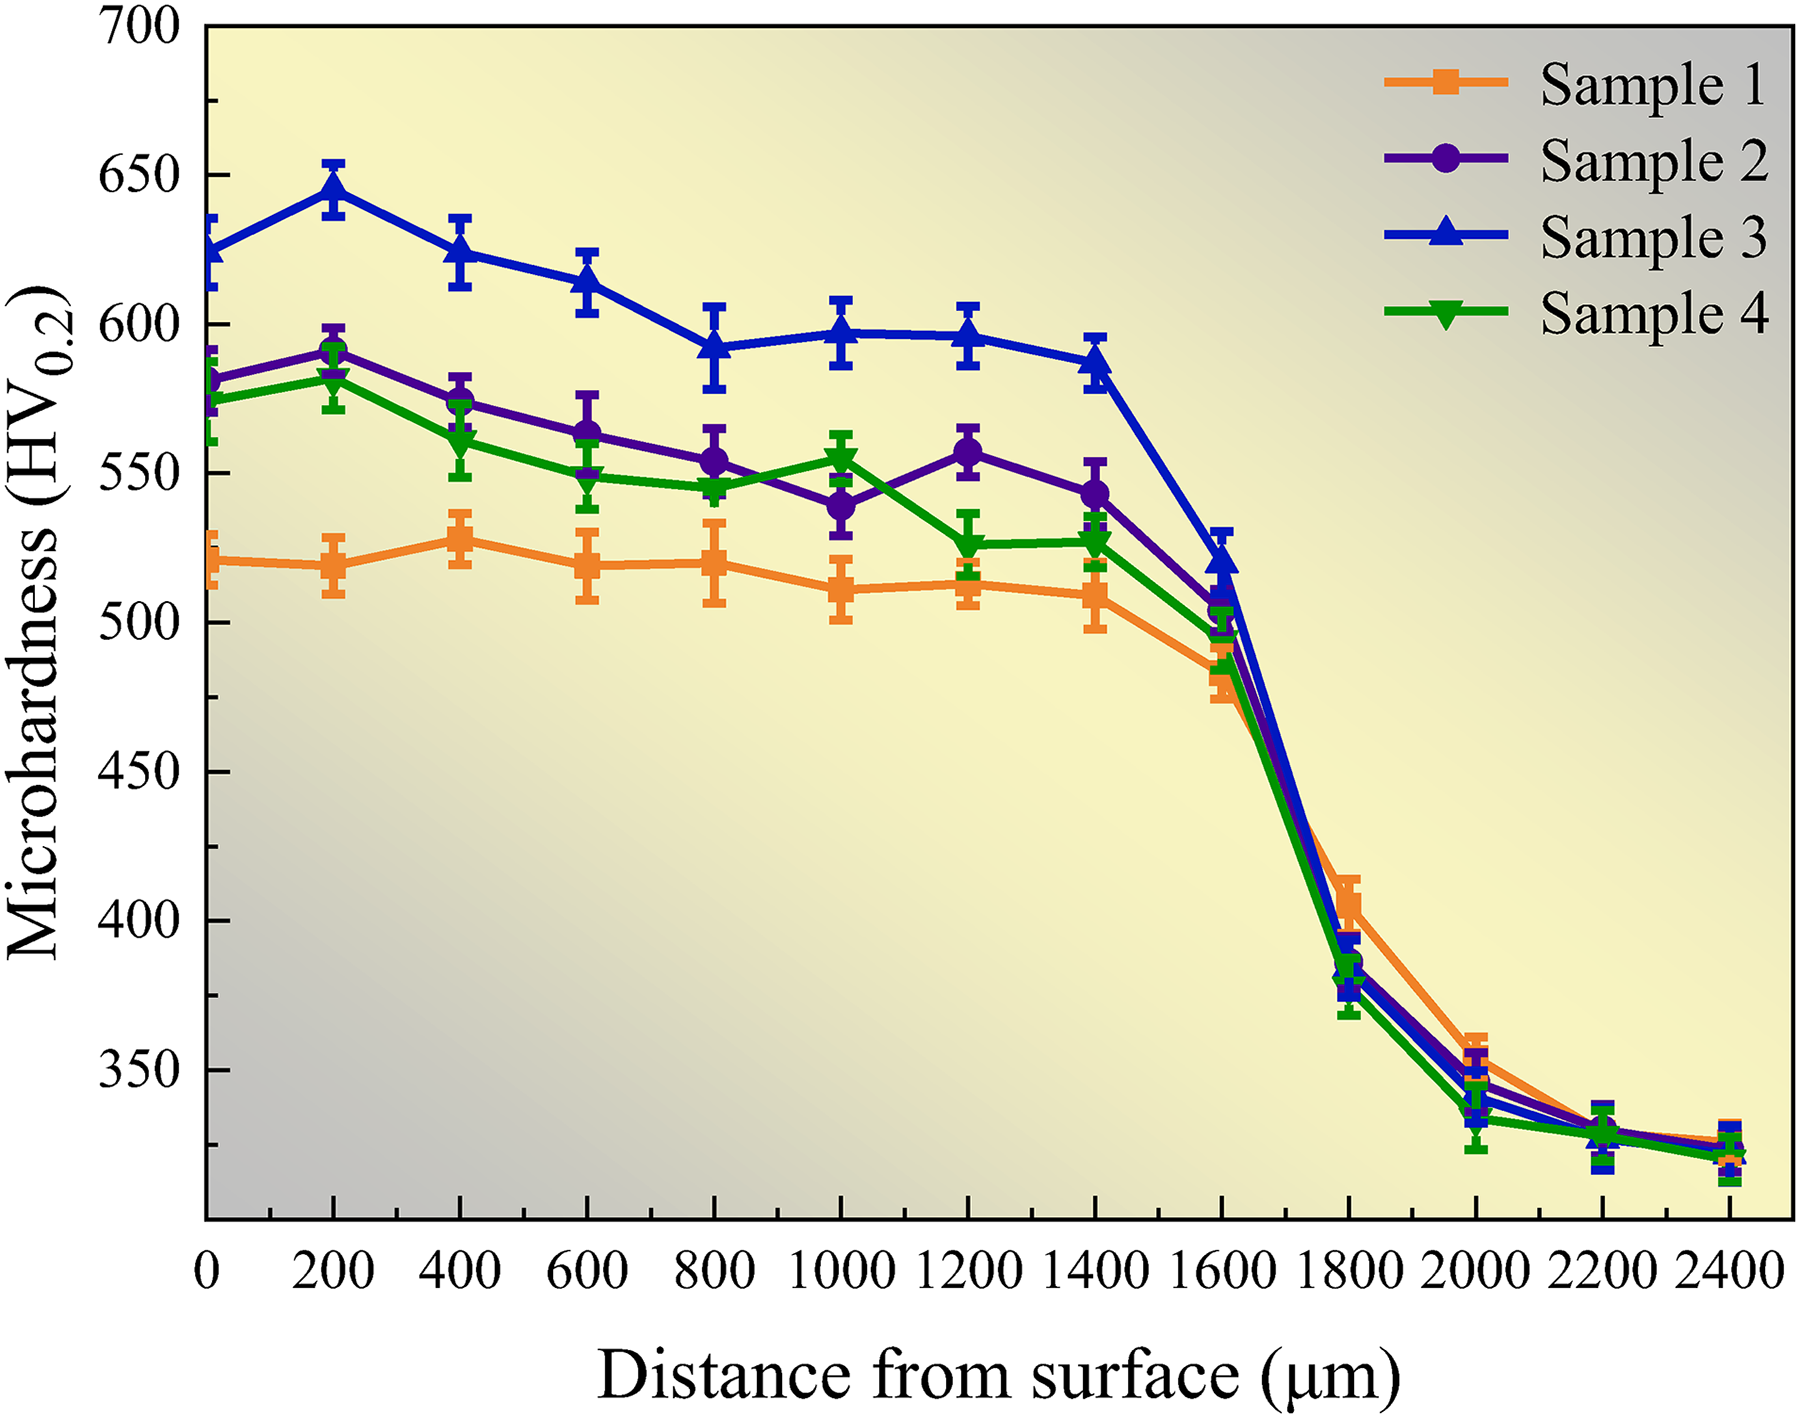
Microhardness distribution of the four coatings along the cross-section plane.
where σs is the polycrystalline yield strength; σ0 is the constant stress of material; and K and d represent the Hall–Petch constant (related to the variety and grain size of the material) and the average grain size of the material, respectively. According to the above formula, it is a positive correlation between microhardness and grain size. 33 It can be known from Section 3.2 that the grain of cladding coating was gradually refined, and the microhardness gradually increased with the increase of the NbC content.
In addition, the solid solution strengthening caused by the dissolution of alloying elements in the matrix and the second phase strengthening caused by the formation of more carbide reinforcing phases play an important role. The solid solution strengthening effect of solute atoms can be calculated according to the classical Fleischer theory.
34

Figure 11 shows the friction coefficient curves of the 0Cr13Ni5Mo material and the four coatings with different Nb contents. As can be found from Fig. 11, the friction coefficient shows a rapid increase in the initial stage, known as the running-in period, and then enters into the fluctuated time. The average friction coefficients of 0Cr13Ni5Mo, S1, S2, S3 and S4 obtained by the analysis software of the wear testing machine were 0.742, 0.624, 0.562, 0.515 and 0.585, respectively. Notably, S3 exhibited the minimum value among the samples. The low average coefficient of friction indicated a better wear performance. 36
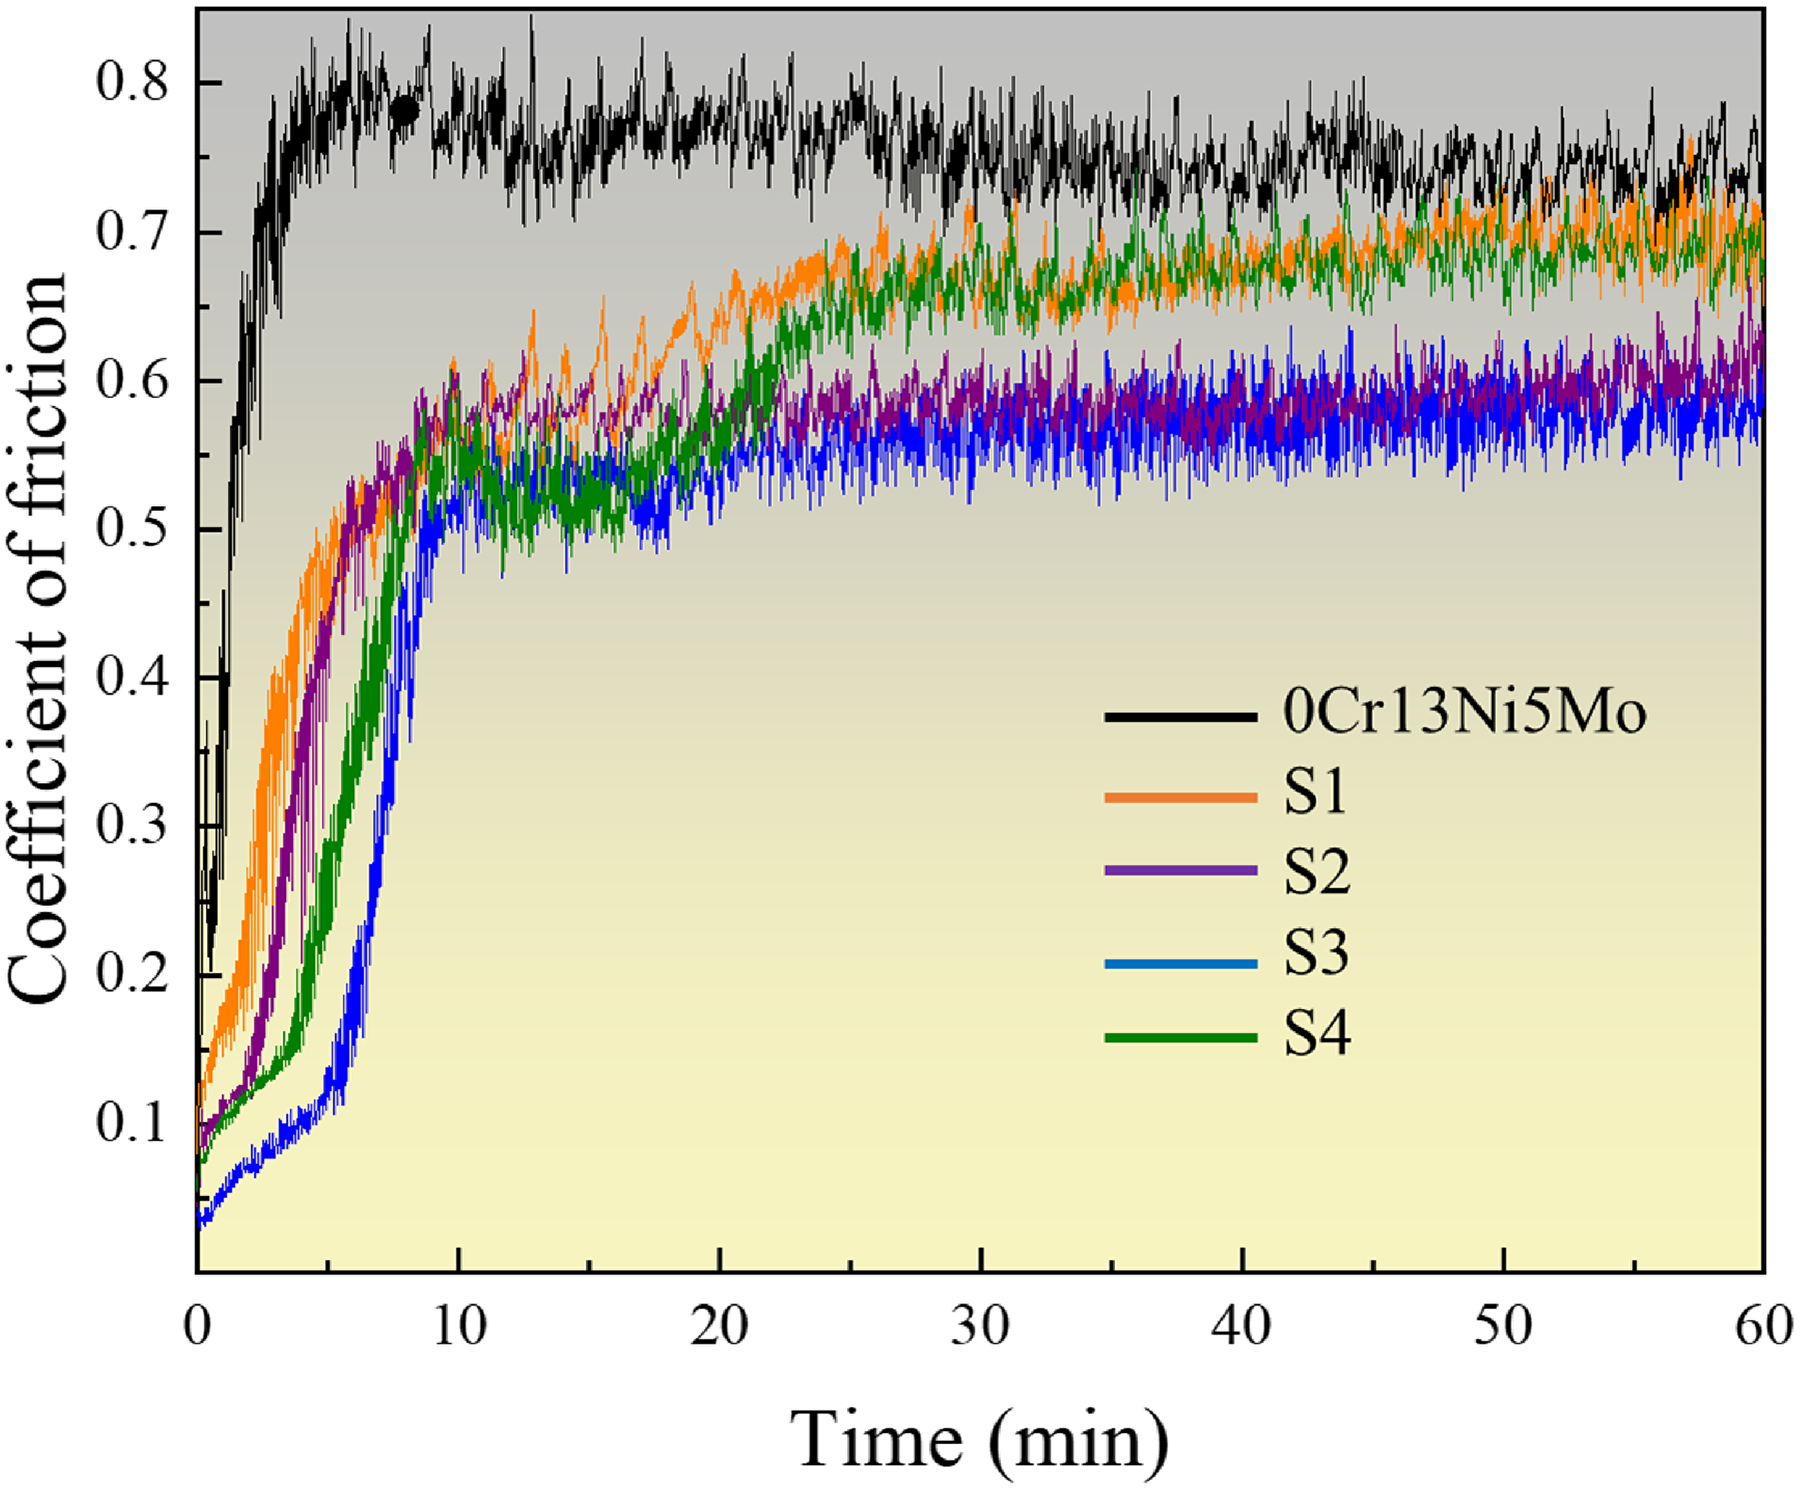
Friction coefficient curves of the 0Cr13Ni5Mo substrate and the four coatings.
The 0Cr13Ni5Mo substrate and the S3 composite coating were chosen as a contrast group using a white light interferometer. Figure 12 shows the 3D profiles and the two-dimensional (2D) curves of the wear tracks for 0Cr13Ni5Mo subtract and S3 composite coating. The wear volumes of 0Cr13Ni5Mo and S3 were 3.921 × 10⁶ and 1.316 × 106 μm3, respectively. The corresponding specific wear rate was adopted to determine the wear resistance, which can be calculated as follows
7
:
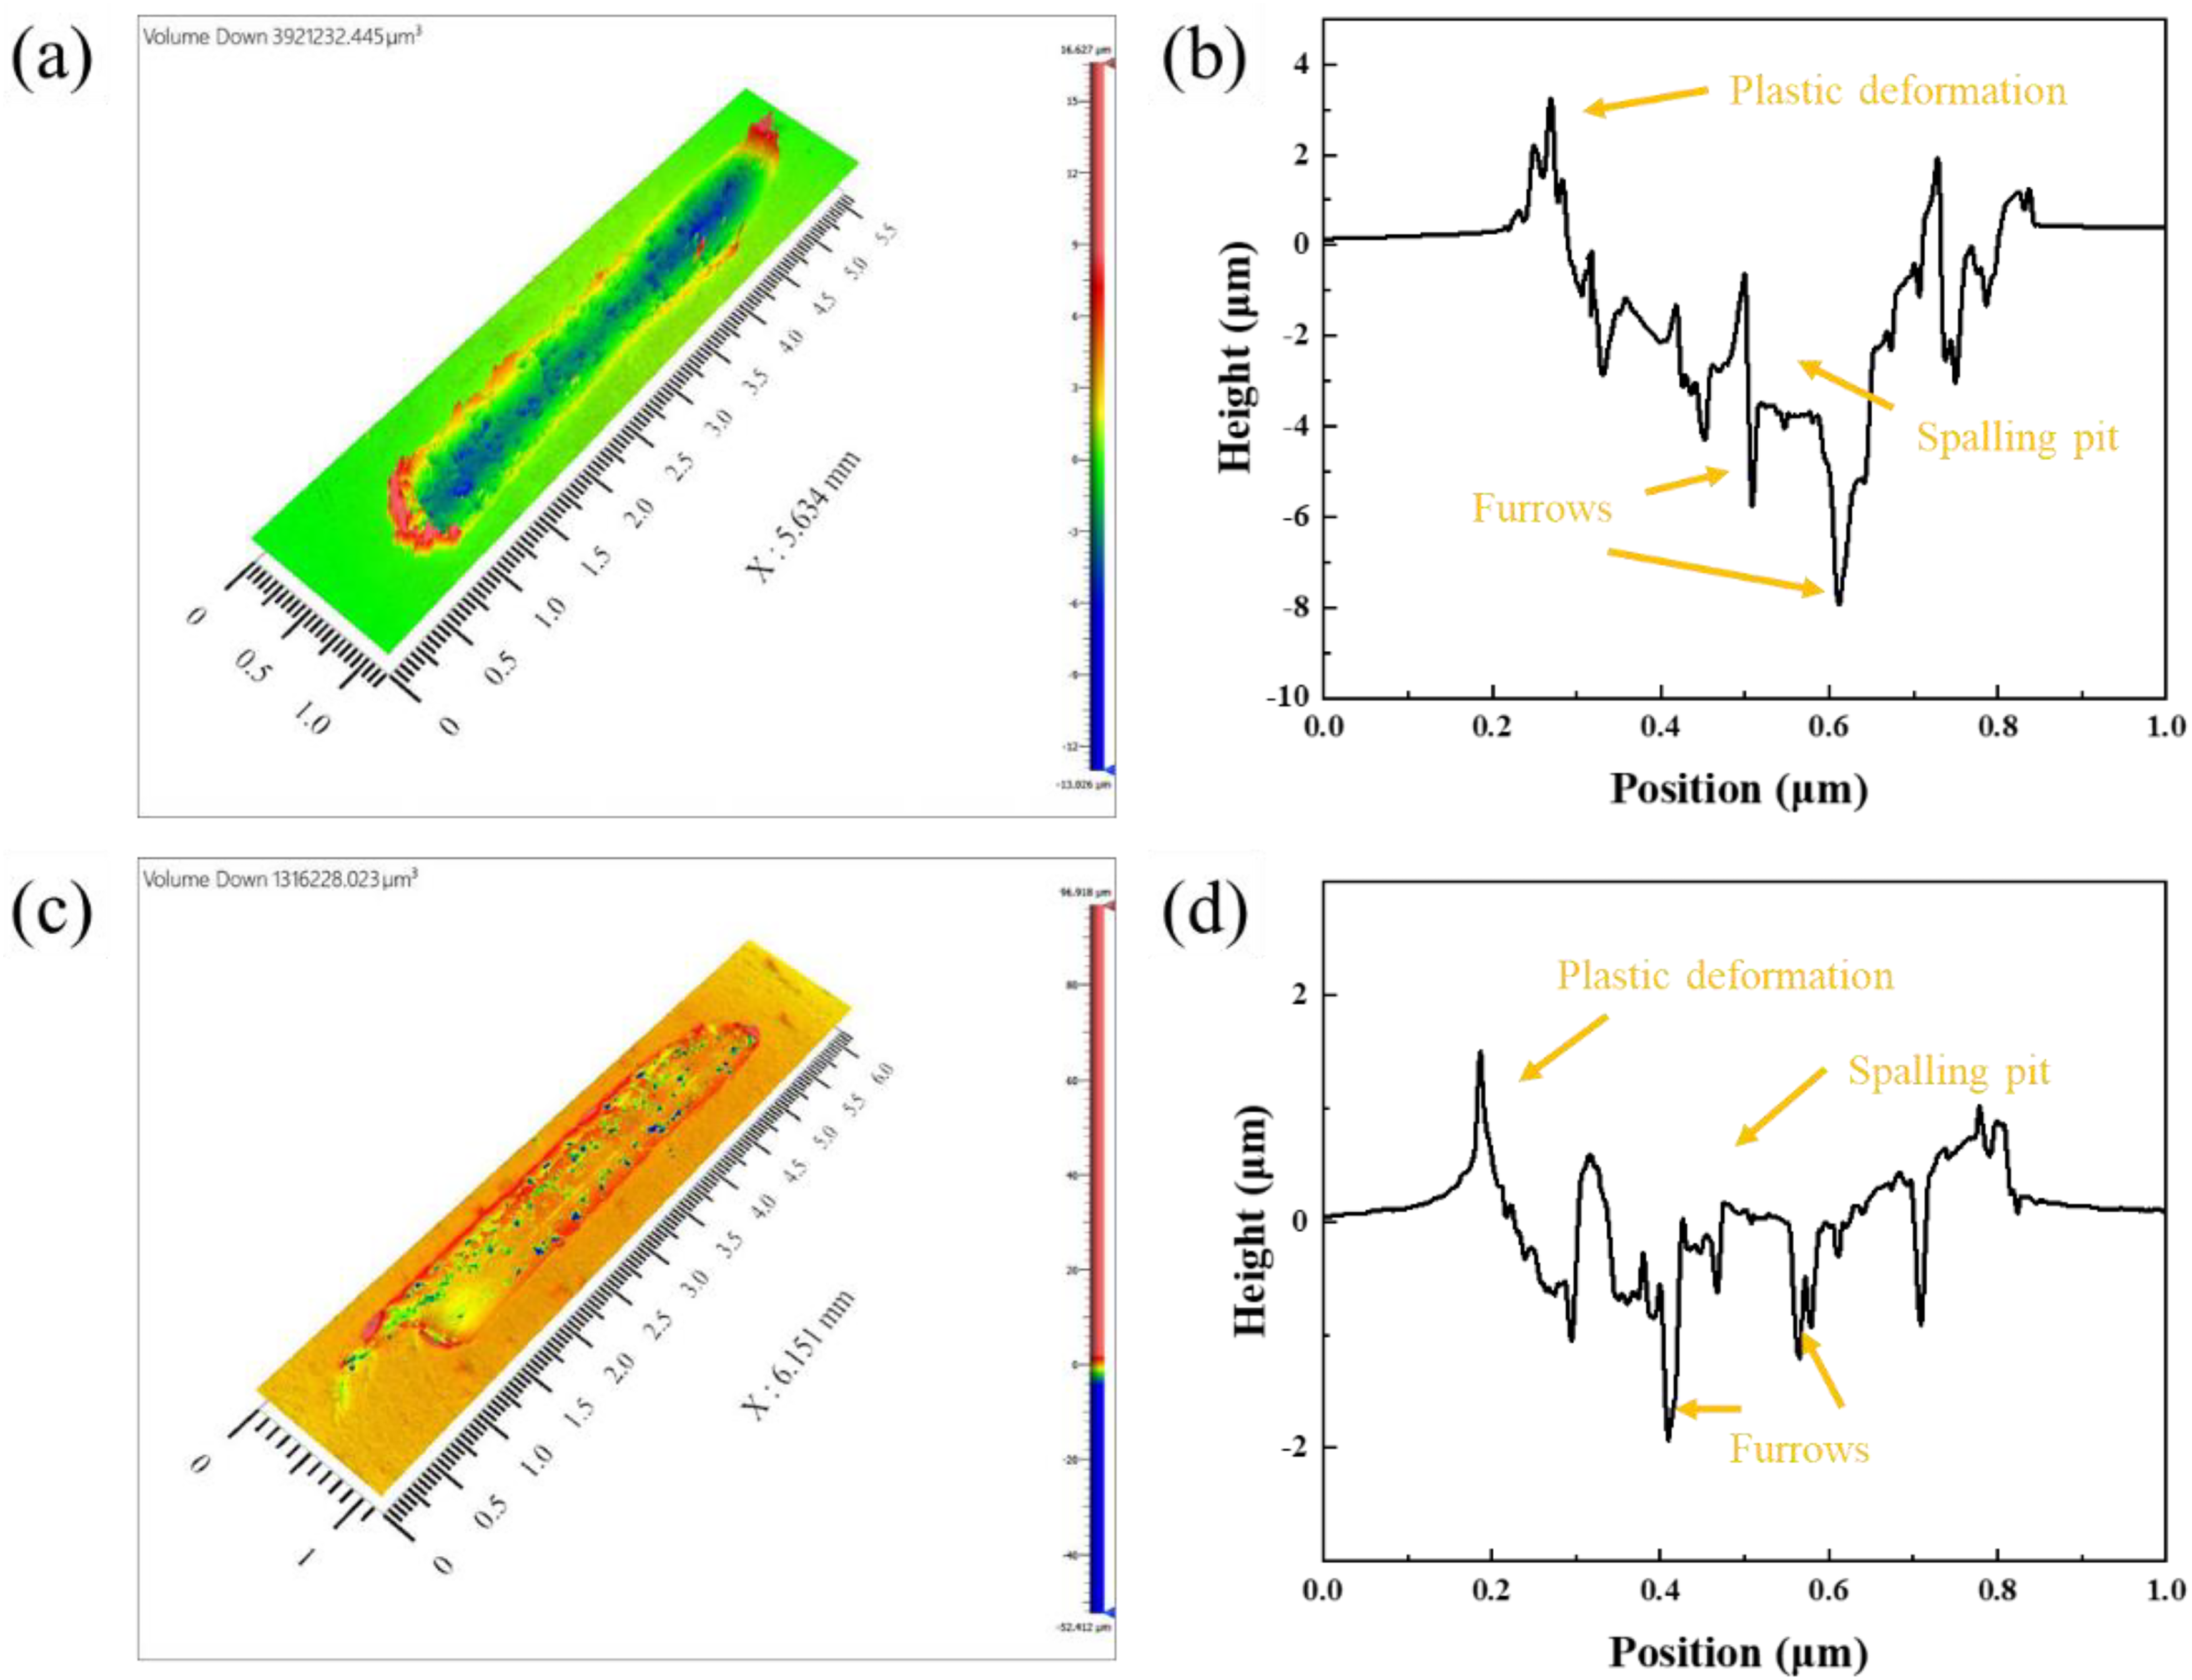
Three-dimensional wear track morphology of (a) 0Cr13Ni5Mo and (c) S3 and two-dimensional curves of (b) 0Cr13Ni5Mo and (d) S3.
where V, F and L are the wear volume in μm3, normal load in N and total sliding distance in mm, respectively. The specific wear rates of 0Cr13Ni5Mo and S3 were 3.631 × 10⁻⁵ and 1.219 × 10⁻⁵ mm3/N·m, respectively. According to equation (5), the lower specific wear rate represents a higher wear resistance. It is obvious that the 0Cr13Ni5Mo substrate shows a higher wear volume and a higher specific wear rate. The higher wear resistance in the coating S3 can be attributed to the ceramic-reinforcing phase NbC particles significantly improving the microhardness of the coating matrix and protecting it from wear. The Archard law shows a proportional relationship between the wear resistance and the microhardness of a material, which can be expressed as follows 37 :

where V represents the wear volume in μm3; L is the sliding distance in mm; KCOF, F and H are the coefficient of friction, normal load and microhardness of the material, respectively. The result is in agreement with the average coefficient of friction and microhardness. Figure 12(b) and (d) shows the 2D wear curves of the 0Cr13Ni5Mo substrate and the S3 coating. The 2D curve of 0Cr13Ni5Mo exhibits larger fluctuations compared with that of S3, corresponding to the large plastic deformation, deeper furrows and more spalling pits.
Figure 13 illustrates the wear surface morphology of the substrate and the four coatings observed by SEM with EDS to determine the wear mechanism, where Fig. 13(a2)–(e2) are the enlarged images of Fig. 13(a1)–(e1), respectively. Figure 13(a1)–(e1) shows deeper furrows on the wear surfaces of 0Cr13Ni5Mo and more serious plastic deformation and micro-cracks compared to other samples. In addition, the surface of 0Cr13Ni5Mo exhibits more peeling pits and deeper furrows compared with the S1, S2, S3 and S4 coatings. Therefore, the wear mechanism of 0Cr13Ni5Mo is an adhesive–abrasive composite wear dominated by adhesive wear. As for the S1, S2, S3 and S4 coatings, it can be concluded that the wear mechanism is adhesive–abrasive composite wear dominated by abrasive wear because of the shallower furrows and less peeling pits on the wear surfaces. Meanwhile, the EDS analysis from Fig. 13(a2)–(e2) investigated the O content in the wear surface of all samples. Both substrate and coatings showed oxidative wear. The local high stress on the wear surface caused by the reciprocating behaviour of the dry wear experiment gives rise to the local plastic deformation of the material. When the stress exceeds the limit of the local fracture strength of the material, large pieces of wear debris will peel off. Moreover, the wear debris is crushed into hard particles under the repeated movement of the friction pair, and the hard particles act as abrasive particles to aggravate the abrasive wear, which cause deeper furrows and more peeling pitting on the wear surface in the subsequent wear process. This process will further cause the increase of the surface roughness, explaining the phenomenon of the slightly increasing friction coefficient curve in the fluctuating period of all wear samples. It is worth noting from Fig. 13(b2)–(e2) that these wear features are beginning to fade out with the addition of Nb in the coating, which shows a better wear resistance under the action of NbC-reinforced particles. This phenomenon can be attributed to the refiner grain strengthening and the stronger solid solution strengthening with the increase of the NbC content in the S1, S2, S3 and S4. The S3 exhibited shallow furrows and less material removal, indicating the best wear resistance. Based on the microstructure analysis in Section 3.1, it can be seen that S3 had the anchoring effect of large-sized papilionaceous and petaloid carbide and dispersion strengthening of quadrangle carbide precipitated uniformly in the matrix phase, resulting in better wear resistance. As for S4, the excess NbC caused the carbide agglomeration to reduce the wear resistance due to decrease of C in the matrix.

SEM images of the wear surface for the substrate and the four composite coatings: (a1) 0Cr13Ni5Mo and (b1) S1, (c1) S2, (d1) S3 and (e1) S4 and (a2)–(e2) enlarged images.
Electrochemical corrosion behaviour
Figure 14 illustrates the OCP curves of 0Cr13Ni5Mo, S1, S2, S3 and S4 in a 3.5 wt-% NaCl solution. It is evident from the figure that the open-circuit potential tends to stabilise with increasing time. It is well known that stable open-circuit points contribute to achieving more reliable and consistent results. Figure 15 depicts the potentiodynamic polarisation curves of 0Cr13Ni5Mo, S1, S2, S3 and S4 in a 3.5 wt-% NaCl solution. It is evident from the figure that the potentiodynamic polarisation curves of S1, S2, S3 and S4 gradually shifted towards the left upper quadrant with an increase in the Nb content in the coating. Notably, the S3 and S4 samples exhibited distinct anodic passivation zones. This phenomenon can be attributed to the increased release of Cr into the substrate with a higher Nb content, thereby enhancing the coating's ability to spontaneously form a passivation film. However, the passivation zones of S1 and S2 were less prominent. This can be attributed to the rupture of the passivation film during the corrosion process, resulting in a pitting corrosion on the material's surface in direct contact with the 3.5% NaCl solution. The higher corrosion potential (Ecorr) and the lower corrosion current density (Icorr) indicated better corrosion resistance for the materials; hence, the moving tendency of the polarisation curve exhibited a gradually increasing corrosion resistance. Moreover, the S3 and S4 exhibited a typical anodic polarisation characteristic, including active dissolution region, passive region and over-passive region, where the Icorr increases rapidly due to the rupture of the passive film. The electrochemical parameters of the potentiodynamic polarisation curves are listed in Table 4. It is noticed that the Ecorr of the 0Cr13Ni5Mo substrate and the four coatings were −295.8, −236.7, −201.4, −179.3 and −133.4 mV, respectively. The corrosion potential of S4 was a higher value than that of 0Cr13Ni5Mo, indicating a gradually decreasing corrosion tendency from the thermodynamic analysis based on Ecorr. The corrosion current densities of the 0Cr13Ni5Mo substrate and the four coatings were 4.768 × 10⁻⁷, 4.176 × 10⁻⁷, 2.396 × 10⁻⁷, 9.258 × 10⁻⁸ and 1.356 × 10⁻⁷ A/cm2, respectively. Based on the kinetic analysis determined by Icorr, S3 showed the best corrosion resistance. For this phenomenon, the main reason analyzed in Section 3.1 and Fig. 6 is that more Cr elements were dissolved in the matrix phase because of the addition of Nb, which decreased the formation of chromium-depleted regions and facilitated the formation of the passive film to enhance the corrosion resistance of the coating. In addition, the high grain boundary density also improved the corrosion resistance for the passive materials. 38 Furthermore, an excess of NbC can induce microcurrent corrosion, leading to a reduction in the corrosion resistance of the S4 samples.
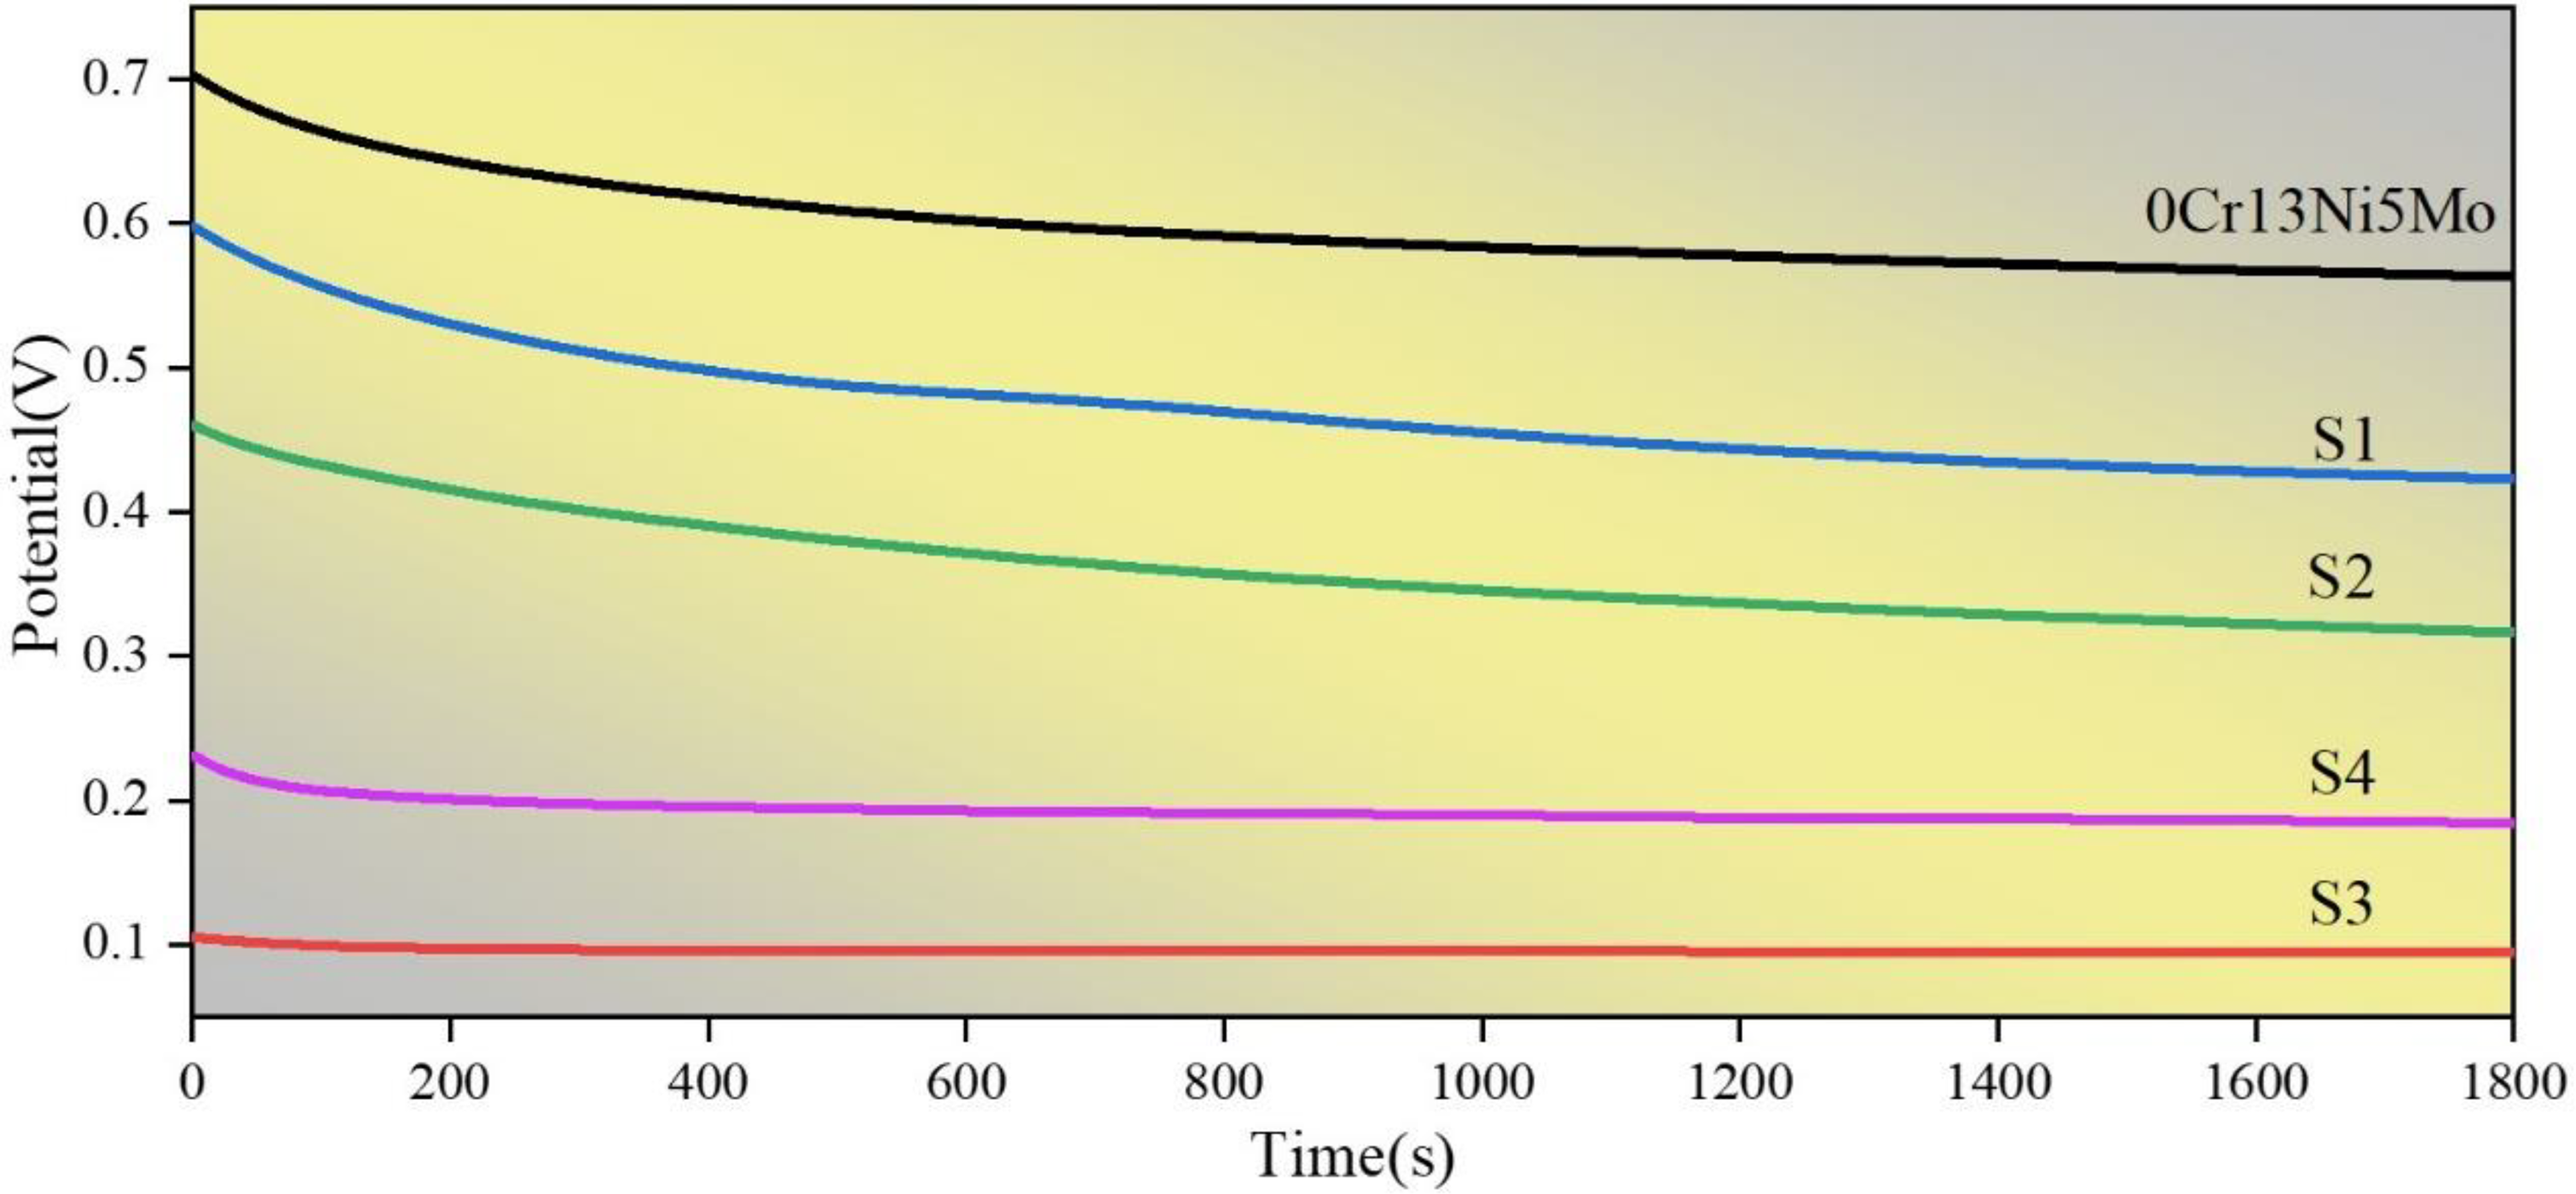
OCP curves of the substrate and the four composite coatings.
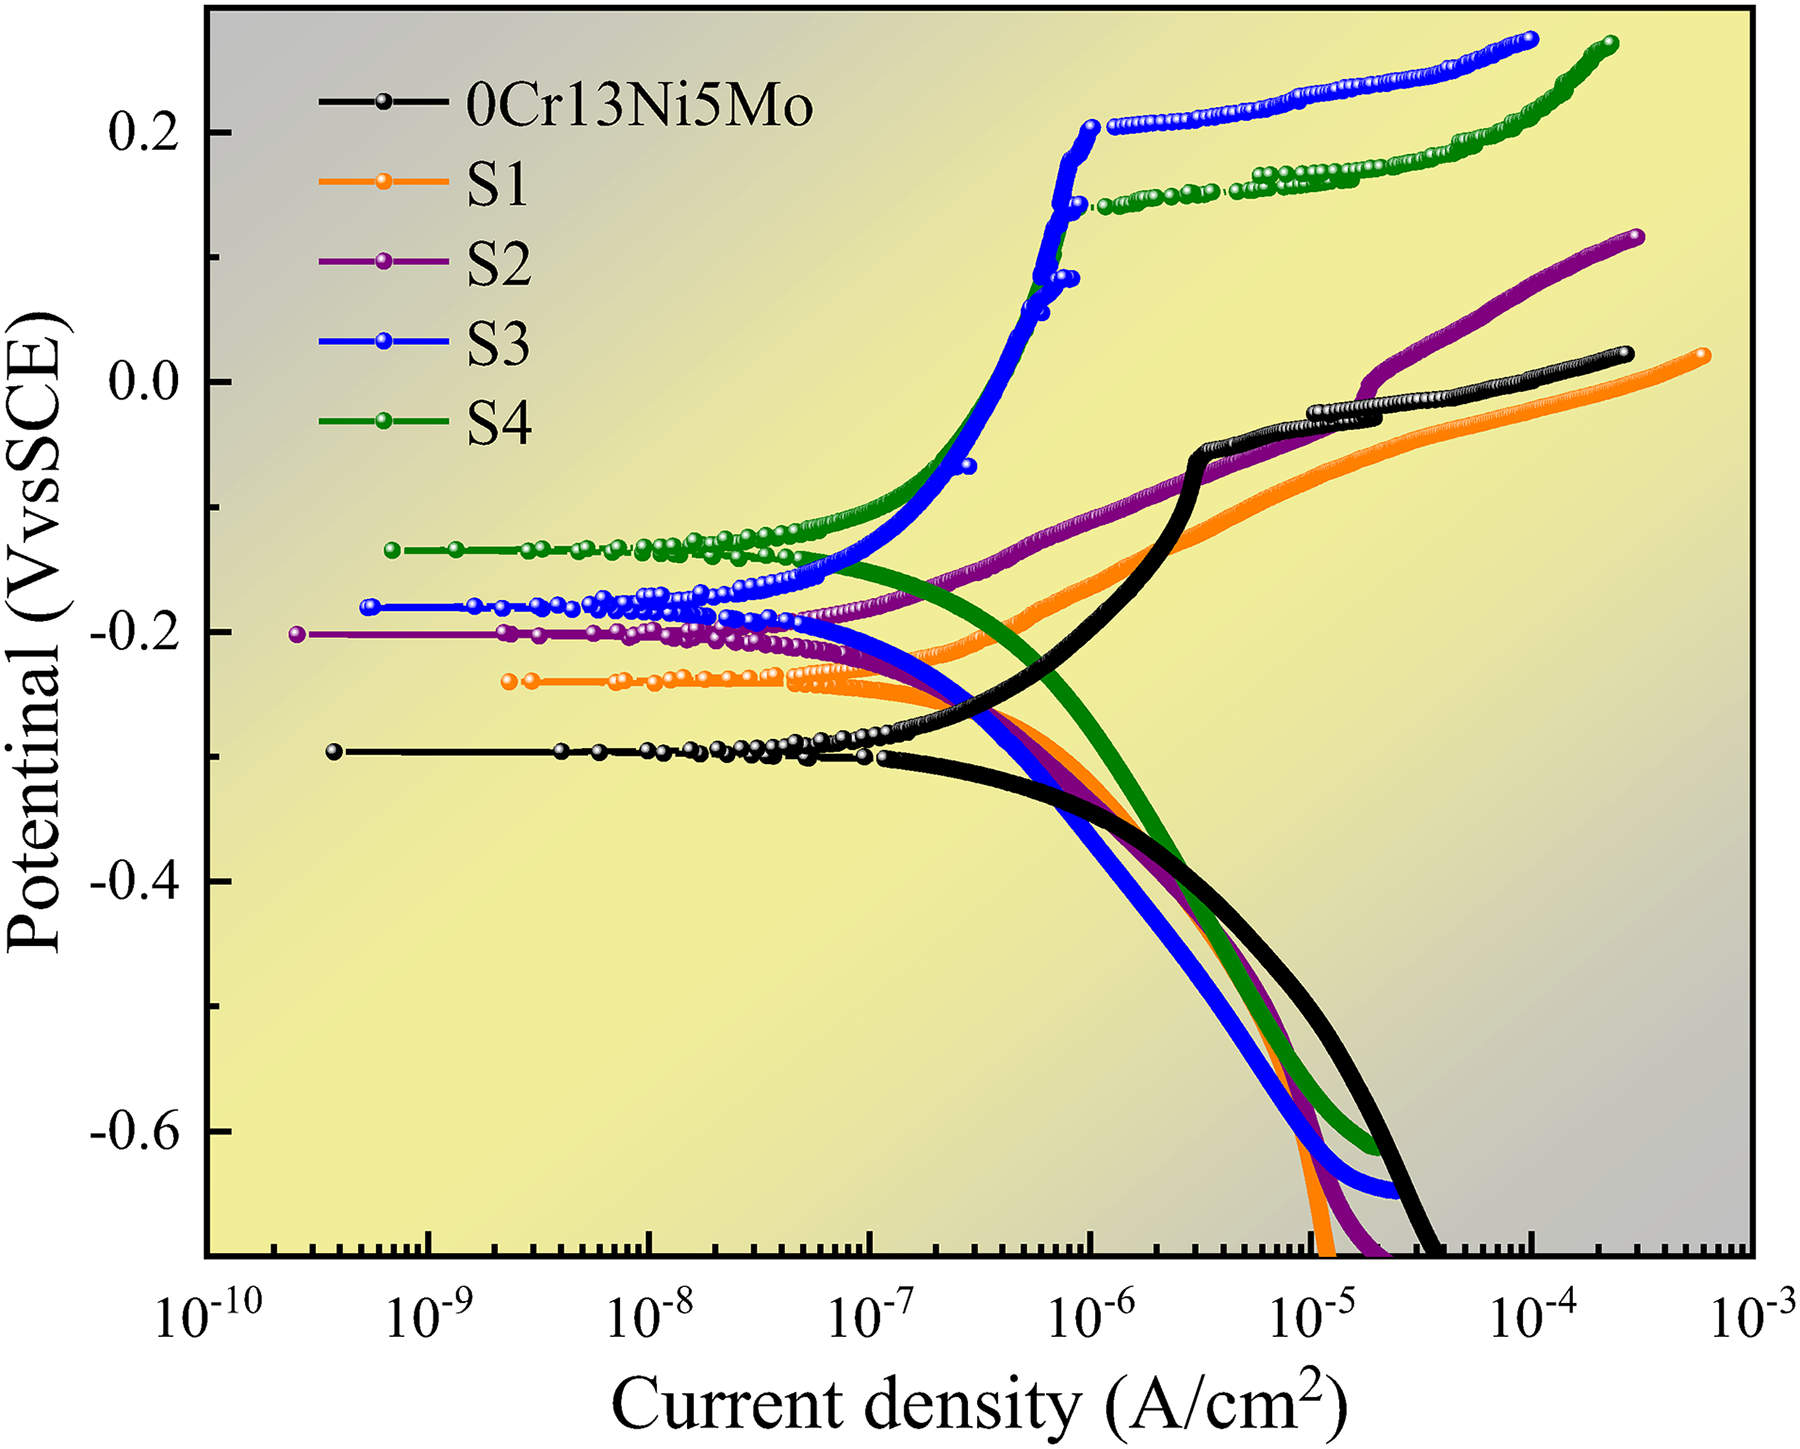
Potentiodynamic polarisation curves of the substrate and the four composite coatings.
Electrochemical parameters of the potentiodynamic polarisation curves extracted by Tafel fitting.

Figure 16 shows the Nyquist and Bode plots of the substrate material and the four coatings in 3.5 wt-% NaCl solution. Figure 16(a) presents the electrical equivalent circuit R(Q(R(QR))) used to simulate the measured impedance data. The result is listed in Table 5, where Rs, Rf and Rt are the solution resistance, passive film resistance and charge transfer resistance in the circuit, respectively. Rs in the 0Cr13Ni5Mo substrate and four coatings were similar with the adjacent values of 11.69, 10.97, 11.09, 10.78 and 10.51 Ω cm2, indicating a stable test medium. The important indicator of the charge transfer speed in the electrolyte solutions of Rt, in which a higher value of Rt indicates that it is more difficult to transfer the charge, is a better corrosion resistance. It is noticed from Table 5 that the Rt values gradually increased, and S3 exhibited the highest Rt value of approximately 3.915 × 10⁵ Ω cm2, indicating the lowest corrosion rate. The simulated reliability was evaluated by the Chi-squared test, and the Chi-squared values of the five samples were in the reliable range of 10−3–10−4, showing a reliable experimental result. Figure 16(b) shows the Nyquist plot of the 0Cr13Ni5Mo substrate and the four coatings, which reveals one unfinished capacitive semicircle indicating the similar corrosion mechanisms of the substrate and the four coating materials. The corrosion performance can be evaluated by the radius of the capacitive loop in the Nyquist plot. The corrosion performance can be assessed by examining the radius of the capacitance circuit in the Nyquist diagram. Typically, a larger diameter of the semicircle indicated a better corrosion resistance of the material. With the increase of the Nb element in the sample, the diameter of the capacitive half arc gradually increased. Notably, the S3 sample exhibited the largest arc diameter, followed by a decrease observed in the S4 sample. The radius of the capacitive semicircle arc gradually increased from S1 to S3, and then decreased in S4. Its variation in the Nyquist plot indicated that the corrosion resistance was improved with the addition of Nb, and then decreased, and the corrosion resistance of S1, S2, S3 and S4 was higher than that of the 0Cr13Ni5Mo substrate. S3 showed its highest electrochemical reaction resistance.
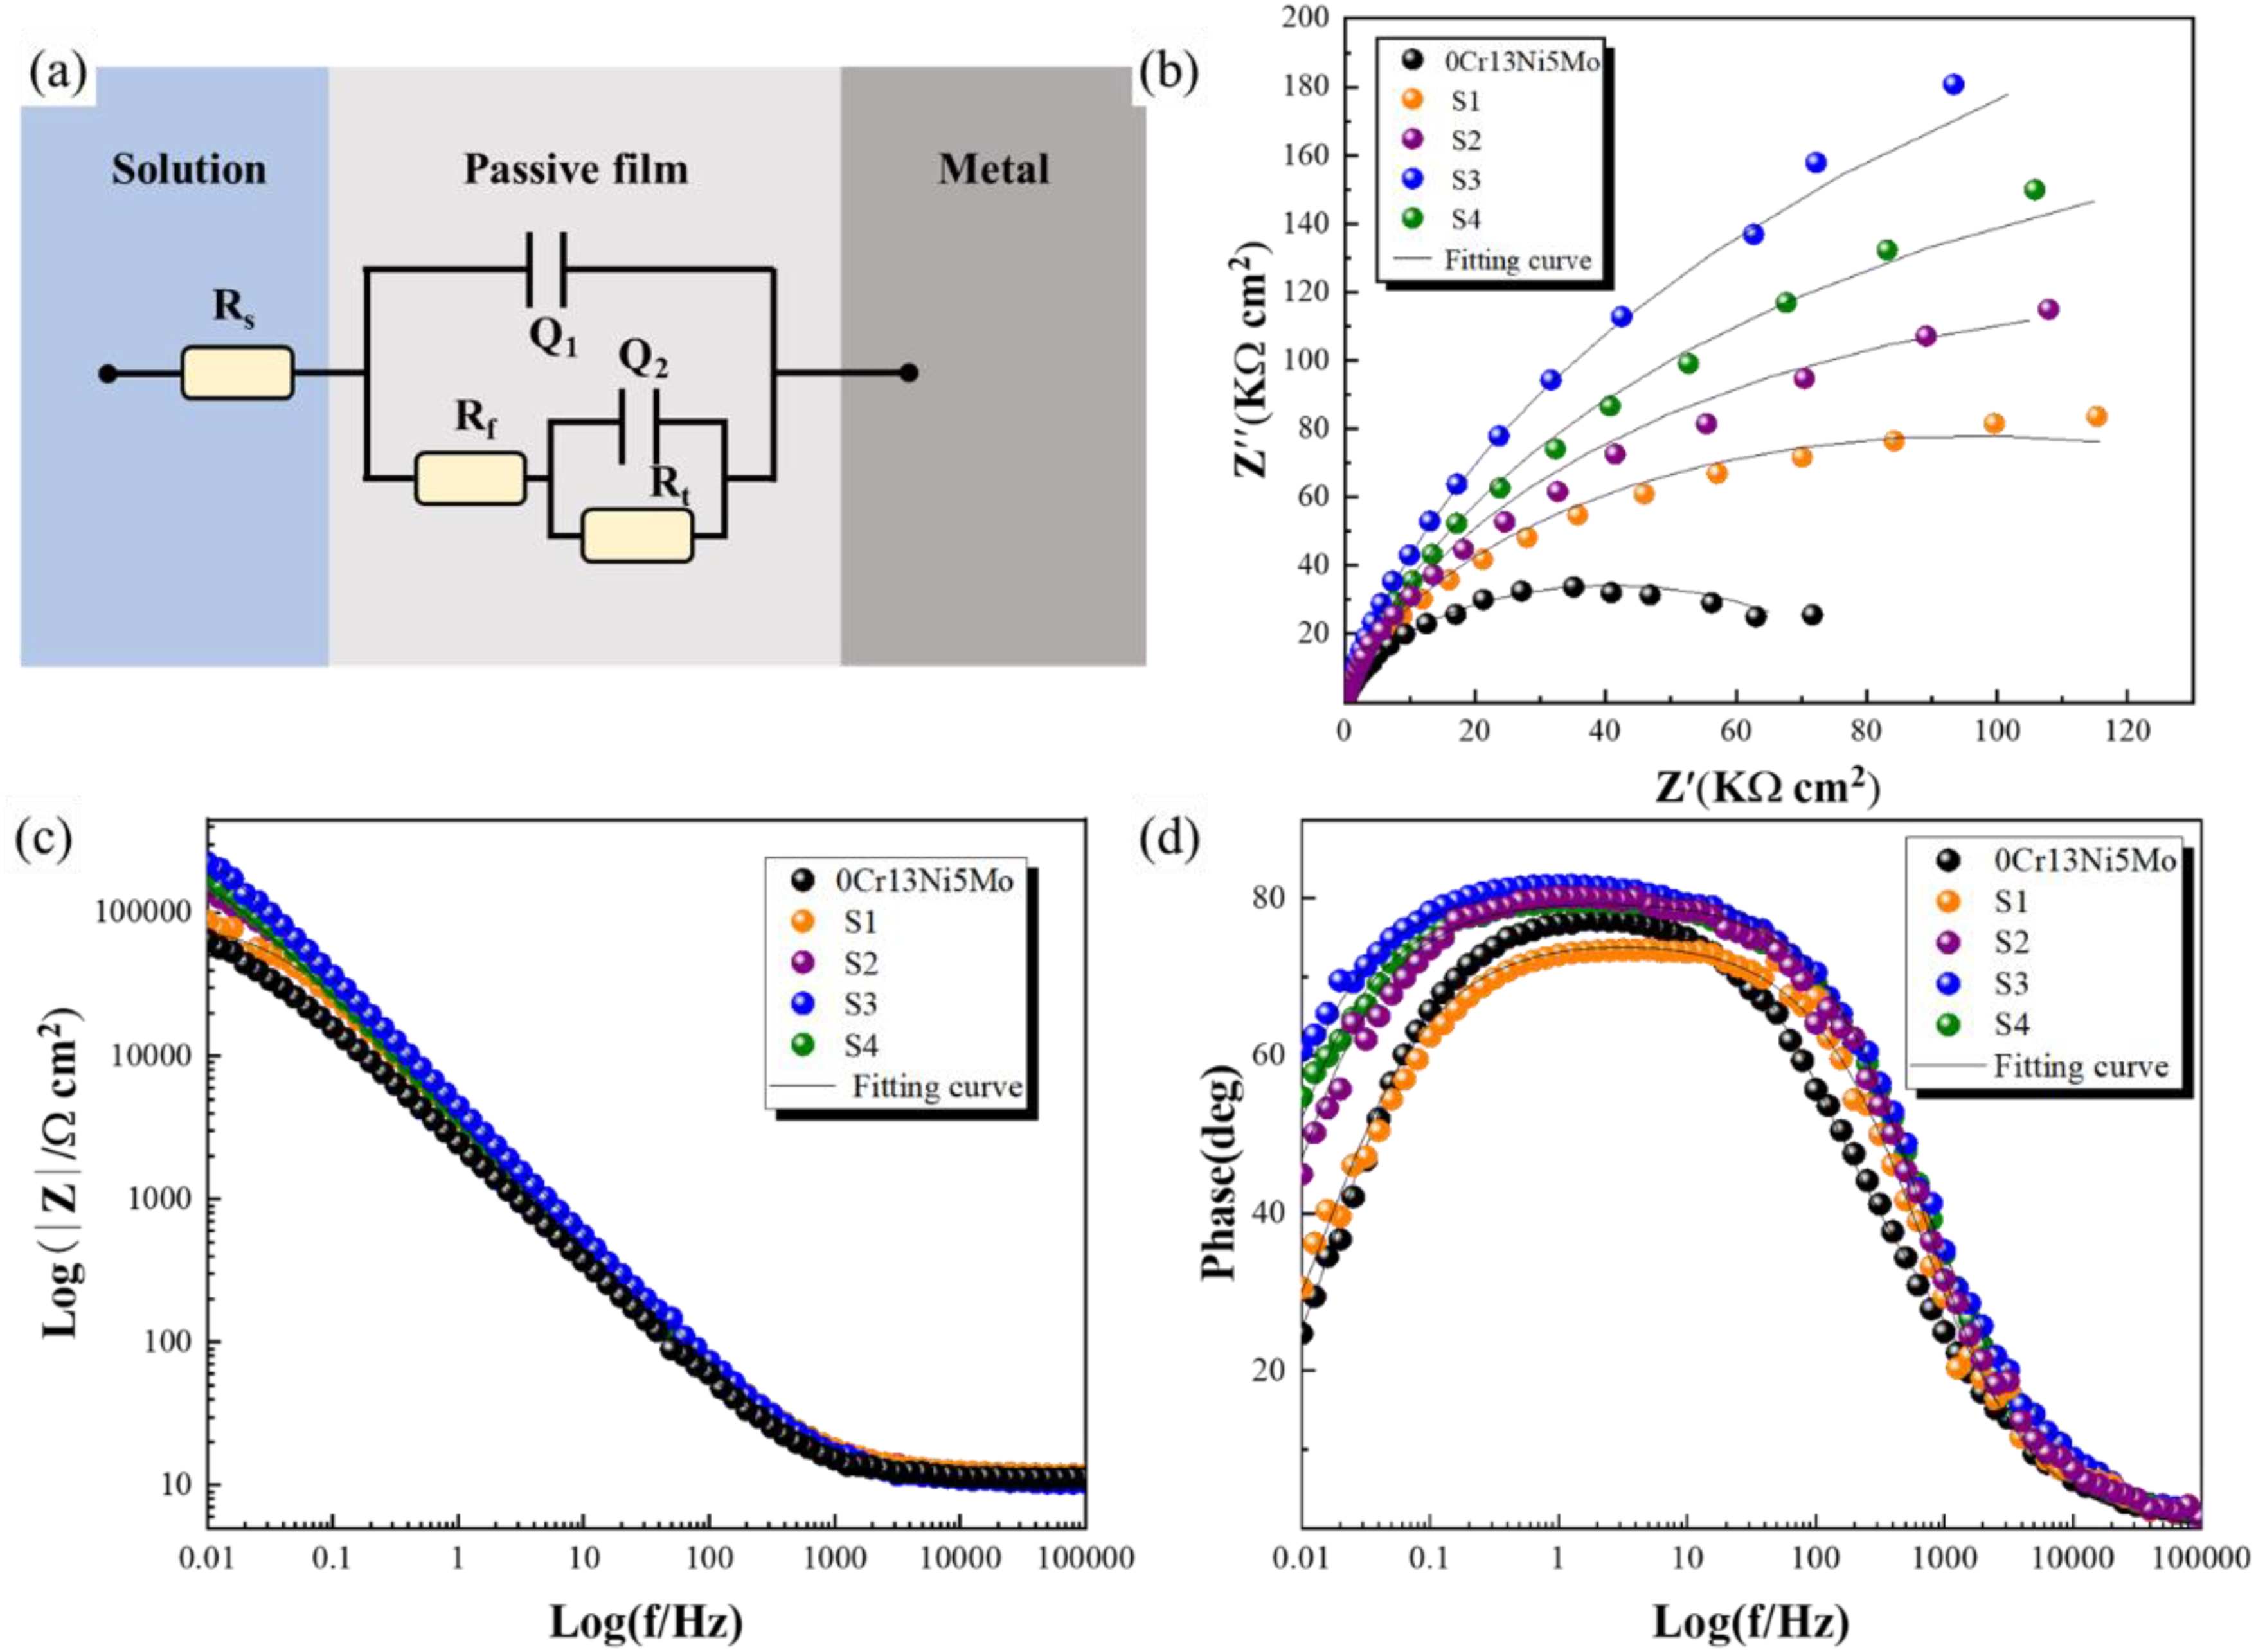
EIS test results of the substrate and the four composite coatings: (a) equivalent circuit diagram, (b) Nyquist plots, (c) Bode plots of |Z| vs. frequency and (d) Bode plots of degree vs. frequency.
EIS fitting results for the 0Cr13Ni5Mo substrate and the four coatings.
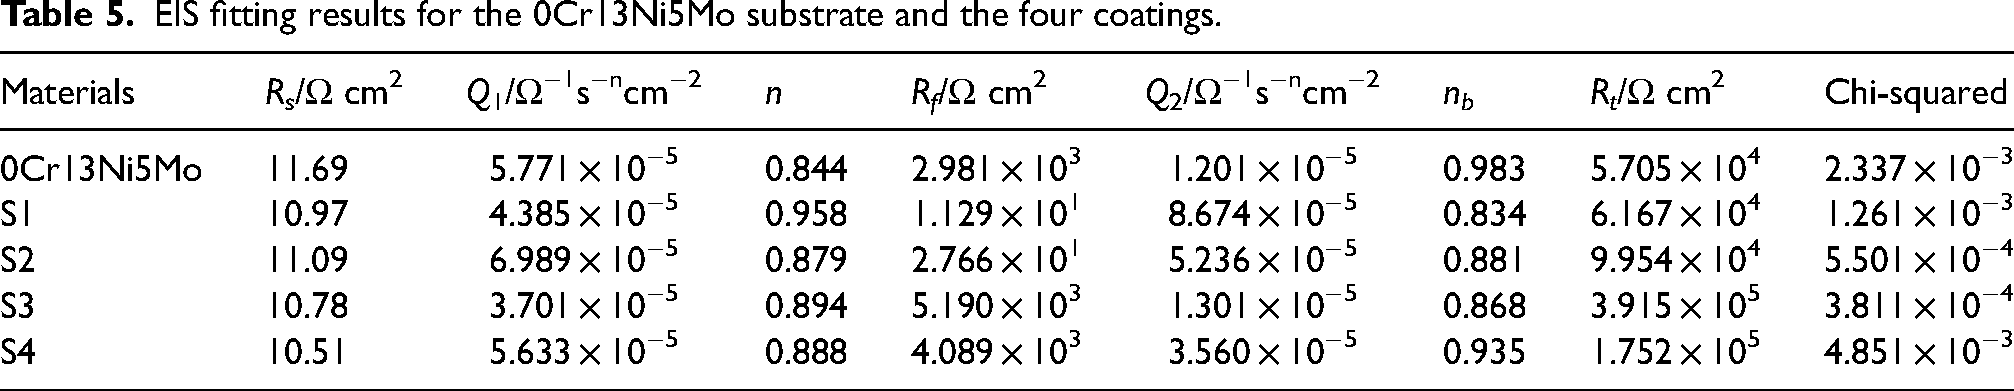
Figure 16(c) and (d) shows the Bode plots of the substrate and the four coating materials. It can be seen from Fig. 16(c) that the impedance modulus (|Z|) of S3 in the mid- and low-frequency regions was higher than that of the other samples, and 0Cr13Ni5Mo had a lower impedance modulus value than other samples. In Fig. 16(d), the impedance modulus value (|Z|0.01Hz) corresponded to the lowest frequency (0.01 Hz) in the Bode plot, which can be used to evaluate the corrosion resistance of the material. The larger impedance value and the larger phase angle indicated a better corrosion resistance of the material. 39 The coatings added with Nb showed a larger value of the phase angle compared to the substrate material, and S3 showed the largest phase angle, reaching 60°. Therefore, the results of EIS demonstrated that the four coatings added with Nb showed a better corrosion resistance than the 0Cr13Ni5Mo substrate. Moreover, S3 exhibited the highest corrosion resistance, which is consistent with the above experimental results of the potential polarisation curve.
The electrochemical corrosion morphology and element analysis of the substrate and the S1, S2, S3 and S4 coatings were investigated, as shown in Fig. 17, where Fig. 17(a2)–(e2) are the enlarged images of Fig. 17(a1)–(e1), respectively. It can be seen from Fig. 17(a1)–(e1) that there are pits with different numbers and sizes on the surface of the five corrosion samples. The number and size of the pits were significantly decreased with the addition of Nb, indicating that the corrosion resistance was improved. This phenomenon can be attributed to the affinity of the Nb element for carbon being higher than that of Cr, making NbC preferentially precipitated and its formation limiting the precipitation of Cr carbides, which profitably prevented the phenomenon of reduced corrosion resistance due to Cr-depleted regions caused by local Cr deficiency. 40 Therefore, it can be seen from the enlarged images in Fig. 17(a2)–(e2) that the large size pits were faded, and their size gradually decreased with the increase of NbC. That might due to the fact that the dissolved Cr released from Cr carbide promoted the formation of a Cr-rich oxide film, which can effectively prevent the destruction of Cl− and O2− for the material surface.

SEM images of the electrochemical corrosion surface of the substrate and the four composite coatings: (a1) 0Cr13Ni5Mo and (b1) S1, (c1) S2, (d1) S3 and (e1) S4 and (a2)–(e2) enlarged images.
According to the analysis of the potentiodynamic polarisation curves and the EIS test, S3 showed the highest corrosion resistance. Its corrosion surface was investigated by EDS. The result of element mapping is shown in Fig. 18. It can be seen that the O content was detected in the rich region of Cr and Nb. This phenomenon showed that corrosion products, such as Cr2O3 and stable Nb2O5, were generated in the corrosion process. In the study of Liu et al., 20 corrosion products, including Cr2O3, Nb2O5, Fe3O4 and NiO, can cover the surface as the passive film to prevent the adsorption of Cl−, thereby improving the corrosion resistance of stainless steel. It can be concluded that the high corrosion resistance of S3 is caused by the corrosion products of the Cr, Nb and Fe alloy oxide effectively protecting the exposed area caused by pitting.

EDS mapping of the S3 surface after electrochemical corrosion.
Figure 19 shows the schematic diagrams of the electrochemical corrosion of the 0Cr13Ni5Mo substrate and the S1, S2, S3 and S4 coating materials. According to the research of Li et al.,
41
when the Cr element in the material reaches a certain content, a passive film will be formed spontaneously, and the main chemical reactions are as follows:


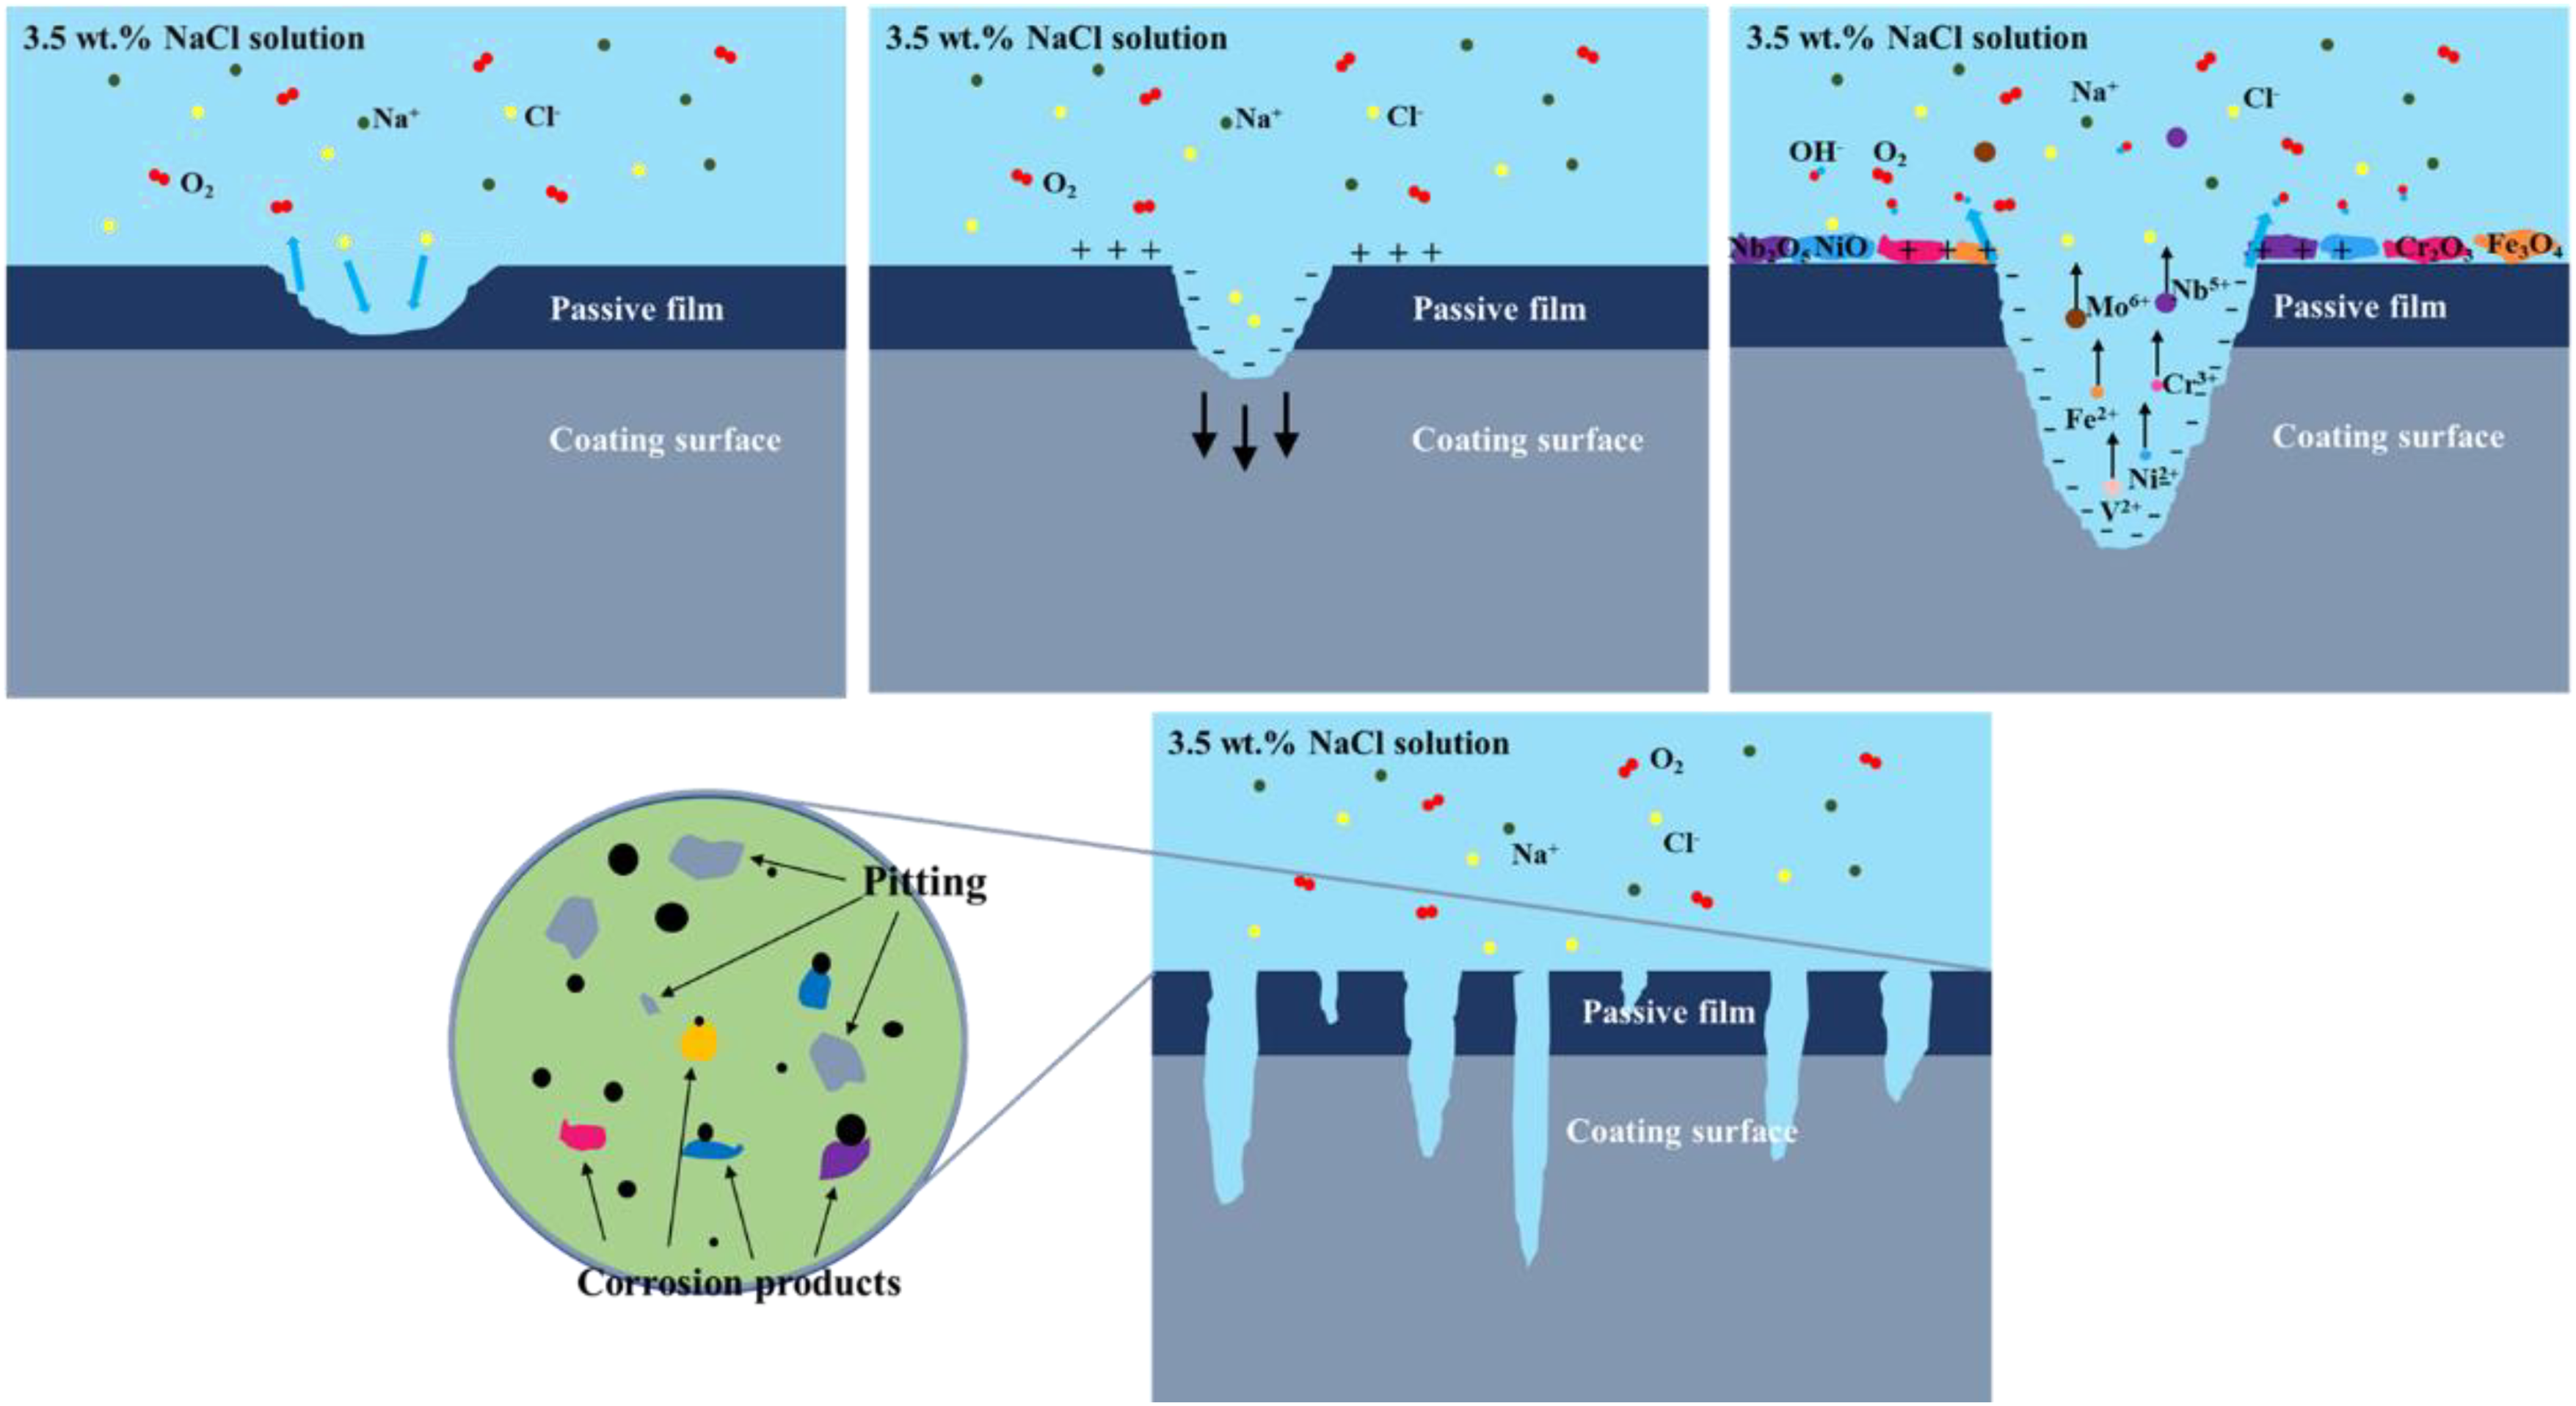
Scheme of the pitting process for the coating surface.
From the above reactions, the higher content of Cr dissolved in the matrix can effectively improve the surface corrosion resistance. In the electrochemical test, the pits were preferentially generated in sensitive areas, such as the weak sites caused by the local Cr deficiency of passivation. 42 When the surface of the alloy material came into contact with the 3.5 wt-% NaCl solution, the passive film was partially broken due to Cl− attacking the active sites and displacing the oxygen atoms. As evidenced by the EDS analysis in Fig. 18, a significant aggregation of the Cr element was observed. Moreover, varying degrees of aggregation of the O element were observed in the area where the Cr element was aggregated, providing support for the occurrence of the aforementioned reactions during the corrosion process. Due to the attack behaviour of Cl−, the passive film was further destroyed, exposing the metal surface and accelerating the formation of ultrafine holes. Because the passive film and the precipitation on the surface of the etching hole hindered the migration of ions inside and outside the hole, the dissolved metal ions in the hole were not easy to diffuse outward, resulting in an increase in the concentration of cations, such as Fe2+. Therefore, the potential in the inner surface of the pit was relatively negative, showing an active dissolution state as an anode. Inversely, the external surface of the pit was relatively positive due to the concentration of Cl− and acted as a cathode. With the continuous progress of the electrochemical test, the tiny holes were rapidly developing in the width and the depth along the direction of gravity, which formed the large corrosion holes in the end. The main reactions of dissolution and formation in the electrochemical test are as follows:
The oxygen absorption reaction on the surface of the passive film is as follows:


Conclusion
The influence of the five Fe-based composite coatings with different weight ratios of V and Nb on the microstructure, wear and corrosion behaviours was studied in this research. The corrosion mechanism of the coatings was also investigated. The main conclusions are drawn as follows:
With the Nb addition, a new-phase NbC was generated in the matrix. Due to the non-equilibrium solidification and the addition of Nb, lattice distortion was induced, and the refined grain strengthening and solution strengthening were stronger. S3 exhibited a maximum microhardness of 610 ± 12.2 HV, which improved the coating microhardness. With the increment of the Nb content, the microstructure was refined and changed from quadrangle carbides (S1 and S2) to petaloid and papilionaceous carbides (S3 and S4). Meanwhile, the reticular Cr carbide faded away with the increase of the Nb content, and precipitate (e.g. NbC) phase content increased. Nb played a minor role in the variation of the grain orientation, and there was no obvious texture feature in all samples. The average coefficient of friction for 0Cr13Ni5Mo, S1, S2, S3 and S4 was 0.742, 0.624, 0.562, 0.515 and 0.585, respectively. These suggest that the addition of Nb is beneficial to the wear resistance of the coating. The specific wear rates for 0Cr13Ni5Mo and S3 were 3.631 × 10⁻⁵ and 1.219 × 10⁻⁵ mm3/Nm, respectively. Furthermore, the wear mechanism transitions from adhesive–abrasive composite wear dominated by the adhesive wear of the substrate material to adhesive–abrasive composite wear dominated by abrasive wear of the coating material. The worn surface exhibited varying degrees of deformation and cracking. Additionally, differesnt degrees of oxidation were observed during the wear process, indicating an oxidative wear mechanism. The S3 composite coating exhibited the highest corrosion resistance, with Ecorr and Icorr values of −179.3 mV and 9.258 × 10⁻⁸ A/cm2, respectively, in 3.5 wt-% NaCl solution. The addition of an appropriate amount of Nb, being a strong carbide element, facilitated the release of Cr from the carbonised state and its dissolution in the matrix, thereby promoting the formation of the passivation film. Moreover, the higher grain boundary density further enhanced the corrosion resistance of the coating. However, excessive NbC can induce micro-galvanic corrosion, thereby diminishing the corrosion resistance of the coating.
Footnotes
Acknowledgements
The authors gratefully acknowledge the financial support for this research from the National Key Research and Development Program of China (No. 2016YFB1100204), Science and Technology Research Project of Liaoning Province (Nos. 2018106004 and LJKQZ2021050) and Shenyang Science and Technology Funded Project (Nos. 22-101-0-16 and 19-109-1-03).
Credit authorship contribution statement
Declaration of conflicting interests
The authors declared no potential conflicts of interest with respect to the research, authorship, and/or publication of this article.
Funding
The authors disclosed receipt of the following financial support for the research, authorship, and/or publication of this article: This work was supported by the National Key Research and Development Program of China, Shenyang Science and Technology Funded Project and Science and Technology Research Project of Liaoning Province (grant numbers 2016YFB1100204, 19-109-1-03 and 22-101-0-16 and 2018106004 and LJKQZ2021050, respectively).