
Abstract
The wettability as well as the corrosion resistance of metal is closely related to the surface microstructure. A surface structure with micro protrusion and nano ripple was designed and constructed on 316L stainless steel by femtosecond pulse laser. Superhydrophobic surfaces with a great contact angle over 150° were obtained by surface modifications of heat treatment or fluorination treatment. The corrosion resistance of the superhydrophobic micro-nano structured surfaces was studied through electrochemical testing. The result of polarization curve revealed that the superhydrophobic micro-nano structured surfaces possessed a higher corrosion potential, signifying the susceptibility to corrosion was reduced. Besides, the results of impedance indicated that the superhydrophobic micro-nano structured surfaces exhibited greater total resistance when compared to the original surface, demonstrating the corrosion resistance was enhanced. According to the results, the superhydrophobic surface, characterized by its micro-nanostructure, facilitates the formation of a protective gas film. Additionally, the intricate micro-nano rough structure, in conjunction with the gas film, effectively shields the underlying surface from infiltrative processes, thereby mitigating the potential exacerbation of corrosion phenomena.
Keywords
Introduction
Austenitic stainless steel is widely used in ships, marine equipment, nuclear power facilities, and the chemical industry due to its excellent corrosion resistance and strength. 1 Recent equipment failures attributed to stainless steel corrosion have highlighted the need to address metallic corrosion, especially in challenging conditions such as elevated temperatures, high pressures, humid environments, and seawater.2,3 Corrosion of metallic materials depends on material properties, substance condition, and external environment. 4 Minimizing the interface between the corrosive environment and metal surface is an effective strategy for corrosion mitigation. Existing methods such as protective paints, 5 spray coating, 6 electroplating, 7 and cathodic protection8,9 reduce the contact area but have drawbacks including ecological concerns, economic burdens, and resource consumption. Exploring new methods is necessary to extend material and equipment service life while addressing these issues.
Recent progress in biomimetic research has spotlighted the potential of superhydrophobic surfaces in the field of corrosion resistance. In nature, many hydrophobic surfaces, such as plant leaves, bird feathers, etc, have excellent hydrophobicity, phenomena collectively known as the lotus effect.10,11 The key to these surfaces’ superhydrophobicity lies in their rough surface textures, consisting of micro and nanoscale structures.12,13 In seeking to replicate this effect, researchers have experimented with a variety of substrate materials, ranging from metals 14 to building materials, 15 glass, 16 and synthetic fibers, 17 creating superhydrophobic coatings that mimic the natural world. The challenge in fabricating these surfaces is the precise engineering of rough textures on the micrometer and nanometer scales. Several techniques have emerged to construct such micro/nanostructures, mainly categorized into three groups: the template, coating, and etching methods. The template method involves crafting a master pattern with the desired textures and then replicating these features onto the target substrate. 18 Coating methods cover the substrate with a textured layer—techniques here include powder spraying, 19 chemical, 20 and electrochemical deposition. 21 Finally, etching methods utilize physical or chemical processes to alter the surface morphology of the substrate, establishing the required roughness; common approaches here encompass chemical etching, 22 electrochemical etching, 23 and laser ablation, 24 among others.
The study of corrosion-resistant materials with hydrophobic properties has been ongoing for quite some time. One significant advantage of these materials is their ability to trap gas film within the superhydrophobic structure, resulting in the presence of bubbles within the gaps when immersed in water. This effectively reduces the contact area between the material and the corrosive medium. Researchers have utilized various techniques to create superhydrophobic surfaces with enhanced corrosion resistance. Ye et al. 25 successfully created hierarchical structures with superhydrophobicity on copper and copper alloys through a combination of electrochemical etching and chemical vapor deposition. Shi et al. 26 improved the corrosion resistance of aluminum alloys by employing a two-step process involving etching and polymer modification to create superhydrophobic surface structures. Song et al. 27 endowing Mg alloy surface with superhydrophobicity solves its poor corrosion resistance by a bilayer composite superhydrophobic coating. These studies have all successfully achieved superhydrophobic surfaces and based on superhydrophobicity, successfully improving corrosion resistance.
Recent advancements in pulsed laser technology have streamlined the construction of superhydrophobic structures. 28 Xin et al. 28 used nanosecond laser vertical crossed scanning to fabricate a micro-protrusion array structure with nanoparticles on the surface of 5083 Al alloy, achieving a superhydrophobic surface with enhanced corrosion resistance. Compared to alternative methods, laser ablation processing offers notable advantages, including speed, cost-effectiveness, accuracy, and the ability to generate consistent microstructure by preset parameters. In addition, based on the characteristics of laser ablation, regular nanostructures could be formed on the processed surface within certain parameters, which are called laser-induced periodic surface structures (LIPSS). In this way, through the design of laser parameters, rough microstructures can be ablated, as well as nano LIPSS induced in these rough structures. Currently, micro/nanostructures designed through laser processing can be categorized into three types: protrusion, 29 groove,30,31 and micro-pit. 32 But these structures may not be stable. A paper published in Nature reported 33 that composite superhydrophobic micro nano structures exhibit better mechanical stability, which can enhance surface hydrophobicity and corrosion resistance.33,34 Therefore, a composite micro nano superhydrophobic structure will be designed and constructed in 316 L austenitic stainless steel by femtosecond pulse laser to obtain a corrosion-resistant superhydrophobic surface.
In this paper, a secondary surface rough structure with micron protrusion structure and LIPSS was designed and constructed. The femtosecond laser was employed to etch the surface of 316L stainless steel, and two methods, heat treatment and fluorination treatment were used to modify the constructed surface to achieve superhydrophobicity. The research analyzes the influence of laser processing parameters on the resulting rough structure based on observations of the surface microstructure. Additionally, the effect of the constructed surface microstructure on hydrophobic performance is examined. Finally, the corrosion behavior of the prepared superhydrophobic surfaces is studied by electrochemical tests.
Materials and methods
Materials
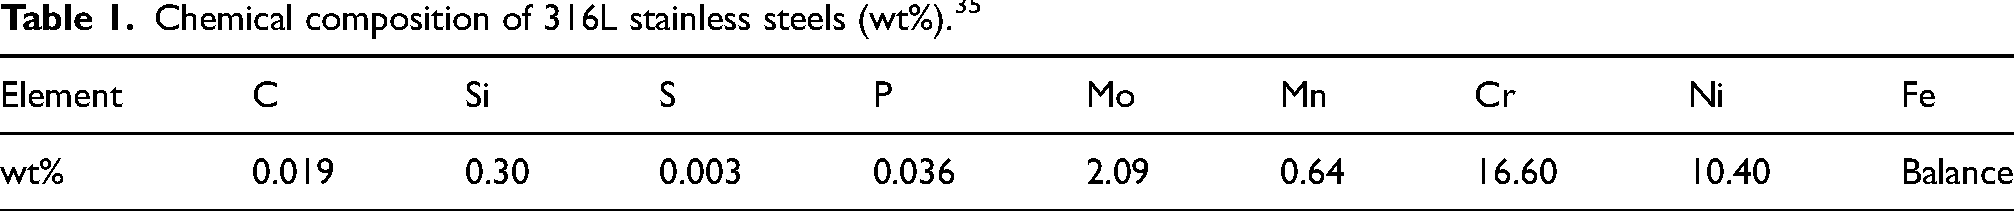
The material used in this paper was 316L austenitic stainless steel. Table 1 provides the elemental composition of the stainless steel. The material was cut into sheet-like specimens with a size of 10 mm × 10 mm × 1 mm. Prior to the processing steps, the surface of the stainless steel was polished to 800 grit by a metallographic grinding machine. The specimens were then cleaned by ultrasonic cleaning machine and alcohol.
Chemical composition of 316L stainless steels (wt%). 35
Fabrication of superhydrophobic surface
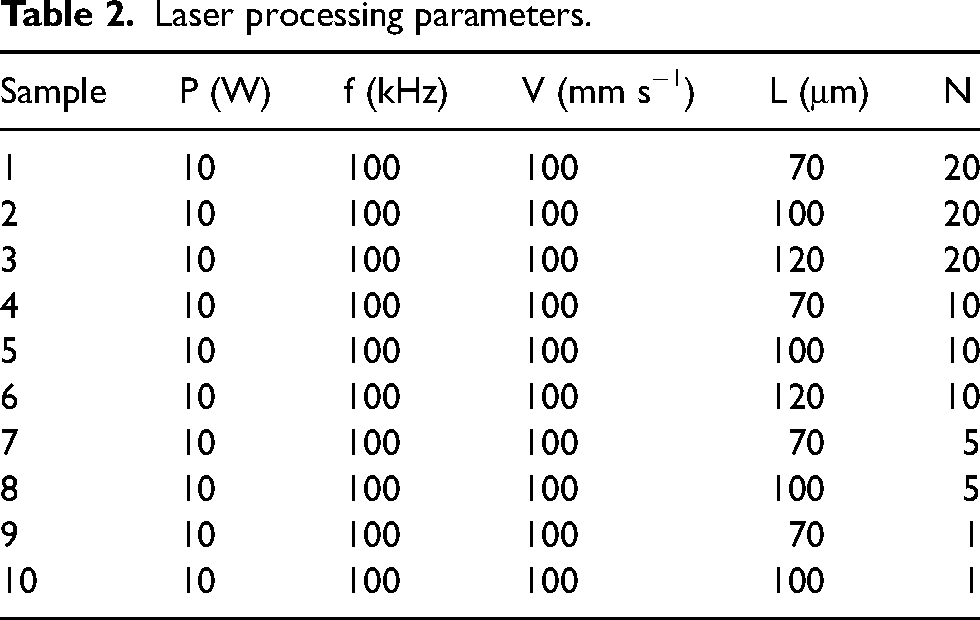
In this experimental study, a femtosecond pulse laser (Spirit HE 16-SHG from Spectrum-Physics) with a laser wavelength of 1040 nm was used to process. The laser intensity follows a Gaussian distribution and the laser's spot radius is 7 μm at e−2 of its maximum intensity. To produce the desired micron-scale protrusion array structure, cross-grid path for laser scanning was designed, as illustrated in Figure 1. The design incorporated equal spacing between both horizontal and vertical paths of the grid. Certain samples were processed multiple times by laser engraving. After the laser completed one pass over the grid path, it was run over the same path again until reaching the predetermined number of times necessary for the desired structure. The processing parameters are outlined in Table 2, where ‘N’ refers to the number of laser processing times. Regardless of the instance, the scanning speed and laser frequency remain constant, with a significant spot overlap rate of approximately 91%.
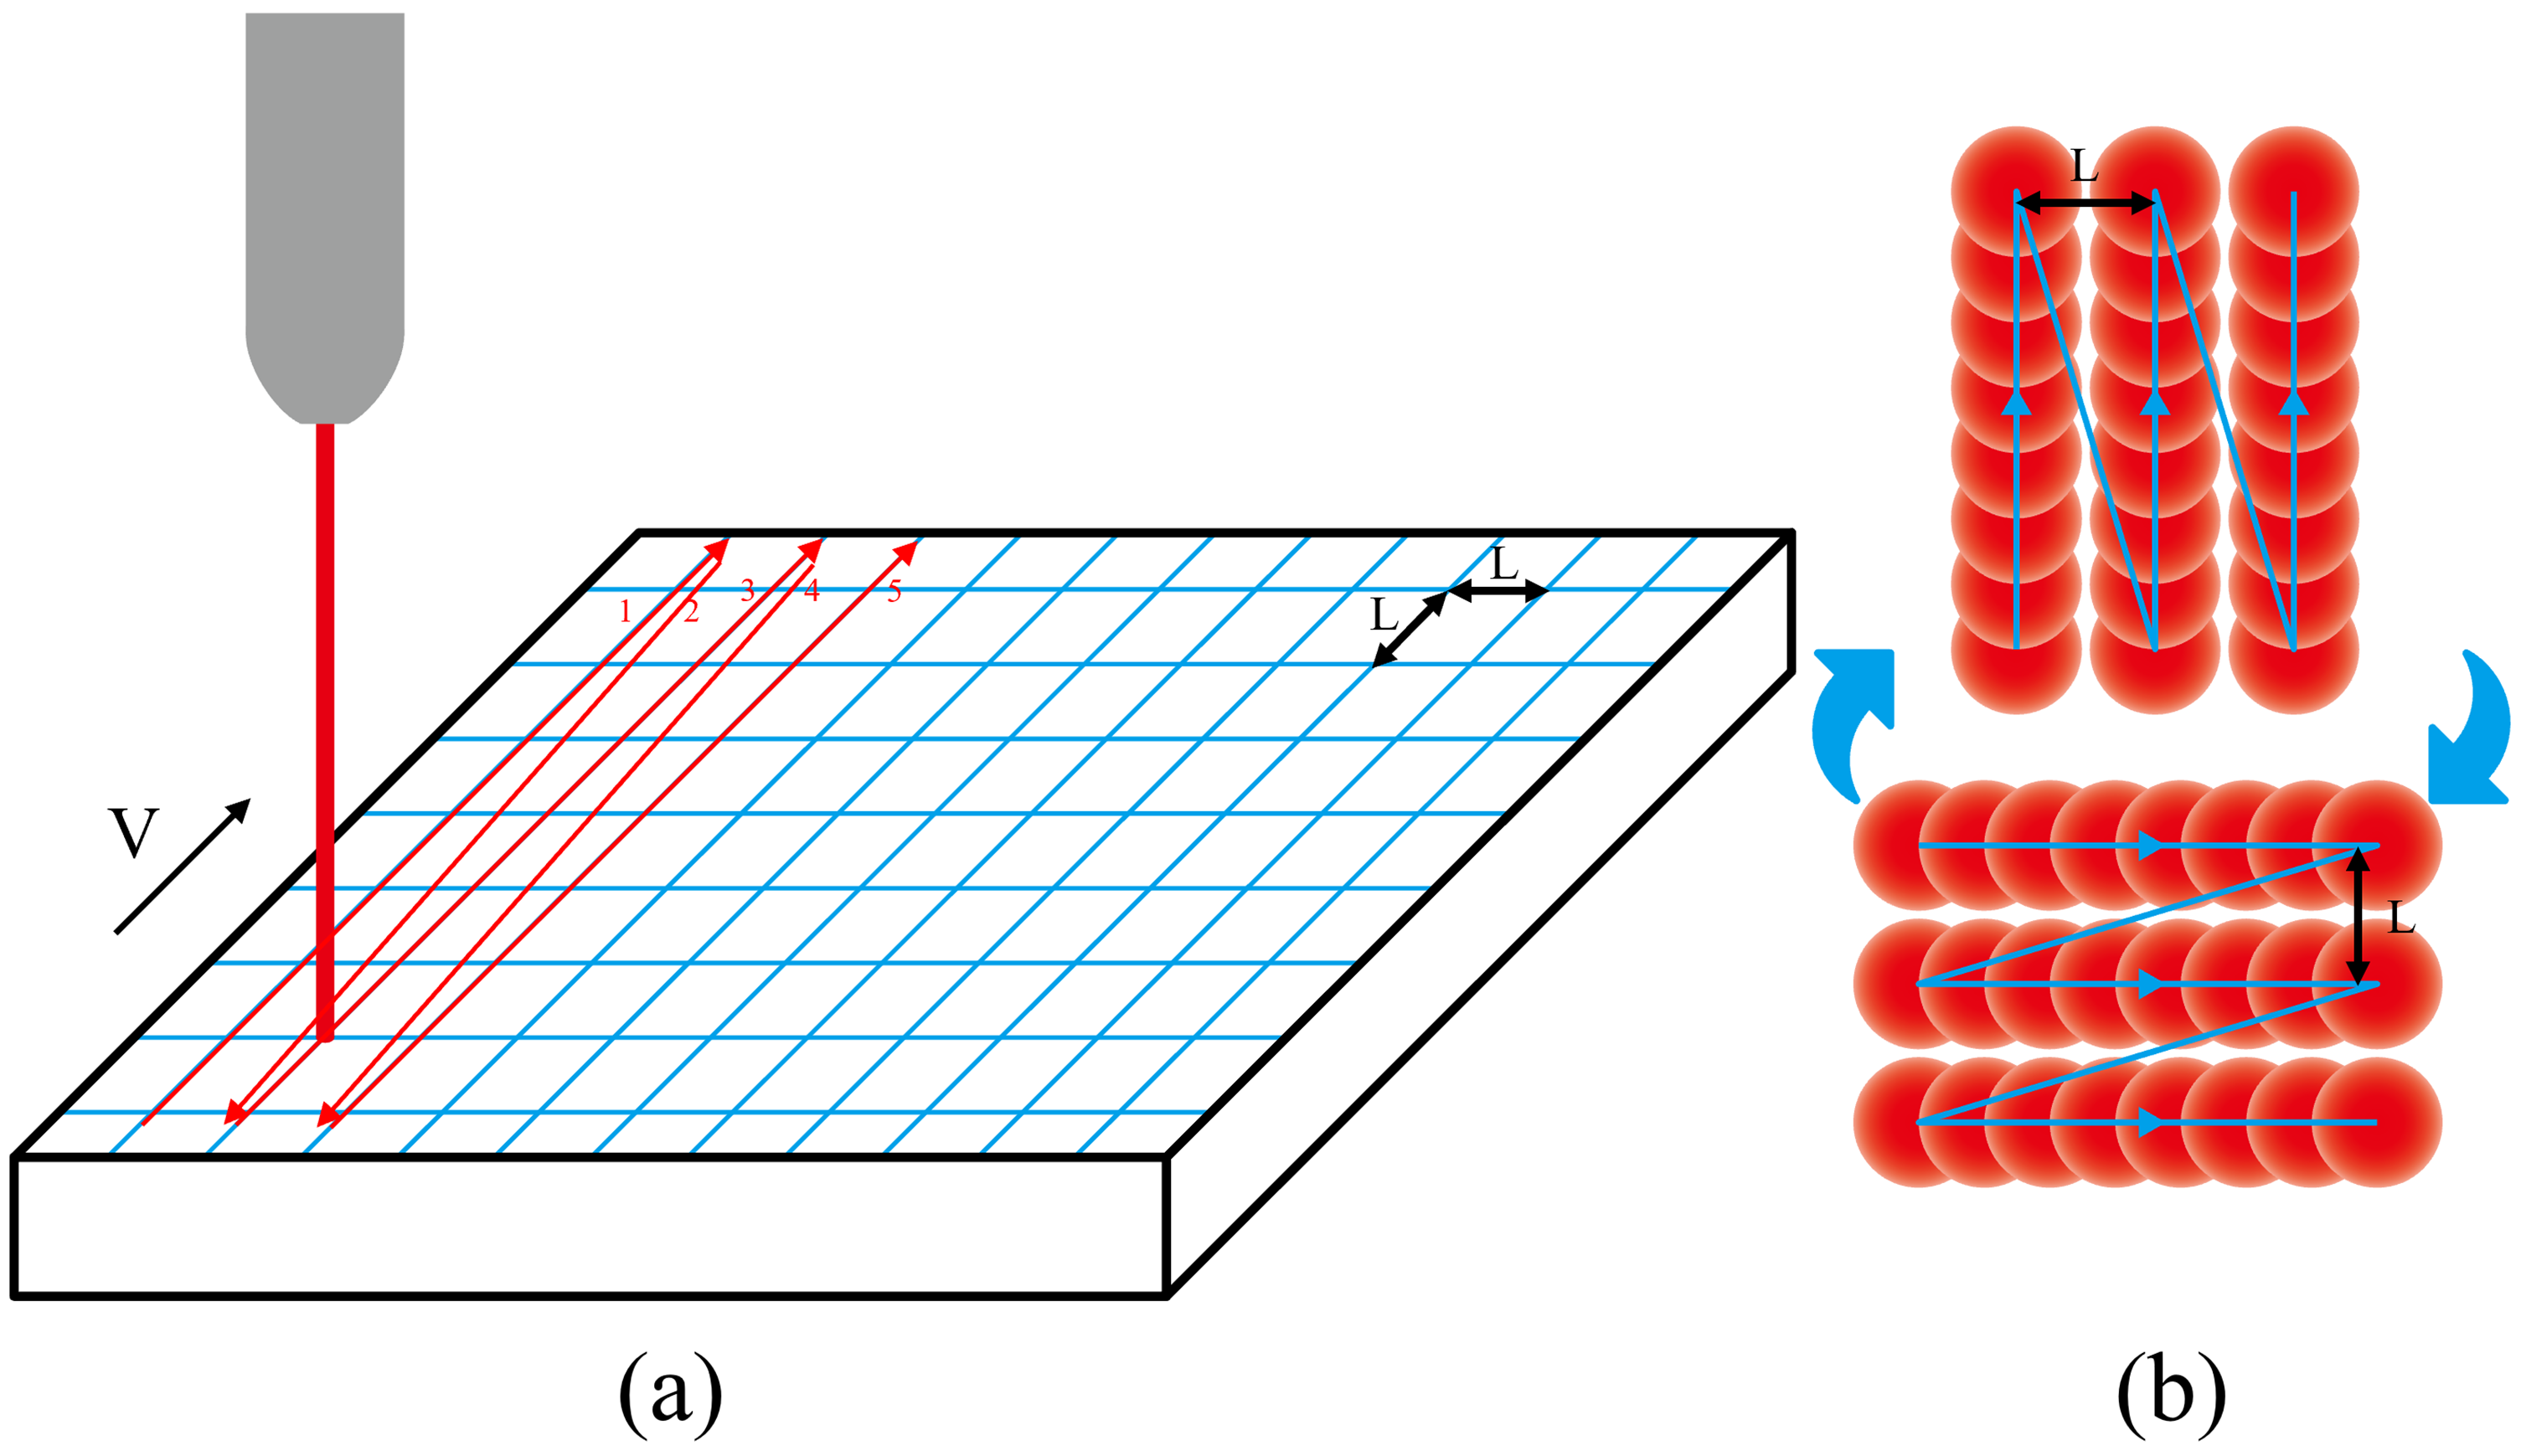
Laser processing and laser burning paths.
Laser processing parameters.
After the laser processing was complete, the samples were subjected to surface hydrophobic modification treatments, which were classified into two types: heat treatment and fluorination treatment. For the heat treatment steps, the specimens were placed in a vacuum furnace and almost vacuuming the furnace of air, then heated at a stable temperature of 300 °C for 24 h. For the fluorination treatment steps, the samples were immersed in a mixture of hydrophobic agents (1H, 1H, 2H, 2H-perfluorooctyltriethoxysilane (C14H19F13O3Si) with a mass fraction of 2%) and alcohol for a duration of 1 h at 60 °C, then the samples were placed in a heating furnace at 100 °C for 1 h.
Characterization
The contact angles (CA) were measured immediately after hydrophobic treatment by contact angle measurement system (DropMeterTM A-300, Ningbo Haishu Maishi Testing Technology Co., Ltd). Additionally, the CA of untreated surface was measured as a comparison, in which the polishing degree of the surface corresponds to a particle size of W0.5, and the polishing steps are carried out sequentially with sandpaper (100 grit, 200 grit, 800 grit, 2000 grit) and diamond polishing paste (W3.5, W1.5, W0.5). For each measurement, a specific liquid droplet of 6 μl was dropped onto the measured surface, and immediately measured and calculated the CA automatically by DropMeterTM software. Samples were measured three times, and the average value was taken.
Surface morphology was examined by an optical superdepth microscope (OLYMPUS DSX1000, Olympus Corporation, Japan). The 3D morphology of the surface structure is scanned and obtained within a certain height, and line contours was measured.
The surface microstructure was observed via scanning electron microscope (SEM), the SEM using in the paper is Zeiss FE-SEM (G300), produced by Carl Zeiss AG, Germany. The observed images include surfaces and cross-sections. Before observing the cross-section, a layer of nickel was plated on the surface to protect surface details from damage during polishing. Adjust the voltage of SEM to make a clear distinction between 316L stainless steel and nickel layers.
The surface elemental composition of sample 1 after two treatments and the original smooth surface were detected by X-ray photoelectron spectrometer (XPS) (AXIS Ultra DLD, Kratos, Japan), a full spectrum scan of the surface was performed, followed by more detailed scans of C, O, Fe and Cr.
The corrosion resistance of the specimens was measured by an electrochemical workstation (CS310 M, Wuhan Kesite Instrument Co., Ltd, China). Before testing, the samples need to be made into working electrodes to reduce the impact of the non-test surface (sealing the non-test surfaces of the test electrode). The solution used for electrochemical testing was NaCl solution with a mass fraction of 3.5%, which was prepare by NaCl solid and distilled water for 250 ml. Before testing, the working electrodes were cleaned with an ultrasonic cleaner and deionized water, and then quickly dried with a hair dryer. During testing, the working electrode was placed in the testing environment to stabilize the circuit with 60 min. Frequency scanning and electrokinetic potential scanning are then performed. Frequency scanning adopted potential control mode, with an initial frequency of 105 Hz and a termination frequency of 10−2 Hz. The relative open circuit potential of the DC potential was set to 0, and the amplitude of the AC potential was set to 0.01 V. In the dynamic potential scanning test, the initial test potential set relative to the open circuit potential was −0.4 V, the termination test potential was 0.8 V, and the potential scanning speed was 1 mV s−1. In addition, immerse the specimen in the test solution for 24 and 48 h, and repeat the above electrochemical tests. After the electrochemical test, the surface microstructure is observed by SEM.
Result
Morphology
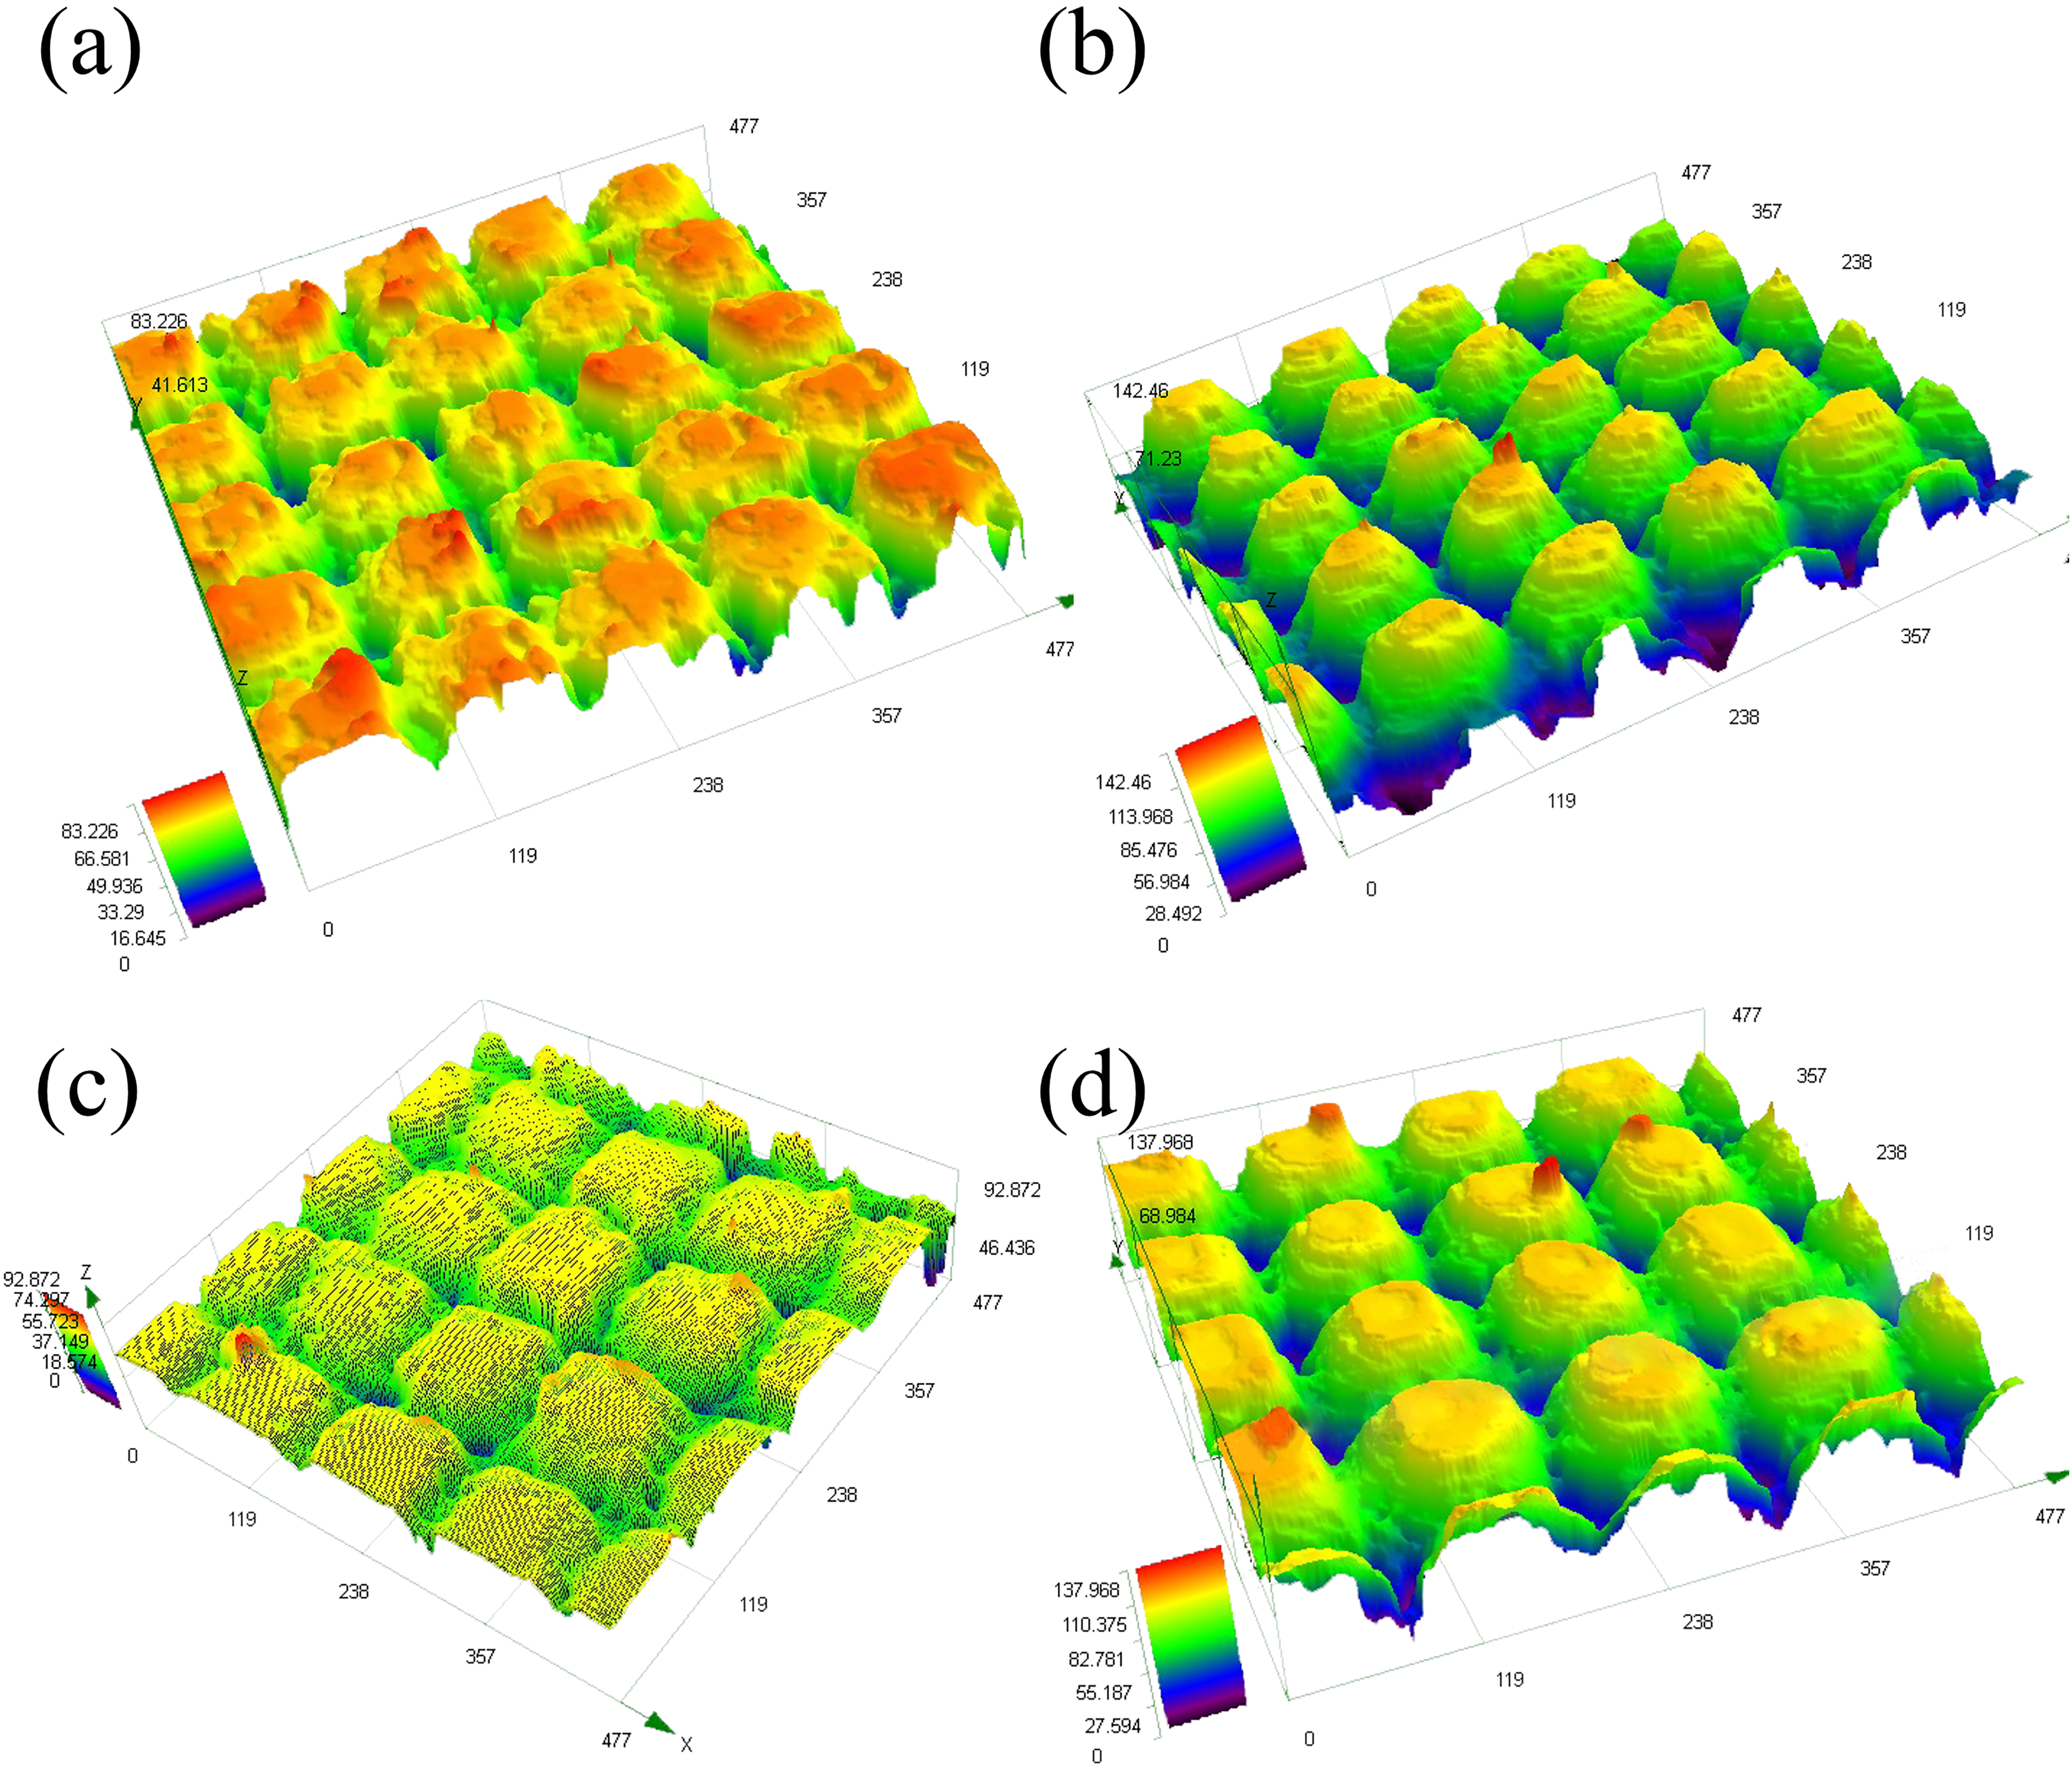
Figure 2 is optical 3D morphology images of different scanning times in 10 W laser at the same spacing. It could be observed that the surface of N = 1 have slight micron protrusion structure, which depth drop is between 3 μm. When N = 5, the depth difference on the surface of the sample is higher and there are obvious laser burning grooves. When N = 10, the surface showed obvious micro protrusions. When N = 20, the micron protrusion structure gradually became fuller and more complete. The above explanation shows that as the laser processing times (N) increases, the grooves formed at the laser burning path become deeper. And outside the Gaussian distribution of the spot radius, it is also affected by laser burning. In this way, combining multiple influences, a plump micron protrusion structure like sample 1 was formed. Figure 3 shows the 3D morphology of the optical microscope after 10 and 20 times of laser processing with different spacing. It can be observed that compared to N = 10, the surface after 20 laser processing has a larger drop and relatively beautiful protrusions. In addition, the protrusions shown in Figure 2(a) and (b) have a flat top, which is more like a groove structure compared to micrometer protrusions.
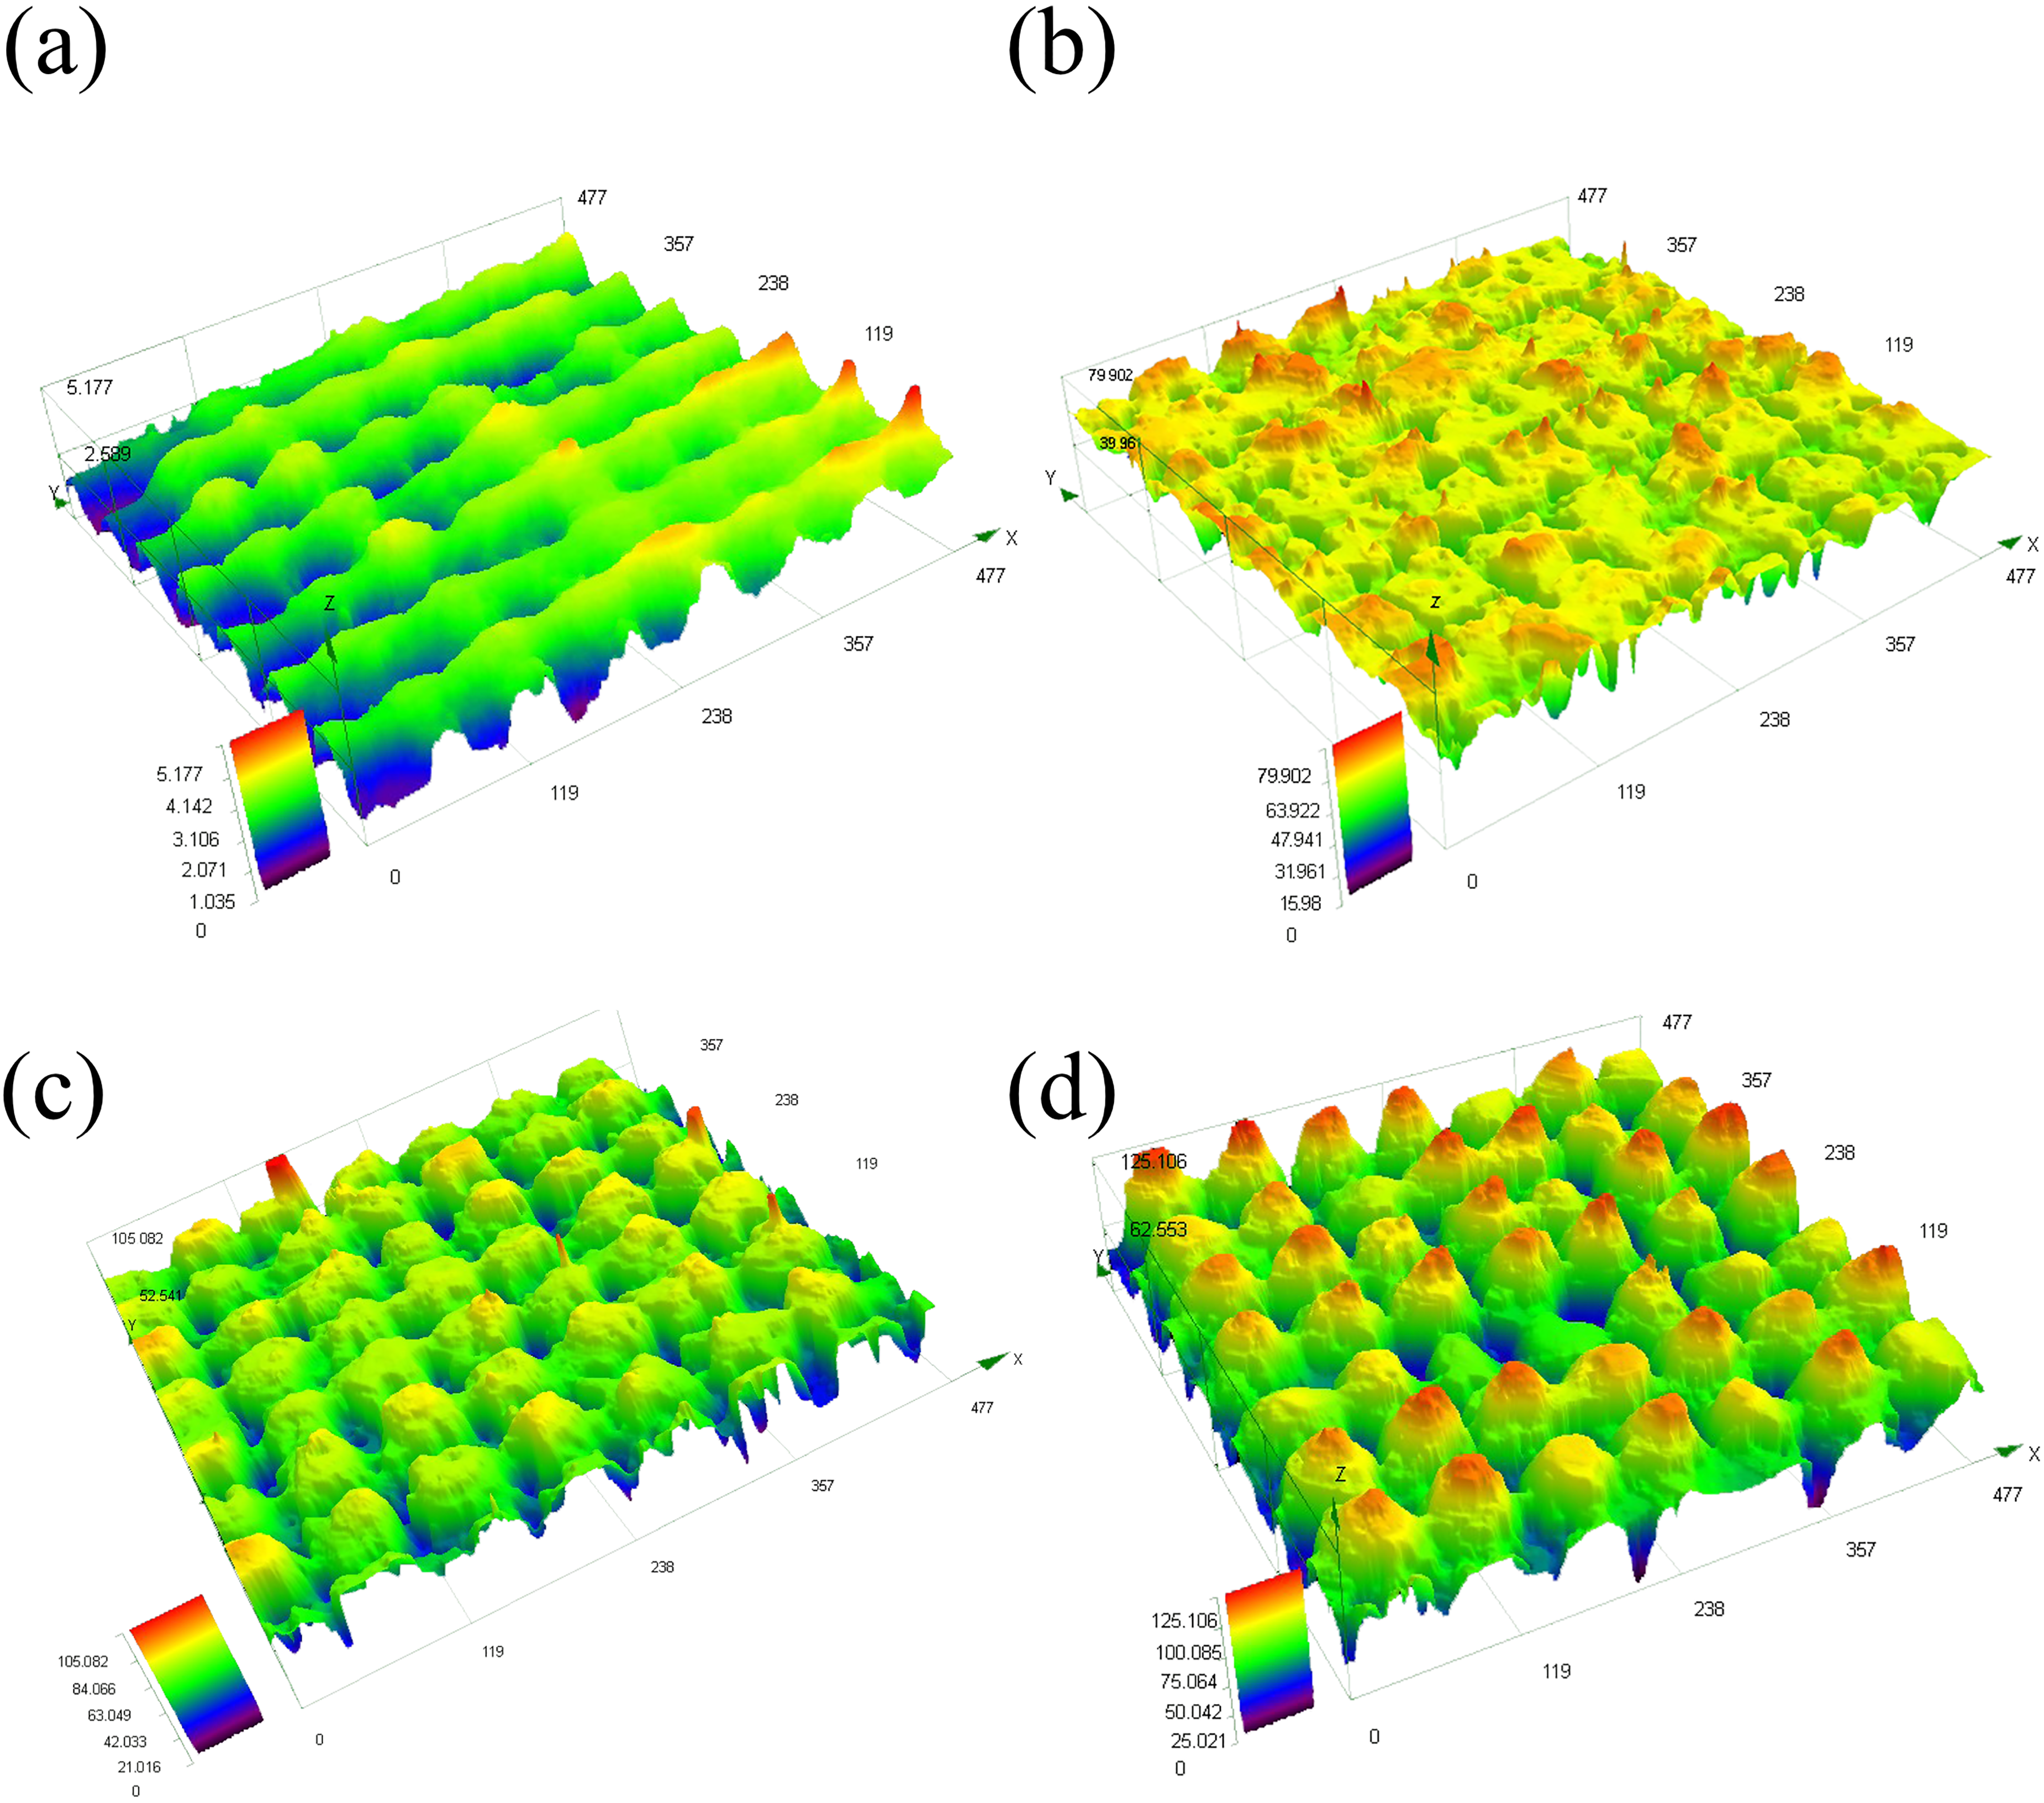
Optical 3D simulation morphology of different scanning times under 70 μm path spacing, (a) N = 1; (b) N = 5; (c) N = 10; (d) N = 20.
Optical 3D simulation morphology of different scanning times under 100 μm and 120 μm path spacing, (a) N = 10, L = 100 μm; (b) N = 20, L = 100 μm; (c) N = 10, L = 120 μm; (d) N = 20, L = 120 μm.
Figure 4 shows the cross sections of samples 1 and 2 by SEM, and the wavy profile is the boundary between the two materials. The upper layer with a white tint is the nickel layer, and the lower layer with a black tint is the substrate material. The above results indicate that the surface obtained by laser processing has micro protrusion structures. Figure 5(a) shows the structural surface of sample 1 observed by scanning electron microscopy, which has accurate details compared to optical microscopy. And Figure 5(b) shows the structural surface of sample 2. The micron protrusion structure has appeared shown in Figure 5(a), while it is observed that many smaller structures covering the micron protrusion structure clearly, and there are some cracks at the top of the protrusions with a width of about 5 μm. Next to the cracks, there are many nano ripple structures with sizes of several hundred nanometers, which are a type of LIPSS. The possible reason for the formation of cracks is that the peak power of a single pulse laser is extremely high, and the molten material accumulates on both sides of the path. Besides, the scanning speed is fast, and the rapid decrease in temperature causes the molten material to solidify on both sides of the path, without enough time to flow towards the center of the path grid. Multiple scans exacerbate this phenomenon based on the solidification of the original material, which ultimately leads to some gaps. The LIPSS originates from the recoil pressure applied by the ablation plume, which drives the melt away from the light source and rapidly solidifies in a very short period. 36 However, it was observed in Figure 5(b) that there were obvious micro protrusion structures and LIPSS, but some small protrusion structures were observed between the gaps of the protrusion array. In summary, compared to other samples, better micron protrusion structure covered with many LIPSS have been observed in samples 1, 2, and 3, providing objective conditions for achieving hydrophobicity like natural superhydrophobic surface.
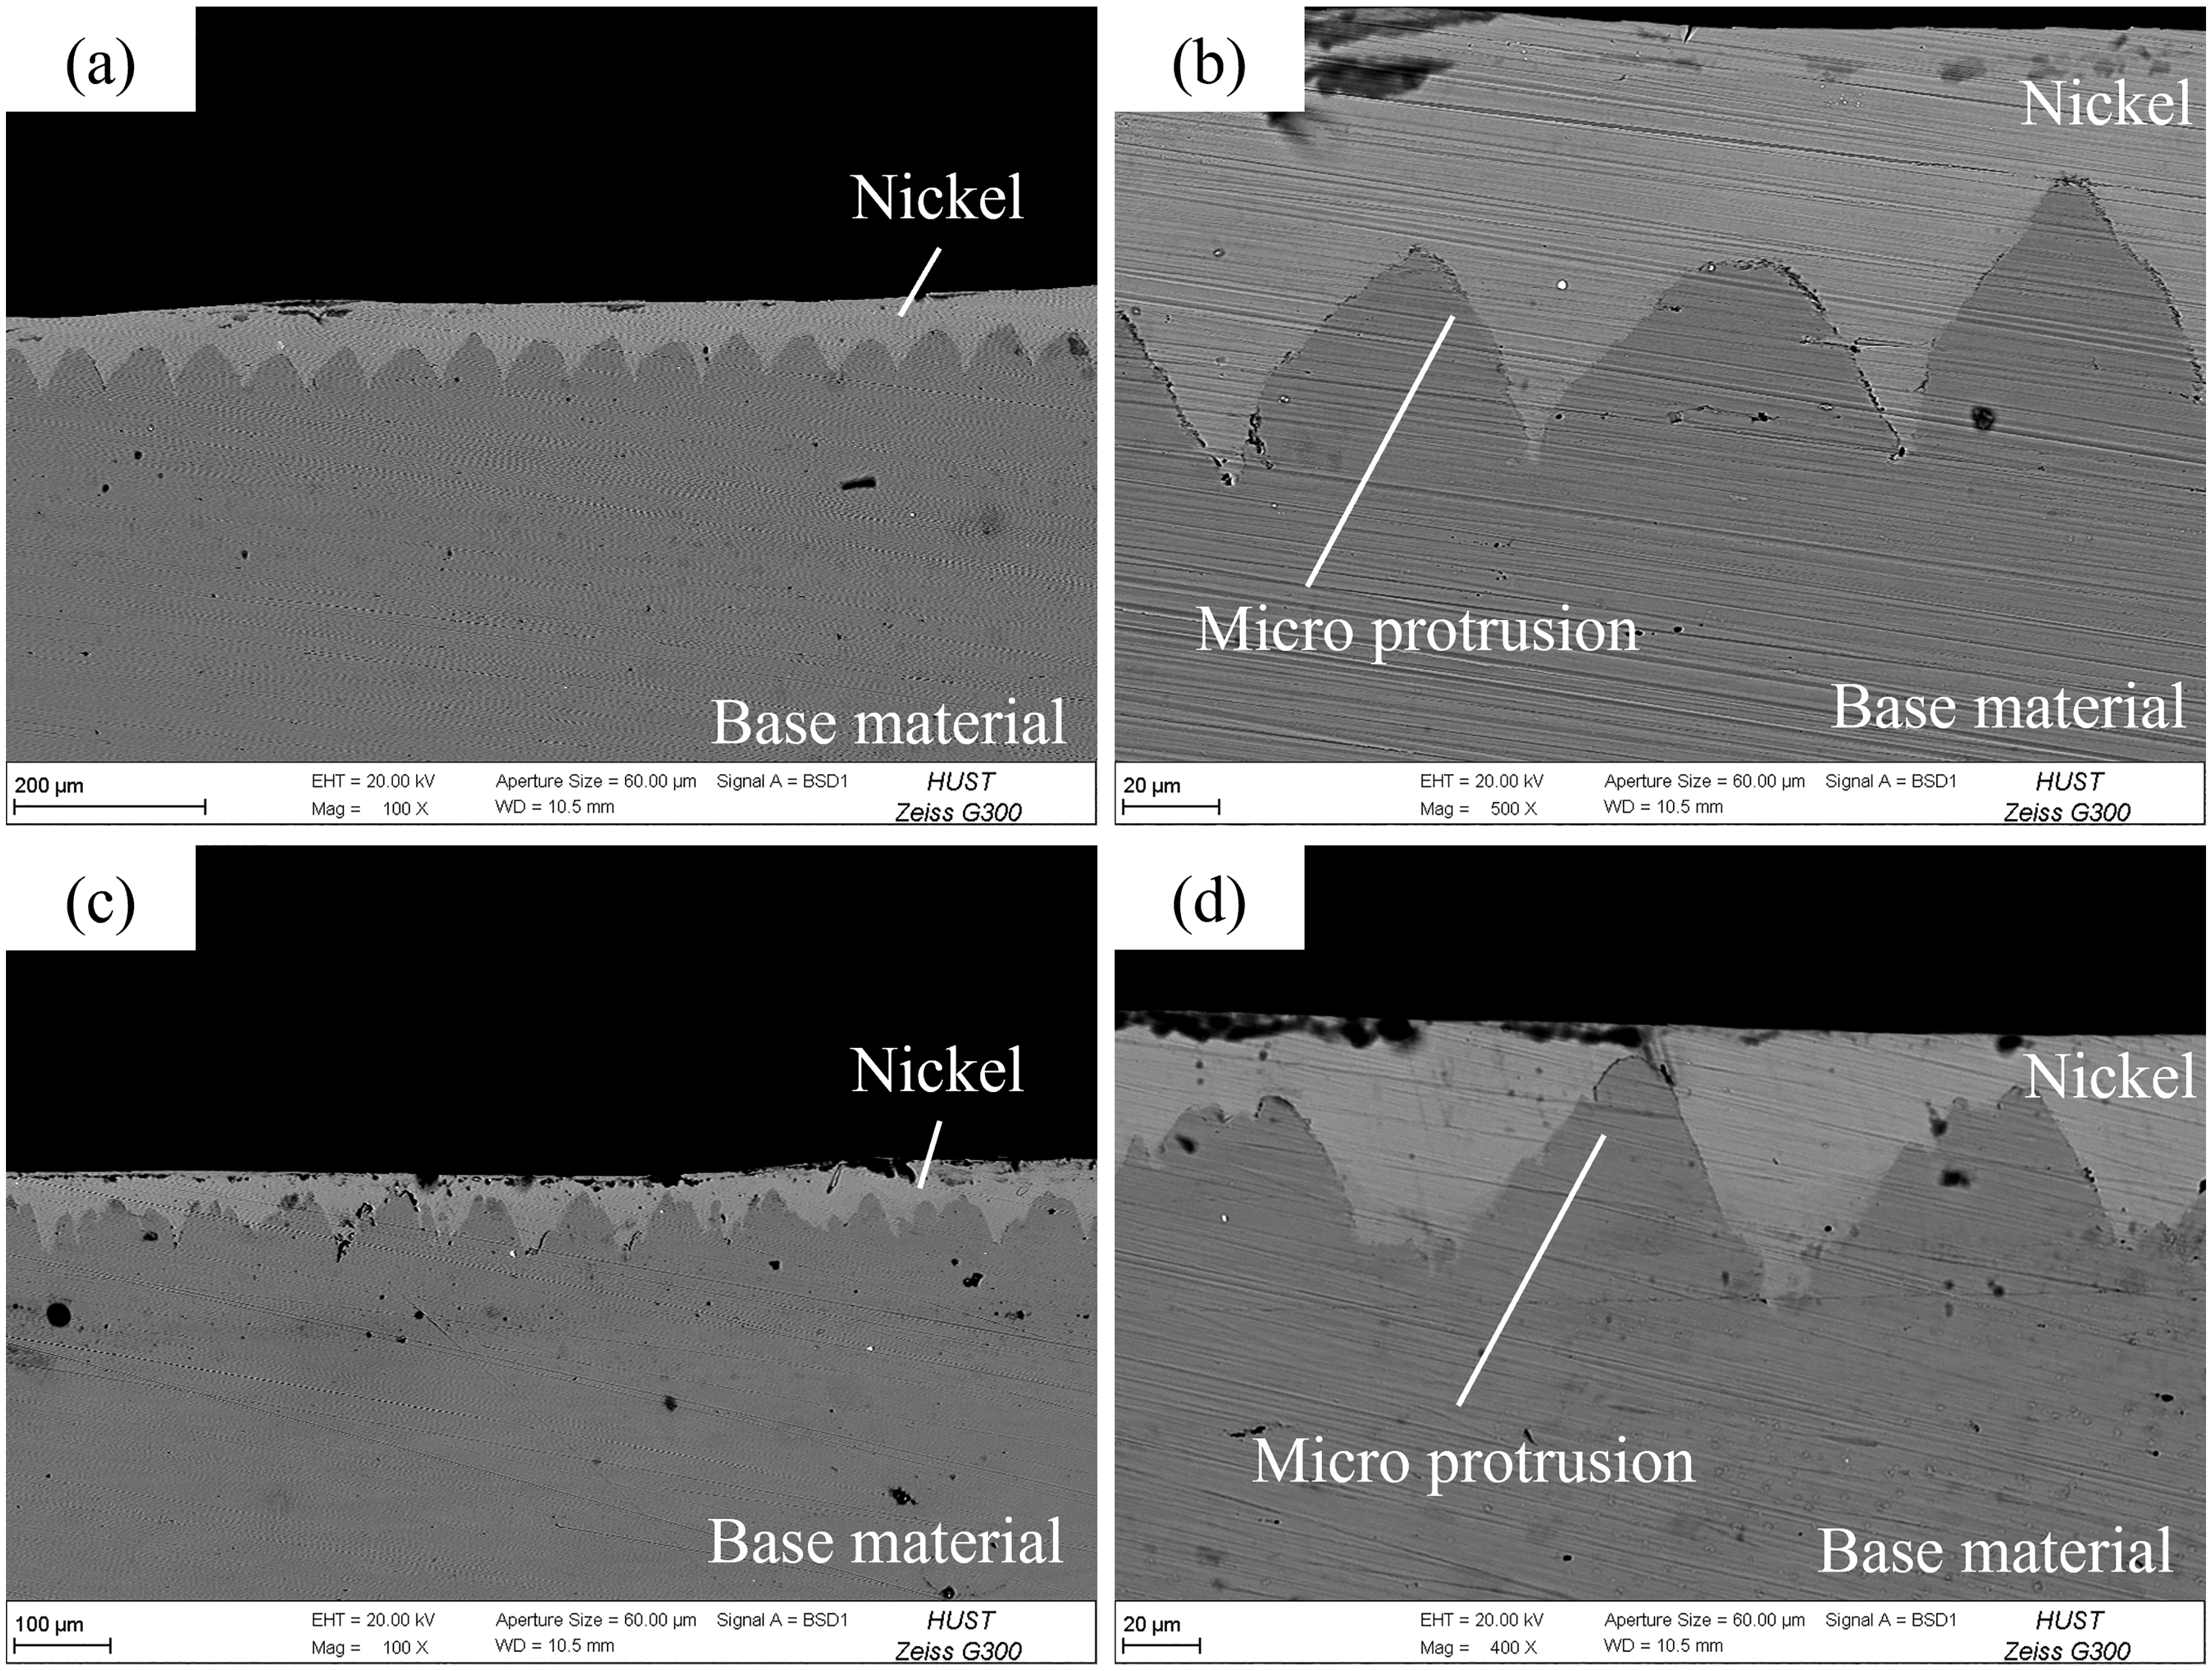
SEM images of cross sections of sample 1 (a, b) and 2 (c, d).

SEM images of sample 1 (a) and sample 2 (b).
Wettability
Figure 6 illustrates the contact angles for differently modified surfaces as well as those of untreated, smooth surfaces–the notations “iH” and “iF” refer to sample i subjected to heat and fluorination treatments, respectively. As depicted, untreated 316 L stainless steel displays a CA of 85°, while laser-irradiated surfaces exhibit an almost zero, and hydrophobically-treated surfaces present a CA in excess of 150°, indicating two types of samples prepared obtained superhydrophobic characteristics. Notably, the CAs of heat treatment samples are greater than 160°, which outperforms fluorination samples with CA of around 150°. The CA of sample 1 (L = 70 μm) is maximum in two surface modification methods, suggesting optimal hydrophobicity at lower micron protrusion spacing. This study suggests that the lesser efficacy of fluorination, compared to heat treatment, may be attributed to the incomplete adhesion on rough surfaces coupled with the reduction in surface energy conferred by heat treatment. Furthermore, the emergence of superhydrophobicity across various treatments underscores the innate superhydrophobic potential of the micron protrusion structure and LIPSS generated on these surfaces.
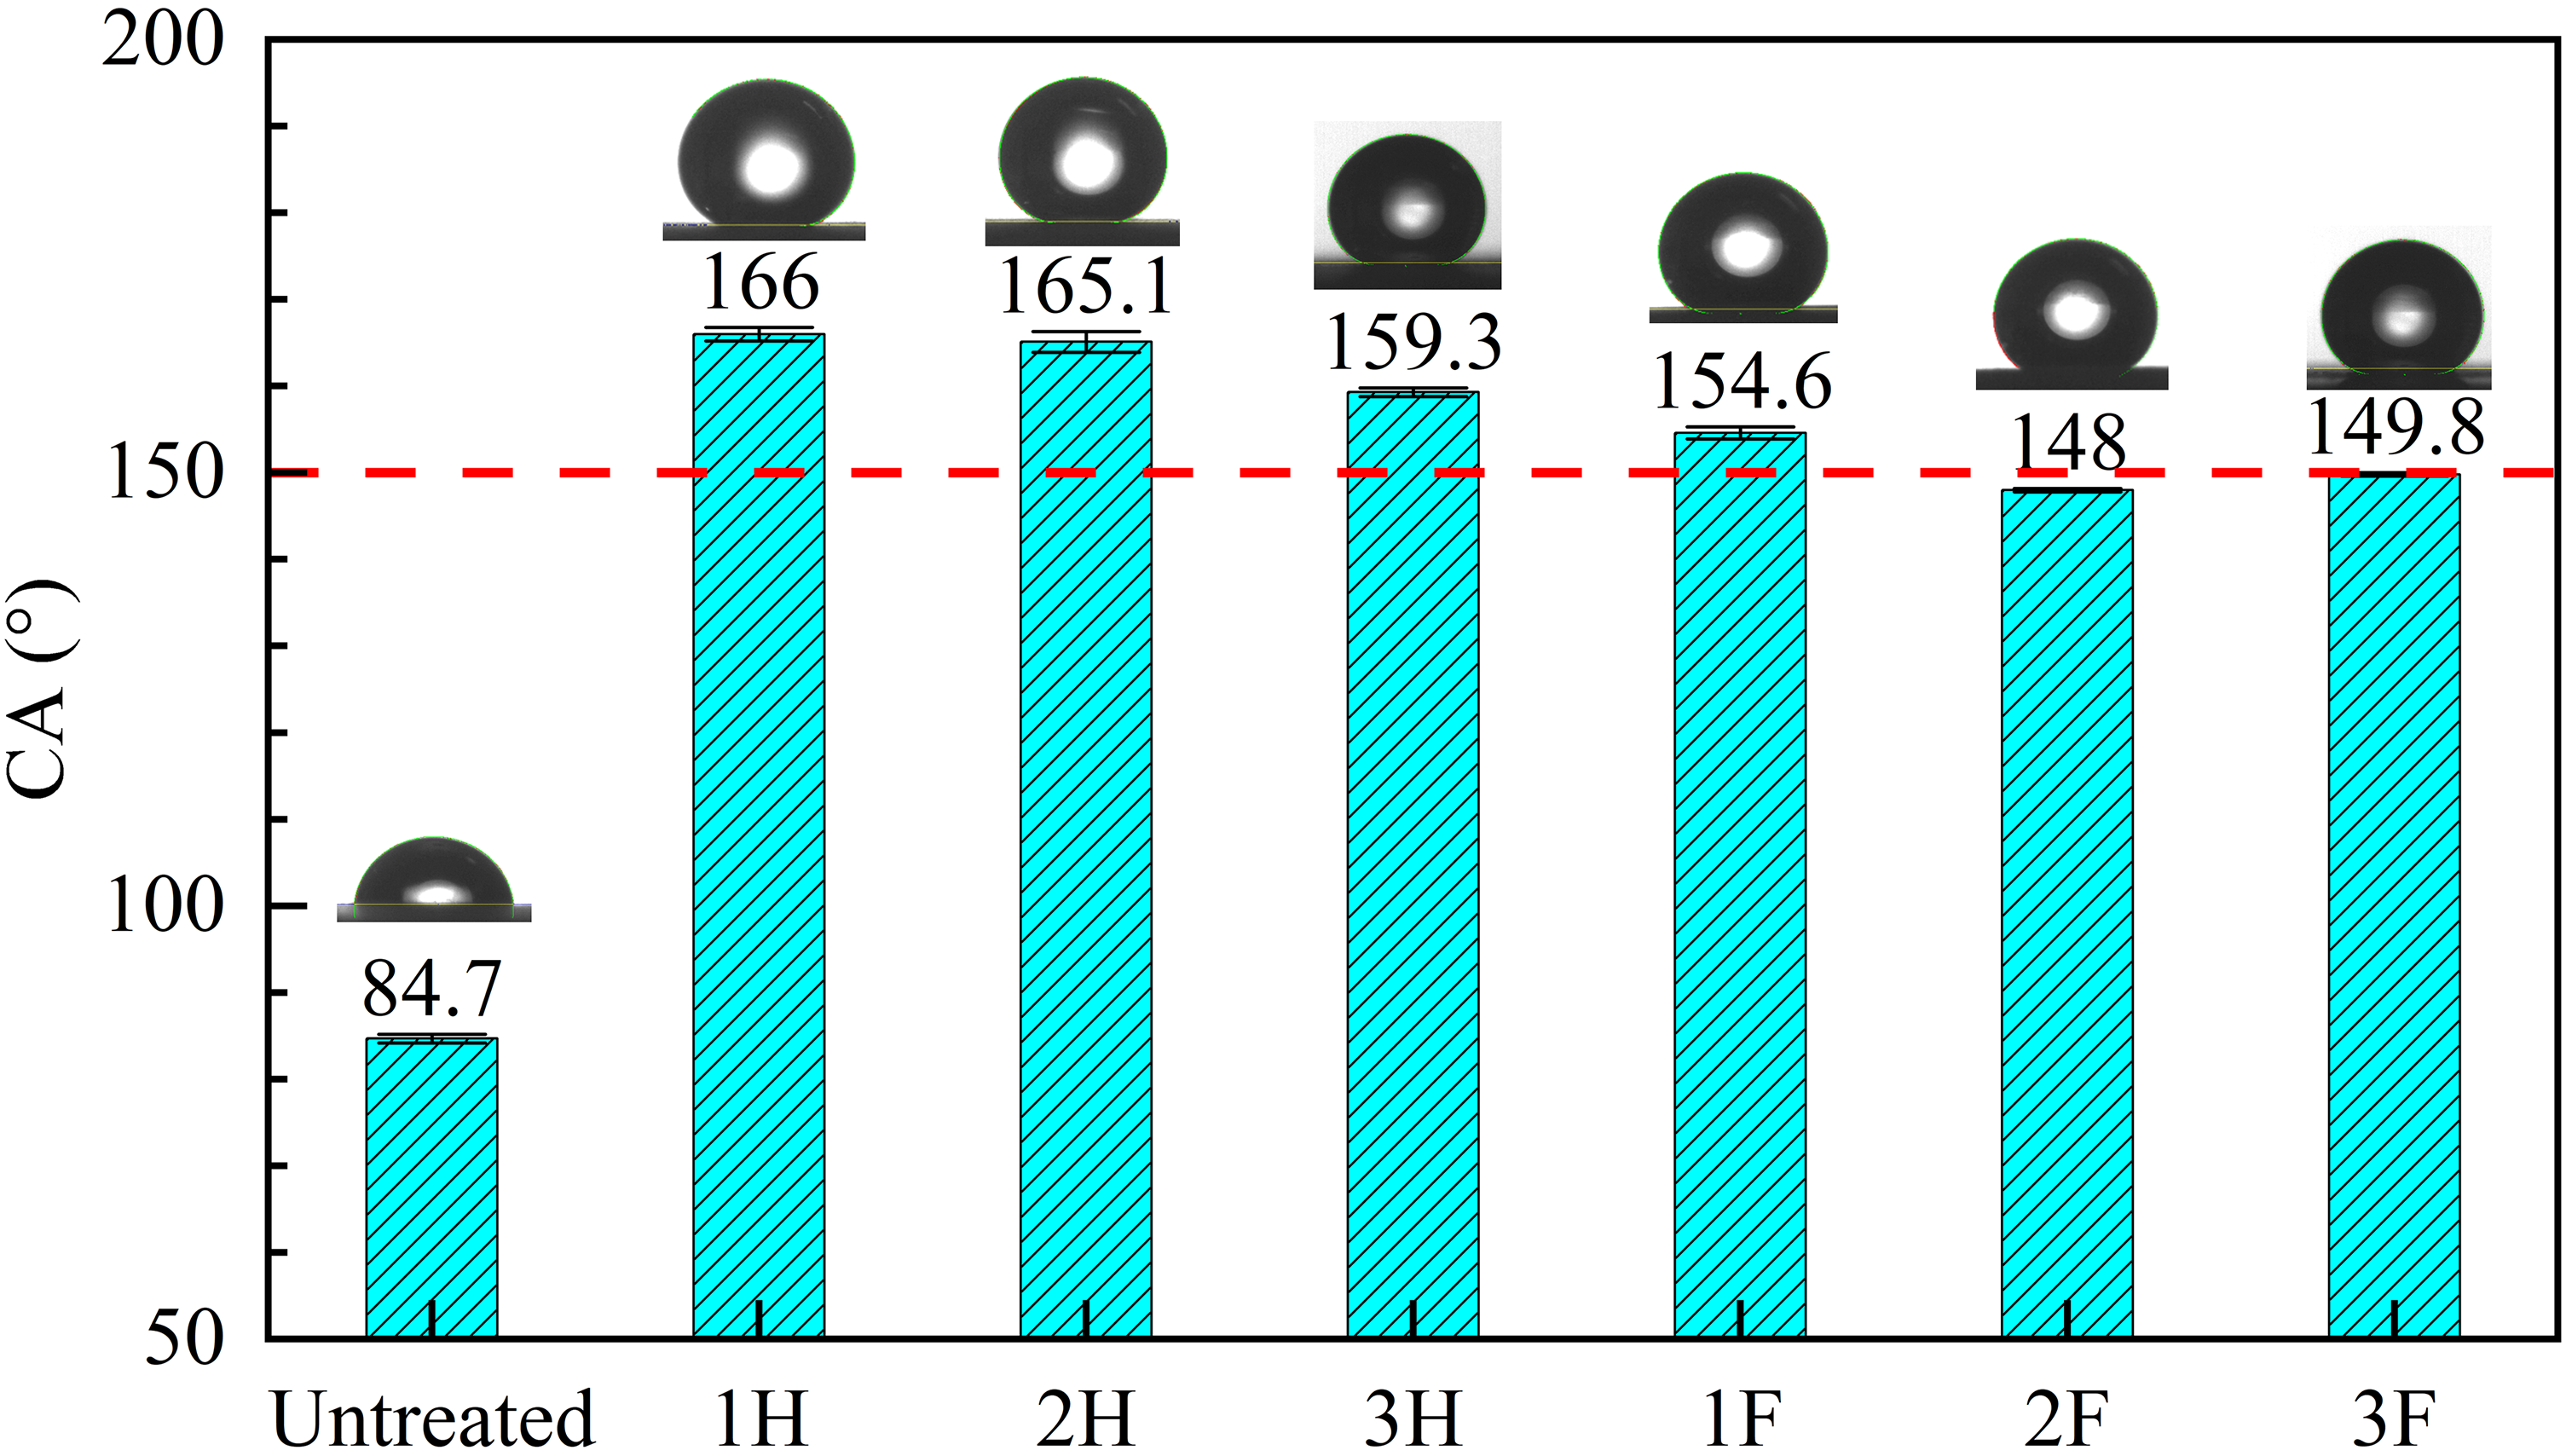
Contact angle.
The superhydrophobic properties of the surface are largely derived from the elemental composition and structure of the surface. In order to obtain specific information on the surface chemical composition, XPS analysis of the sample is required. Figure 7 shows the XPS spectra of sample 1 after heat treatment, fluorination treatment, and untreated sample (US). Based on this, some key elements were investigated, which are C 1 s, O 1 s, Cr 2p, F 1 s, Fe 2p. These peaks of the elements correspond to binding energies (BE) around 284, 530, 575, 685, and 707 eV, respectively. Figures 8–10 show the high-resolution spectra of these samples. Table 3 shows the mass scores of these elements.
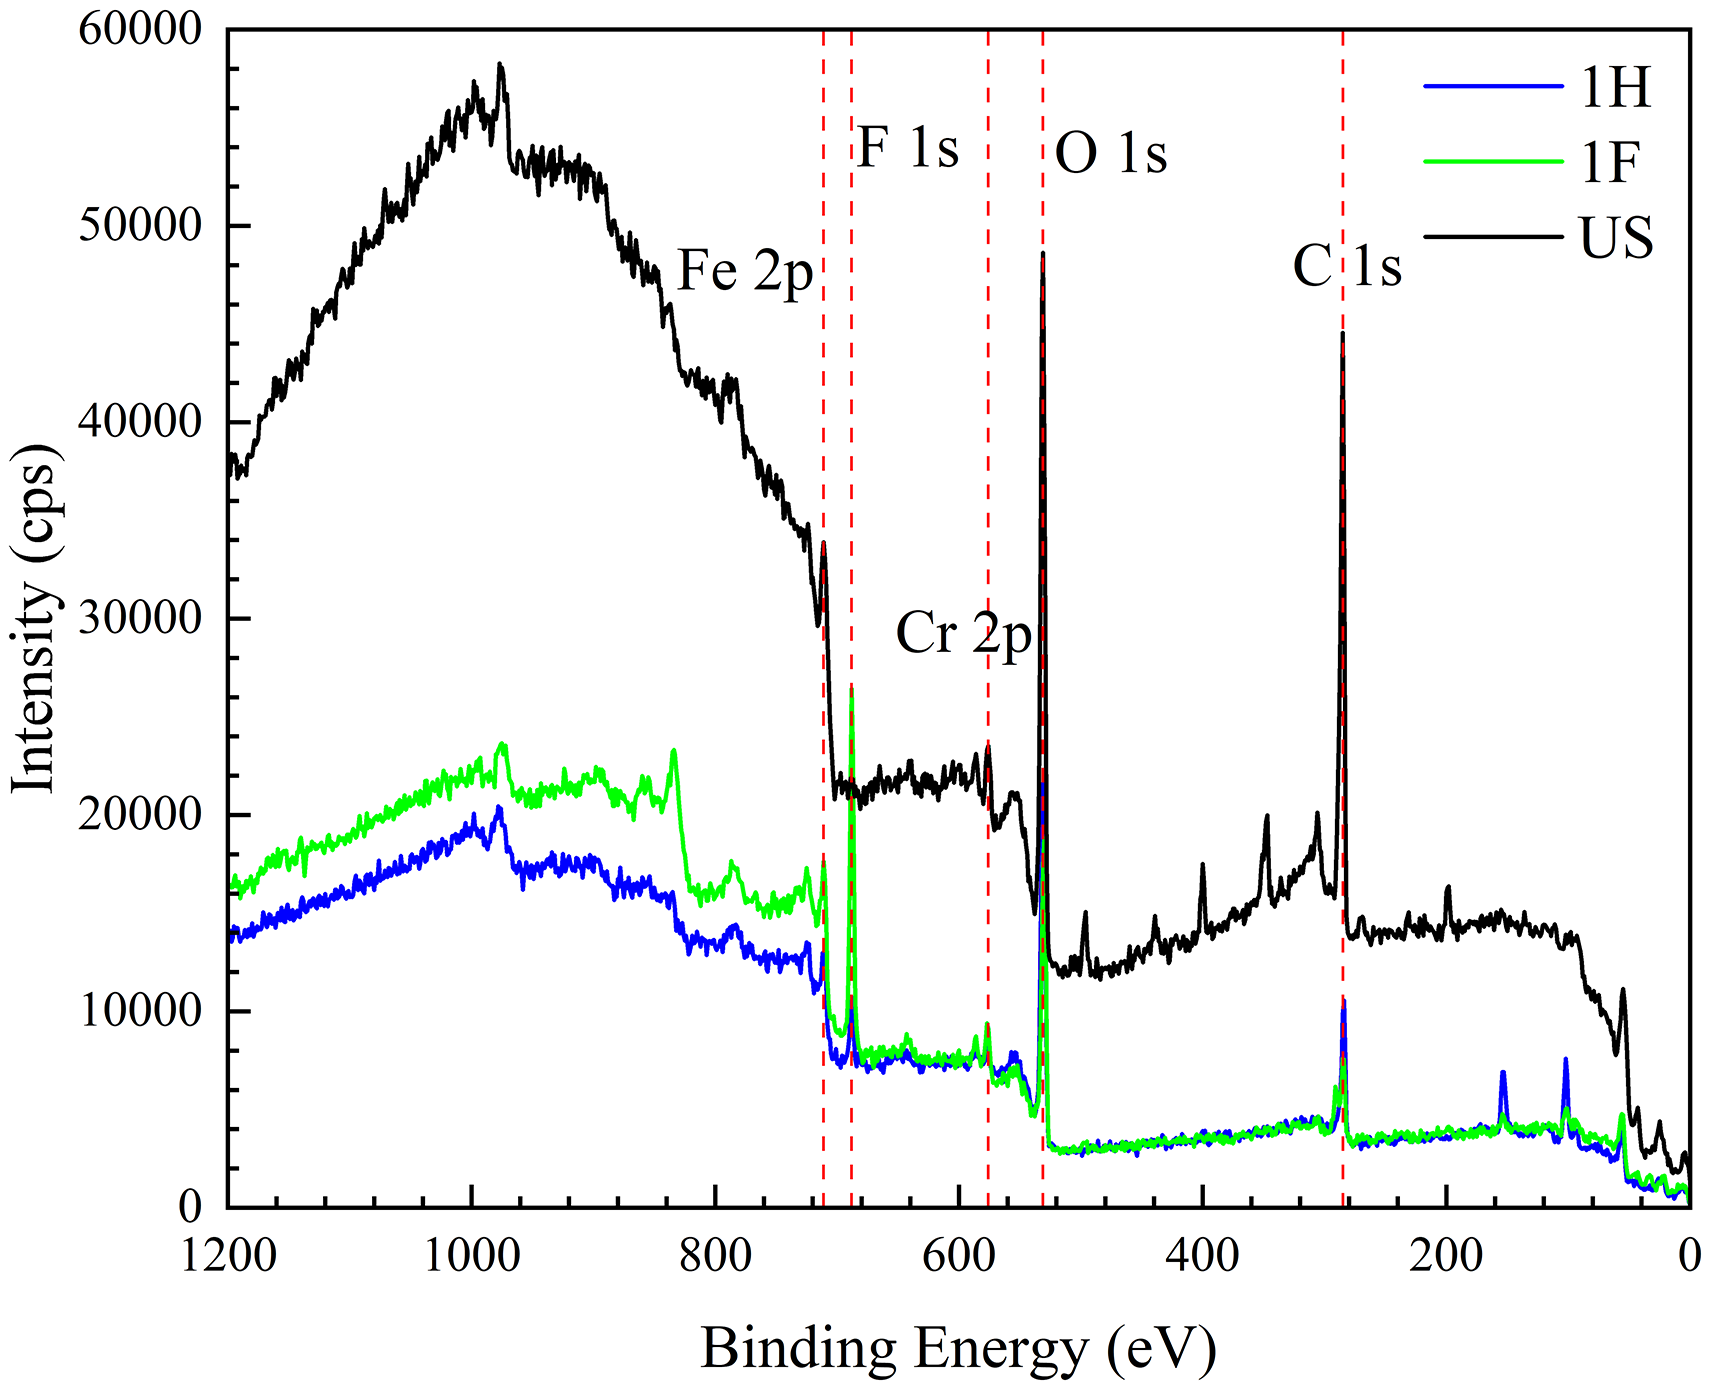
Full XPS spectrum of 1H, 1F and original smooth surface.
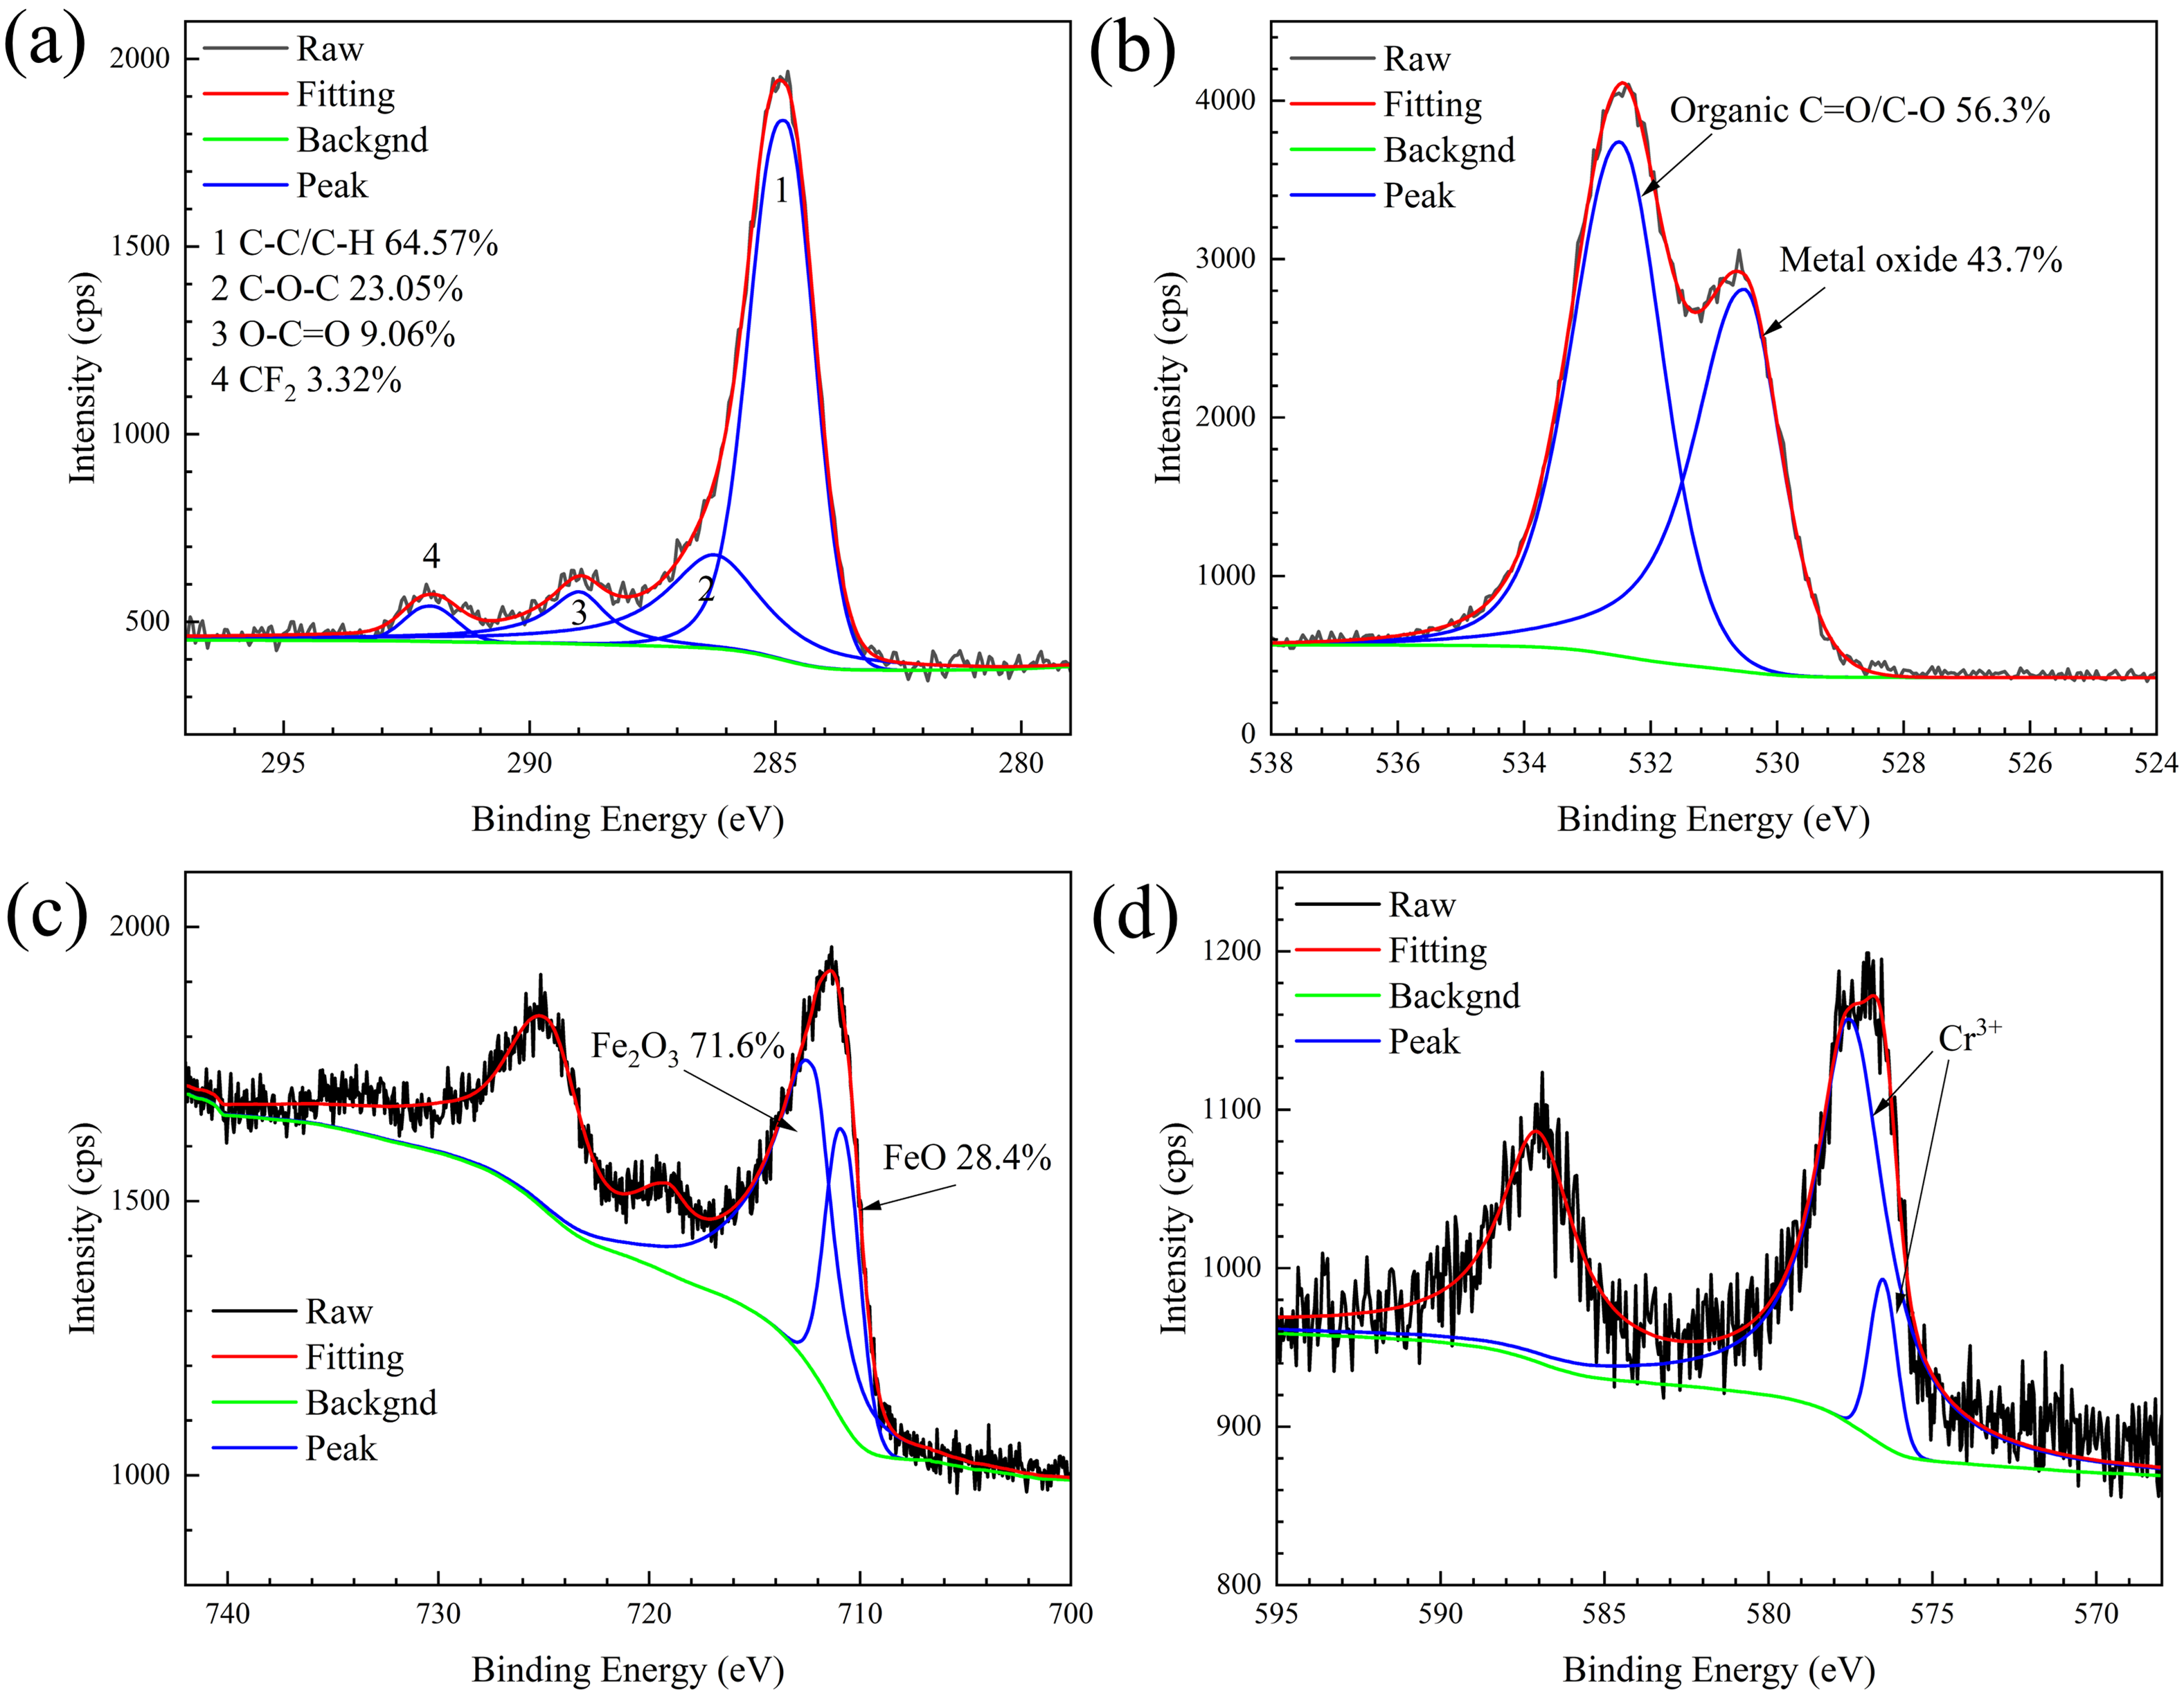
High resolution spectrum of sample 1H (a) C1 s (b) O1 s (c) Fe2p (d) Cr2p.
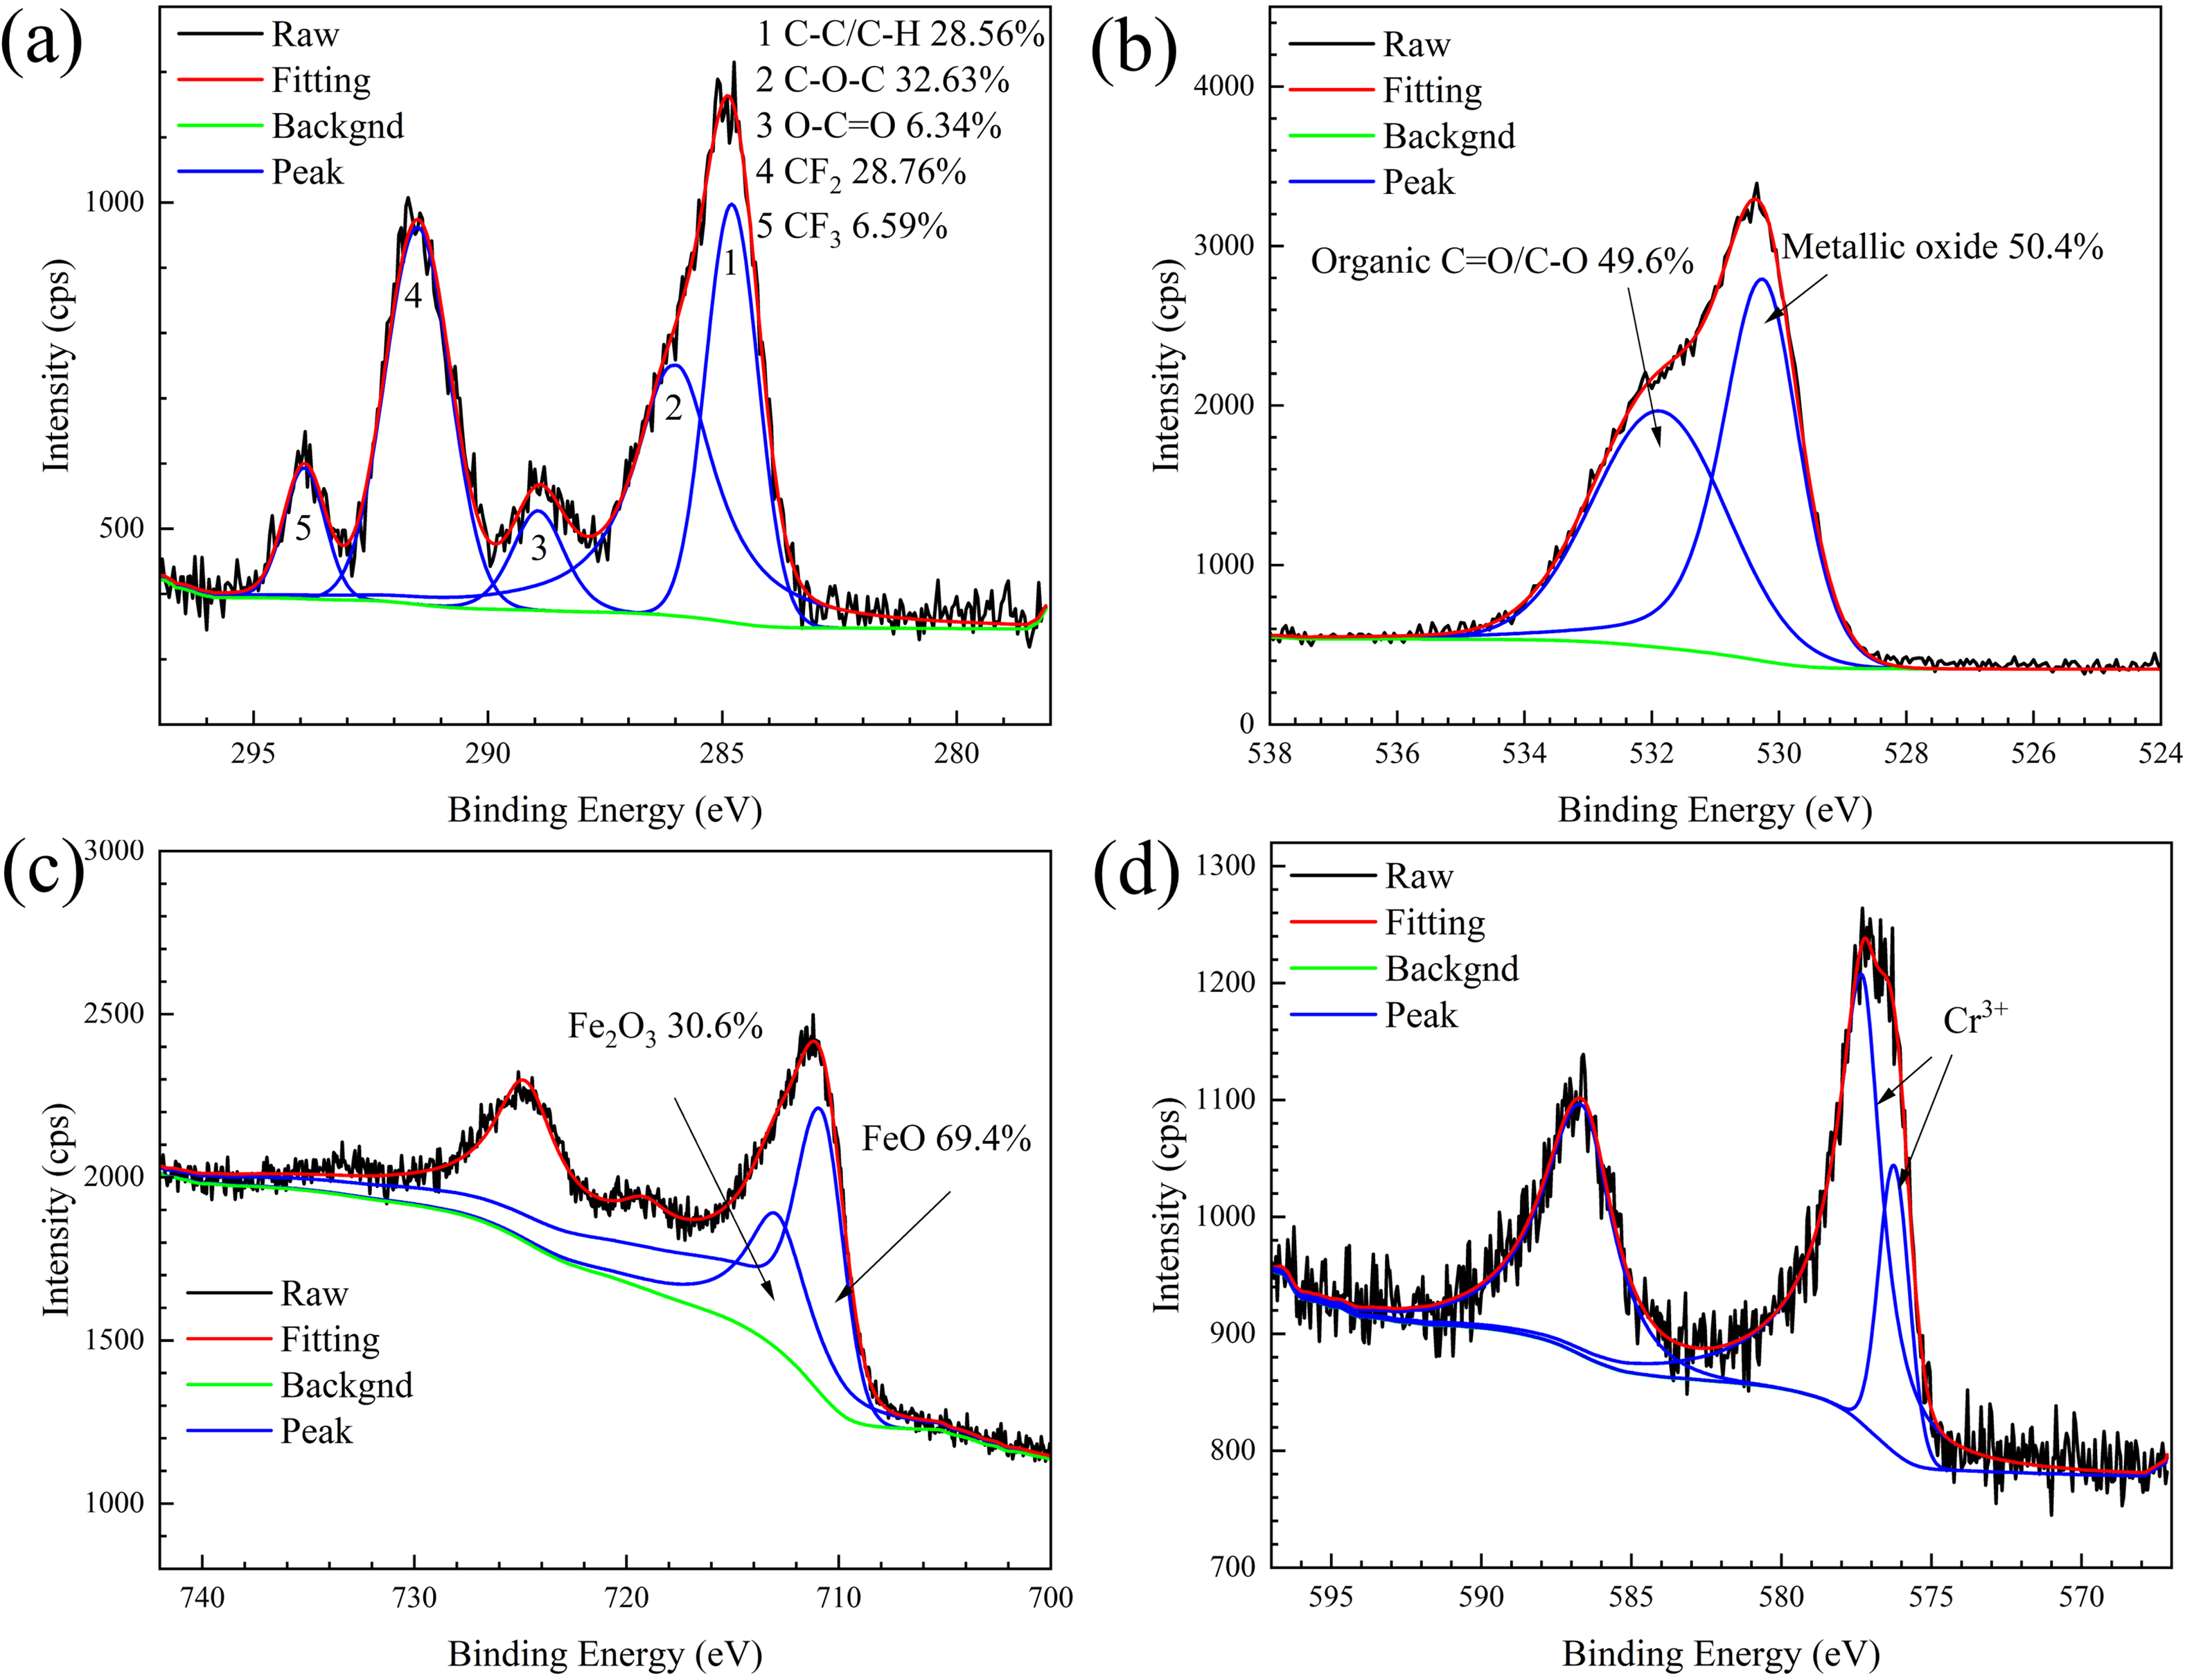
High resolution spectrum of sample 1F (a) C 1 s (b) O 1 s (c) fe 2p (d) cr 2p.
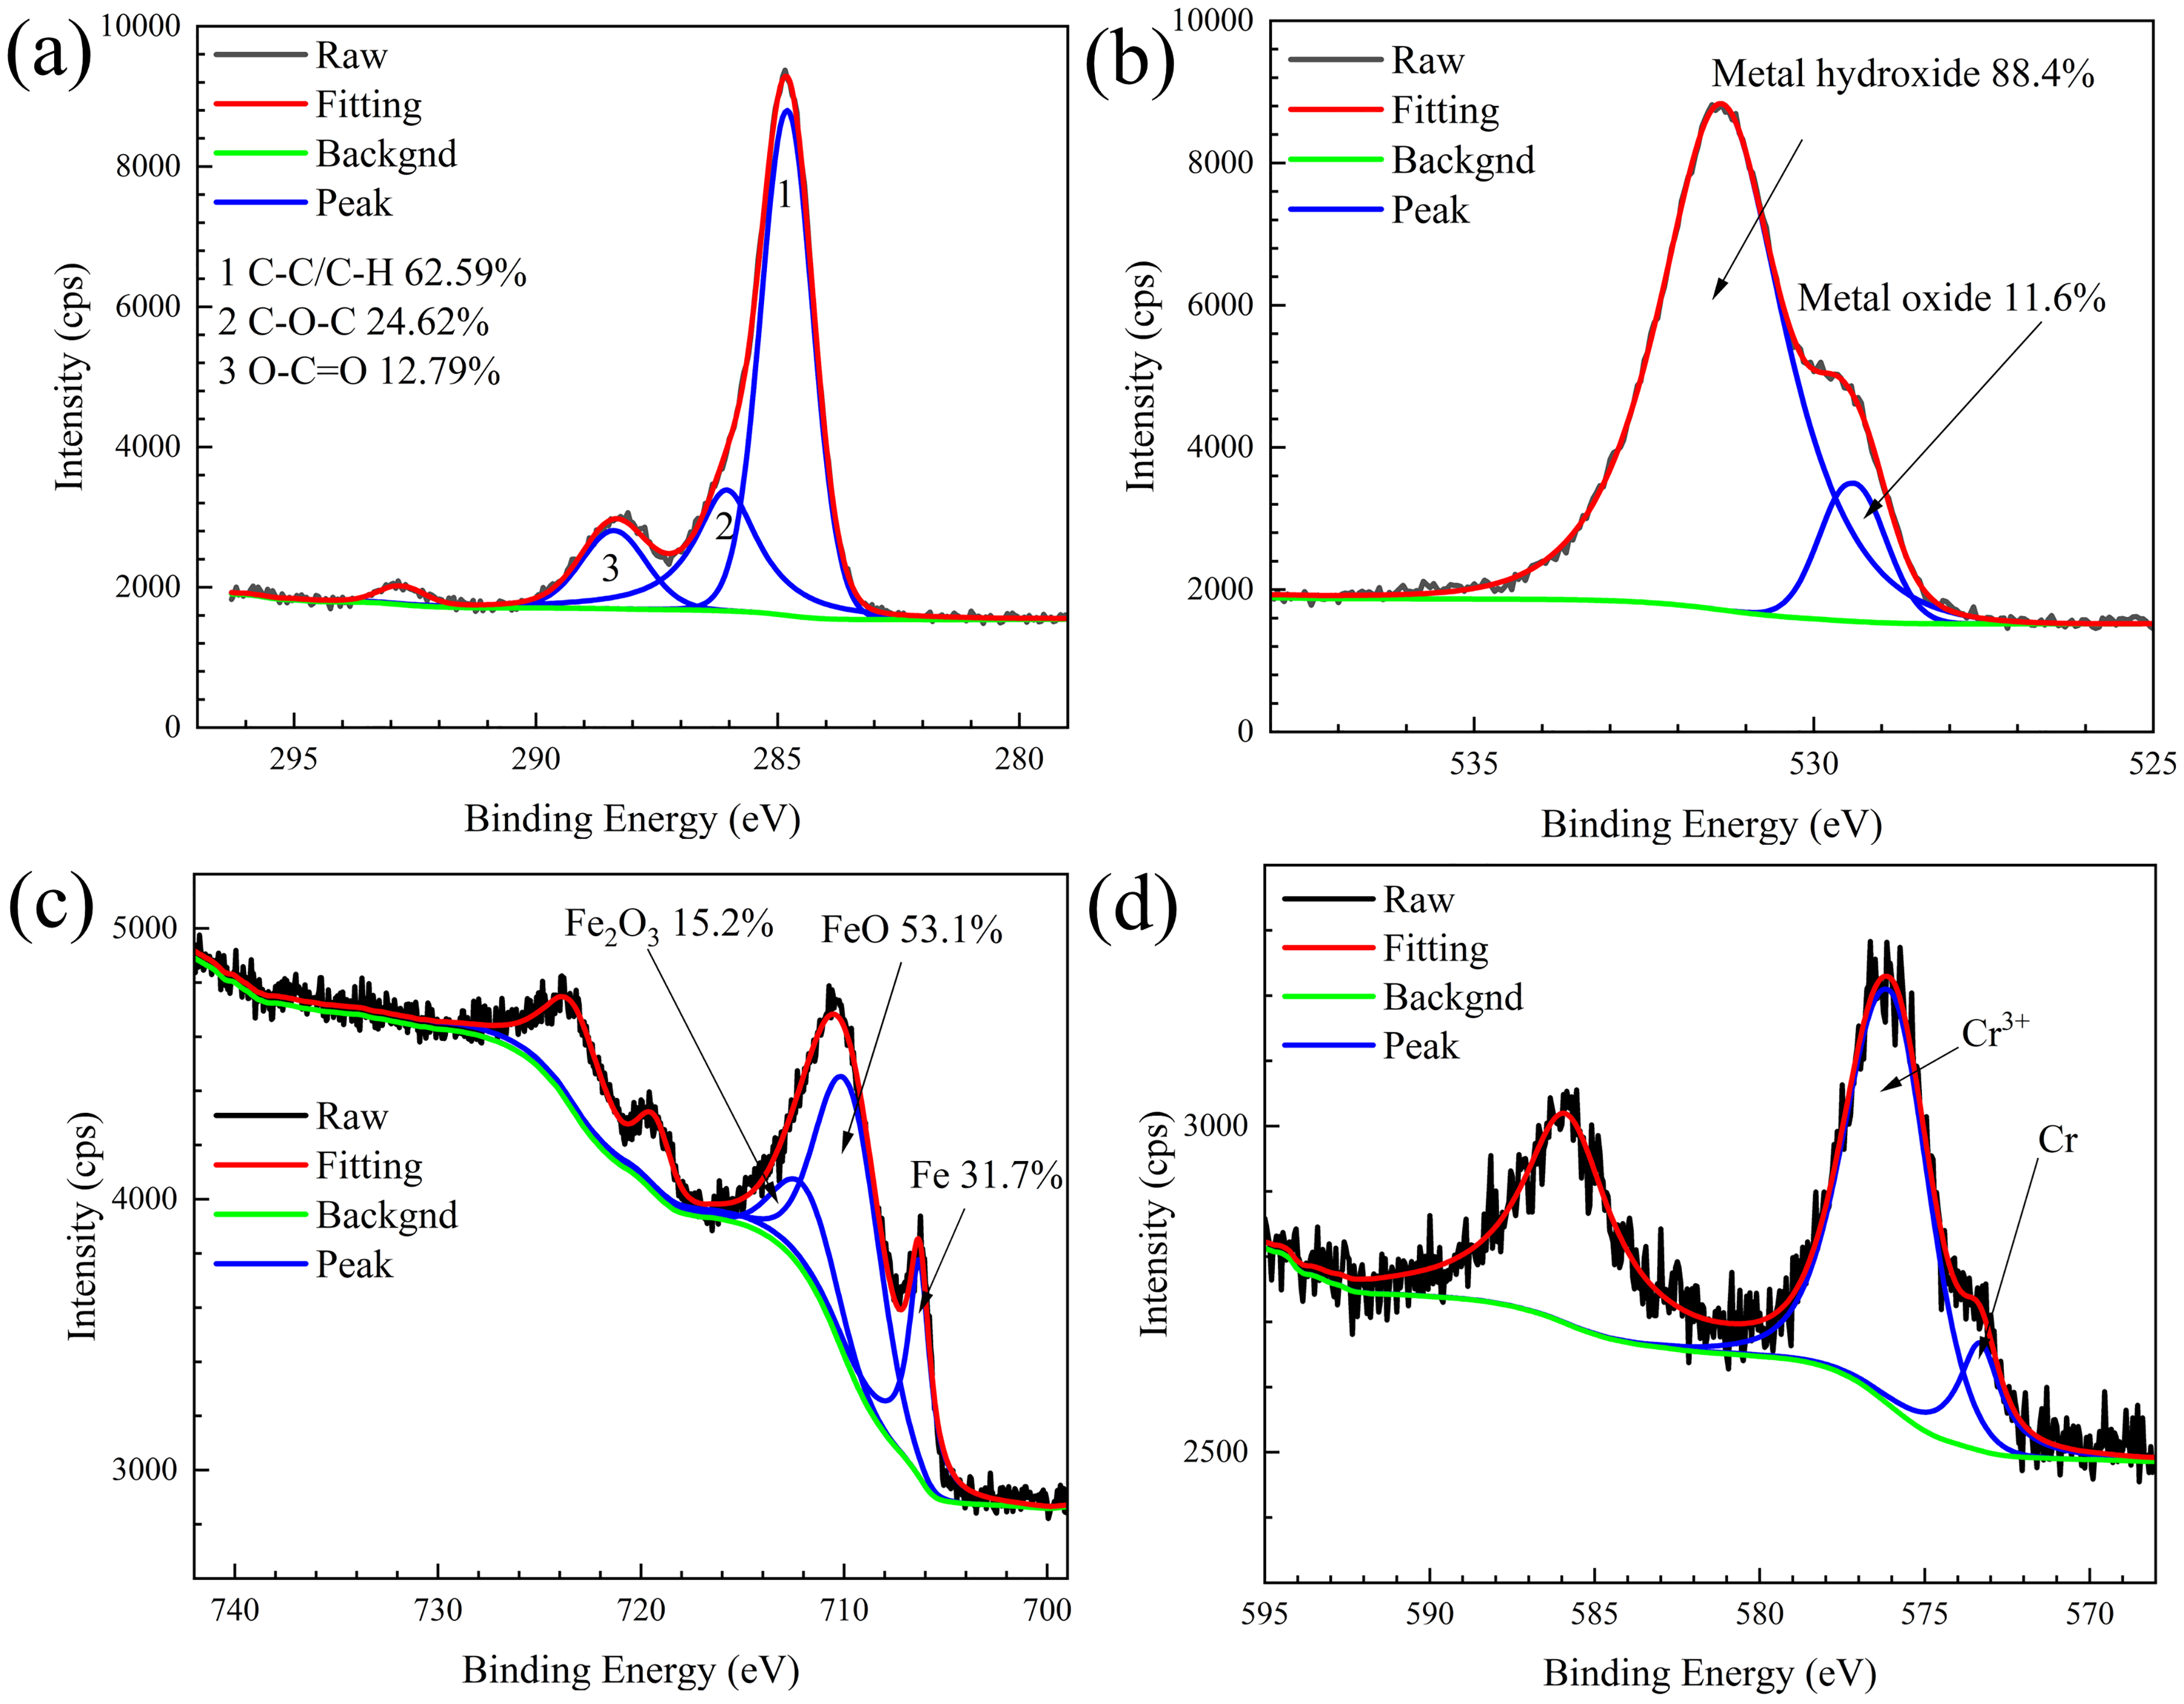
High resolution spectrum of original sample (a) C 1 s (b) O 1 s (c) fe 2p (d) cr 2p.
Chemical composition of 316L stainless steels (wt %).
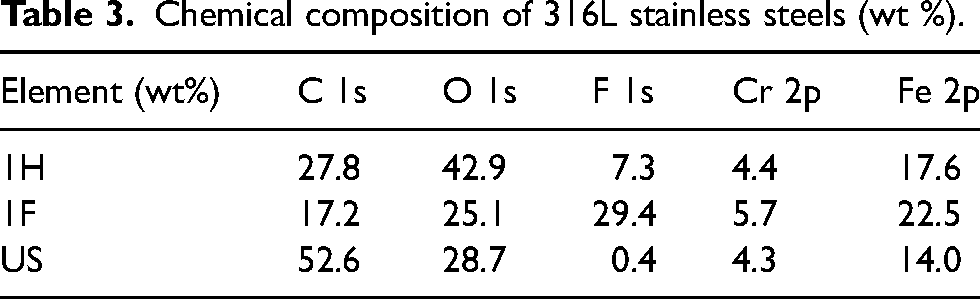
Obviously, the surface composition of these three samples is inconsistent. The original surface has a higher C 1 s content and a lower O1 s content. In contrast, the composition changes after heating, and the content of O 1 s increases significantly, while the fluorinated treated sample has a higher content of F 1 s. The extremely high carbon content on the surface indicates that it may come from external pollution carbon, which may come from the adsorption of organic compounds and the decomposition of CO2 in the air.37,38 To continue analyzing the composition of the C element, the high-resolution spectrum of C 1 s was subjected to peak fitting, as shown in Figures 8–10. The peaks separated around 284.8, 286, and 28.5 eV correspond to possible groups such as alkyl (C-C), ether (C-O-C), and carboxyl/ester substances (O-C = O). The peaks separated around 292 and 294 eV may correspond to CF2 and CF3. The peak corresponding to 293 eV in Figure 10 is unknown and may be CF2, but it is not critical. It is noted that the high-resolution C 1 s spectra of the heat-treated samples have a similar proportion to the original samples, and apart from the difference in whether they were laser ablated or not, they have hardly come into contact with any other substances. The result indicates that the adsorption of carbon containing organic compounds on the surface of the specimens is a common phenomenon39–41. Although these attached organic compounds can effectively enhance hydrophobicity, the adsorption of carbon containing organic compounds on the surface is not sufficient to explain the significant changes in their hydrophobicity.
In the XPS full spectrum of the heat-treated sample, the content of O 1 s was 42.9%. In the high-resolution spectrum of O 1 s, the two peaks separated at 530 and 532.5 eV correspond to metal oxides and C-O/C = O organic compounds (or can be further separated), respectively. Among them, the proportion of metal oxides was 43.7%, which was significantly different from the original sample. There is a significant difference in the peak fitting of Fe 2p and Cr 2p between the two. The original sample has peaks at 706.7 and 574.3 eV, representing Fe metal and Cr metal, respectively; The peaks near 710, 711, and 576 eV correspond to Fe2 + (mainly FeO), Fe3 + (mainly Fe2O3), and Cr3 + (mainly Cr2O3), respectively. 42 The above indicates that the degree of oxidation on the ablated surface is greater, and this difference suggests that it helps to improve hydrophobicity. In fact, metal oxides contribute to the adsorption of atmospheric organic matter, and the increase in surface oxides during heat treatment can effectively adsorb atmospheric organic matter and maintain superhydrophobicity.43,44
For fluorinated samples, due to the attachment of hydrophobic agent molecules, an obvious peak of F1 s is displayed in the XPS full spectrum at Figure 9. The full spectrum of C1 s shows that a large number of CF2 and CF3 functional groups are attached to the surface, both of which are part of hydrophobic organic molecules. Therefore, the superhydrophobicity of fluorinated samples mainly comes from the attachment of fluorinated organic compounds.
Corrosion performance
Polarization curve
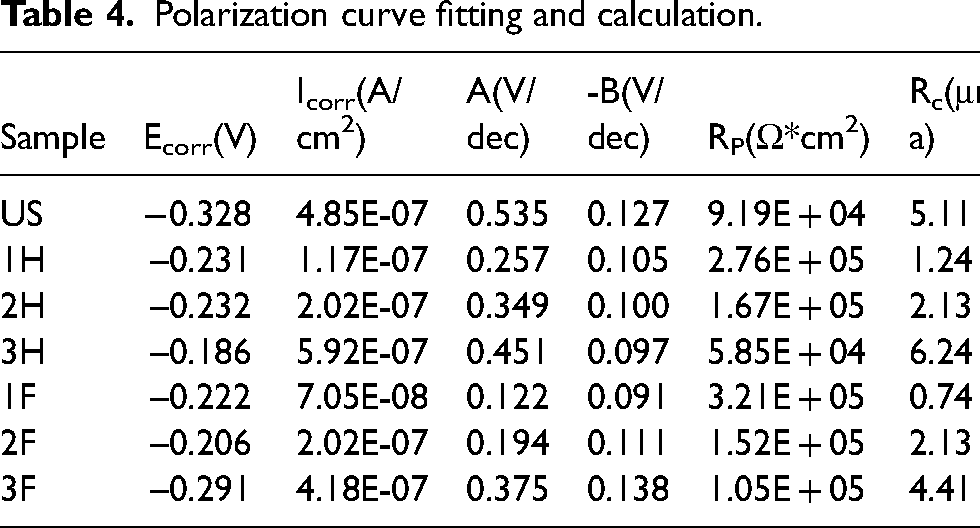
Conduct polarization curve measurements on surfaces following hydrophobic treatment. Figure 11(a) and 11(b) presents the polarization curves for both processed and smooth surfaces subjected to heat and fluorination treatments. The parameters derived from these polarization curves are detailed in Table 4. The corrosion potential and corrosion current density are obtained by the anodic and cathodic curves intersect at the free corrosion potential, where A and B are the slopes of the anodic and cathodic curves, respectively. The polarization resistance 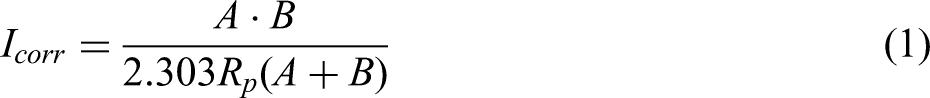
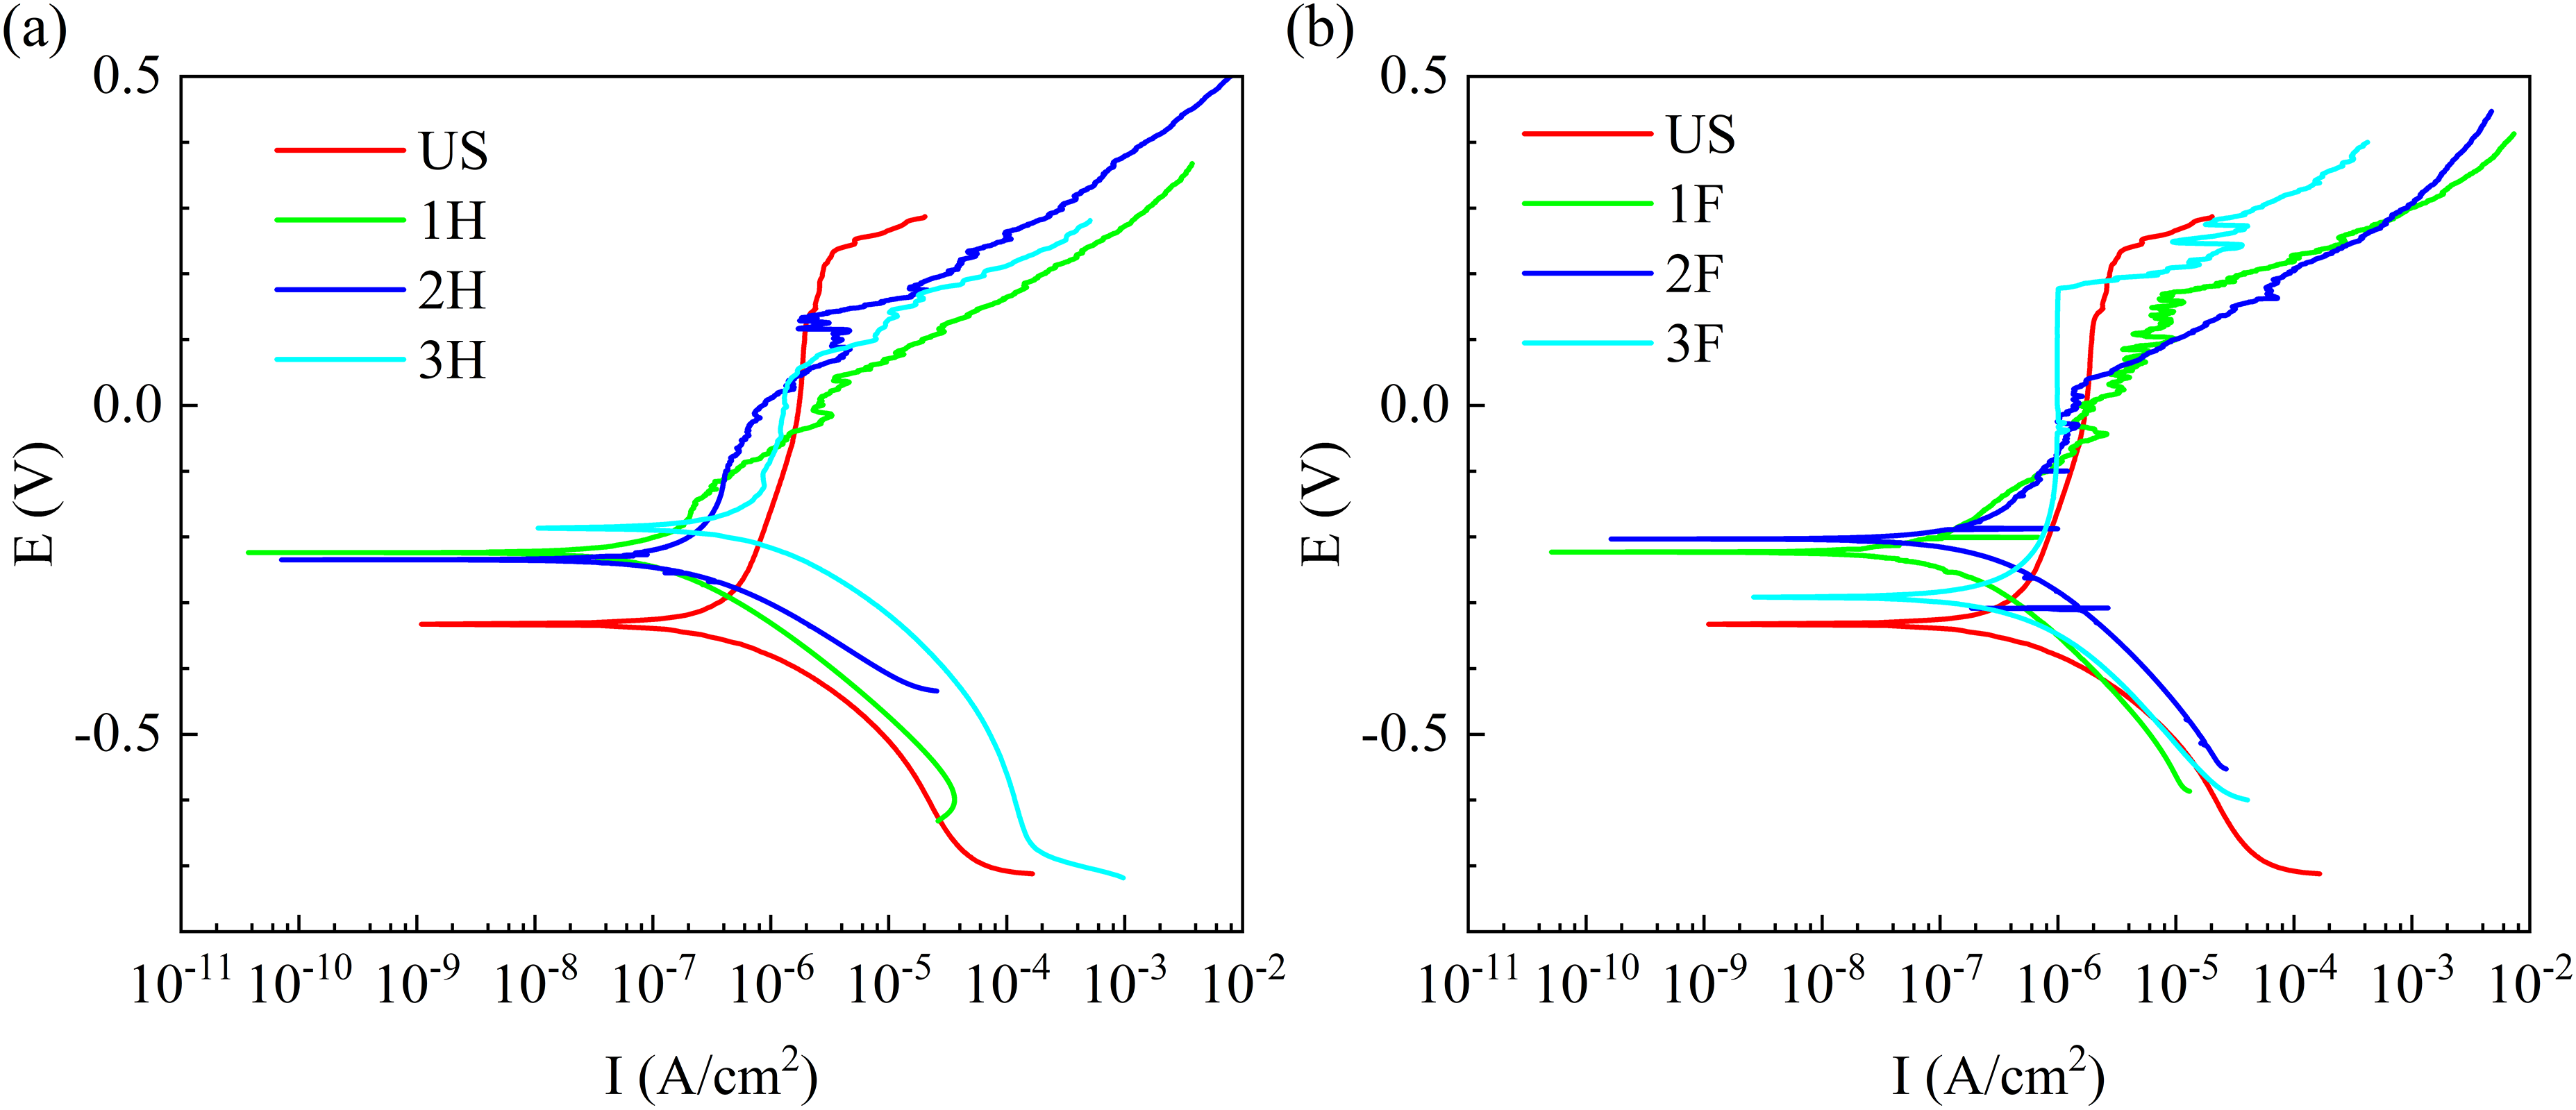
Polarization curve (a) heat treatment (b) fluorination treatment.
Polarization curve fitting and calculation.
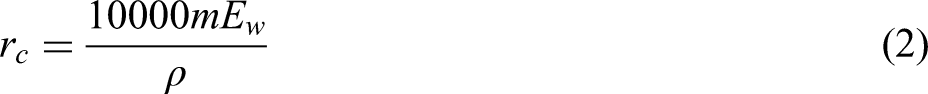
The corrosion rate is calculated as
46
Generally, higher polarization resistance and free corrosion potential, or smaller free corrosion current, exhibit better corrosion resistance performance. Figure 11 shows the polarization curves of the samples treated with two methods and the untreated samples, while Table 3 shows the results calculated based on the polarization curves. The untreated surface has the lowest self-corrosion potential, which is −0.328 V. And all laser processed surfaces have higher self-corrosion potentials, most of them are between −0.24 to −0.24 V, where sample 3H has the maximum self-corrosion potential of −0.186 V. The above results suggest that the micro-nanostructure and hydrophobic properties can significantly improve the corrosion resilience of 316 L austenitic stainless steel. In addition, the self-corrosion current of all superhydrophobic surfaces is smaller than that of the original specimen, where sample 1F has the minimum self-corrosion current of 7.05E-08 A, which effectively reduces the corrosion rate. The above results suggest that the micro-nanostructure and hydrophobic properties can significantly improve the corrosion resistance of 316L austenitic stainless steel, and the calculated polarization resistance also confirms this point. However, the passivation range of hydrophobic surfaces is smaller than that of polished surfaces, which may indicate that the oxide film formed by laser ablation has some defects. Overall, superhydrophobic samples exhibit an enhancement in corrosion resistance. Comparing the polarization resistance of the two processed samples, the sample treated with fluoride has a higher polarization resistance, indicating that fluoride treatment exhibits better corrosion resistance in the test of dynamic potential scanning experiments. Furthermore, according to the polarization resistance, it can be observed that superhydrophobic surfaces with smaller protrusion spacing have better corrosion resistance.
Figures 12 and 13 show the polarization curves of samples 1H and 1F for 0 h, 24 h, and 48 h in the test solution of 3.5% wt NaCl, respectively. In Figure 12, the polarization curve shows a significant upward shift, indicating that the self-corrosion potential is increasing while the self-corrosion current remains essentially unchanged. In addition, the polarization curves at 24 h and 48 h show an extremely high overlap, indicating that sample 1H has stable superhydrophobicity and corrosion resistance in solution. As shown in Figure 13, the polarization curves after soaking for 24 h and 48 h show a lower self-corrosion potential of about −0.29 V and a slight decrease in self-corrosion current. Although these two are almost overlapping and stable, the hydrophobicity and corrosion resistance of the sample have decreased after fluorination. Finally, the infiltrated samples all have longer passivation intervals, and the passivation interval of the sample after 48 h cannot even be fully measured. It is assumed that the sample is partially infiltrated with superhydrophobic structures, causing the measured samples to exhibit metallic properties.
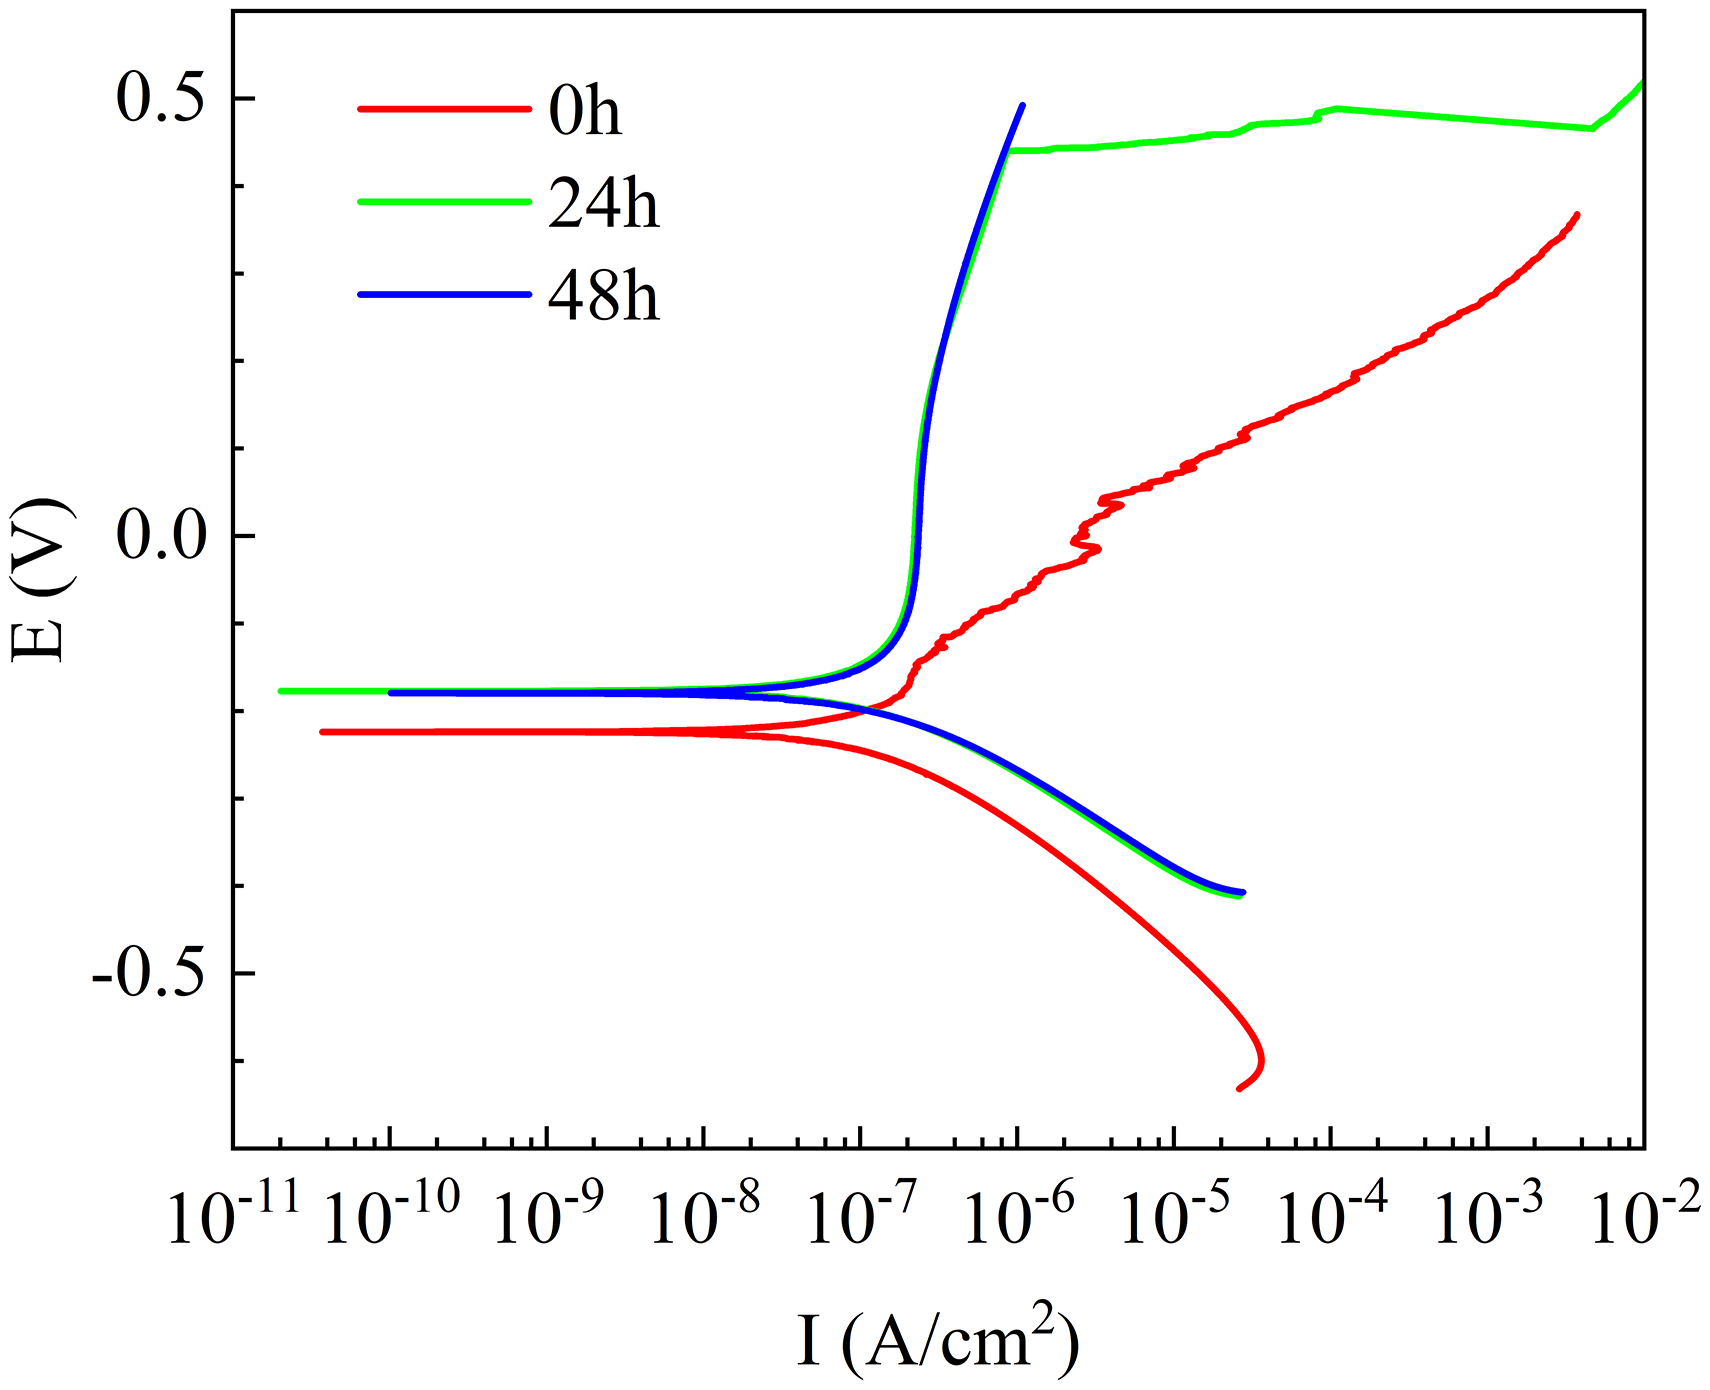
Polarization curves of samples 1H for 0 h, 24 h, and 48 h in the test solution of 3.5% wt NaCl.
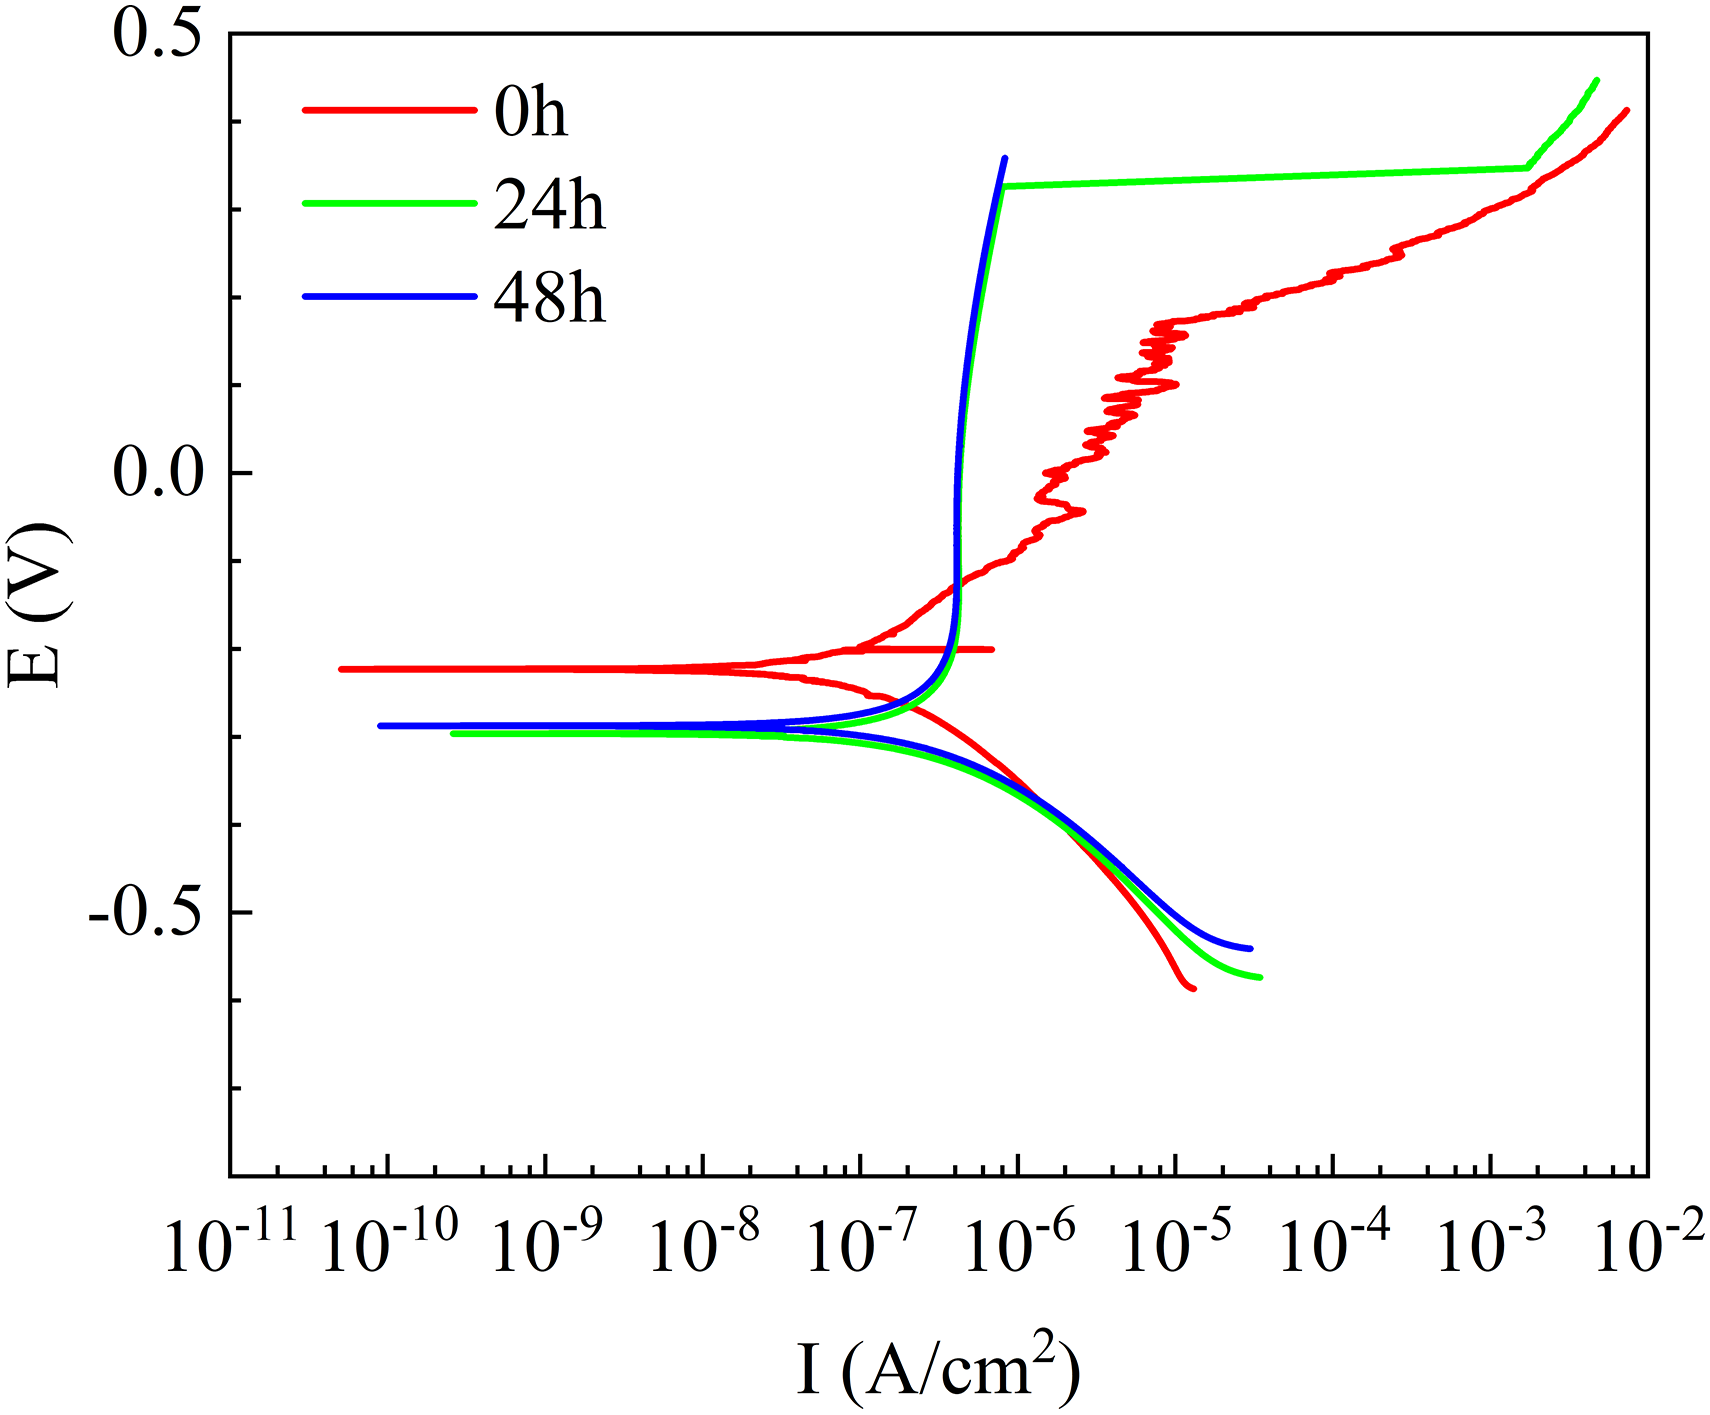
Polarization curves of samples 1F for 0 h, 24 h, and 48 h in the test solution of 3.5% wt NaCl.
Impedance
Figure 14 displays the impedance spectrum, where Figure 14(a)–14(c) represent the Nyquist plot and the Bode plots for impedance modulus and phase angle of the heat-treated samples, respectively, while Figure 14(d)–14(f) illustrate the same for fluorinated samples. Figure 15 shows the equivalent circuit obtained from fitting.
39
Within those circuits, the element Q represents a Constant Phase Element (CPE), and the impedance of element Q is described as
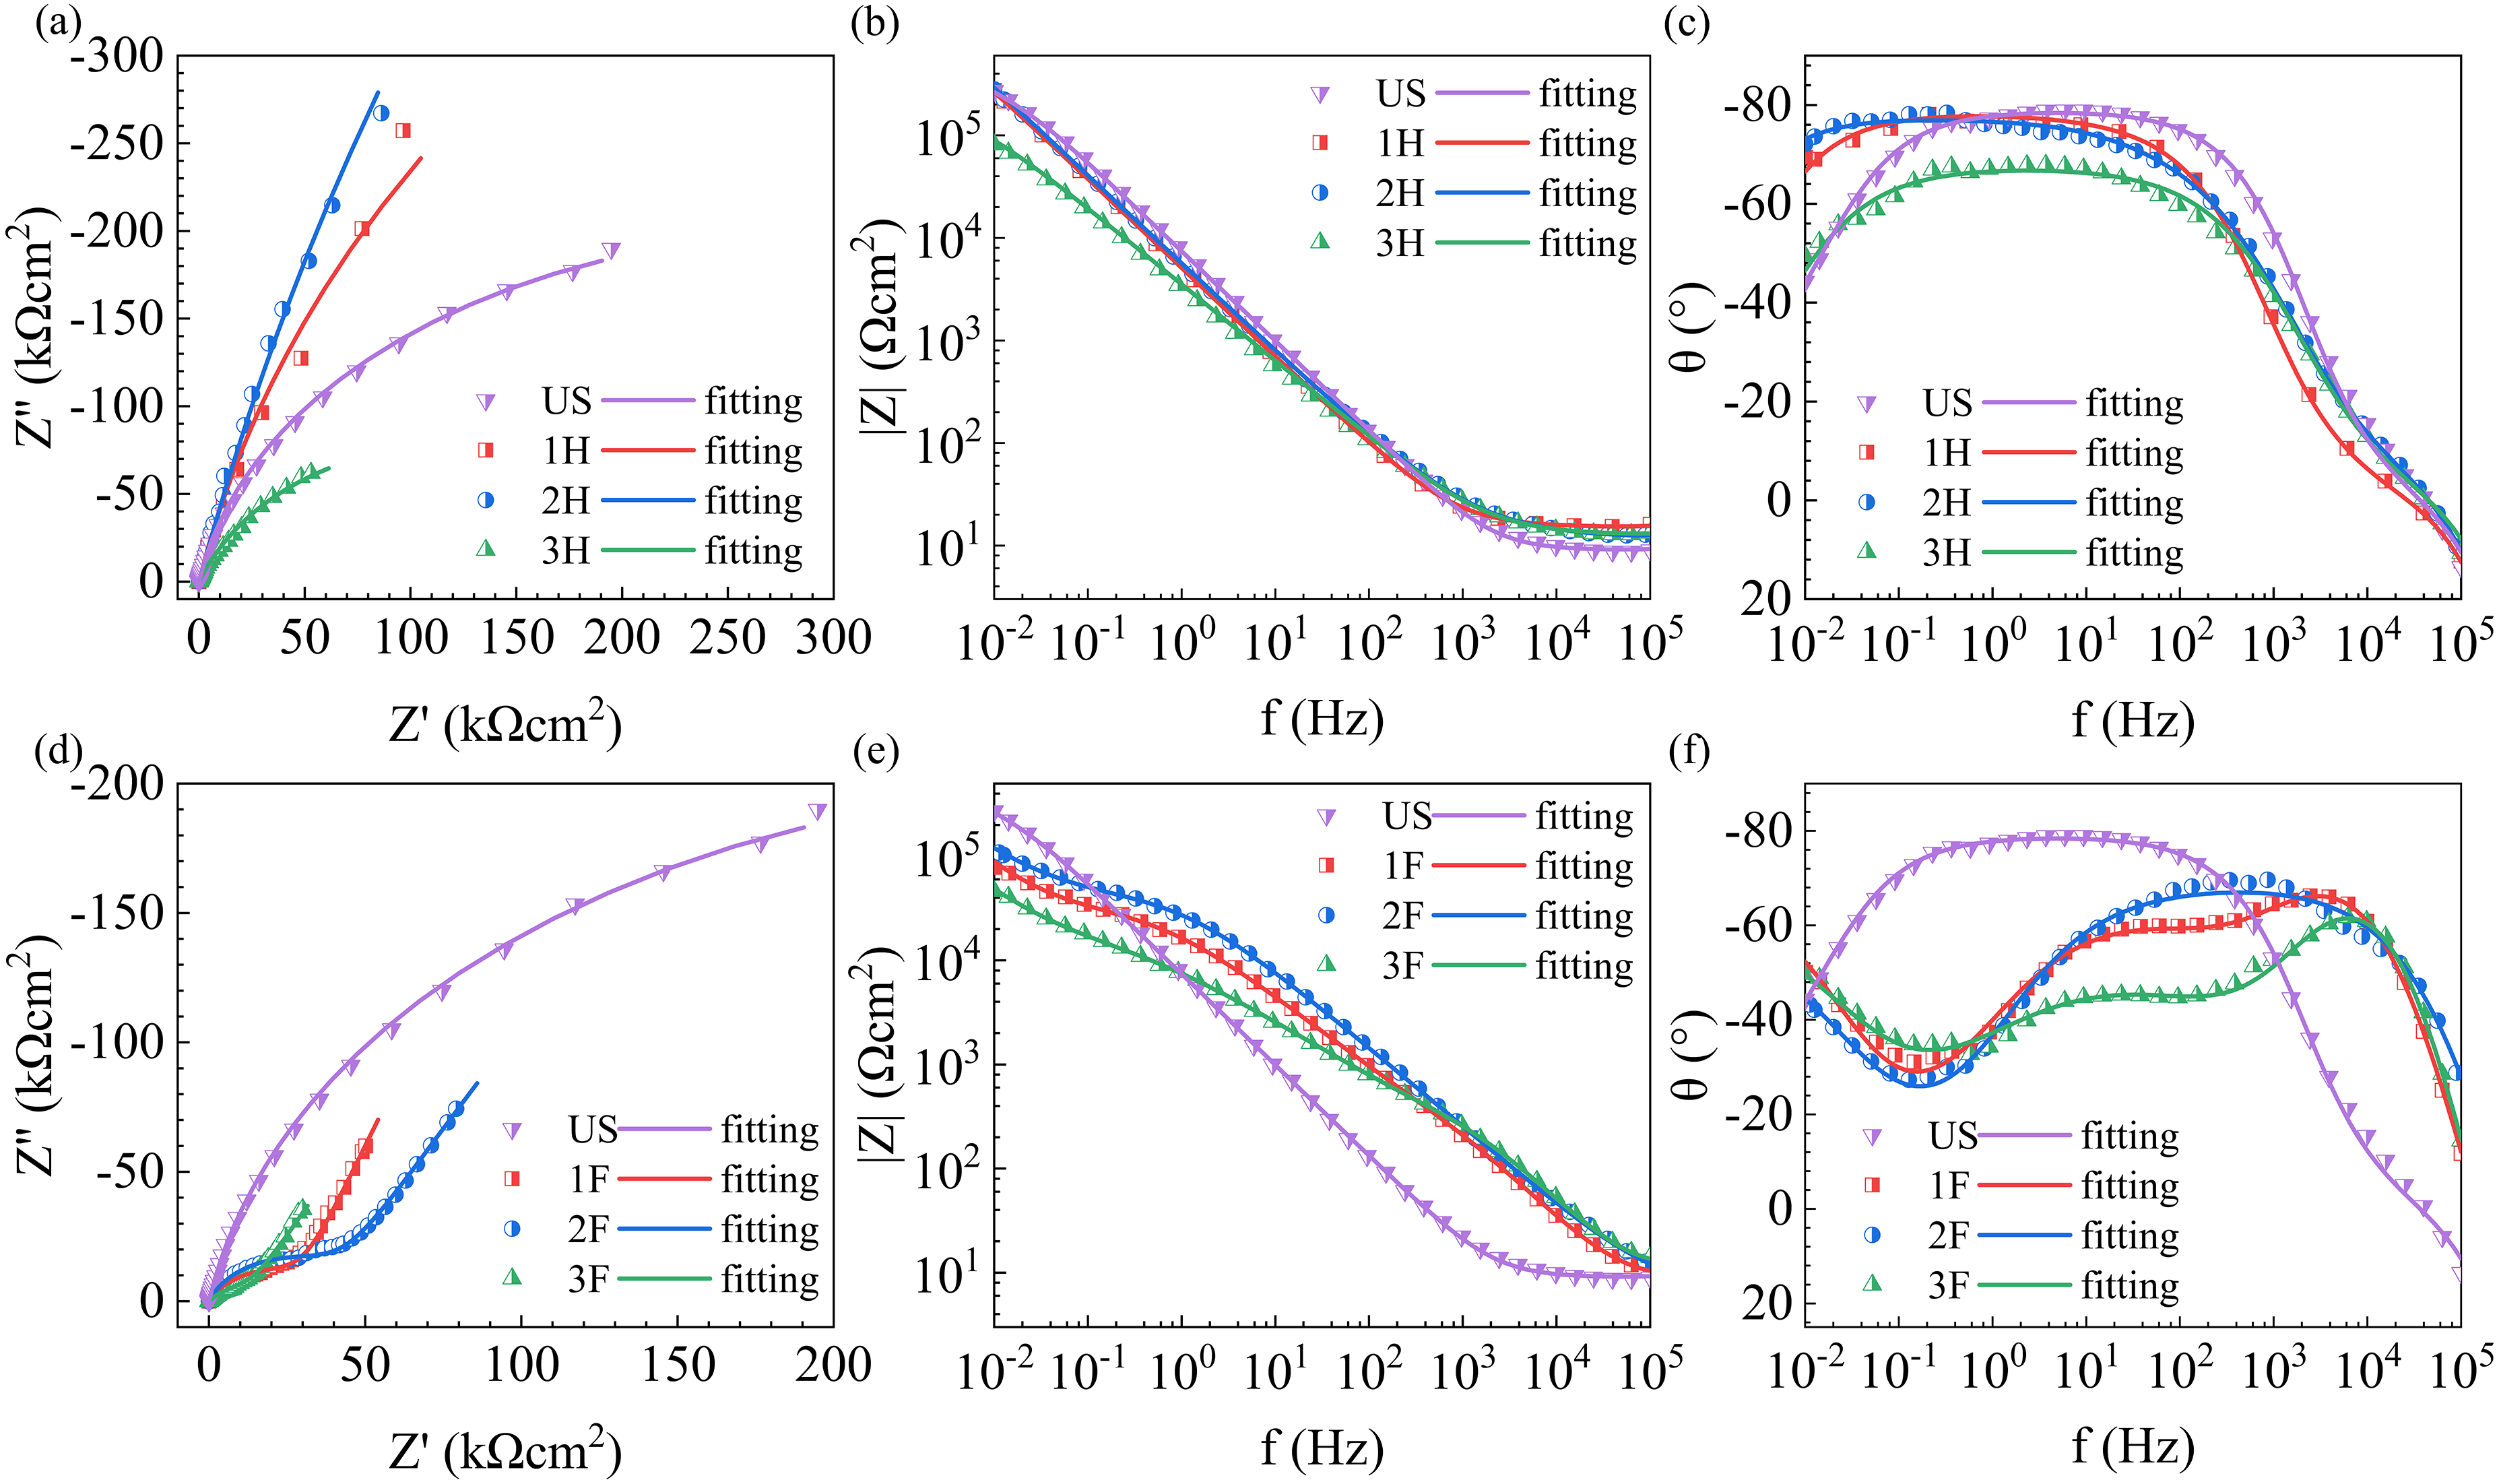
Impedance of the samples with heat treatment (a, b, c) and the samples with fluoridization (d, e, f) compared to untreated samples.
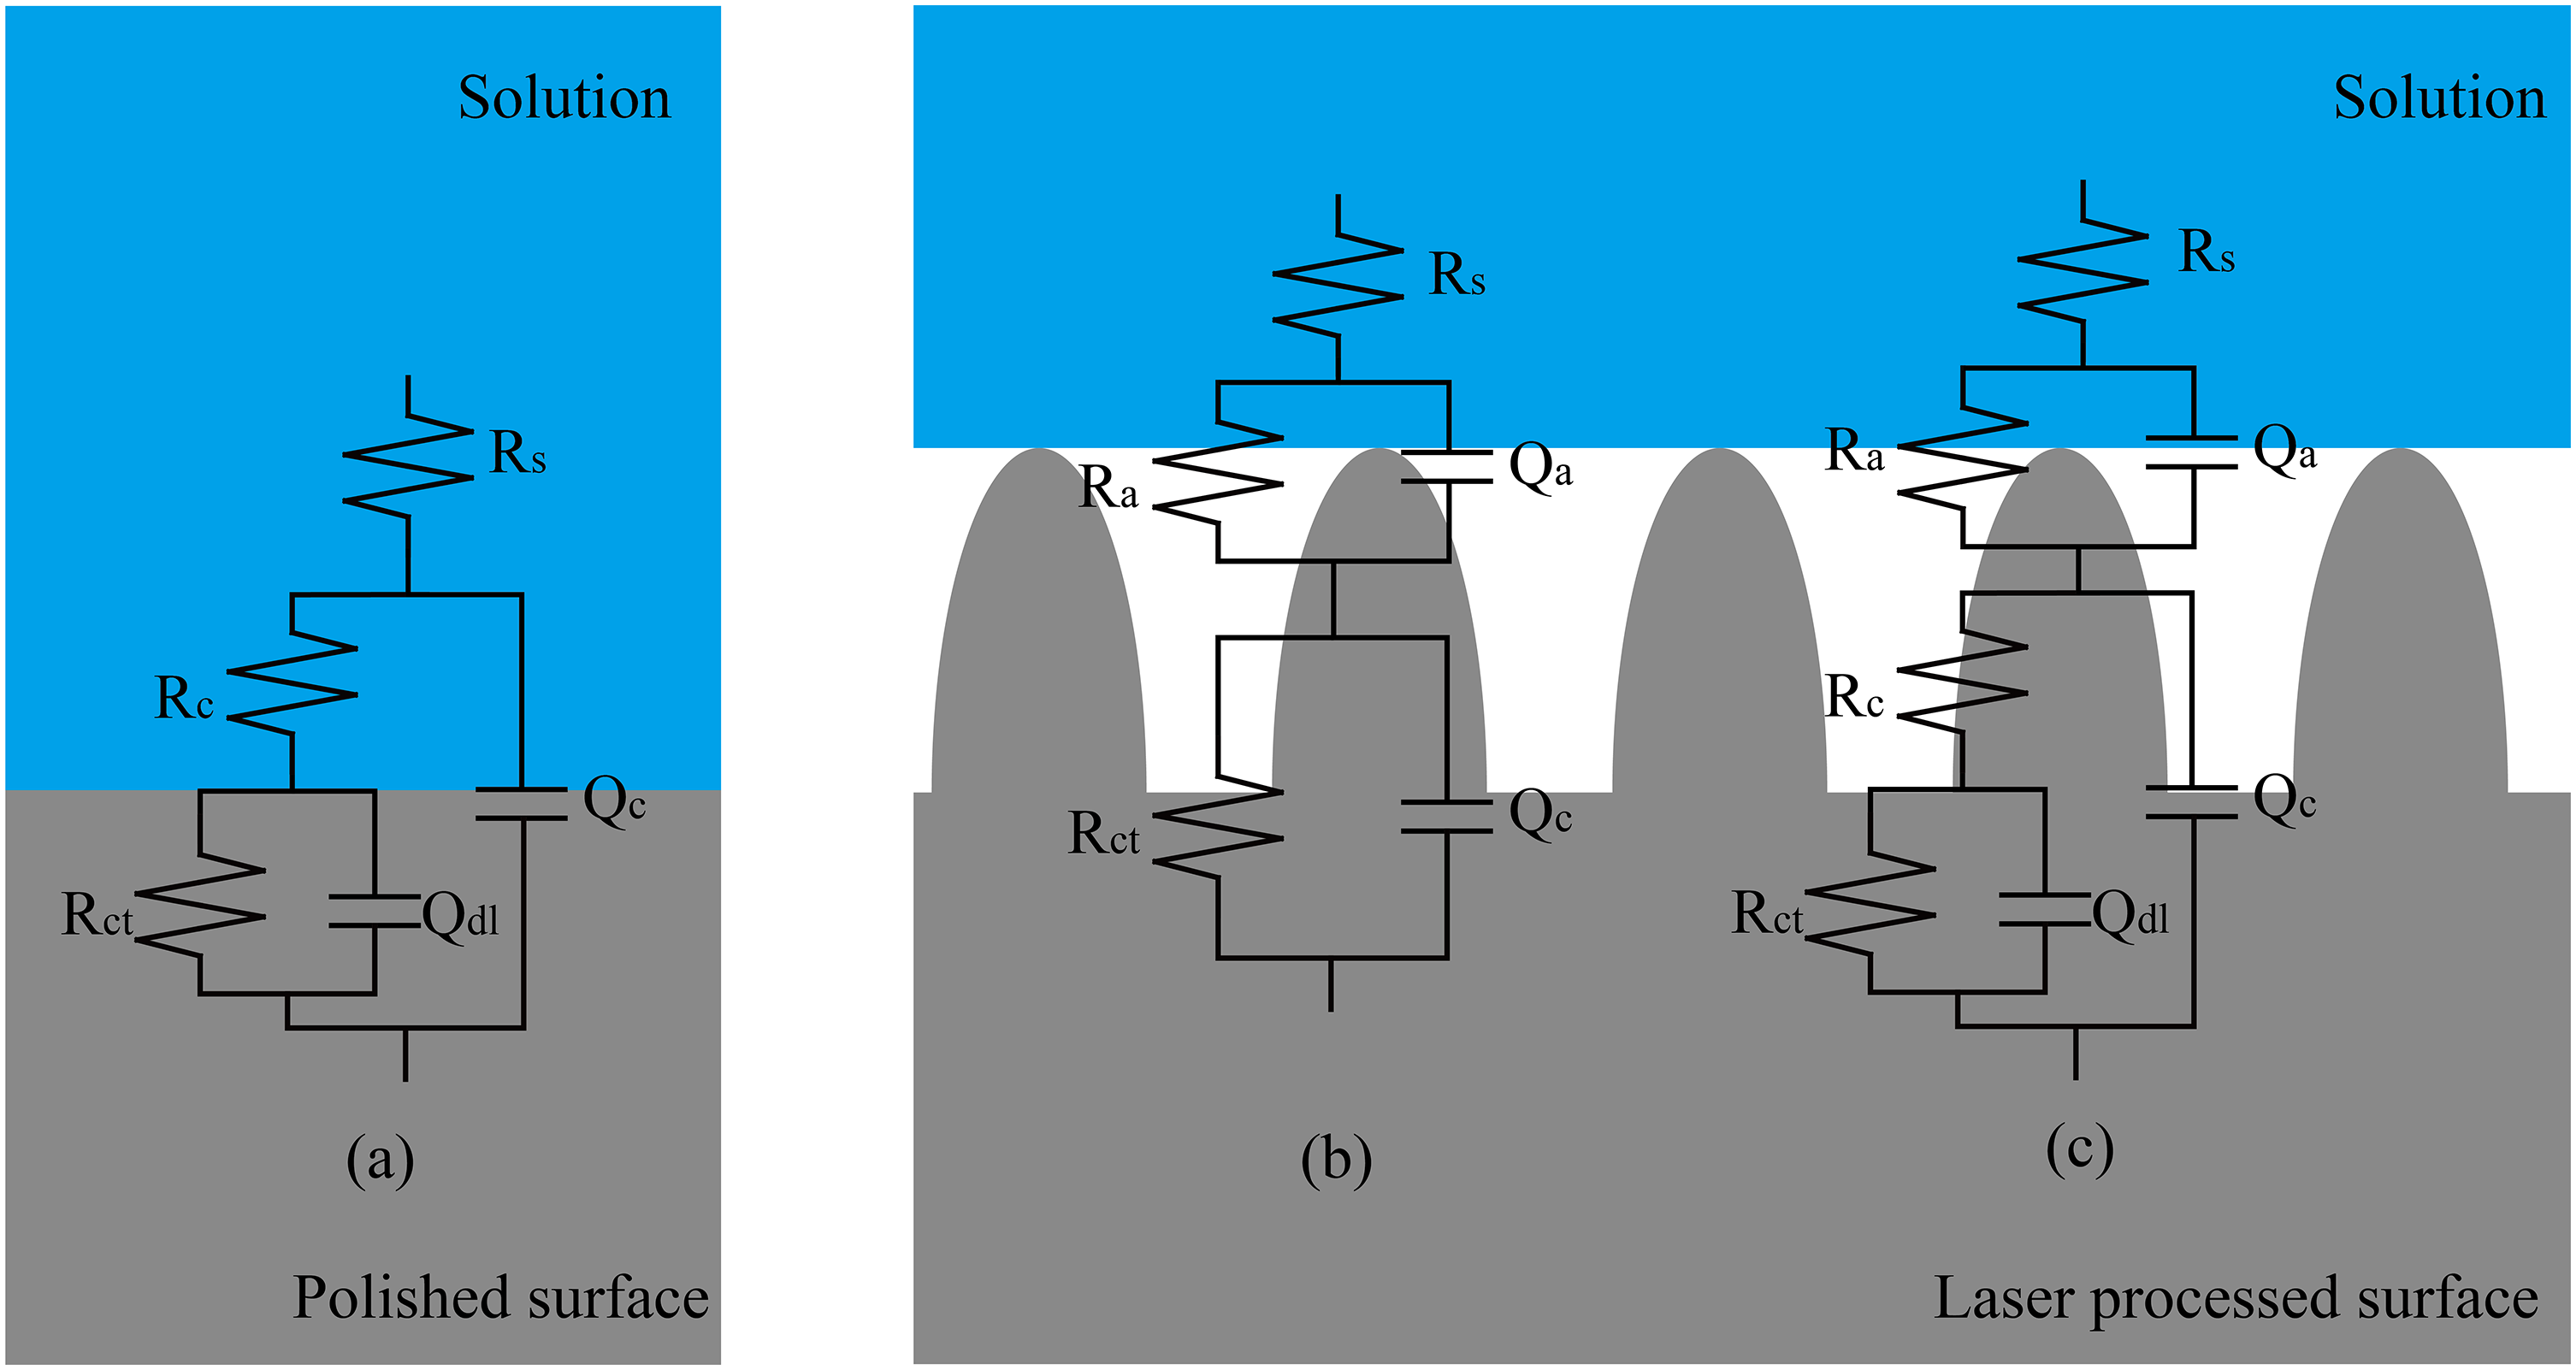
Equivalent circuit, (a) untreated samples; (b) the samples with heat treatment; (c) the samples with fluoridization.
Component values for fitting circuits.
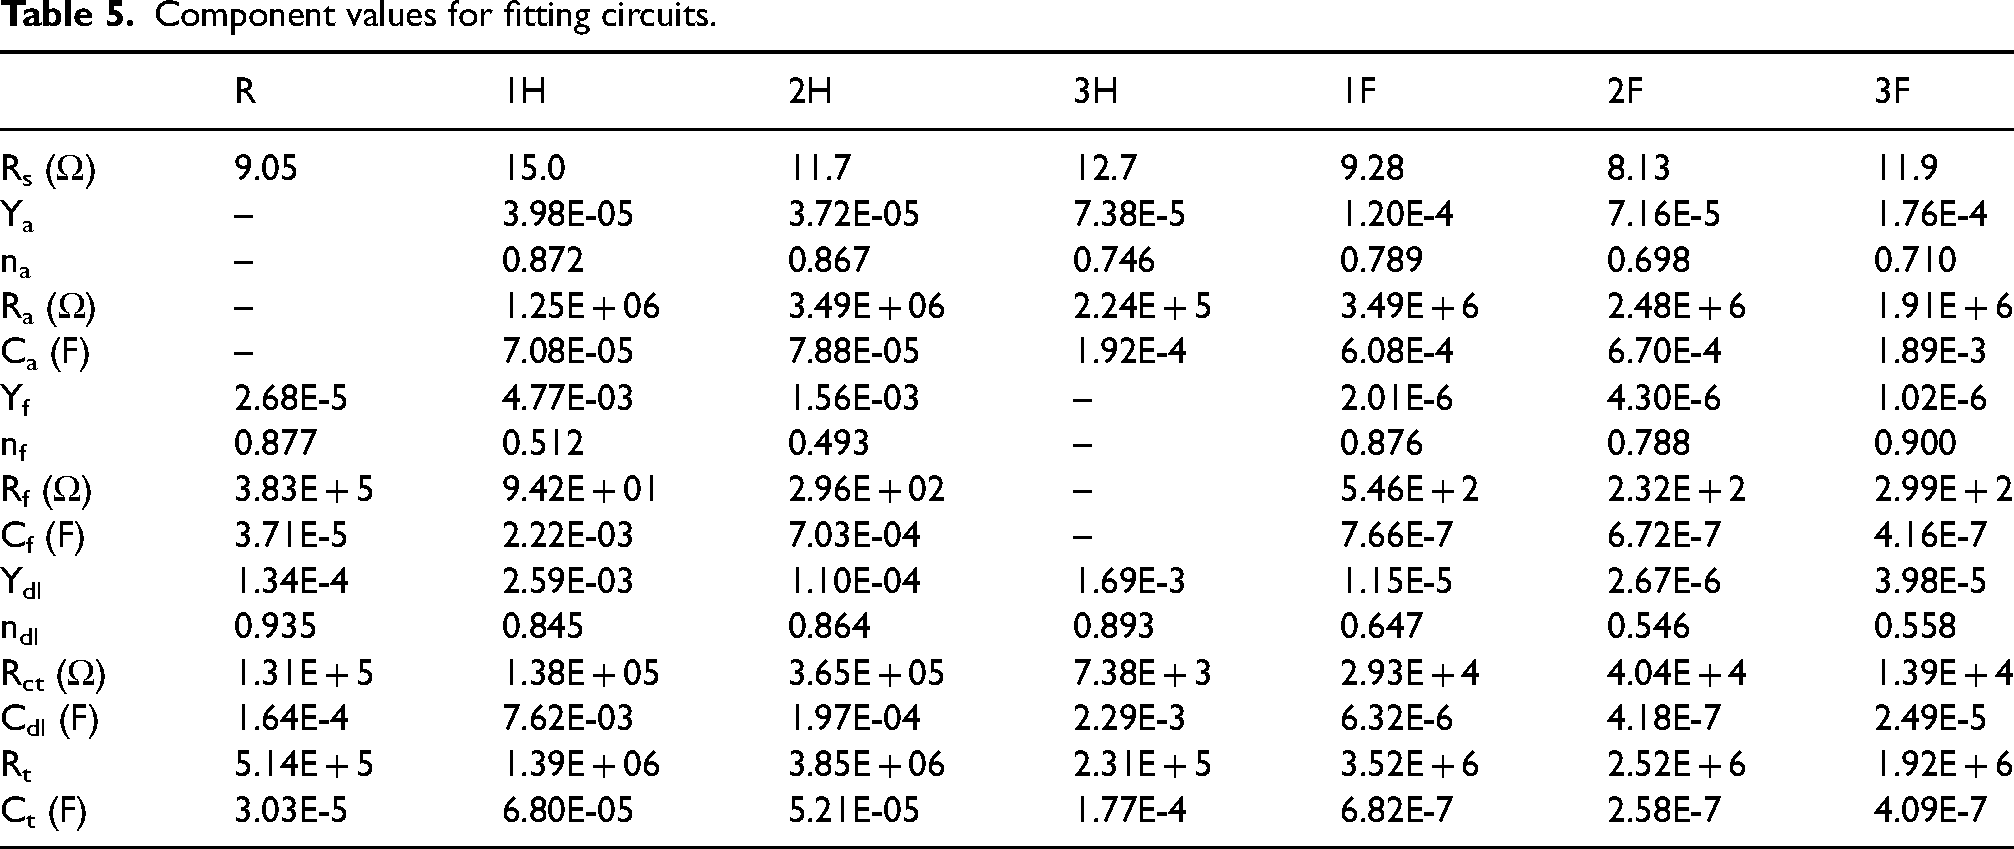
Generally, the total resistance
As shown in Figure 8–10, it can be seen from the XPS results that there are metals and metal oxides in the surface composition of the original sample, while the laser ablated surface almost only contains higher valent of FeO, Fe2O3, Cr2O3, etc. Although the degree of oxidation on the ablated surface is greater, with a layer of oxide film on its surface, the observed scanning electron microscope images show that the laser ablated surface is rough and relaxed, indicating that the oxide film is not dense and has some defects. In some cases, these metal oxides can serve as the anode of the primary battery formed on the surface. The oxide film on the surface of laser ablation provides excellent hydrophobicity, but it cannot resist the effect of corrosion, so it has a lower value in the fitted equivalent circuit. Instead, the gas film has a very high value, which serves as a corrosion protection function.
Figure 16 shows the EIS images, where Figure 16(a) shows EIS images of different immersion times after heat treatment, and Figure 16(b) shows EIS images of different immersion times after fluorination treatment. It is observed that the impedance after 24 h and 48 h almost overlapped, indicating that prolonged immersion has little effect on the superhydrophobic surface. It is observed that the images of these two after soaking are slightly different from those at 0 h, indicating that the contact surface formed between the solution and the superhydrophobic surface gradually stabilized after soaking. It is speculated that the stabilization time was much less than 24 h. In addition, the impedance arc radius of these impedances increased slightly, indicating stable corrosion resistance performance.
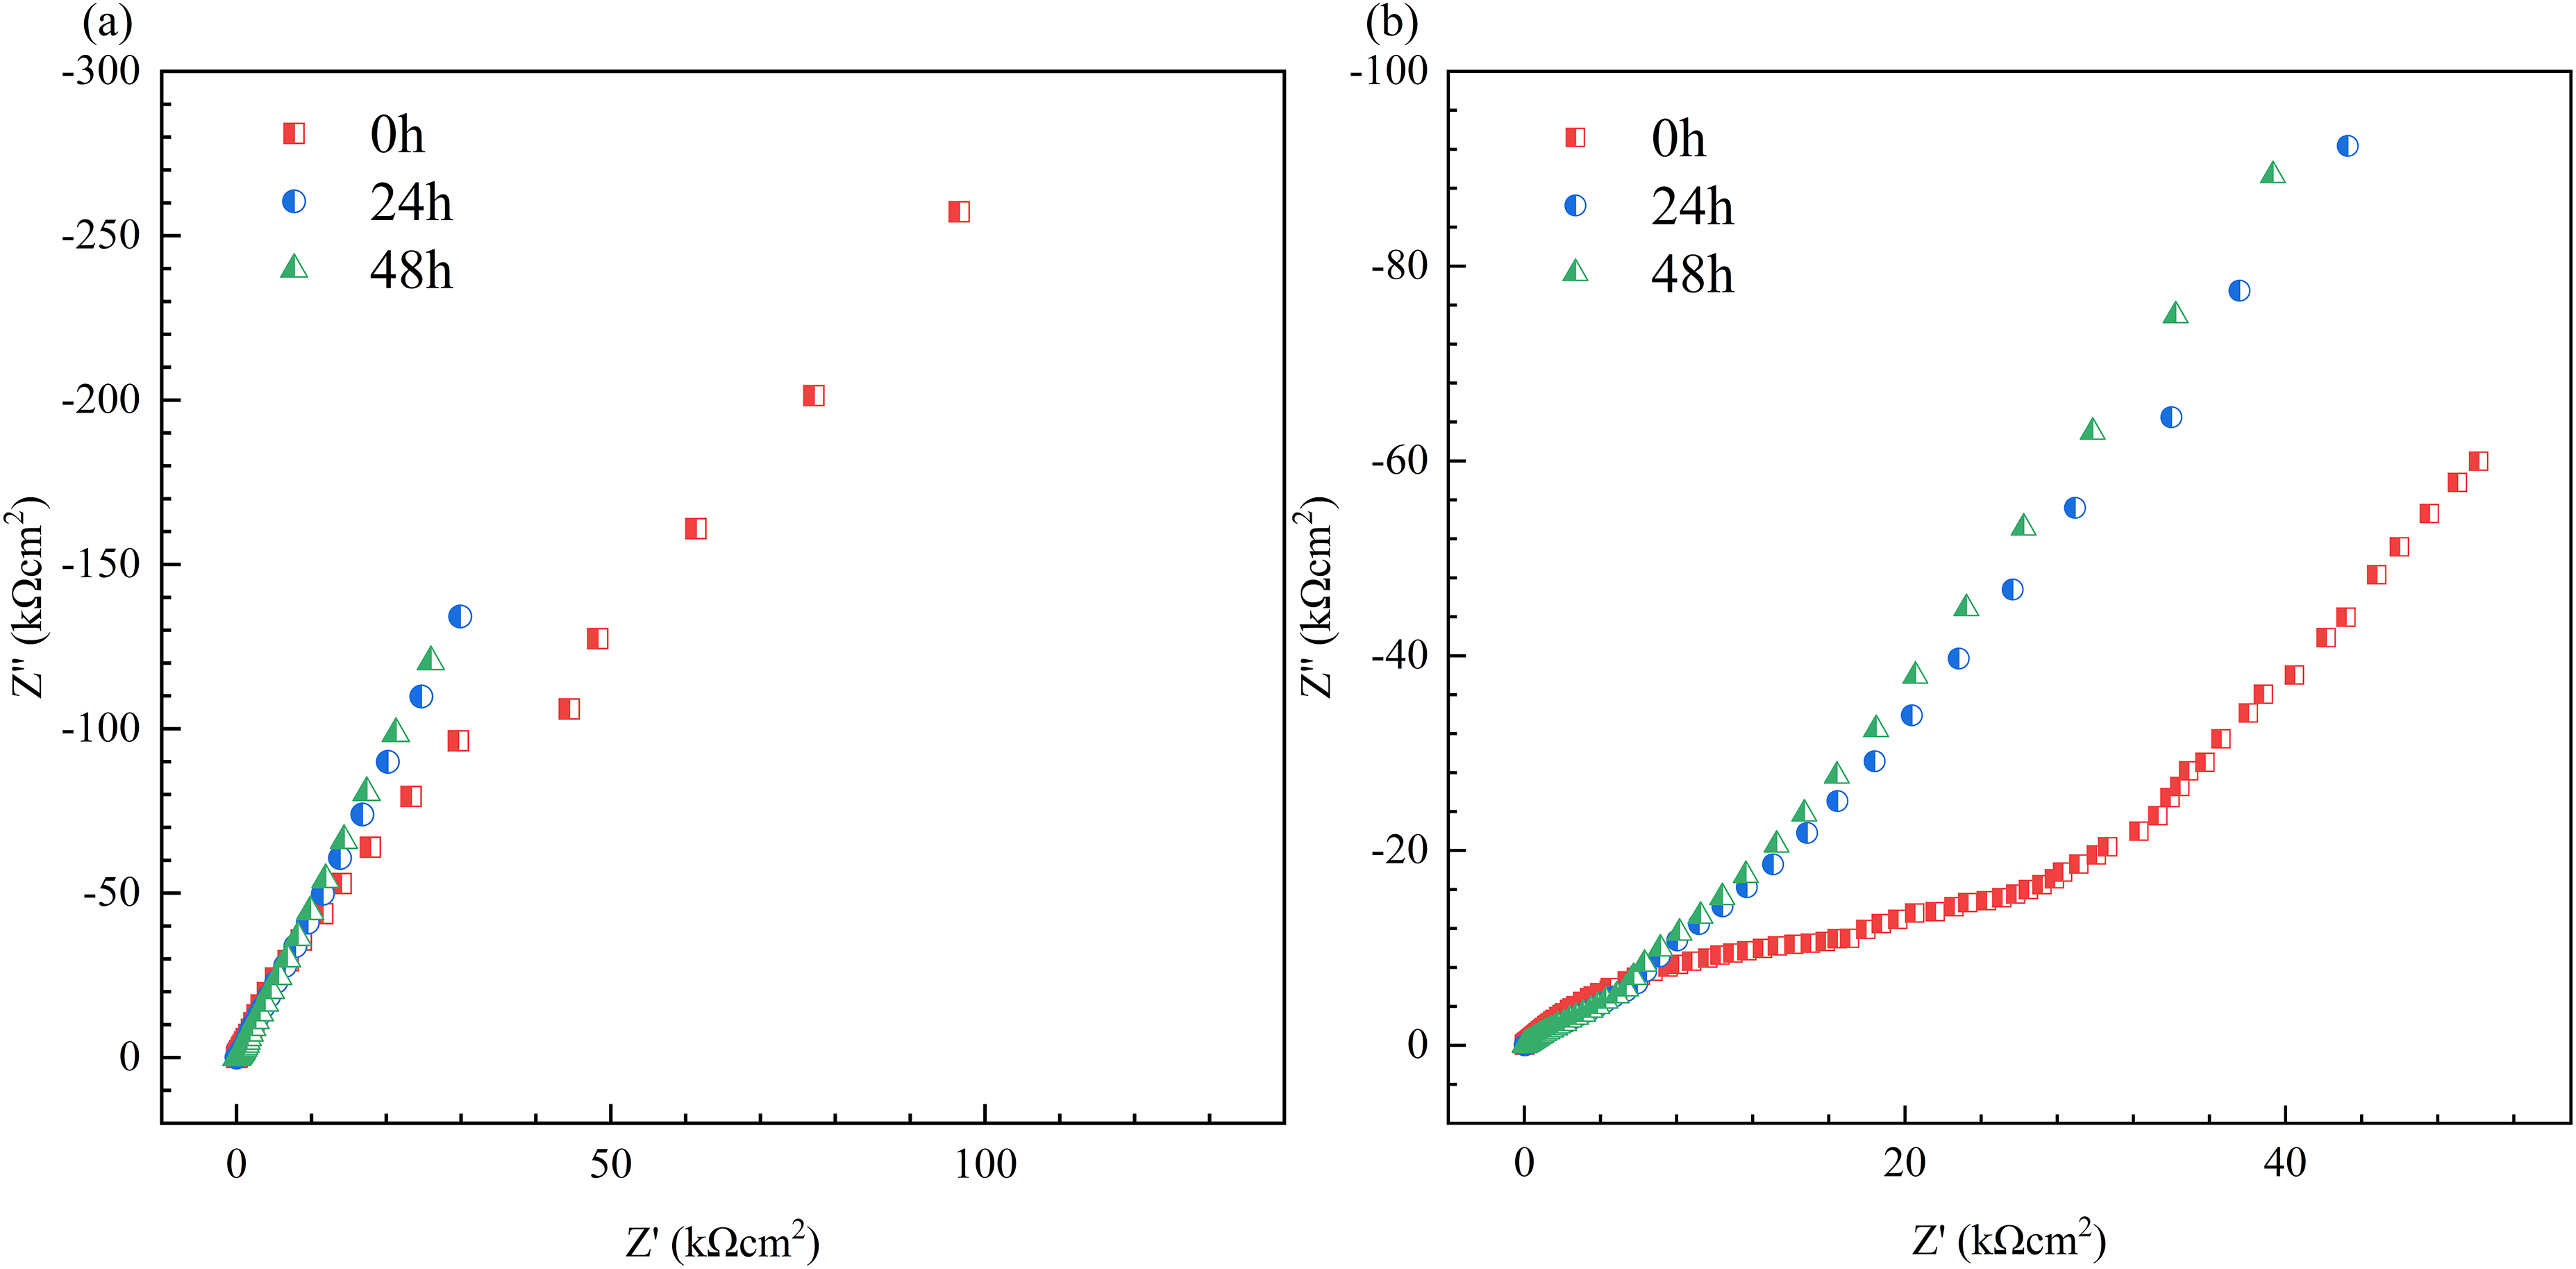
EIS of samples 1H(a) and 1F(b) for 0 h, 24 h, and 48 h in the test solution of 3.5% wt NaCl.
Based on the electrochemical investigations, it is observed that the introduction of a superhydrophobic surface modifies the corrosion behavior of the material. Table 5 elucidates that the corrosion resistance of untreated samples predominantly originates from their oxide film, with the resistance of this film measured at approximately 383 kOhms and an equivalent capacitance of the order of magnitude of −5. As a comparison, superhydrophobic samples have excellent gas film, with gas film impedance values ranging from hundreds of thousands to millions. So due to the superhydrophobicity, the solution cannot fully immerse the hydrophobic rough structure, and it only comes into contact with the tip of the micro protrusion structure. In addition, LIPSS further hinders the infiltration of liquid into the surface tips. In the corrosion reaction, there is only a large amount of anion aggregation at the contact tip of micron protrusion structure and LIPSS, forming a part of the double electron capacitance; The air corresponding to the solution at the gap cannot be ionized in large quantities, and the anions in the solution at that location cannot penetrate the gas film, but could move towards the tips of the surrounding protrusions. This phenomenon spares the base of the protrusions from extensive corrosion.
Conclusion
A micro-nano rough structure is designed and achieved on 316L austenitic stainless steel by femtosecond laser ablation and superhydrophobicity is obtained by two surface modification of heat treatment or fluorination treatment. The wettability and corrosive resistance were investigated. The main conclusions can be drawn as follows:
After heat treatment or fluorination treatment, superhydrophobicity was achieved on the micro-nano structured surface. The maximum CA of heat-treated surface is 166° while that of the fluorination-treated surface is 155°. The geometric characteristics of micro-nano structures have a significant impact on hydrophobic performance. Specifically, the rough structure exhibited by micro protrusions and nano ripples provides a good foundation for superhydrophobicity. The superhydrophobic micro-nano structured surfaces perform better corrosion resistance, with higher corrosion potential and greater impedance. In addition, the corrosion resistance of the heat-treated micro-nanostructured surfaces is better than that of the fluorinated surface. Due to the better superhydrophobicity of the heat-treated surface, its corrosion resistance performance is not inferior to that of fluorinated surfaces, and it has better stability. Among them, the surface micro nano structure constructed at 70 microns is the best. The corrosion resistance of the micro-nano structured surfaces comes from the gas film generated by superhydrophobicity. Micron protrusions and nano ripples can effectively prevent the corrosion solution from completely wetting the surface structures, that a large proportion of surface covered under the gas film can be protected from ion attacks.
Footnotes
Acknowledgments
This work is supported by the National Natural Science Foundation of China (Grant No. 52205148), the China Postdoctoral Science Foundation (Grant No. 2023M731392), the Natural Science Foundation of Hubei Province of China (Grant No. 2023AFB928), the Open Project Program of Wuhan National Laboratory for Optoelectronics (NO.2021WNLOKF017), the Fundamental Research Funds for the Central Universities of South-Central Minzu University (Grant Number: CZH24007), the Fund for Academic Innovation Teams of South-Central Minzu University (Grant Number: XTZ24002).
Declaration of conflicting interests
The authors declared no potential conflicts of interest with respect to the research, authorship, and/or publication of this article.
Funding
The authors disclosed receipt of the following financial support for the research, authorship, and/or publication of this article: This work was supported by the National Natural Science Foundation of China, the China Postdoctoral Science Foundation, Wuhan National Laboratory for Optoelectronics, Natural Science Foundation of Hubei Province, the Fundamental Research Funds for the Central Universities of South-Central Minzu University, the Fund for Academic Innovation Teams of South-Central Minzu University (grant number 52205148, 2023M731392, 2021WNLOKF017, 2023AFB928, CZH24007, XTZ24002).