
Abstract
Pitting corrosion initiation sites were investigated in superduplex stainless steels (SDSS) annealed at 1100 °C for 72 h and 700 h using EBSD maps, SEM, cyclic potentiodynamic polarisation tests and optical images. The extension of boundaries with rational interfaces (Kurdjumov-Sachs and Nishiyama-Wassermann) increases with increasing annealing time. The fraction of low-Σ3 CSL interfaces in the austenite phase increases with the annealing time. The pitting potential (Epit) was slightly higher for the samples annealed during 72 h, while those annealed during 700 h showed a pitting potential similar that of the untreated samples. Pitting were observed at different locations of the microstructure depending of the annealing time at 1100°C. It is shown that increasing the density of low-energy interfaces in this alloy improves the pitting corrosion resistance of the weakest phase in chloride-rich media. The article focuses on the interaction between PREN values, determined by the chemical composition of the weakest phase (austenite), and the character of the interfaces during the prolonged annealing.
Keywords
Introduction
Given their good mechanical properties and high corrosion resistance under aggressive environments, super duplex stainless steels (SDSS) are an attractive option for applications in oil and gas industries, petrochemical plants and offshore platforms, among others.1–4 However, the behaviour of duplex stainless steels with respect to localised corrosion seems difficult to predict due to their two-phase structure, composed of ferrite and austenite. 5 The sensitivity of these structures to corrosive attack largely depends on the chemical composition of both phases, the thermal history of the alloy and the character of its interfaces.5–7 Therefore, the effect of the distribution of alloying elements between the two phases, the composition and microstructure of each phase are key to understanding the initial location of pitting and its growth direction in SDSS.
During prolonged annealing (72 and 700 h) in SDSS, at temperatures higher than the homogenisation temperature (Thom), the partitioning of alloying elements between the phases is activated to reach a new equilibrium state (8–10). The new distribution of Cr, Mo and N changes the relationship between the volume fractions of phases and modifies the type and character of the interfaces.
Based on the chemical differentiation between austenite and ferrite in DSS, it is common to estimate the sensitivity to localised corrosion of the phases by means of the pitting resistance equivalent number (PREN). The PREN is only based on the chemical composition of the main elements (Cr, Mo and N) that control the resistance to corrosive attack of each phase.8–11 Many authors evaluate the pitting corrosion resistance of the alloy according to the phase with the lowest PREN value, paying attention to the PREN values of each phase and their difference.6,8–13 The use of PREN is recognised as an indicator of the alloying element content in DSS and consequently of corrosion resistance, although it is reported that the overall pitting corrosion resistance of the DSSs may not be arbitrarily determined by PREN values. 14 Some articles have shown a preferential localised corrosion in the ferritic phase of the DSS even though its PREN was higher than that of the austenitic phase. 15
The type, frequency and character of the interfaces within and between phases16–18 constitutes a microstructural factor that also influences in the pitting corrosion resistance in DSS. The distribution of interface boundaries in the two-phase microstructure of duplex stainless steels, as well as their impact on corrosion resistance, is not yet fully understood. Some studies have addressed the influence of grain boundary character distribution (GBCD) on the microstructure and texture formation in DSS.19,20 However, specific literature on the influence of grain boundaries on the corrosion resistance of duplex stainless steels is scarce. 19 Also, the evolution of the interface character distribution with grain growth in the DSS is not clear. 21
This study aims to show that prolonged annealing at 1100°C (T > Thom) in a duplex stainless steel alters the chemical composition of the phases, modifies the equilibrium between their volume fractions and changes the type and characteristics of their interfaces. Hence, the work focuses on how these changes in the composition of the phases and evolution of the microstructure influence the initiation and development of pitting in chloride-rich media.
Materials and experimental procedure
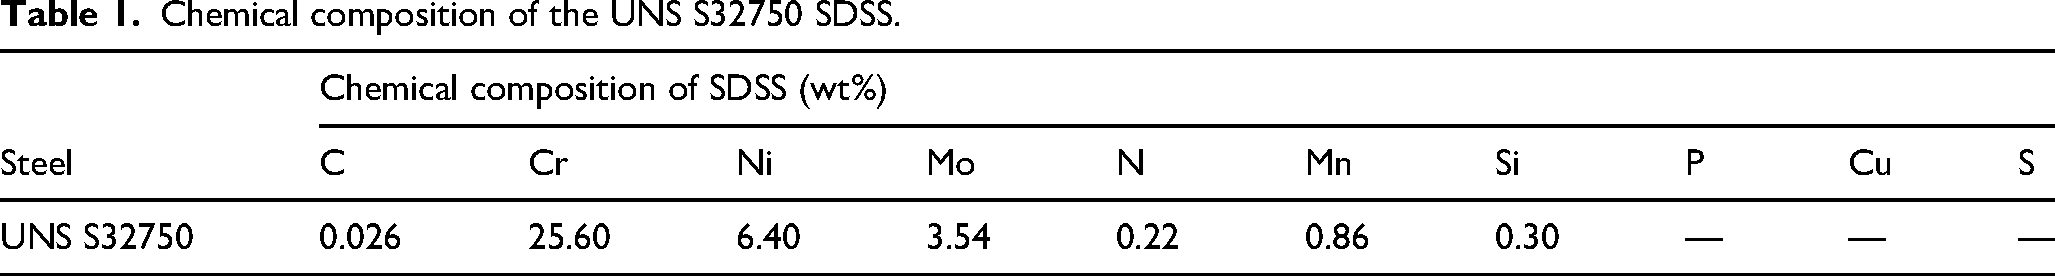
Specimens (1.5 × 1.5 × 1.0 cm) of a commercial UNS S32750 SDSS plate were used in this study. The chemical composition of the steel plate is described in Table 1. Before heat treatments, the samples were sealed in quartz capsules with an argon atmosphere. The heat treatments were performed at 1100°C during 72 and 700 h, followed by quenching in water. The temperature of 1100°C was selected taking into account the thermodynamic calculations of the phase fractions to ensure that only austenite and ferrite coexisted, without any other phases forming for the given composition. For this, the Thermo-Calc software was used with the Steel/Fe TCFE8 thermodynamic database. 22
Chemical composition of the UNS S32750 SDSS.
The as-received and annealed samples were prepared with silicon carbide papers up to 1200 grit size followed by polishing in diamond paste of 1 μm. The samples were electrolytically etched in a 30% NaOH solution at 14 V for 3 s. The microstructures were analyzed using light optical microscopy (ZEISS Axioplan 2 Imaging) and scanning electron microscopy (SEM Tescan Vega3). The phase fractions in ten different regions of each sample were determined in the optical images using ImageJ software (Table 2). The chemical composition of each phase was determined in a SEM Tescan equipped with a Quantax Microanalysis System using the Spirit Compact Interface. The main chemical elements (Cr, Ni, Mo, Mn) were measured six times in each phase by energy dispersive X-ray spectroscopy (EDS), and the average values of these measurements are reported in Table 3. The 1:1 phase fractions according to Thermo-Calc software is obtained at temperatures close to 1040°C for the nominal composition of this SDSS. This phase balance is close to that of the as-received condition which was determined experimentally using the ImageJ software. At precisely this temperature, the nitrogen content in ferrite was determined using the Thermo-Calc software. Then, using the mixing rule (coinciding with the Thermo-Calc calculations), the nitrogen content in the austenite was determined for the as-received condition. A similar procedure was carried out for the calculation of the nitrogen content in each phase of the annealed samples.
Average ferrite and austenite phase fractions, PREN16, ΔPREN and Δphase in each microstructural condition of the SDSS
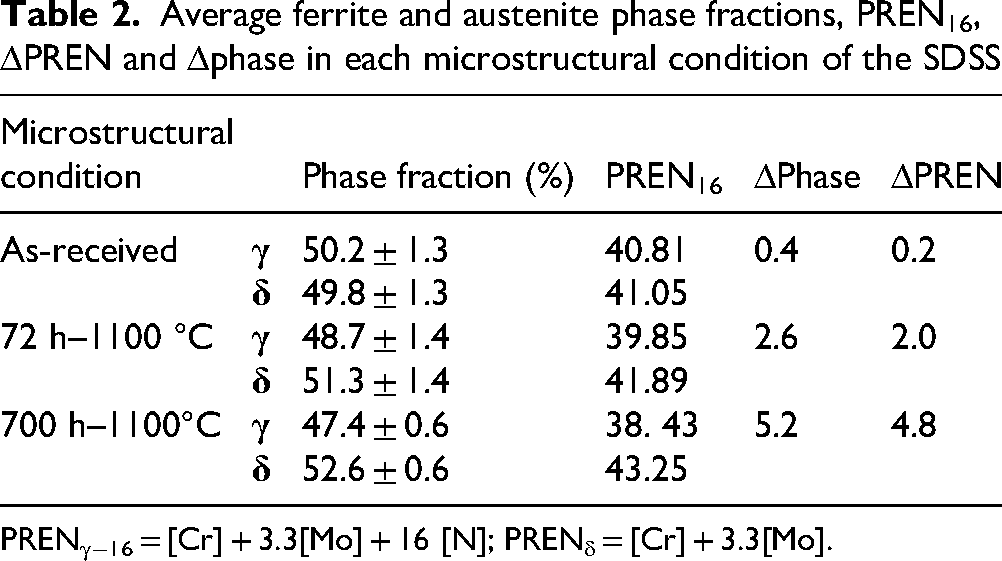
PRENγ−16 = [Cr] + 3.3[Mo] + 16 [N]; PRENδ = [Cr] + 3.3[Mo].
Chemical compositions of the main elements in austenite and ferrite phases for each microstructural condition.
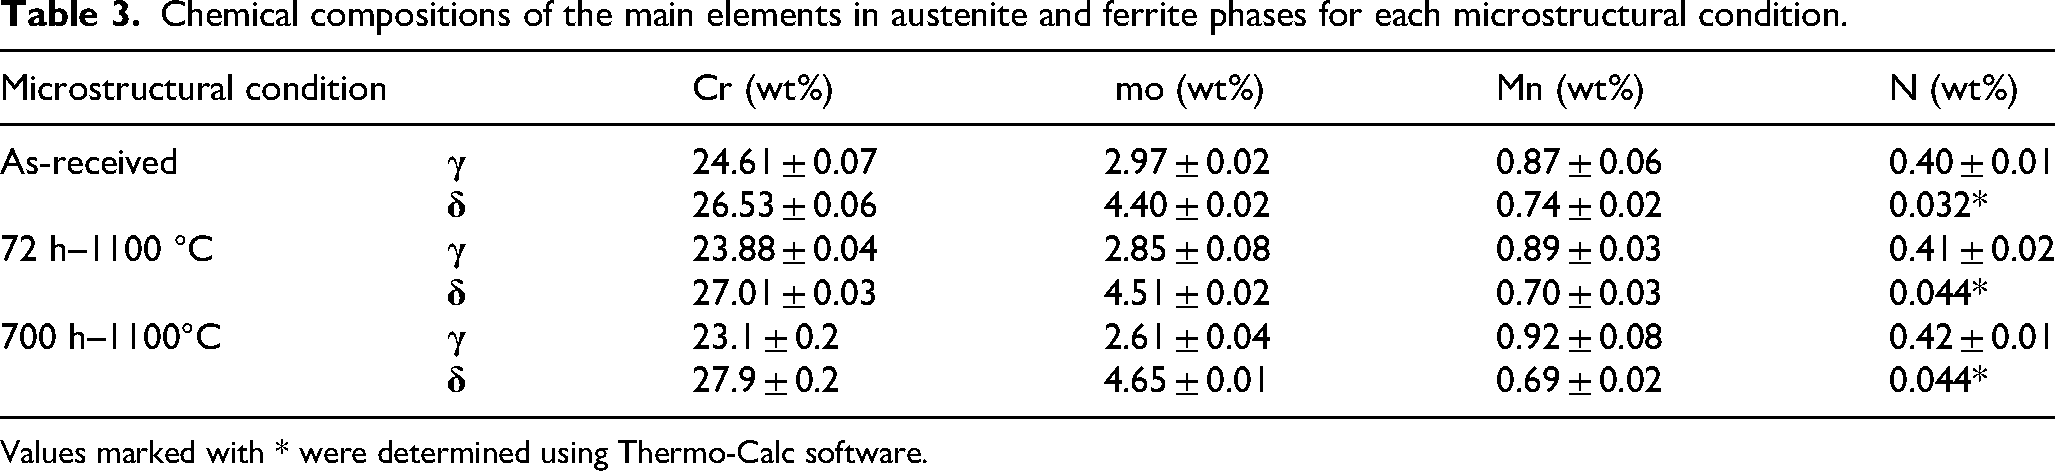
Values marked with * were determined using Thermo-Calc software.
The electron backscattered diffraction (EBSD) maps were acquired in a SEM Cambridge CamScan 3200LV with an Oxford EBSD camera. Voltage was set at 20 kV and filament current at 10 nA, with a working distance of ∼15 mm. The step size was 1 µm. Diamond suspensions of 1 and 0.3 micros were used to polish the samples to minimise the deformations introduced by the standard metallographic preparation. Each abrasive size was used for 10 min with low force on the samples and a wheel rotation of 220 RPMs. The final polishing process was carried out on a vibratory polisher, where the samples were subjected to minimal force and moved continuously over the polishing cloth by means of the vibratory motion. The final polishing medium was 0.02-micron colloidal silica (CS). This high pH suspension provides an excellent surface finish for EBSD analysis. The samples were polished for 240 min. The post processing of the EBSD data was performed with the MTEX package. 23 Noise removal was performed by grain dilation. Inverted pole figures (IPF) and grain boundary misorientation maps were generated. Furthermore, the grain boundaries were classified by categories (δ-δ, δ-γ and γ-γ), as well as the misorientation distributions were analyzed for each group.
Cyclic Potentiodynamic Polarisation (CPP) tests and Critical Pitting Temperature (CPT) determinations were performed to study the influence of prolonged annealing on localised corrosion resistance. Prior to each CPP and CPT test, the samples were passivated with nitric acid (HNO3) for 1 h, and carefully embedded in epoxy resin to prevent crevice at the metal/resin interface. The surface exposed to the electrolyte to act as the working electrode was 1 cm2 in area. These working electrode’s surfaces were wet-ground up to 600-grit emery silicon carbide. Then, the samples were rinsed with distilled water and dried in a stream of cool air. A saturated calomel electrode (SCE) and platinum foil were used as the reference and counter electrodes respectively. An Autolab potentiostat (model PGSTAT2024) using the NOVA 2.1.2 software was employed to obtain the CPP records in a deaerated 3.5 wt% NaCl (0.62 M) solution at a temperature of 80°C. Before each corrosion test, the open circuit potential (OCP) was recorded for 30 min. to yield a steady-state condition to obtain the corrosion potential (Ecorr). The cyclic potentiodynamic measurements were carried out at a sweep rate of 1 mVSCE/s from the OCP to 1000 mVSCE above the OCP. The scanning direction was reversed when the current density reached 10−3 A/cm−2. The tests were replicated three times under same conditions and the average potentials and their uncertainties were calculated.
According to ASTM G150, the CPT tests were performed in a 1 M NaCl solution under potentiostatic conditions at 700 mVSCE. The potential was applied at room temperature and the solution temperature was increased at a rate of 1°C/min with a monitoring at the current. The CPT was identified as the temperature at which the current density sharply increased to 100 μA/cm2. The CPT tests were replicated five times under same conditions. The most typical CPT and CPP curves are presented in the next section. After the cyclic potentiodynamic measurements, optical microscopy, BSE and EBSD were used to observe the pits in the microstructures.
Vickers microhardness measurements were performed on each phase (austenite and ferrite) using a Shimadzu-HMV microhardness tester according to ASTM E384-16. The load used was 25 g (HV0.025) for 15 s. The reported microhardness values correspond to the average of 10 indentations in each phase. The load selection for the microhardness tests was determined by the relationship between indentation geometry and phase dimensions. Lower load (0.01 kg) was adequate for small austenite particles, avoiding interaction with their boundaries, but the indentation exhibited a ‘sink-in’ morphology. The 0.025 kg load allowed obtaining ‘pile-up’ indentation morphologies in regions where interactions with phase boundaries were avoided. This type of indentation morphology best represents the material's properties. 24
Results and discussion
Figure 2 shows the light optical images of the UNS S32750 DSS microstructures according to the longitudinal rolling direction with different microstructural conditions (as-received, annealed at 1100 °C for 72 and 700 h, respectively). The as-received microstructure shows elongated austenite grains along the rolling direction, forming a typical banded microstructure (Figure 2(a)). With prolonged annealing time at 1100°C, the austenite grains became less elongated and larger than the as-received condition, decreasing the banded morphology (Figures 2(b) and (c)). The planar sections between the austenite and ferrite were more numerous for longer annealing times and the austenite grains became more polyhedral (Figure 2(c)).
As a result of the annealing treatments at 1100°C and rapid cooling, the ferrite/austenite phase fractions are affected in a relative proportion without the precipitation of harmful second phases (Figure 1). Table 2 shows the ferrite and austenite volume fractions and the calculated PREN values. The tested isothermal conditions also affected the partitioning of the chemical elements that control the corrosion resistance and consequently the phase fractions and PREN values of each phase.
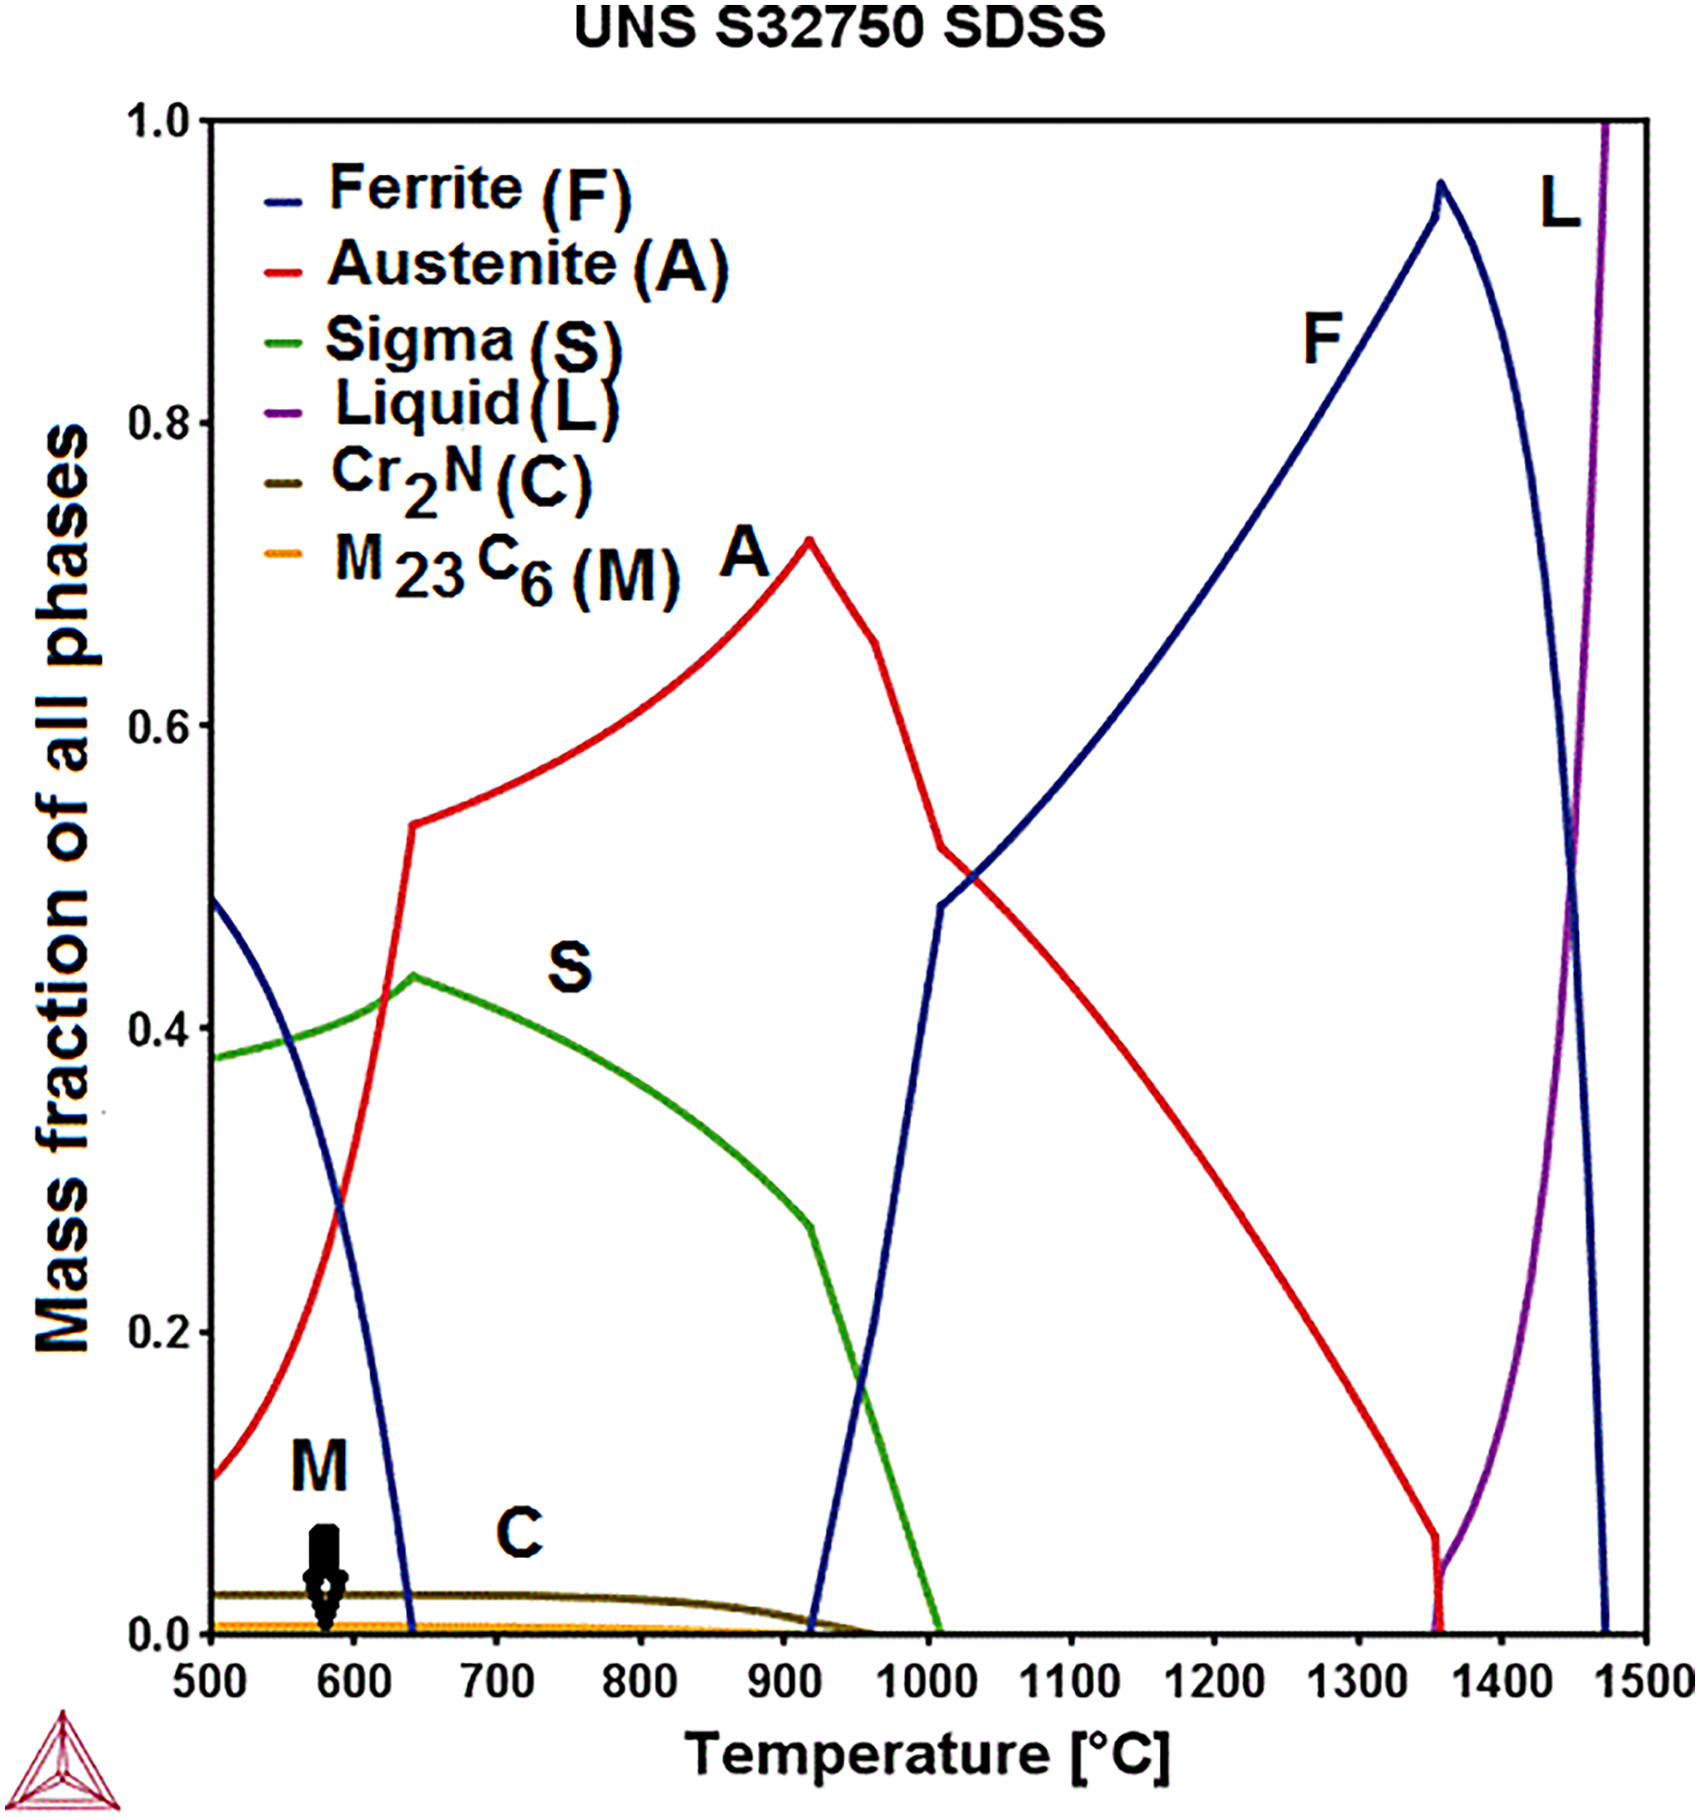
Equilibrium phase diagram of the UNS S32750 SDSS using thermo-calc software with the TCFE8 steel/Fe database.
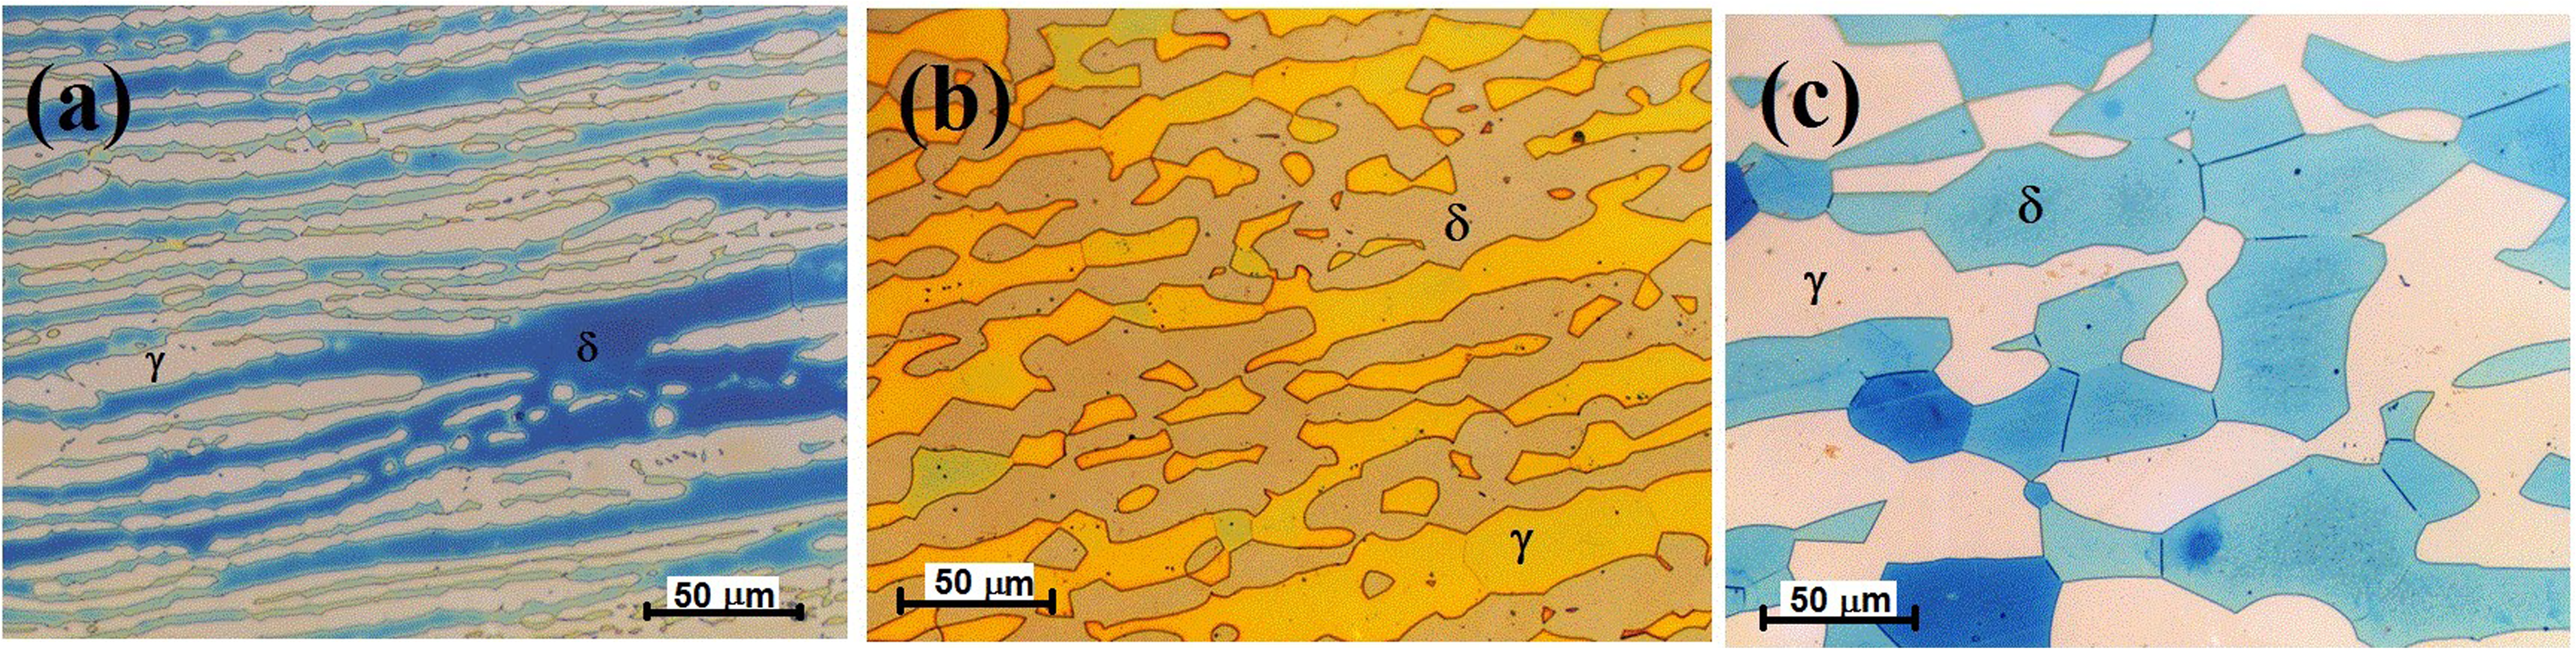
Light optical images of the UNS S32750 DSS microstructures along rolling direction. (a) As-received steel, (b) Steel annealed at 1100 °C during 72 h and (c) Steel annealed at 1100 °C during 700 h.
The compositions of the main chemical elements in austenite and ferrite phases for each microstructural condition are shown in Table 3.
Figure 1 shows that the 1:1 ratio between ferrite/austenite phases is achieved at approximately 1040°C. The experimental results in Table 2 show that the sample in the as-received condition exhibits approximately this (1:1) phase balance. This allows us to infer that the homogenisation temperature of this SDSS was close to 1040°C. Furthermore, the increase in the ferrite fraction and the decrease in the austenite fraction, when the isothermal annealing temperature is raised to 1100 °C, is another factor that supports the hypothesis that the homogenisation treatment of the sample in the as-received condition was close to 1040 °C.
According to Thermo-Calc calculations, as the ferrite fraction increases, the average Cr and Mo contents should decrease due to greater dissolution. Conversely, the Cr and Mo contents are expected to decrease in austenite; however, the reduction in these elements in austenite must be less noticeable because it is offset by the reduction in their volume fraction.
Tables 2 and 3 show that the Cr and Mo contents in ferrite increase with the ferrite volume fraction during the annealing treatment at 1100°C. This indicates the influence of the initial microstructure on the equilibrium partitioning of some substitutional elements during annealing at 1100 °C. Thus, the Cr and Mo partition ratios between both phases exceed the dilution of these elements in ferrite with the increase of its volumetric fraction (Table 3). The same, but in contrast, is recorded for Cr in austenite with the decrease of its volumetric fraction. Nitrogen, due to a higher order of mobility with respect to the substitutional elements, their contents in ferrite and austenite for the different microstructural conditions are determined by thermodynamic methods and the mixture law. Many articles assume that the initial nitrogen content in ferrite is 0.05 wt%, due to its maximum solubility.6,15,25
A more accurate calculation of the nitrogen content in ferrite at the homogenisation temperature, where the phase fractions are approximately equals, was performed using the Thermo-Calc software. The result was 0.032 wt% nitrogen for the ferrite in the as-received state. Using thermodynamic calculations performed with Thermo-Calc software, the nitrogen content in the ferritic phase was also estimated after the two prolonged annealing treatments at 1100 °C. In both annealing treatments at this high temperature, the nitrogen reached its equilibrium state due to its high mobility. The calculated nitrogen content was 0.044 wt% for ferrite in both annealing treatments (72 and 700 h) at 1100 °C. After calculating the amounts of nitrogen in the ferrite, the nitrogen content in austenite was determined for each annealing condition using the mixture rule. For this purpose, the average volume phase fractions determined in Table 2 were used.
The partitioning of the main substitutional elements corresponding to different annealing conditions (72 and 700 h) at 1100°C is shown in Figure 3. Cr and Mo enriched the ferrite phase whereas Ni and N enriched the austenite phase.
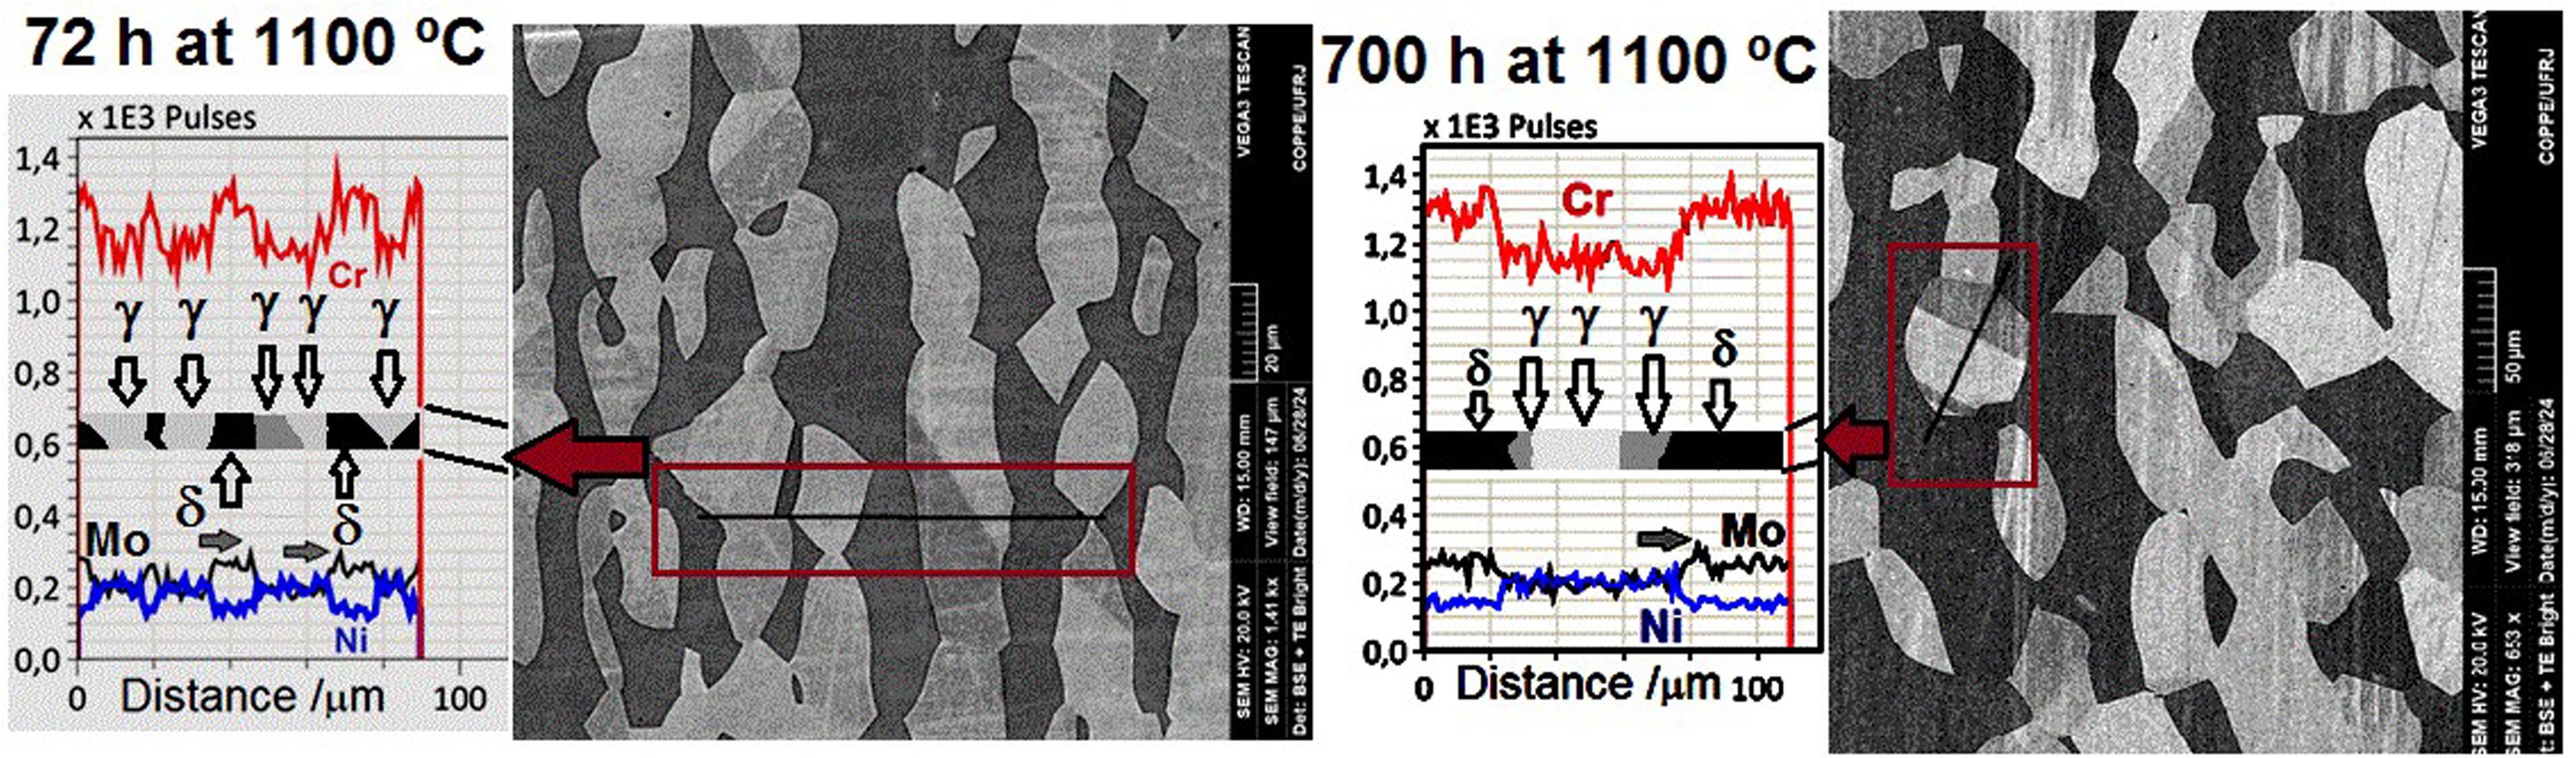
Line scan shows the partition of the Cr, Ni and Mo elements in regions where the ferrite and austenite grains have been annealed during 72 h and 700 h at 1100°C.
The backscattered electron (BSE) images (Figure 3) for both annealing conditions show well marked contrast in certain austenite grains. These contrasts usually appear as a consequence of different orientations of single crystal regions of austenite due to rotations during prolonged annealing.21,26 Line scan of Cr, Ni and Mo performed along the directions shown in Figure 3, revealed noticeable Mo segregation at some δ/γ boundaries.
An indirect assessment of the compositional variations (Cr and Mo) between the phases, during prolonged annealing, can be performed by microhardness measurements, as shown in Figure 4. The increase in ferrite hardness over time is associated with the higher contents of Cr and Mo in the matrix. It is known 27 that when the Mo content is higher than 3.5 wt% the excess is segregated at the irrational boundaries. Since prolonged annealing treatments increase the rational austenite/ferrite interfaces, 28 with austenite grain growth, the total fraction of irrational boundaries decreases significantly. This makes the ferritic matrix more supersaturated in these substitutional elements 28 despite the increase in its volume fraction. Furthermore, the coarsening process during the prolonged annealing generates sub-boundaries within the ferrite that act as diffusion paths for chemical elements between the two phases. 29 The small fraction of irrational boundaries, the increase in the matrix supersaturation, and formation of sub-boundaries in the ferrite at prolonged annealing explain the increase in hardness of this phase.
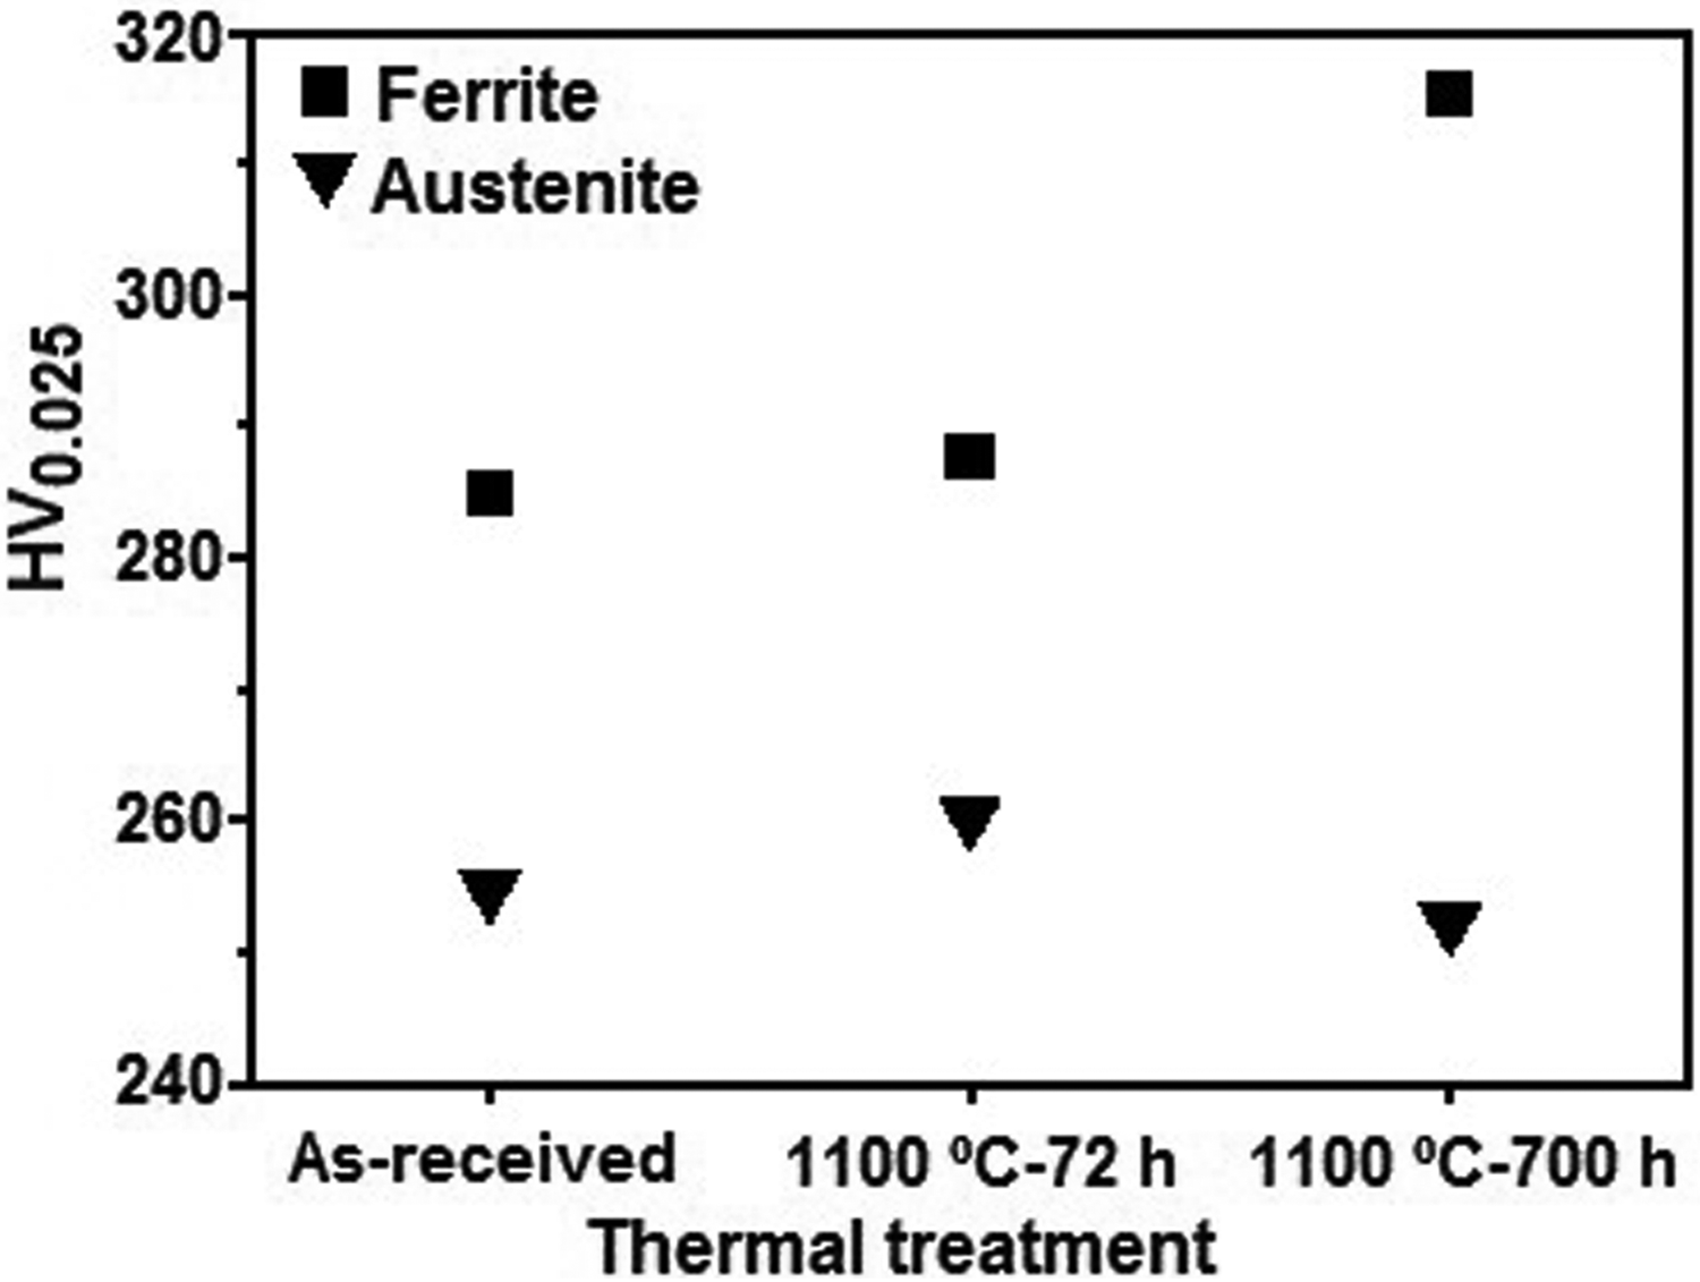
Microhardness of ferrite and austenite in samples of SDSS with different annealing treatments.
Duplex stainless steels possess a strain-hardening potential (σUTS/σy0.2≅1) of approximately one 30 . This validates a proportional relationship between the hardness and yield strength of each phase. According to the hardness values shown in Figure 4, prolonged annealing will increase the yield strength of ferrite and decrease that of austenite. An increase in the ductility of austenite is reported due to twinning in this phase with annealing 31 , which could explain the decrease in its hardness and, consequently, its strength.
The literature6,32 has suggested that the resistance to pitting corrosion of single phases depends mainly on the contents of Cr, Mo and N. Phases with a higher PREN value will be more resistant to corrosive attack than those phases with a lower PREN value.6,32 In DSS, the concentration of these elements varies for each phase with different thermal treatments, which causes an important distinction between ferrite and austenite with respect to pitting corrosion resistance. As can be seen in Table 2, the ferrite fraction increases with increasing annealing time at 1100°C, and consequently, the austenite fraction decreases. In the as-received condition where the fraction of both phases is approximately equal, the PREN values of both phases are also similar. The as-received samples showed minimum differences between both phase fractions and PREN values. As the annealing time at 1100°C increases, the imbalance between the phases increases and the PREN value of ferrite increases while the corresponding value of austenite decreases. Annealing at 1100 °C for 700 h results in the largest difference between the volume fractions of both phases, thereby amplifying the disparity in the PREN values between austenite and ferrite.
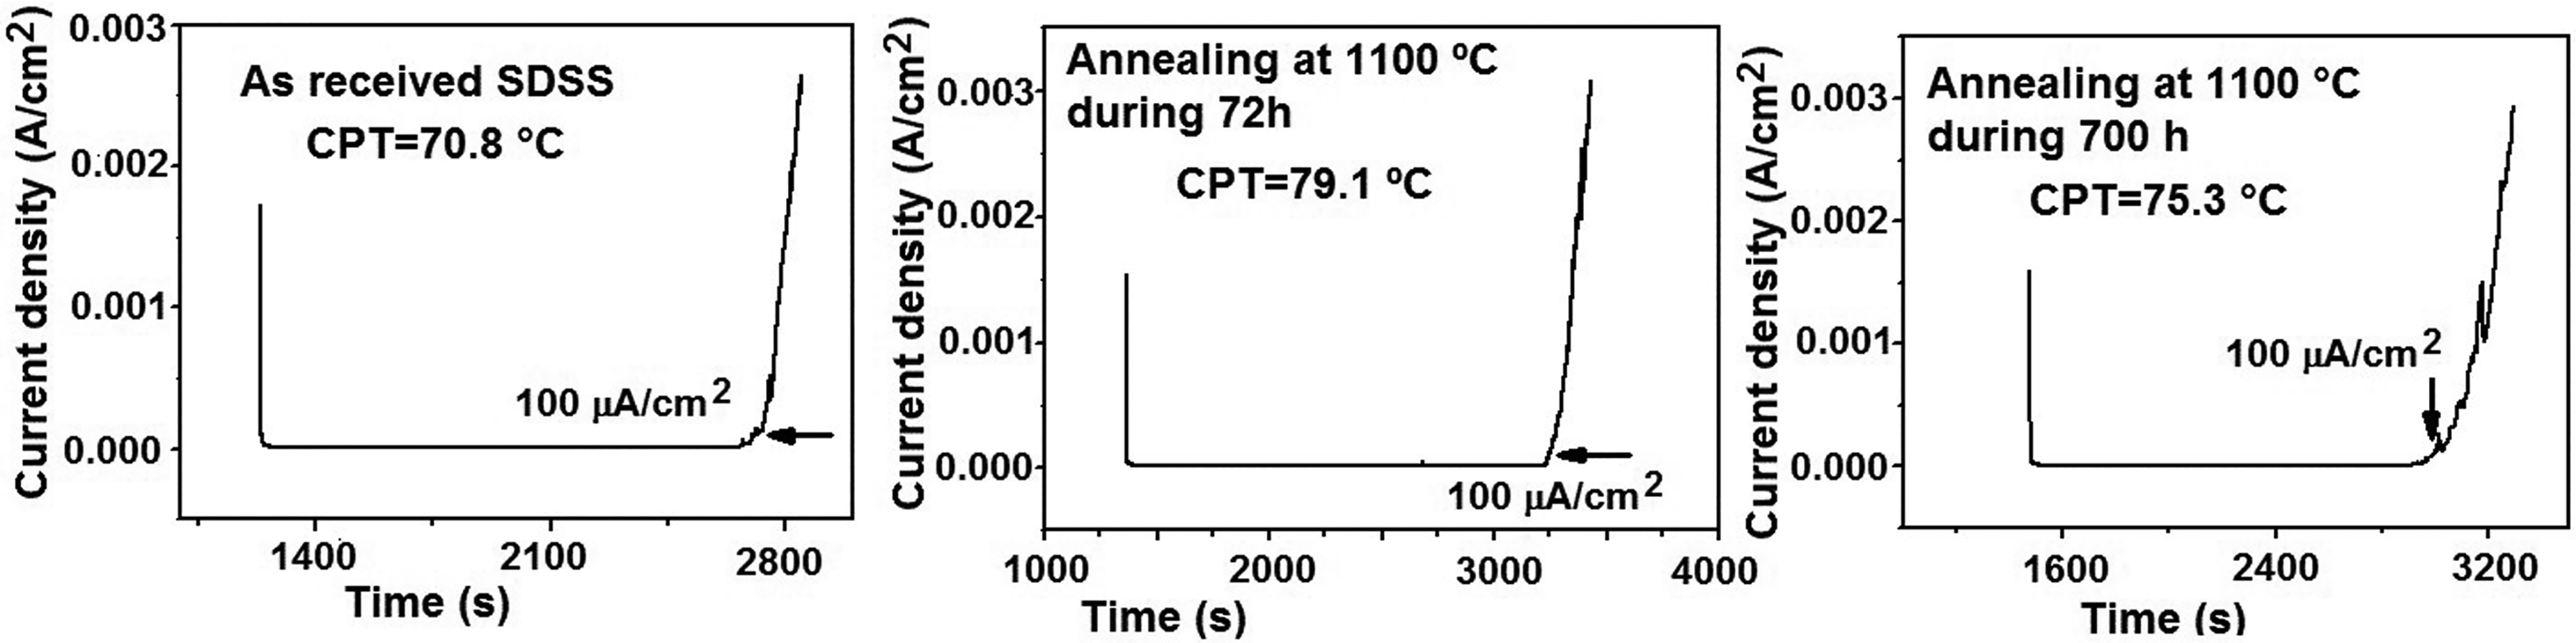
Figures 5 and 6 show the more representative CPT and cyclic potentiodynamic polarisation (CPP) tests corresponding to samples with different microstructural conditions. After obtaining the critical pitting temperatures in the samples with different microstructural conditions, the temperature of 80 °C was selected for the CPP tests. It is recognised in the literature that pitting formation and growth cause hysteresis loops in the cyclic potentiodynamic curves, where the pitting potential (Epit) is different from the repassivation potential (Erep). 33 The images in Figure 7 show pitting in different places of the microstructures after the cyclic potentiodynamic testing. The differences recorded in the CPT and CPP curves for the different annealing treatments show the influence of microstructural evolution on pitting corrosion resistance.
Critical pitting temperatures corresponding to samples with different microstructural conditions.
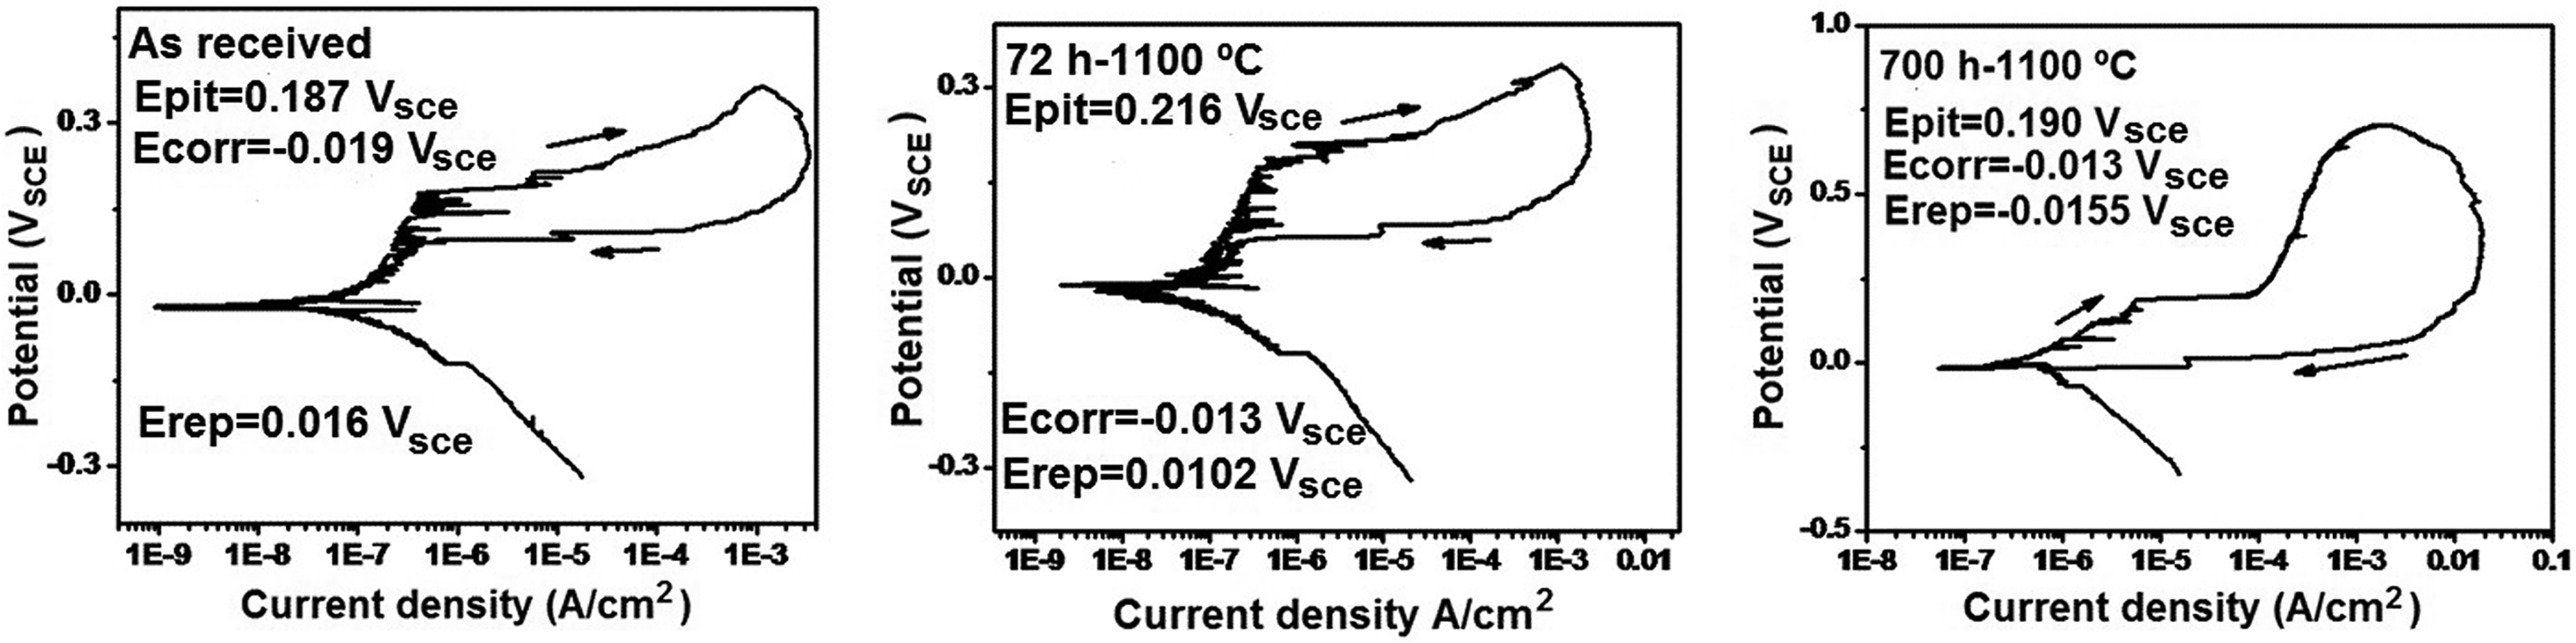
Representative cyclic potentiodynamic polarisation tests in UNS S32750 SDSS samples with different microstructural conditions.

Phase maps showing the most representative places where the pits are initiated after the CPP tests in samples of SDSS with different microstructural conditions. (a–c) Interphases with K–S OR in red and interphases with N-W OR in blue. (d–f) Σ3 interfaces in blue and Σ9 interfaces in red.
The parameters used to interpret the CPP curves are: pitting potential (Epit), repassivation potential (Erep), potential of anodic to cathodic transition, hysteresis loop and corrosion potential (Ecorr). All potentials shown in Figure 6 are average potentials referred to the SCE, that resulted of three similar cyclic potentiodynamic polarisation tests.
According to [34,35], a CPT ∼70°C was obtained in the UNS S32750 superduplex stainless steel of very similar composition to that reported in Table 1 using a 3.5 wt% NaCl solution as electrolyte. This temperature is very close to the CPT obtained in the as received samples as shown in Figure 5.
The CPP tests presented in Figure 6 indicate that the Epit was higher for the sample annealed for 72 h, while the sample annealed for 700 h exhibited a pitting potential similar to that of the sample in the as-received condition. Furthermore, the sample annealed for 72 h showed the greatest difference between Epit and Ecorr (ΔE), increasing its resistance to pitting nucleation. In other words, the samples annealed for 72 h showed an improvement in corrosion resistance compared to the others according to the CPP and CPT tests. Table 4 shows the average values with their uncertainties of the Epit, Erep and Ecorr potentials after the cyclic potentiodynamic polarisation measurements. The pitting nucleation resistance ΔE = |Epit − Ecorr| represents the amplitude of the passive domain and it was also incorporated to Table 4.
Average values of the pitting potential (epit), corrosion potential (ecorr), repassivation potential (erep) and amplitude of the passive domain ΔE corresponding to the CPP tests of SDSS samples with different microstructural conditions
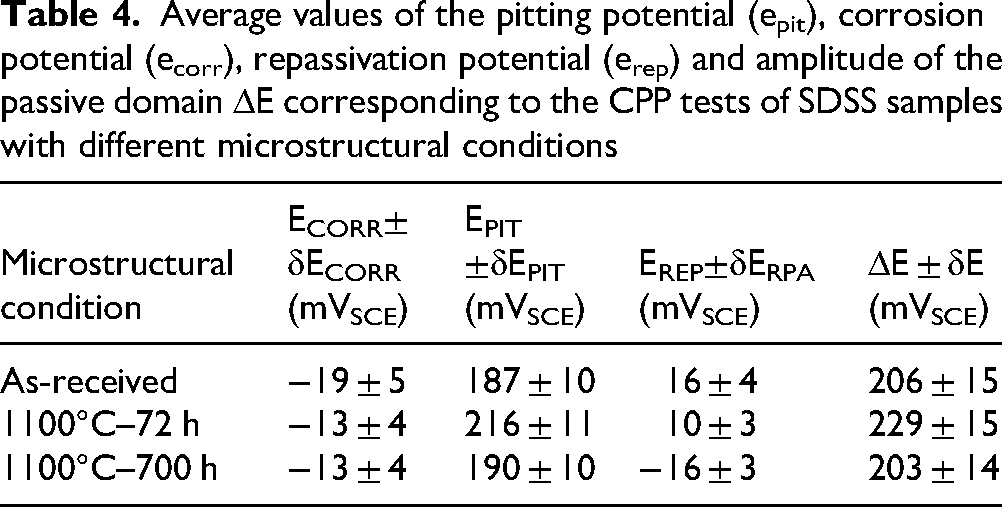
Figure 7 shows a representation of the microstructural evolution observed in 15 random regions of the samples with different microstructural conditions after the cyclic potentiodynamic tests. Each observed region contained two or three pits, so the total number of pits observed in the samples for each microstructural condition was approximately 40. Different pit initiation locations are distinguished depending on the microstructural condition of the samples.
Representative images from EBSD, BSE and optical microscopy (Figures 7 and 8) revealed that the as-received samples, as well as those treated at 1100 °C for 72 h, exhibited pitting predominantly at the phase boundaries between ferrite and austenite. Once nucleated, these pits complete their development towards the ferrite phase, even though ferrite has a higher PREN value than austenite. The pits in the samples annealed for 700 h are localised within the austenite grains and at the phase boundaries, but they primarily develop towards the austenitic phase. The initial location of the pits, their growth direction, and their sequence are important for understanding the influence of microstructural evolution on the corrosion resistance of the alloy.

BSE and light optical images of an annealed sample during 700 h. The pits locations are shown in the microstructure. Line scan over a pit within the austenite phase.
The pitting resistance of the samples according to the above results cannot solely be explained due to the compositional changes between ferrite and austenite during the annealing treatment. Figure 9 shows the morphological evolution of the microstructure and the interface character distributions under the different conditions of the prolonged annealing. Figure 10 shows the misorientation angle histograms for the austenite-austenite, ferrite-ferrite and austenite-ferrite boundaries.

EBSD maps of samples in the as-received condition and annealed at 1100°C during 72 and 700 h, respectively: (a–c) IPF maps of samples with different microstructural conditions, (d–f) the boundary misorientation maps of these samples and (h–j) phase maps of samples with different microstructural conditions highlighting the boundaries with rational orientation relationships (interfaces with K-S or in blue and interfaces with N-W or in red).
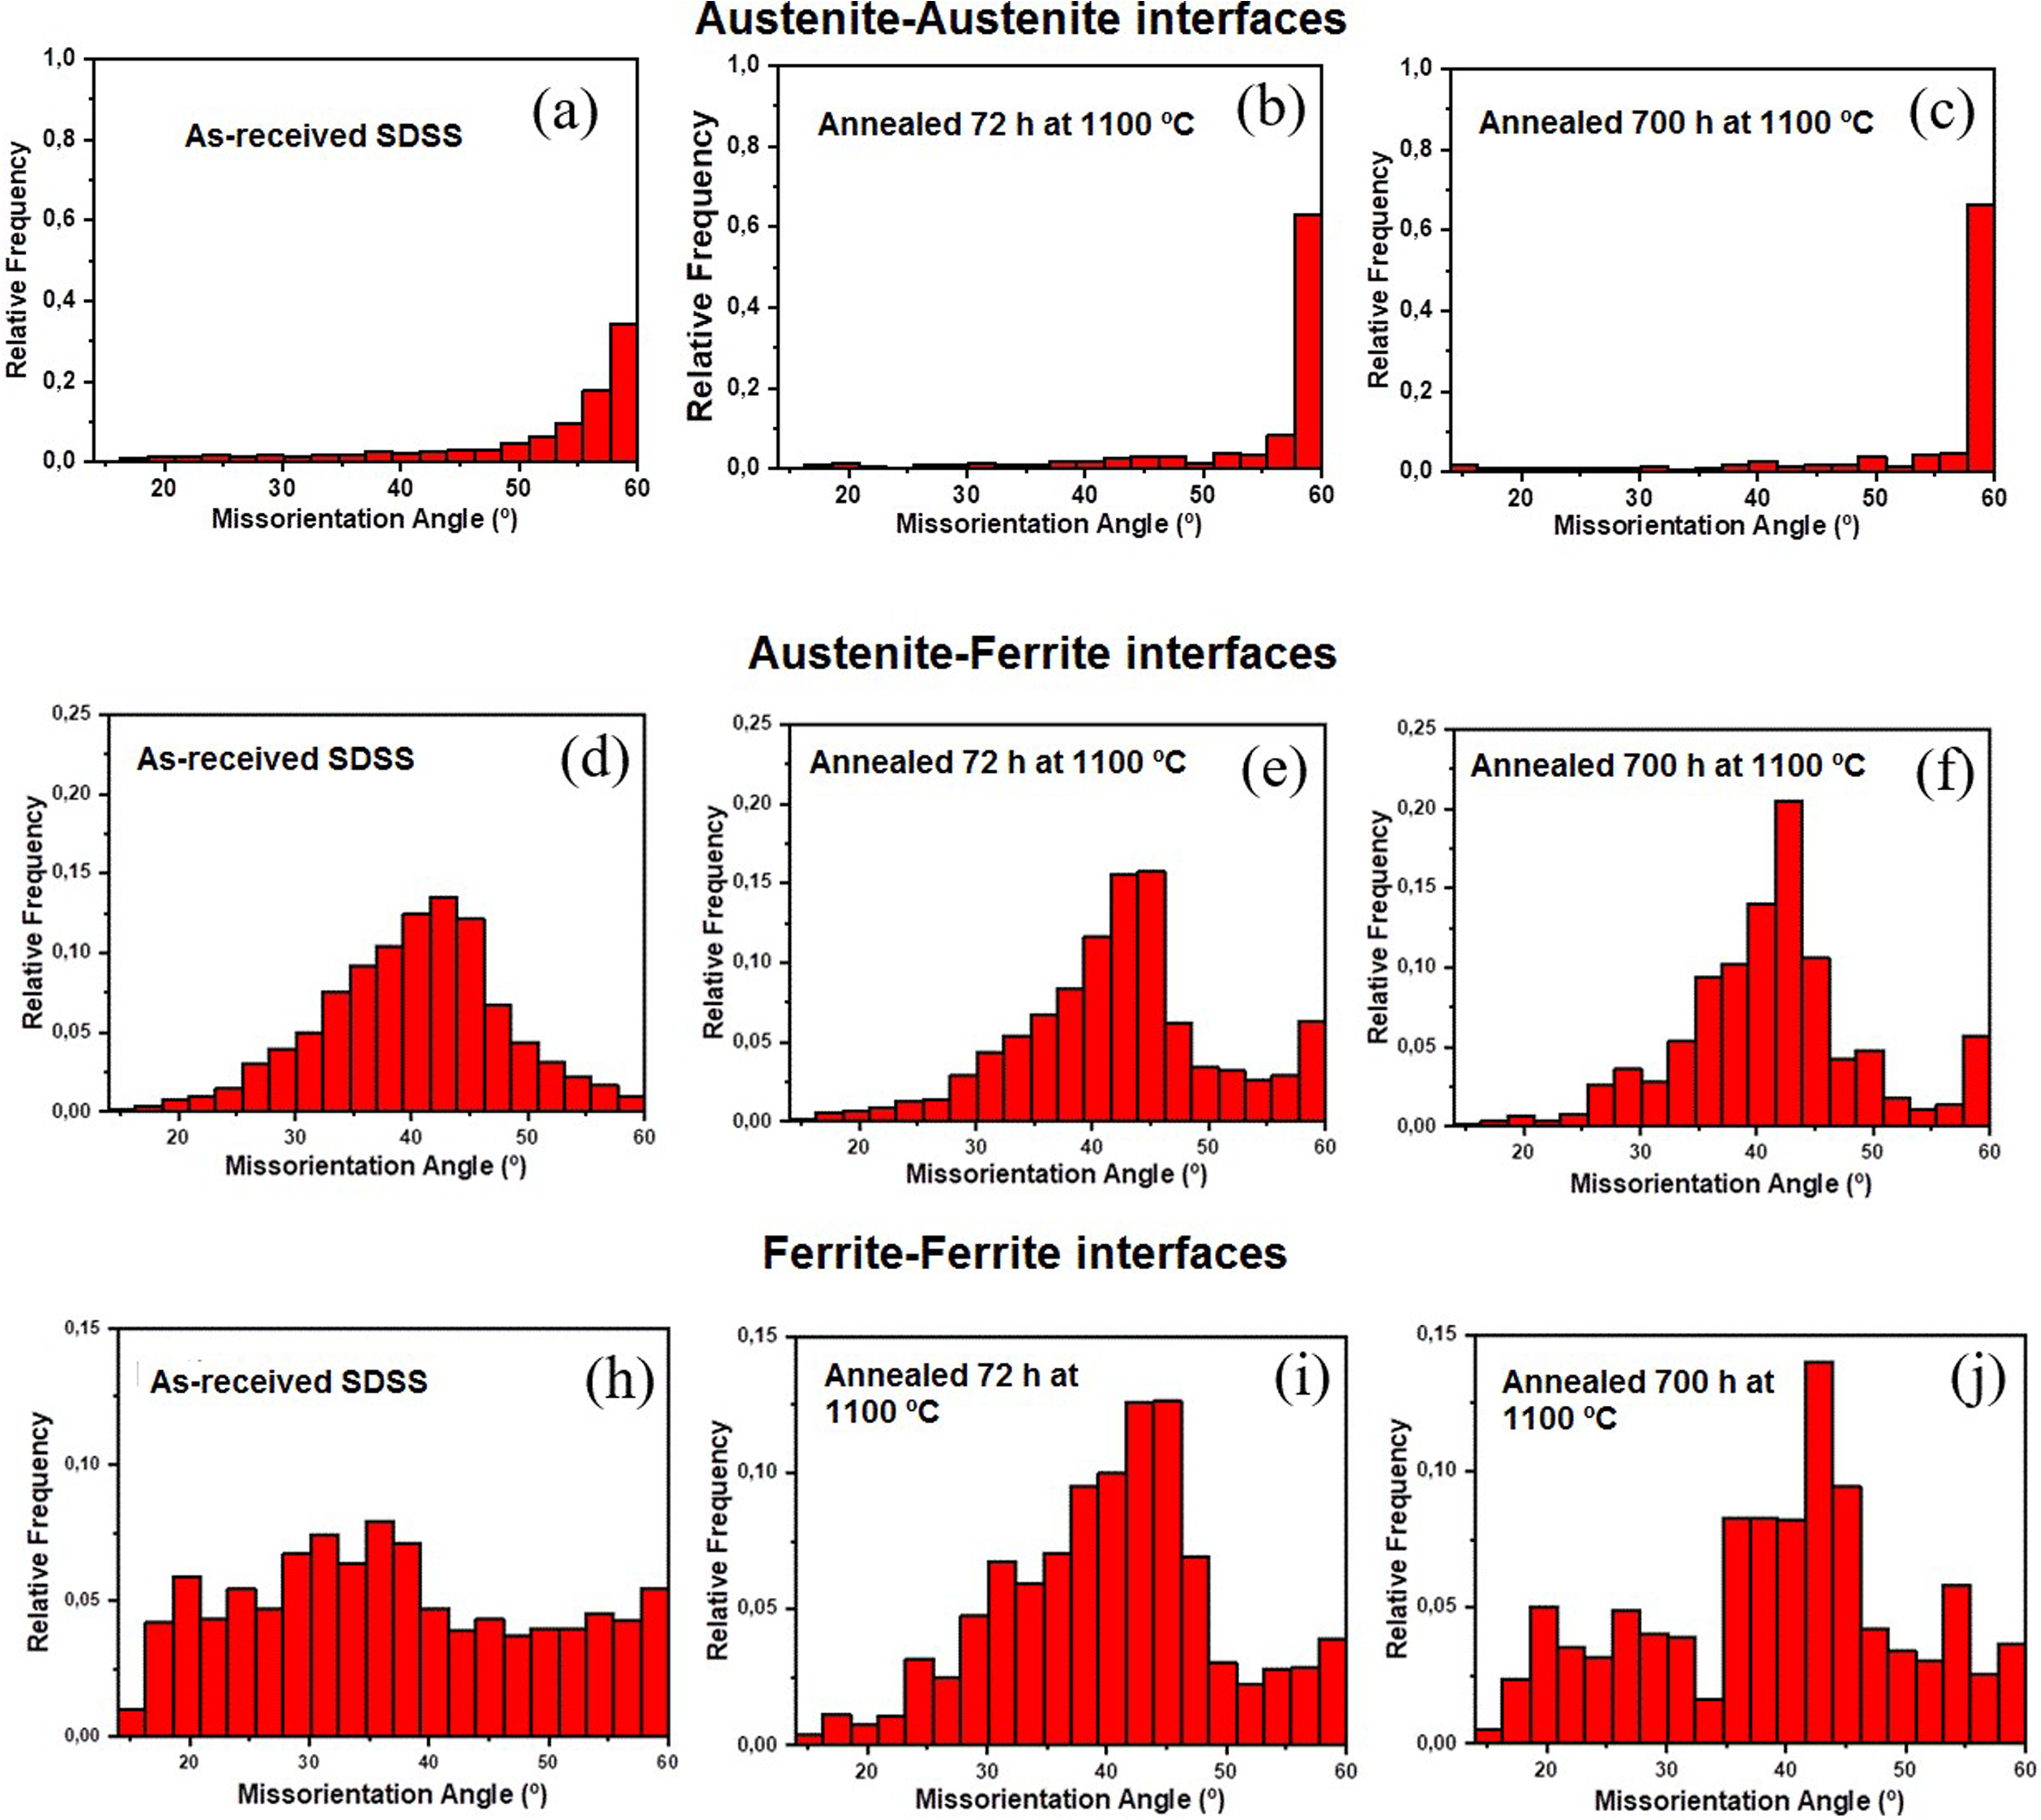
Misorientation angle histograms corresponding to interfaces of samples with different microstructural conditions. (a–c) Austenite-austenite interfaces. (d–f) Austenite-ferrite interfaces. (h–j) Ferrite-ferrite interfaces.
The crystallographic evolution of the phases can be analyzed in the IPF maps, where the remaining textures of the as-received condition is randomised by the annealing treatment (Figure 9(a–c)). The prolonged annealing time at 1100°C (Figure 9(d–f)) increases the fraction of low-ΣCSL boundaries (Σ3 twin boundaries) in austenite and correspondingly the number of twins. This is due to the extensive mobility of the austenite grain and sub-grain boundaries during their growth. Figure 9(h–j) shows the phase maps where boundary phase segments with rational ORs (K-S and N-W) are depicted.
Figures 9 and 10 show that the prolonged annealing thermal treatment promotes rational orientation relationships between ferrite and austenite (K-S and N-W) given by the higher frequency of interfaces around 42° (maximum misorientation peak) in Figure 10(f). The used tolerance for this OR was 2.5° around the exact misorientation angle. The predominance of the K-S orientation relationships over the N-W ones is evident, indicating that with annealing time, the atomic fit between both phases evolves towards the K-S orientation relationship ({111}γ/{110}δ). Phase boundaries with the K-S orientation relationship have the lowest associated energy compared to irrational boundaries. 28 Most austenite-austenite interfaces have a misorientation near of 60°, which corresponds to Σ3 CSL interfaces with a character of 60°/<111> (Figure 10(a–c). These Σ3 CSL interfaces (twin interfaces) are characterised by the low interfacial energy. 36 The Σ9 fraction was insignificant due to the absence of a secondary misorientation peak around 39°, which corresponds to a misorientation character of 38.9°/<110>. This indicates that interfaces Σ3 are not mostly interconnected. The distribution of ferrite-ferrite misorientation angles did not show a specific peak, more evident in the as-received sample, whose grain sizes were the smallest (Figure 10(h–j)).
It is well documented in the literature that an increase in δ/γ boundaries with rational orientation relationships (more coherent) significantly enhances pitting corrosion resistance.37,38 This is due to the low probability that these semi-coherent interfaces have for the segregation of substitutional elements and precipitation of harmful second phases.39,40
Low-CSL interfaces also influence in the resistance to localised corrosion. The low CSL interfaces are resistant to different types of corrosion.39–41 Many authors have demonstrated that Σ3-coherent interfaces are highly resistant to corrosive attack due to their small excess energy.42–44 Thus, an increase in the fraction of low-ΣCSL interfaces (Σ3 interfaces) must improve pitting corrosion resistance of the austenitic phase. This is consistent with the EBSD images after performing CPP tests on samples with different microstructural conditions. Figure 7 shows an EBSD image where there are no pits present at the rational δ/γ boundaries, nor at the low ΣCSL interfaces (Σ3 and Σ9) in the austenite.
In this study, cyclic potentiodynamic tests and CPT calculations show that increasing rational interfaces and low-ΣCSL interfaces during prolonged annealing at 1100 °C improves the alloy's resistance to localised corrosion. Then, increasing the density of low-energy interfaces in the alloy improves the passive film stability and reduces the probability of pitting at high-energy boundaries. 36
The literature6,45 indicates that the initial stage of pit formation is governed by the PREN of the weaker phase. Following this reasoning, the sample (UNS S32750 SDSS) in the as-received condition should exhibit greater resistance to pitting corrosion due to its lower ΔPREN value. The experimental results (Figures 5, 6, 7, 8 and Table 4) showed how the microstructural modifications during prolonged annealing can alter the initial stage of pitting formation and consequently the corrosion resistance of the weaker phase.
According to Reference 45, an increase in ΔPREN between the two phases, with austenite being the weaker phase, results in a decrease in both the pitting potential and the Critical Pitting Temperature (CPT) of the alloy. This reduction in pitting potential and critical pitting temperature (CPT) is influenced by the volume fraction of austenite, since a higher fraction of this phase leads to a smaller decrease in both parameters. However, in the present study, the behaviour of the pitting potential and CPT deviates from this trend. Specifically, the sample annealed for 700 h, despite having a higher ΔPREN and a lower austenite fraction, has a similar Epit to the as-received sample and an increased CPT. This is due, among other factors, to the microstructural evolution of austenite, the weakest phase, during prolonged annealing, which has the highest proportion of Σ3 interfaces and rational phase boundaries (K-S OR). It is also noted that these prolonged annealing increase grain size of phases with their respective effects on the passive film and corrosion resistance of the alloy. Table 5 shows the fractions of boundaries δ/γ with rational ORs and low-ΣCSL interfaces in austenite. The Σ3 CSL interfaces (twin boundaries) predominate at longer annealing time.
Fractions of special interfaces in samples with different microstructural conditions
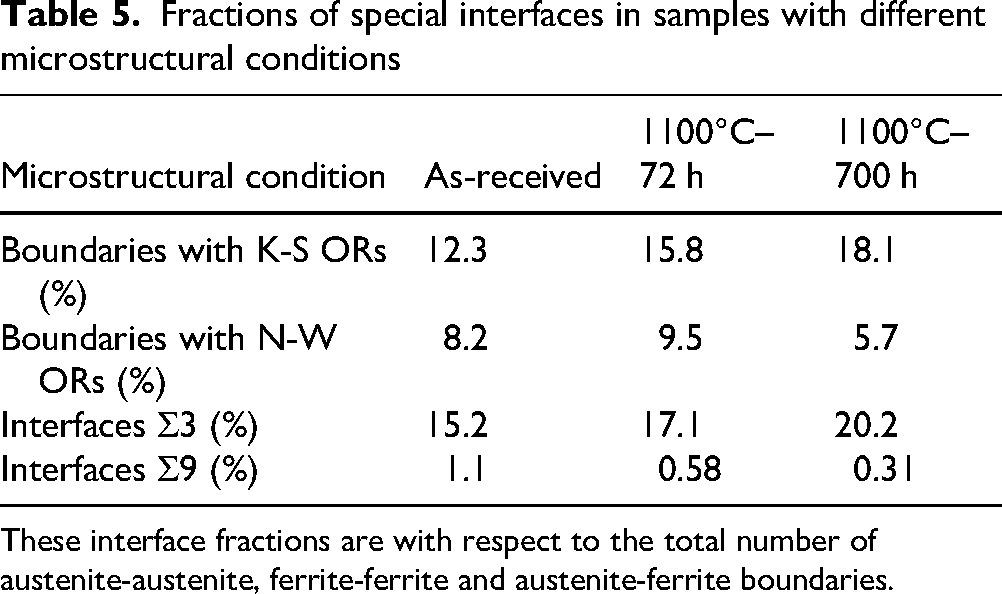
These interface fractions are with respect to the total number of austenite-austenite, ferrite-ferrite and austenite-ferrite boundaries.
Table 5 indicates that the sample in the as-received state has the lowest content of Σ3 CSL interfaces. This is because this condition has the highest proportion of phase boundaries, where random boundaries predominate. These phase boundaries restricts the mobility of interfaces, resulting in fewer twins and consequently fewer Σ3 CSL interfaces. The results suggest an interrelation between the chemical composition of the phases, as indicated by the PREN values, and the evolution of their interfaces during prolonged annealing at this high temperature.
Numerous studies15,46 show that due to the synergy between nitrogen, chromium and molybdenum, once metastable pitting forms in duplex stainless steels, its initial growth is directed towards the phase with lower PREN. Subsequently, this growth continues towards the ferrite phase, regardless of the ferrite PREN value in chloride-rich solutions. Consequently, the actual breakdown of the passive film will occur mainly in the ferritic phase, revealing a higher corrosion resistance of the austenitic phase in such environments.45,47 The behaviour regarding the formation and evolution of pitting described above can be influenced by factors such as the cooling rate from high temperatures, the chemical composition of the steel, the oxidising environment, heat treatments and microstructural factors, among others.
Prolonged heat treatments at high temperatures promote a more uniform distribution of chemical elements between the phases, thereby reducing the synergistic effects outlined in References 15 and 46. Additionally, prolonged annealing at 1100 °C enhances the mobility of boundaries, which reduces the energy of their interfaces. This explains the pitting evolution during annealing at 1100 °C. The as-received sample exhibits minimal ΔPREN and ΔPhase, with a predominance of mostly random or irrational phase boundaries. Consequently, it is logical to observe pitting at these boundaries. In this condition, pitting occurs at random phase boundaries, initially progressing to both phases before finally progressing towards ferrite. In samples annealed for 72 h, pitting is also concentrated at the phase boundaries, with a preferential growth direction toward ferrite, influenced by the microstructural evolution of the phases and the nature of the austenite interfaces. Conversely, the samples annealed for 700 h, which have the highest ΔPREN and the lowest austenite volume fraction, mainly show pitting within the austenite because it is the phase with the lowest PREN. Additionally, a significant proportion of pits is also found at the phase boundaries, growing towards the austenite phase (Figure 7). According to Table 3, based solely on chemical composition, the as-received sample would show the highest resistance to pitting corrosion. However, from a microstructural perspective, these samples have the lowest fraction of special boundaries, making them less resistant to corrosive attack compared to other samples subjected to prolonged annealing treatments.
In contrast, samples annealed at 1100 °C for 700 h exhibit the greatest difference between their phase fractions and PREN values. From a compositional point of view, these samples would be the least resistant to corrosive attack, with austenite identified as the weaker phase. Notably, many pits were found at the grain boundaries rather than exclusively within the austenite grains, which was unexpected given the lower PREN value of this phase. This prolonged annealing significantly increased the fraction of Σ3 CSL interfaces (annealing twins) within the austenite grains, thereby enhancing the pitting corrosion resistance of this phase. The microstructural evolution associated with the increase in Σ3 CSL interfaces enhances the pitting corrosion resistance of the austenitic phase, as also noted in Reference 19. Furthermore, the increase of rational δ/γ boundaries at this prolonged annealed treatment diminish the fraction of irrational boundaries prone to pitting. All of this can explain the similar breakdown potential of the samples treated at 700 h with a greater grain size and higher ΔPREN with respect to the as-received samples. An interesting situation arose in the samples annealed at 1100 °C for 72 h, as they exhibited higher resistance to pitting corrosion according to the CPT and CPP tests. These samples showed favourable microstructural characteristics, coupled with an appropriate chemical composition of their phases (partition of the main chemical elements). Unlike the other microstructural conditions, this annealed treatment revealed a high fraction of special interfaces and a not very significant difference between the PREN values of both phases. It is worth noting that, although the austenitic phase in this thermal condition had a lower PREN value than the ferritic phase, no pitting was observed within the austenite grains. Thus, the samples annealed for 72 h displayed superior resistance to pitting corrosion compared to the as-received samples, which had the lowest ΔPREN and ΔPhase.
This highlights the importance of considering all factors that influence the pitting corrosion resistance of these duplex stainless steels during their use in chloride solutions at high temperatures for extended periods. Each temperature induces microstructural changes and alters the chemical composition of each phase during service, thereby affecting pitting corrosion behaviour of the weaker phase. Consequently, comprehensive microstructural analyses and precise determination of the chemical composition of each phase will facilitate a reliable assessment of the pitting corrosion resistance of SDSS throughout their service life.
Conclusions
From the analysis of the results obtained we can conclude:
Prolonged annealing at 1100 °C facilitates the formation of ferrite-austenite boundaries with rational orientation relationships (K-S and N-W). The predominance of K-S orientation relationships over N-W suggests that, with extended annealing time, the atomic fit between the two phases increasingly favours the K-S orientation. These semi-coherent phase boundaries have proven to be very resistant to corrosive pitting attack. Prolonged annealing at 1100 °C increases the fraction of Σ3 twin boundaries in austenite (weaker phase), which are recognised as interfaces that offer high resistance to pitting corrosion. The modifications observed at the phase boundaries and austenite interfaces (weaker phase) suggest an improvement in pitting corrosion resistance after annealing for approximately 72 h at 1100 °C. This occurs despite some imbalance in phase fractions and PREN values compared to the as-received condition. Furthermore, the microstructural changes that occurred during 700 h of annealing at 1100 °C resulted in an improvement in the localised corrosion resistance of the austenitic phase, despite the increase in its grain size. A correct assessment of the initial stages of pitting corrosion in SDSS during prolonged annealing at temperatures above the homogenisation temperature in chloride-rich media is achieved through knowledge of the relationship between the differences in PREN values of the phases and the structural modifications of their interfaces.
Footnotes
Acknowledgements
The authors wish to thank Fundação de Amparo a Pesquisa do Estado do Rio de Janeiro (FAPERJ) and Coordenação de Aperfeiçoamento de Pessoal de Nivel Superior (CAPES) in Brazil for the financial support offered by the project 09/2014-PVE CAPES. One of the authors (EVM) thanks FAPERJ for financial support (Processos: E-26/202.757/2023[287514] and 26/201-535/218) and CAPES for the project PVE 88881.064968/2014-01).
Funding
The authors disclosed receipt of the following financial support for the research, authorship and/or publication of this article: This work was supported by the Fundação Carlos Chagas Filho de Amparo à Pesquisa do Estado do Rio de Janeiro, Coordenação de Aperfeiçoamento de Pessoal de Nível Superior, (Grant Numbers 26/201-535/218, E-26/202.757/2023[287514], PVE 88881.064968/2014-01).
Declaration of conflicting interests
The authors declared no potential conflicts of interest with respect to the research, authorship and/or publication of this article.