
Abstract
In the extant literature on survey research, studies on expression of opinion mainly focus on psychological factors such as respondents’ perceived support for opinions or desirable attitudes based on the spiral of silence theory. In this article, although we develop our arguments based on the logic behind the spiral of silence theory, we emphasize the relationship between objective climate of opinion and opinion expression. Following the spiral of silence theory’s expectation that majority opinions increase while minority opinions drop away over time, we argue that respondents are more likely to report explicit opinions than giving ambiguous responses or nonresponses to issues with higher levels of polarization and that respondents with low response propensity are more likely to express majority opinions. To test our hypotheses, we apply a Bayesian multilevel item response theory model in our analysis of survey data from Taiwan. We find that nonresponses are less likely to occur for polarized issues and lower levels of response propensity are associated with misreporting. An implication of these findings is that individuals are more likely to express their opinions if they are informed about the similar prevalence of alternative perspectives.
Keywords
Introduction
One important issue in public opinion research is who speaks out and who keeps silent, because that affects the representativeness of survey samples and the validity of interviews. In addressing this issue, Noelle-Neumann (1974, 1993) argues that respondents’ willingness to express their true opinions depends on their perception of the opinion climate, which is known as the spiral of silence (SoS) theory. According to the SoS theory, respondents are more likely to express their opinions when they perceive that those opinions belong to the majority. In contrast, respondents will express majority opinions or keep silent when they perceive that they are in the minority. The tendency to be reluctant to express minority opinions spirals over time so that majority opinions prevail.
There are two implications of the SoS theory. The first is that the spiraling process occurs only when public opinion on an issue is one-sided rather than polarized. If this is the case, should we expect respondents to be more willing to express their opinions on polarized issues than unpolarized ones? The second implication is that there is little pressure on respondents to express majority opinions, but they are reluctant to express minority opinions. Does this mean that a stronger response propensity is required to not misreport? In other words, that response propensity is positively associated with majority opinions and negatively associated with minority opinions.
To answer the above questions, we follow the literature on willingness to express opinions but with a special focus on the climate of opinion on controversial issues in the environment. We investigate whether and how the objective climate of opinion is associated with nonresponse and misreporting through respondents’ willingness to express their opinions. We argue that nonresponse is negatively associated with issue polarization and that misreporting majority opinions implies lower levels of response propensity.
To examine the effects of issue polarization on nonresponses and the association between response propensity and misreporting, we adopt a latent variable approach with an emphasis on the characteristics of issue items. First, we assume that willingness to express an opinion is an unobserved, latent variable and apply the methods of item response theory (IRT) in an investigation of the relationship between the latent trait and item properties. Second, we specify the IRT model under a framework of Bayesian multilevel modeling to include issue polarization. We then apply the specified model to an analysis of survey data in Taiwan collected by the Taiwan Institute for Governance and Communication Research (TIGCR). Our analysis indicates that respondents are less likely to keep silent on polarized issues and that respondents with higher levels of response propensity are less likely to misreport majority opinions.
This article makes two contributions to the literature. First, we link the discussion about willingness to express an opinion in studies of the SoS theory to issue polarization. Specifically, we examine opinion expression not only on issues with a contrast between majority and minority opinions but also on those with a vast gap between two conflicting points of view. Second, unlike previous studies that focus on subjective perception of opinion climate, we test hypotheses derived from the SoS theory against data with an emphasis on behavioral information. From the perspective of IRT, we treat public opinion on policy issues as a characteristic of items and investigate the association between opinion climates in the environment and opinion expression and related issues such as nonresponses and misreporting through the estimates of latent variables. This approach does not rely on self-reported measures of psychological attributes and opinion congruency but makes inferences based on behavioral information.
The remainder of this article proceeds as follows. In Section 2, we review the extant literature on willingness to express an opinion, focusing on the spiral of silence theory. Section 3 introduces the approaches to latent variable modeling and the proposed statistical model, and this is followed in Section 4 by an illustration of the data and the presentation of the results of our analysis. Section 5 concludes the article.
Perceptions of Opinion Support and Willingness to Express Opinions
Surveys have become a major tool for data collection in both the academic and practical domains. They are frequently used in attitudinal and behavioral studies for a number of different reasons, one being that they seem to be straightforward to conduct: you ask a series of questions and receive the answers. Respondents, however, may be reluctant to answer certain questions directly due to the sensitivity of the topics involved, especially in face-to-face surveys. When faced with sensitive topics, respondents are very likely to refuse to answer those questions or answer them dishonestly (McNeeley, 2012). These reactions lead to the problems of item nonresponse and misreporting, which in turn causes measurement error and biased inferences for parameters of interest according to the framework of the total survey error (TSE) (Weisberg, 2005). 1
In public opinion research, researchers face a dilemma when they are interested in sensitive topics. On the one hand, sensitive topics are worthy of investigation because they are usually less understood. On the other hand, these topics pose problems for researchers if respondents are reluctant to discuss them. To reduce measurement error induced by sensitive topics, researchers have to understand what topics are sensitive. While there is no standard definition of a sensitive question, there is consensus on how to identify topics that are sensitive, one being issues about which respondents have concerns about disapproval or costly consequences when honestly answering questions on them (Barnett, 1998; Tourangeau and Smith, 1996).
The sensitivity of topics is twofold: the questions themselves may be intrusive—that is, they may involve an invasion of privacy—or they are topics for which an honest answer may be socially (un)desirable (Tourangeau et al., 2000). Regarding intrusive questions, individuals may feel offended when being asked for information about personal topics, such as religion, income, and sexual behavior. In such cases, they are less willing to answer. With regard to socially (un)desirable answers, individuals may take the social norms and the social environment into account and give socially acceptable answers. Although the sensitivity of questions and answers is theoretically different, it is not easy to decide whether sensitivity is induced by the question or the answer. In the following, we provide a generalized discussion about the effects of sensitive topics on opinion expression, which can be applied in both cases.
The spiral of silence proposed by Noelle-Neumann (1974, 1977, 1993) is one of the most influential theories on opinion expression. It states that individuals fear being socially isolated, so they pay attention to what opinions are mainstream in society. Accordingly, they are willing to speak out if their opinions are shared by the perceived majority, and they keep silent or express majority opinions instead if they think they hold a minority view. Over time, a spiral process takes place, in which majority opinions increase while minority opinions decline until the former prevail and the latter disappear. Simply put, individuals’ private opinions and their subjective perceptions of public opinion influence their willingness to express their opinion, which results in silence—i.e. nonresponse—or conformity with the majority—i.e. misreporting—if there is an inconsistency between the private opinion and perceived public opinion (Taylor, 1982).
Following the original work on the SoS theory, many other studies have investigated the theory’s key concepts and the relationships between them. For example, a few studies focus on the concept of fear of isolation and its attitudinal or behavioral consequences (Hayes et al., 2013; Lin and Pfau, 2007) and others examine the accuracy of individuals’ perceptions (or quasi-statistical sense) of public opinion (e.g. Abril and Rojas, 2018; O’Gorman, 1975; O’Gorman and Garry, 1976)). Except for these studies, most researchers have concentrated on studying the relationship between perceived support for one’s opinion and willingness to express that opinion. They have found a small but positive effect of the former on the latter (see Glynn et al., 1997; Matthes et al., 2018).
Some scholars have raised certain methodological issues that might lead to inconsistent or contradictory results, one being that respondents’ willingness to express their opinions is measured in hypothetical situations (Glynn et al., 1997; Scheufle and Moy, 2000). Those situations may not adequately capture the real pressure or fear that respondents feel in real situations (Hayes et al., 2001). With an experimental design that reflects a more realistic situation, for example, Hayes et al. (2001) find a stronger correlation between perceived support for one’s opinions and willingness to express those opinions than the results observed in meta-analyses.
Another issue concerns the characteristics of topics, that is, whether they are morally laden (Matthes et al., 2018; Scheufle and Moy, 2000). As Noelle-Neumann (1993) argues, individuals feel social pressure and tend to provide socially desirable responses when the topics of discussion have a moral component. Although most of the studies focus on morally laden issues such as abortion (Salmon and Neuwirth, 1990) or naturalization of immigrants (Matthes et al., 2010), some research analyzes controversial but less morally laden issues such as measures to restrict air pollution versus car use and nuclear regulation versus the need for electricity (e.g. Taylor, 1982). According to their results, it seems that the spiral of silence can occur when the climate of opinion on controversial topics indicates that the majority viewpoint contrasts with the minority one.
Following the above studies, in this article, we investigate three different aspects of the association between climate of opinion and survey responses. First, we examine controversial issues upon which opinions are polarized. The SoS theory hypothesizes that individuals’ perceptions of public opinion on value-laden issues determine their opinion expression. The issues examined in most of the previous studies have a unimodal distribution and are skewed to one tail. In modern society, there are more and more complex issues upon which individuals have diverse opinions, and it has been claimed that the public has become increasingly polarized over a number of issues in recent decades around the world (e.g. Druckman et al., 2013; Levendusky and Malhotra, 2016). Therefore, we extend the discussion of the spiraling process from morally laden issues to polarized ones.
Second, we focus on the climate of opinion in the environment, which is termed the objective climate of opinion, rather than individuals’ perception of others’ opinions. The extant literature investigates individuals’ willingness to express their opinions with a special focus on subjective perception of social climate. There is no doubt that examination of the relationship between perceived public opinion and willingness to express opinions has important theoretical implications for the effects of perceptions on attitudes and behaviors (Miller and Prentice, 1994; Scheufele and Eveland, 2001). However, as we mentioned above, some studies have questioned the accuracy of subjective perceptions of public opinion and shown that the perceptions are biased due to their reflection of opinions of certain groups (e.g. Fields and Schuman, 1976; Kennamer, 1990). Moreover, in a practical sense, it is highly unlikely that a general-purpose survey will include a battery of questions designed to reveal respondents’ willingness to respond and their perceptions of public opinion on all of the involved issues. Instead, we can easily find out the objective climate of opinion.
Finally, we investigate the effects of issue polarization on nonresponses and the effects of response propensity on misreporting. By issue polarization, we mean the distributions of two conflicting issue positions. The SoS theory hypothesizes that individuals will keep silent or express majority opinions when they hold opinions shared by only a minority. We derive two empirical implications from the SoS theory. First, the theory implies that a spiraling process occurs only when there is a majority opinion on certain issues. In other words, respondents are less concerned with being socially isolated when their views are shared by a group that is as large as the group holding the opposite view. Following this logic, we argue that respondents are likely to report explicit opinions rather than giving ambiguous responses or nonresponses on polarized issues, which is our first hypothesis to be tested:
There are other explanations for the relationship between issue polarization and item nonresponse. First, polarized issues are likely to be more salient as a result of competition between party elites, as the stances of political elites provides the public with cues indicating where they should stand on those issues (Bullock, 2011; Levendusky, 2010). Second, following the logic of the SoS theory, individuals’ fear of being isolated from their in-group influences their willingness to express certain opinions (Bergamaschi Ganapini, 2023; Robertson et al., 2022). Although the mechanisms underpinning the relationship between issue polarization and item nonresponse are different, a similar result is expected, that is, nonresponse is more likely for polarized issues. 2
Second, the SoS theory implies that respondents are under little pressure to express majority opinions but are reluctant to express minority opinions. We argue that individuals with weak response propensity tend to succumb to pressure while those with strong response propensity do not. That is, expressing majority or minority opinions is associated with response propensity. Thus, we have our second hypothesis to be tested:
Willingness to Express Opinions as a Latent Variable
One way of investigating individuals’ attitudes and opinions is to ask them directly. Take willingness to express opinions as an example. Survey researchers could ask respondents this question: “Generally speaking, would you be willing to express your opinion publicly?” One potential problem of this approach is that most respondents would say “yes,” because expressing opinions is socially desirable in a democracy. If that is the case, the response does not reflect their true willingness to express their opinion. An alternative way is to infer willingness from individuals’ responses to questions. For example, after having asked respondents a battery of questions, we could say something about their willingness to express their opinions by counting the number of questions with valid responses or nonresponses.
The latent variable modeling approach is usually applied when analyzing data in the latter case. One latent variable model is derived from item response theory (IRT), which explains the relationship between latent traits and their manifest variables (Embretson and Reise, 2000). In IRT, latent traits are estimated along with the properties of items by considering the information contained in individuals’ responses. In the case of willingness to express opinions, willingness to respond can be treated as a latent variable and its estimate depends on the responses and nonresponses to items that are taken into account.
In the literature on the analysis of missing data, IRT methods have been applied to deal with the problem of survey nonresponse. In this approach, it is assumed that a latent trait, “response propensity,” determines whether individuals respond to items or not. Specifically, individuals with higher levels of response propensity are more likely to provide valid responses while those with lower levels are more likely to be nonresponders. If nonresponses are treated as missing data, then the responses are missing not at random (MNAR) because the missingness is dependent on unobserved variables, i.e. response propensity (Little and Rubin, 2002).
Concerning the association between response propensity and nonresponse, IRT models are used to deal with non-ignorable missing data in at least two ways. The first application of IRT focuses on computing response propensity and uses the estimates of response propensity in the weighting process to reduce biases induced by item nonresponse (e.g. Glas et al., 2015; Moustaki and Knott, 2000) and unit nonresponse (e.g. Matei and Ranalli, 2015; Peress, 2010). The second application of IRT focuses on an interested attitude dimension and treats missing values, along with valid responses, as a response category determined by the latent attitude (e.g. Moustaki and O’Muircheartaigh, 2000; Tsai, 2023).
Now we will consider the first application of IRT models mentioned above in which response propensity is the latent trait of interest. One important advantage of latent variable models in our analysis of willingness of express opinion is that we infer tendency toward responding to survey items from behavioral information, i.e. observed valid responses and nonresponses to survey items. Since we are concerned about the possibility of expressing opinions insincerely, it would be inappropriate to rely on self-reported information on willingness to respond. A more appropriate approach is to rely on information about observed behavior.
Suppose, for items
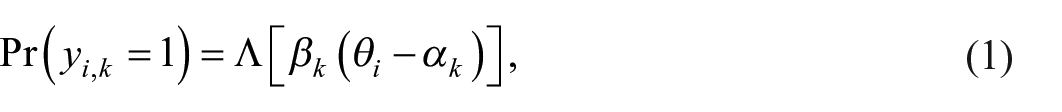
where
Some of the studies focusing on the estimation of latent response propensity suggest that estimation could be improved if researchers included covariates (e.g. Glas et al., 2015; Peress, 2010). We argue that covariates are included not only for methodological reasons but also for theoretical ones. In this article, we include the aggregate distribution of opinions on the studied items. Building on the framework of multilevel modeling, the item-difficulty parameters

where
The inclusion of item-level covariates allows us to examine how item characteristics influence item sensitivity, which in turn leads to valid responses or nonresponses.
Item response models demonstrate two identification problems: scale invariance and rotational invariance (e.g. Albert, 1992; Johnson and Albert, 1999). The problem of scale invariance occurs because the metric (location and scale) of the latent traits is only known up to a linear transformation. Therefore, one must anchor the metric of the latent traits. The problem of rotational invariance refers to the fact that, for the unidimensional case, multiplying all the model parameters by
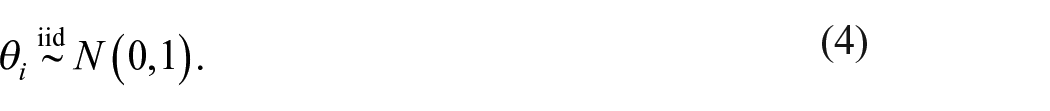
In the Bayesian context, the use of informative prior distributions resolves these two identification problems (Johnson and Albert, 1999). First, in typical IRT models, the problem of scale invariance can be solved by assuming that latent variables are sampled from a standard normal distribution (Jackman, 2009: 460), that is,
Second, the rotational invariance problem is solved by restricting item-discrimination parameters to be positive, that is,

where
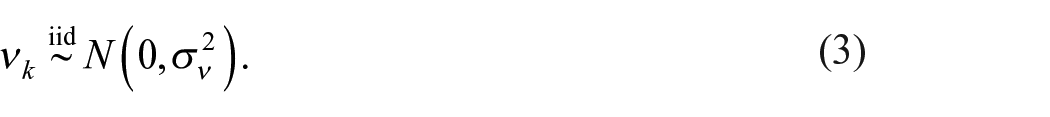
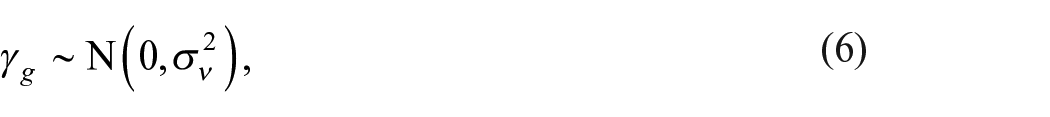
Finally, we complete the model specification by defining prior distributions for the remaining parameters which are not related to the identification problems. We assume that coefficient parameters

Data and Statistical Analysis
To examine the effects of aggregate distribution of opinions on nonresponses while estimating the latent response propensity, we analyzed data from a face-to-face survey conducted by the Taiwan Institute for Governance and Communication Research (TIGCR). 3 TIGCR’s Political Polarization Survey (PPS) collected public opinion on several controversial issues in Taiwan. The statements of the options concerning these issues are displayed in Appendix A. There are five waves of panel data from 2018 to 2022, and in this article, we analyzed only the first-wave data, TIGCR-PPS2018, for two reasons. First, we are interested in item effects and response propensity through the contrast between explicit responses and ambiguous responses or nonresponse, and the rates of ambiguous responses and nonresponse decreased in the following waves because the respondents who were willing to take part in follow-up surveys were also more willing to respond. 4 Second, we are not considering dynamic effects or inter-person variations and thus the single-wave survey data better serve our purpose. The TIGCR-PPS2018 data consist of 2484 nationally representative samples collected between July 9 and November 23, 2018. 5
Descriptive Statistics
We analyzed eight items concerning several issues that have recently aroused controversy in Taiwan, including transitional justice, economic dependence on China, energy policy, labor rights, same-sex marriage, and social welfare. 6 These issues are controversial because government policies on them have aroused a great deal of popular opposition. In Taiwan politics, there are two coalitions, known as the “pan-blue camp” (led by the Kuomintang (KMT), or the Nationalist Party) and the “pan-green camp” (led by the Democratic Progressive Party (DPP), the governing party since 2016). The DPP and KMT are in conflict with each other on all these issues except labor rights, same-sex marriage, and social welfare (which involves the provision of long-term care). There is obvious disagreement within both parties on the former two issues, but they agree on the latter one. 7
In the survey, respondents were presented with two options on each of eight issues and asked which option they agreed with. One of the options reflected the position of the government while the other reflected the opposite stance. For example, concerning the issue of same-sex marriage, respondents were asked whether they agree with the statement “same-sex marriage should be prohibited” or the statement “same-sex marriage should not be prohibited.” The choice of the former option indicates support for government policy and choosing the latter indicates opposition to government policy. Although respondents were asked to choose only one option, some indicated they agreed or disagreed with both.
Table 1 shows the distributions of the responses to these issues and the results are summarized as follows. 8 First, a majority agrees that violations of human rights during the authoritarian period should not be investigated (54.21%). Second, a plurality is against economic over-dependence on China (44.28%). Third, a majority agrees that Taiwan should continue to use nuclear power (52.33%) and that coal-fired generation should not be increased (53.20%). Fourth, a plurality agrees that labor regulations should be made more flexible (47.18%) and opposes same-sex marriage (44.95%). Fifth, a majority is in favor of increasing expenditure on long-term care (79.23%). Finally, a majority supports pension reform to avoid the accumulation of government debt (61.74%). These results show that, except for the second and the last two issues, the majority of respondents do not support government policies.
Distributions of Responses to Controversial Issues (%) in 2018.

Note: nonresponses include DK and “refuse to answer”; relative weighted frequencies are displayed.
From Table 1, we can observe at least three patterns of responses to these issues. First, the responses to items 1, 3, 4, 7, and 8 show a majority on one of the two options. Second, item 2 has a unimodal distribution concentrated on one option, but there is no majority on either options and about 40% of the respondents did not provide an explicit response. Finally, the responses to items 5 and 6 seem to be polarized because the difference in relative frequencies between the two options is less than 10%, given that the response rates are around 85%.
According to the distributions in Table 1, if we consider only nonresponses to be solely the result of topic sensitivity, it seems that none of these eight issues is highly sensitive since the percentage of nonresponses is only around 10% for all of them. But if we also treat ambiguous responses (the fourth and fifth columns in Table 1) as nonresponses, the China issue becomes highly sensitive compared to the others because the nonresponse rate is around 38%. Moreover, the energy issue, which is covered by items 3 and 4, would become relatively sensitive as its nonresponse rate is about 18%.
Issue Polarization and Item Nonresponse
To estimate propensity to report explicit responses, we analyzed the explicit responses and nonresponses to these eight items using the Bayesian multilevel IRT model specified above. 9 In our analysis, we consider ambiguous responses—“agree on both” and “disagree on both”—to be nonresponses and the choice of one of the two options as a valid response. Some respondents may consider the options for some issues as being not mutually exclusive and that agreement or disagreement with both is possible. We argue that these options do, to some extent, contrast with each other and that it would be unreasonable to agree or disagree with both. Moreover, agreeing or disagreeing with both is not an explicit response which is the main interest of our analysis. 10
As Equation (2) shows, we can include item-level covariates to examine how item characteristics induce nonresponses through item-difficulty parameters. One of the item-level covariates is the extent of issue polarization, which is represented by the product of the two proportions. The product is normalized by dividing by 25 to make the values of issue polarization variable ranging from 0 to 100 with larger values indicating greater polarization. For example, the value for item 1 is
We also have covariates indicating the types of issues, including political (transitional justice and China market), energy (nuclear power and coal-fired power), social rights (labor regulation and same-sex marriage), and welfare (long-term care and pension reform), with welfare as the reference category. These covariates are included to test for an alternative mechanism that explains the association between opinion expression and issue polarization. One may argue that people are more willing to respond to questions about polarized issues because those issues are salient and people have opinions about salient issues. In Taiwan, the two political issues are more salient than the other issues. If the salience of issues is important to opinion expression, we should observe different effects for different issue types. 11
We first present the estimates of item parameters with the posterior means and 95% highest posterior density (HPD) intervals in Figure 1. 12 The estimates of item-difficulty parameters are displayed in the left panel of Figure 1, and the estimates of item-discrimination parameters are displayed in the right panel. From the left panel of Figure 1, we find that the issue concerning Taiwan’s economic dependence on China is a relatively “difficult” or “sensitive” item because the estimate is larger. Same-sex marriage and long-term care, by contrast, are relatively less sensitive issues. 13 These results indicate that respondents are less willing to express their opinions on the former issue and more willing to express their opinions on the latter two. One other interesting finding is that same-sex marriage and long-term care are the most and least polarized issues, respectively. This finding appears to indicate that there is no strong association between issue polarization and nonresponses.

Estimates of Item-Difficulty and Item-Discrimination Parameters; the Filled Circles Indicate the Posterior Means and the Solid Lines are 95% HPD Intervals.
We then look at the estimates of item-discrimination parameters in the right panel of Figure 1. We can see that the estimates for same-sex marriage and long-term care are relatively lower, which means that they are less able to differentiate between respondents with similar levels of latent trait, i.e. response propensity. By contrast, issues concerning transitional justice, nuclear power, coal-fired power, labor rights, and pension reform perform better in terms of differential capability. Despite the relative differences mentioned above, overall, all the items have estimates larger than 1, which indicates that they are good measures for differentiating between levels of latent traits.
Finally, we display the estimates of item-level coefficients specified in Equation (2) in Table 2. From Table 2, we find that the posterior mean of the coefficient for issue polarization (−0.02) is negative and the upper bound of the 95% HPD interval is less than 0. This means that, for these items, as the aggregate distribution of opinions is more polarized, the difficulty level is lower, which in turn leads to a lower probability of nonresponses. In other words, respondents with the same level of response propensity are more likely to express their opinions on polarized issues. In contrast, respondents are more likely to submit nonresponses when there is a majority opinion on a given issue. This finding provides evidence to support our first hypothesis. Moreover, compared to welfare issues, political, energy, and social issues do not have an impact on item difficulty. That is, nonresponses are not systematically induced by the type of issue even though some of them are salient issues in the political environment.
Estimates of Item-Level Coefficient Parameters.

The implication of the finding that nonresponses are less likely to occur for polarized issues is as follows. As we encounter more and more complex problems in modern society, it is less likely that there will be a consensus or prevailing opinion on those problems. Without a predominant opinion, people will be more willing to express their opinions than to keep silent. If this is the case, public opinion surveys will help researchers and government officials understand people’s attitudes toward these polarized issues. In contrast, when there is a predominant opinion, individuals are less likely to express their opinions. In this case, public opinion on unpolarized issues might be biased.
Response Propensity and Misreporting
According to Taylor (1982: 315), the SoS theory suggests that willingness to express one’s opinion is influenced by one’s own opinion and one’s assessment of the prevailing public opinion. Specifically, respondents who have opinions shared by a minority are reluctant to express their opinions. If they do express opinions, they are more likely to express majority opinions. This implies an association between response propensity and expressing majority/minority opinions. Namely, respondents with low response propensity are more likely to misreport, especially those who hold minority opinions.
We examine the possibility of an association between response propensity and misreporting in the following way. We take a brief look at the association by dividing respondents into two groups based on the estimates of response propensity: higher and lower response propensity. We use the mean of the estimates as the threshold, so the groups consist of 1418 and 1066 respondents, respectively. 14 The distributions of responses across groups are presented in Table 2. Comparing the majority/minority opinions of the two options in Table 1 and Table 2, we find that the results for the group with low response propensity correspond to those in Table 1 while the results for the group with high response propensity do not. Specifically, the majority opinion on same-sex marriage involves government policy. Moreover, the ratios of percentages for majority opinions to minority opinions are larger for the group with low response propensity than for the group with high response propensity (Table 3). These results indicate that respondents with low response propensity are more likely to express majority opinions.
Responses to Controversial Issues across Response Propensity (%).

Note: nonresponses include DK and “refuse to answer”; relative weighted frequencies are displayed.
To systematically examine the association between response propensity and the expression of majority/minority opinions at the individual level, we conducted a binary logistic regression analysis for all eight items. In the regression analyses, the outcome variable is expressing a majority or minority opinions for each issue, and majority opinions are coded as 1 and minority opinions as 0. The main explanatory variable is response propensity which is a continuous variable estimated by the IRT model in Section 4.2. We also included several covariates as control variables, including partisanship and demographic variables such as gender, age, and educational level. We include partisanship because these issues are related to government policies and respondents who support the ruling party are likely to approve of government policies.
The estimated effects of response propensity on the eight issues are displayed in Figure 2 and the estimated coefficients of other covariates are shown in Appendix H. 15 From Figure 2, we find that, first, response propensity is negatively associated with majority opinions across these issues, with the exception of pension reform. In other words, respondents with low response propensity are more likely to select majority opinions while those with high response propensity are more likely to select minority opinions. This result shows empirical support for our second hypothesis. 16 Second, the extent of the negative association between response propensity and majority opinions varies across these issues. This means that, depending on the level of response propensity, respondents are more likely to express majority opinions on some issues more than others. For example, compared to the other 7 issues, respondents with low response propensity are more likely to express the majority opinion on the issue of “coal-fired power,” that is, they are more likely to be concerned about air pollution due to coal-fired power generation.
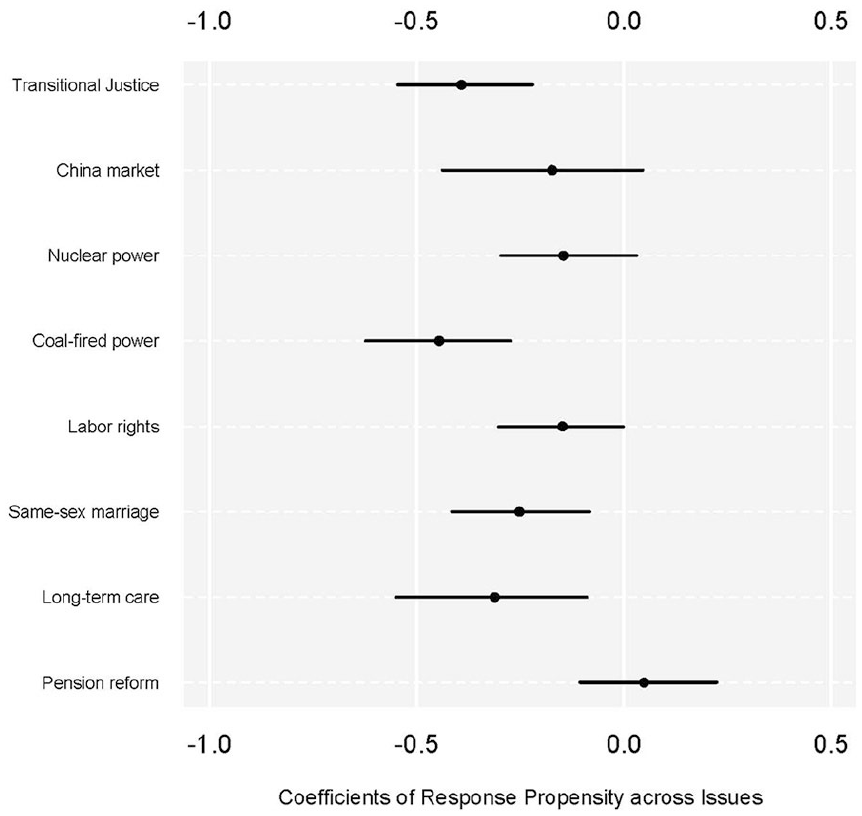
Estimates of Logistic Coefficients for Response Propensity Across Issues; the Filled Circles Indicate the Posterior Means and the Solid Lines are 95% HPD Intervals.
In sum, the SoS theory hypothesizes that individuals who share minority opinions are reluctant to express those opinions and, if anything, they will express majority opinions, which leads to misreporting. We find that an association between response propensity and the expression of majority/minority opinions does exist. Specifically, respondents require a strong response propensity to express minority opinions. This association suggests that public opinion might be biased in the sense that minority opinions are underestimated due to the silencing effect. Usually, the biased distribution of responses to a given item is hardly noticed when the proportion of nonresponses to the same item is low. According to the results of our analysis, researchers should be cautious of presenting public opinion on policy issues, especially for unpolarized issues. On the one hand, there is the potential problem of misreporting even when these issues are less morally laden. On the other hand, the potential problem of misreporting cannot be detected by the proportion of nonresponses.
Conclusion
Survey research allows us to understand how people behave and what they think about issues of interest. The usefulness of survey data, however, relies to some extent on respondents’ willingness to express their opinions. If some respondents do not answer survey questions for similar reasons, response bias is possible and any inferences based on the survey data might be misleading. In public opinion research, the spiral of silence is one of the most influential theories on willingness to express opinions. It argues that the inconsistency between perceived opinion climate and private opinion induces a reluctance to express one’s opinion, which in turn leads to nonresponses or misreporting.
There are many studies devoted to testing specific and limited hypotheses derived from the SoS theory, most of which focus on the component of subjective perception involved in the theory. Unlike this branch of the literature, we emphasize the problems of nonresponse and misreporting induced by issue polarization and response propensity. We derive two empirical implications from the SoS theory. One is the negative association between issue polarization and nonresponse and the other is the negative association between response propensity and misreporting.
Building on the Bayesian approach to multilevel IRT models, we analyzed public opinion on eight controversial issues from survey data collected in Taiwan in 2018. From our analysis, we find that, first, nonresponses, including ambiguous and invalid responses, are less likely to occur for polarized issues regardless of the level of response propensity. Second, low response propensity is associated with the expression of majority opinions. These findings suggest that there are potential problems of nonresponse and misreporting when there is a predominant opinion on the issues of interest, and that response propensity is influential not only in nonresponse but also in misreporting. 17
This article contributes to our understanding of silencing effects derived from the SoS theory. Previous studies of willingness to express opinion rely on the inconsistency between private opinion and subjective perceptions of public opinion. The results of our analysis indicate an association between the opinion climate in the environment and opinion expression, which does not involve the quasi-statistical sense. Moreover, the spiral of silence hardly ever applies in relation to topics on which opinions are polarized. What matters for nonresponse and misreporting is an obvious contrast between majority and minority opinions.
One practical implication of this study is that one can rely on additional information on the climate of opinion to investigate silencing effects from an aggregate-level perspective. Given the ongoing shift to online interviewing, questionnaires are usually shorter and respondents are rarely asked about their subjective perceptions of the climate of opinion as well as the issues of interest just for the purpose of investigating silencing effects. Our study provides an alternative way of studying opinion expression. Another implication is that by the use of priming to inform the similar prevalence of alternative perspectives in questionnaire, it is possible to exclude social desirability bias, which is also a topic for future research. Moreover, this article also opens up a potential avenue for future research on the mechanisms underpinning the relationship between issue polarization and nonresponse/misreporting. Although different mechanisms might result in the same phenomenon, differentiating between mechanisms is also important.
Supplemental Material
sj-pdf-1-psw-10.1177_14789299251323444 – Supplemental material for Issue Polarization and Opinion Expression: A Latent Variable Approach to Nonresponse and Misreporting
Supplemental material, sj-pdf-1-psw-10.1177_14789299251323444 for Issue Polarization and Opinion Expression: A Latent Variable Approach to Nonresponse and Misreporting by Tsung-han Tsai and Ching-hsin Yu in Political Studies Review
Footnotes
Declaration of conflicting interests
The author(s) declared no potential conflicts of interest with respect to the research, authorship, and/or publication of this article.
Funding
The author(s) disclosed receipt of the following financial support for the research, authorship, and/or publication of this article: The study is supported by the National Science and Technology Council, R.O.C., under grant MOST 110-2410-H-004-079-MY3.
Supplemental material
Additional supplementary information may be found with the online version of this article.
Contents
Appendix A Controversial Issues in Taiwan.
Table A1: Controversial Issues and Options.
Appendix B Distributions of Responses to Controversial Issues in Follow-up Surveys
Table B1: Distributions of Responses on Controversial Issues (%) in 2019.
Table B2: Distributions of Responses on Controversial Issues (%) in 2020.
Table B3: Distributions of Responses on Controversial Issues (%) in 2021.
Table B4: Distributions of Responses on Controversial Issues (%) in 2022.
Appendix C Polarized Opinion Climates.
Appendix D Robustness Checks for Ambiguous Responses as Valid Responses.
Table D1: Logistic Regression Coecients across 8 Issues.
Appendix E Potential Explanations for Nonresponse.
Table E1: Questions and Coding of Individual-level Covariates.
Table E2: The Estimates of Item-Level and Individual-Level Coecient Parameters.
Appendix F Model Syntax in JAGS.
Appendix G Justication of the Interpretation of Sensitivity.
Appendix H Coecients of Logistic Regression Analysis across Issues.
Notes
Author Biographies
References
Supplementary Material
Please find the following supplemental material available below.
For Open Access articles published under a Creative Commons License, all supplemental material carries the same license as the article it is associated with.
For non-Open Access articles published, all supplemental material carries a non-exclusive license, and permission requests for re-use of supplemental material or any part of supplemental material shall be sent directly to the copyright owner as specified in the copyright notice associated with the article.