
Abstract
Purpose:
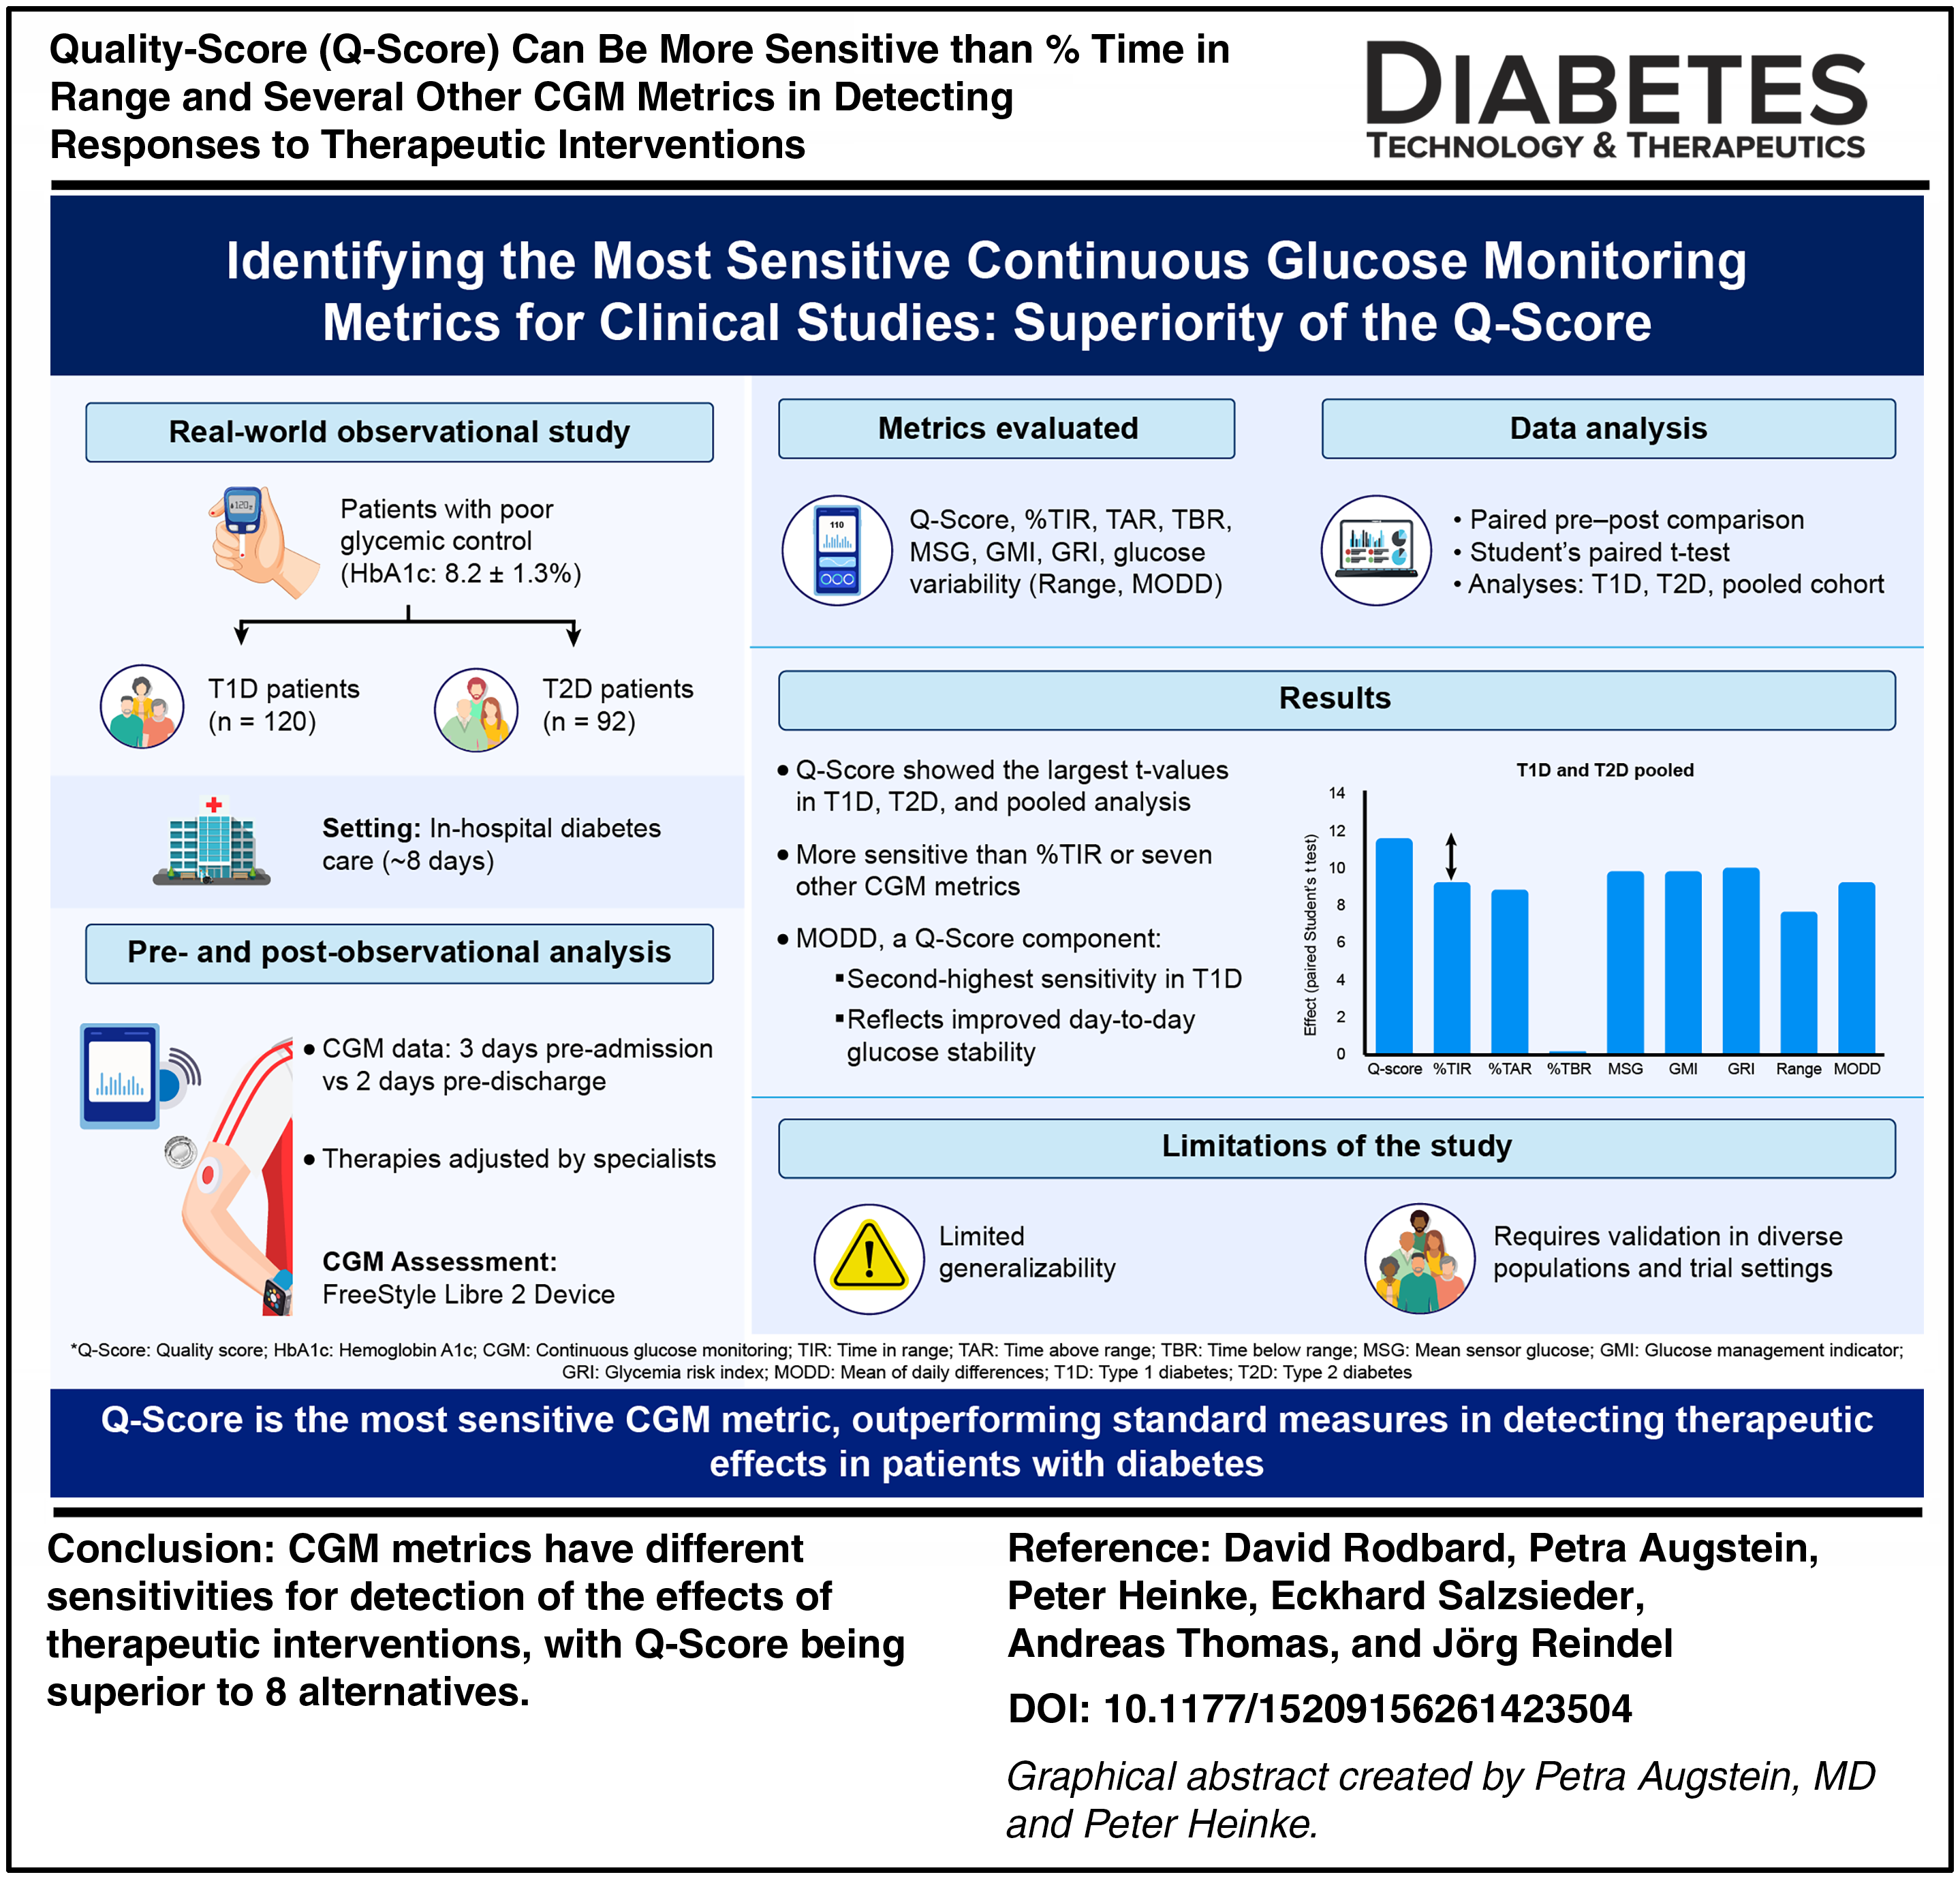
To evaluate the relative sensitivity of several available CGM metrics for the detection of the effects of clinical interventions in people with type 1 diabetes (T1D) and type 2 diabetes (T2D).
Methods:
Real-world data from people with poor glycemic control (hemoglobin A1c 8.2 ± 1.3%) for 120 people with T1D and 92 people with T2D, using Libre 2 CGM. Analysis of CGM data from 3 days prior to admission and 2 days immediately before discharge from ∼8 days of in-hospital care with changes in therapy as prescribed by hospital-based diabetes specialists. CGM metrics included: quality-score (Q-Score), Time in Range (TIR) (3.9–10 mmol/L), Time Above Range (>10 mmol/L), Time Below Range (<3.9 mmol/L), Mean Sensor Glucose, Glucose Management Indicator, Glycemia Risk Index, Glucose Daily Range, and Mean of Absolute Daily Differences (MODD). We evaluated the paired differences in all metrics pre- and postintervention within subjects using classical paired Student’s t tests.
Results:
The Q-Score showed the largest effects in terms of Student’s t-values for T1D, for T2D, and for all (T1D and T2D) subjects after pooling, indicating better sensitivity for detection of an effect than TIR or seven other metrics. One of the five components of the Q-Score, MODD, a classical measure of stability of glucose patterns from day to day, showed the second-best sensitivity in evaluating changes within subjects specifically for people with T1D.
Conclusion:
We observed consistent differences in sensitivity for the detection of the effects of therapeutic interventions, with Q-Score being superior to eight alternatives. This study needs replication using additional patient populations and multiple types of interventions to evaluate its generalizability and applicability to both randomized controlled clinical trials and real-world clinical data.
Introduction
What are the best criteria to monitor responses to therapeutic interventions in people with diabetes? Multiple metrics and criteria have been proposed for the evaluation of therapeutic interventions in people with diabetes.1–3
The current standard used by regulatory bodies is hemoglobin A1c (HbA1c).4–6
Many parties have recommended that regulatory bodies also include one or more CGM-derived metrics, for example, %time in range (%TIR), that is, the percentage of time that glucose is in the range 70–180 mg/dL (3.9–10 mmol/L). Sometimes HbA1c is not appropriate or not available, and it may not be the best estimator of Mean Sensor Glucose (MSG).
7
Many clinical investigators would prefer to use CGM-derived metrics rather than HbA1c. These include TIR, Time Above Range, and Time Below Range (TBR),5,6 time in tight range,
8
MSG,
7
Glucose Management Indicator (GMI),
9
and other estimates of HbA1c based on mean glucose.
10
Several other metrics had been proposed previously that were calculated directly using the all of the individual glucose values collected by the CGM including: Schlichtkrull’s M
With such a plethora of metrics, the question naturally arises, which ones or which combinations of metrics are most sensitive in terms of their ability to detect a significant effect earlier during a therapeutic intervention within an individual patient or group of patients, or with greater sensitivity so as to be able to detect an effect by means of a smaller number of subjects. If a metric offers greater sensitivity, it may enable researchers to conduct clinical studies utilizing smaller sample sizes and also enable clinicians to more rapidly evaluate their patients and adjust therapy more frequently.
The present study examines the apparent sensitivity of several available metrics to detect changes observed in a non-randomized single-center study following hospitalization of patients with inadequate glycemic control at baseline as evaluated by their clinic physician, in response to customized interventions prescribed by highly trained and experienced hospital-based diabetes specialists.
Methods
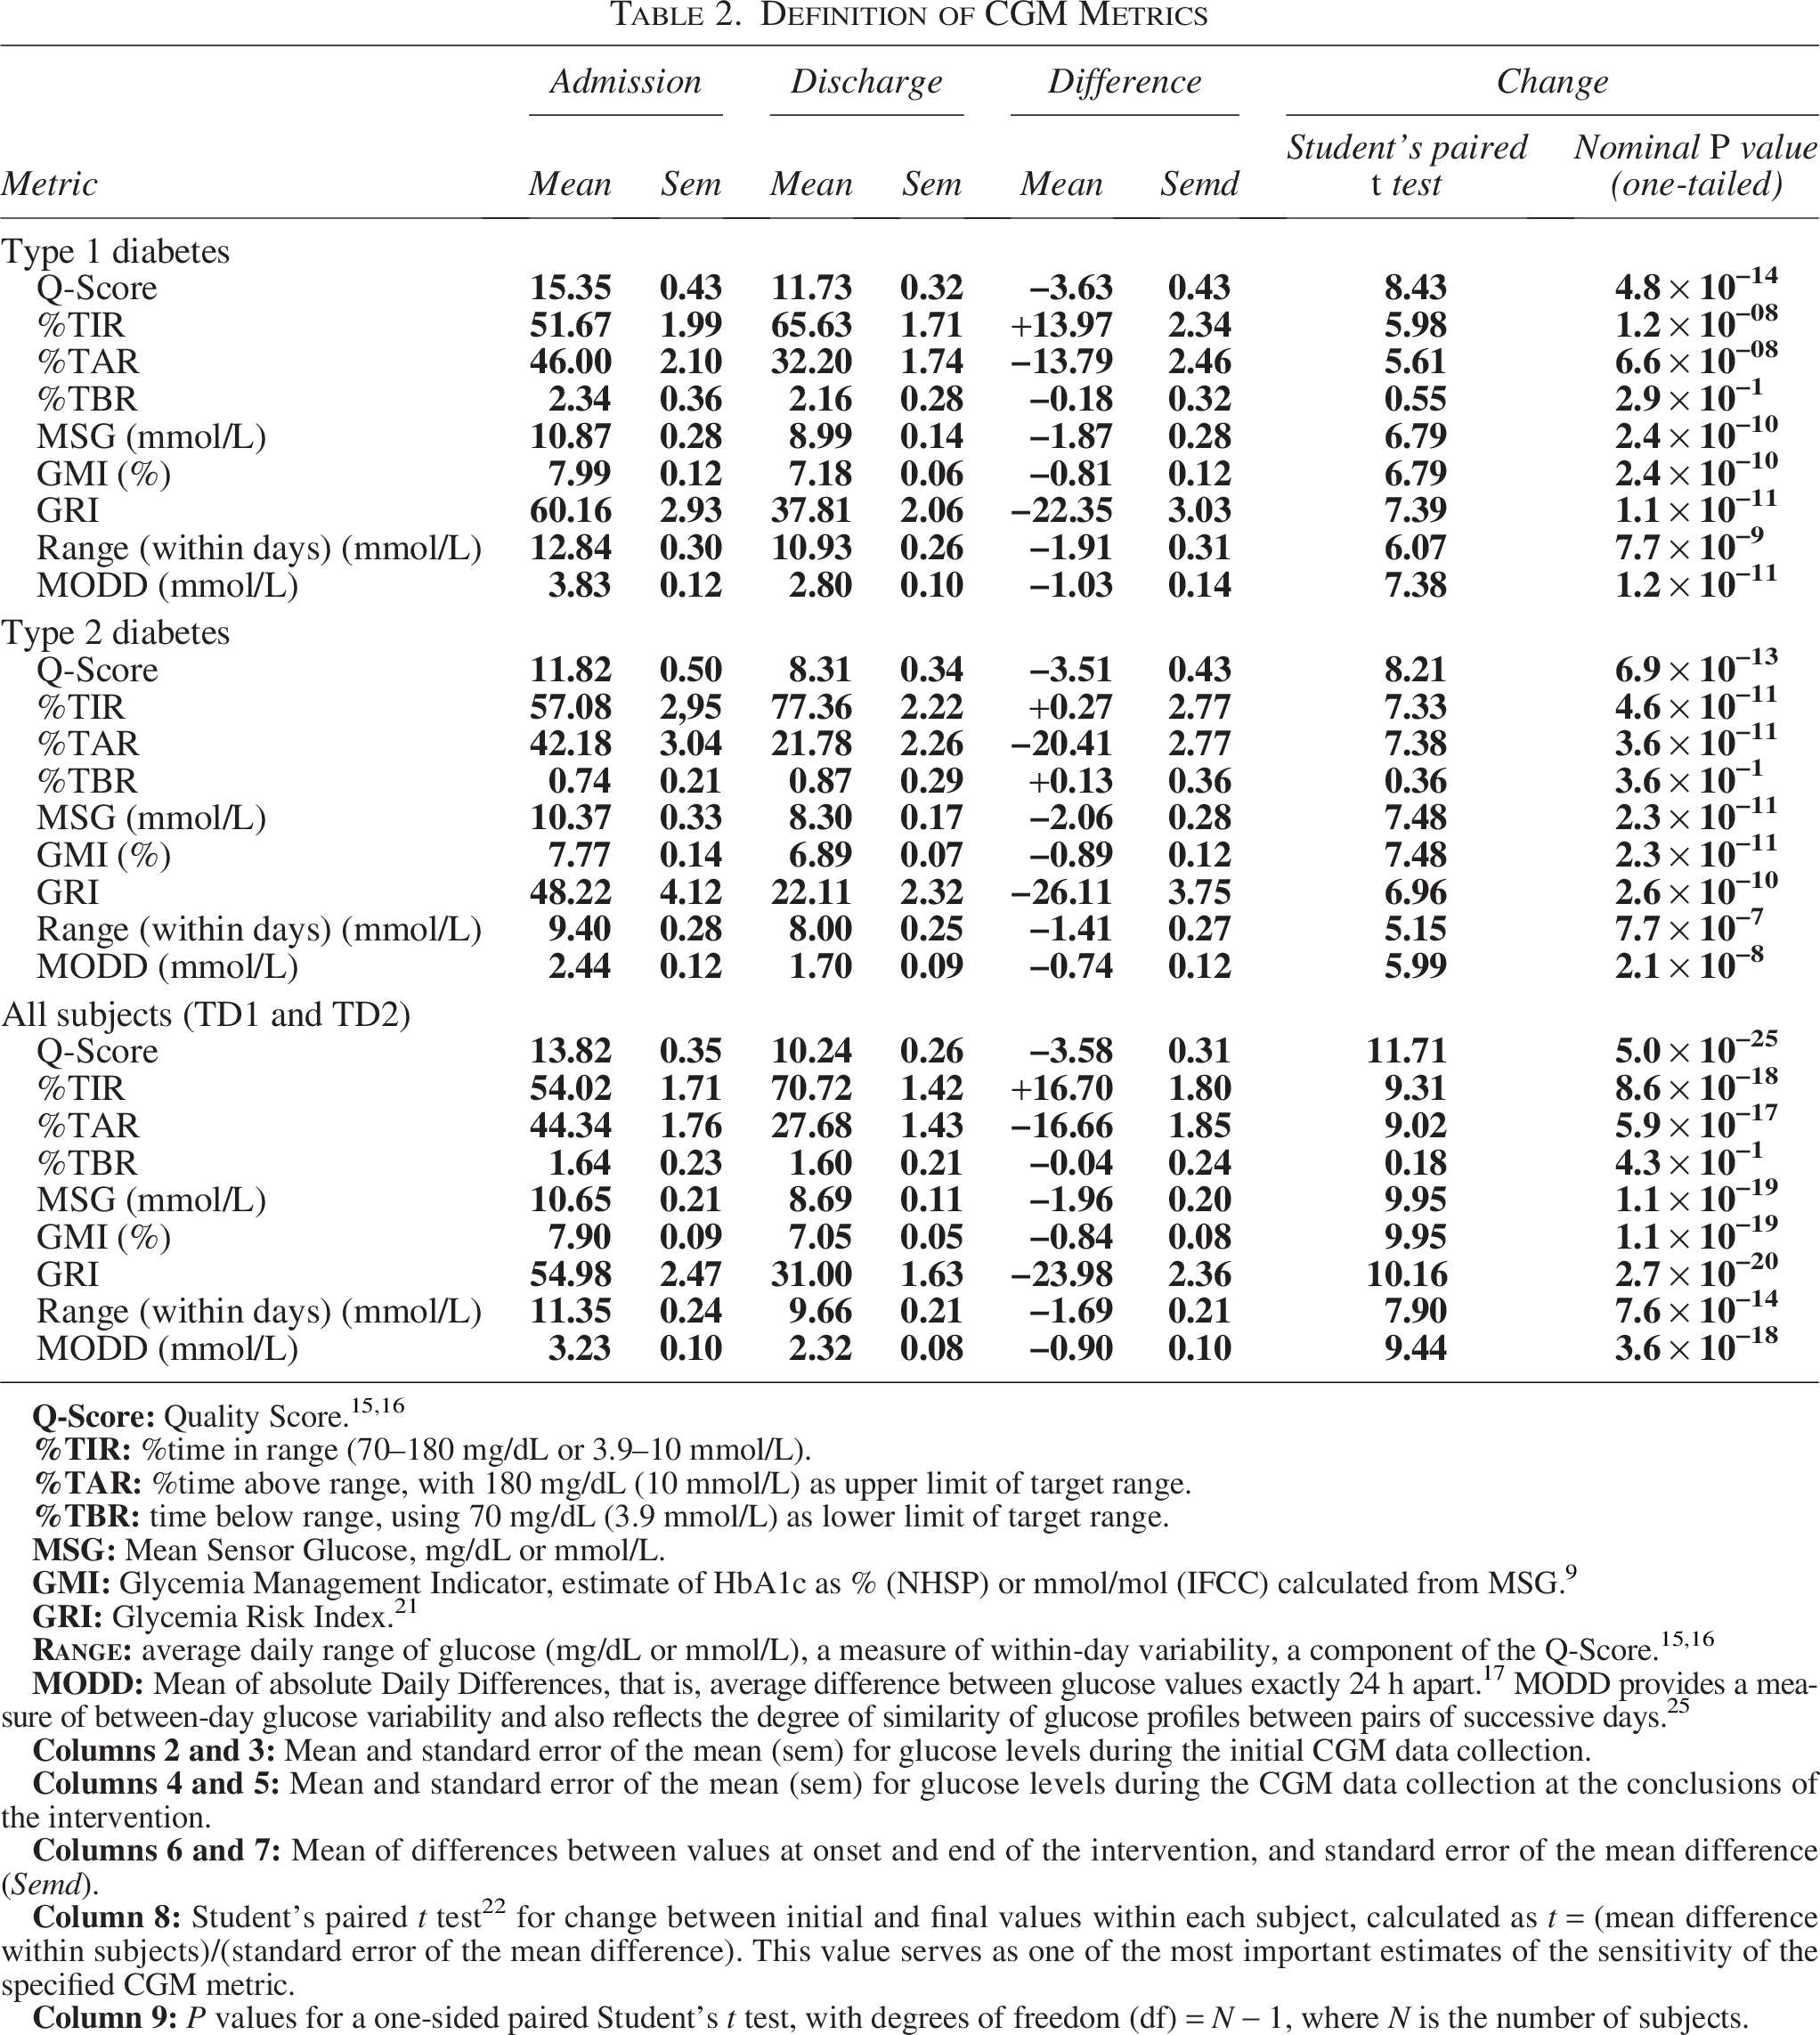
This study involved 212 subjects, 120 with T1 diabetes and 92 with T2 diabetes, at the Klinikum Karlsburg, Heart and Diabetes Center, Karlsburg, Germany. These participants provided written informed consent and were hospitalized with the goal of “improvement of diabetes control.” This study was approved by the Regional Ethics Review Board of the University of Greifswald, Greifswald, Germany. All subjects had considerable prior experience using the Abbott Freestyle Libre 2 CGM device in intermittent scan mode. All glucose data were collected directly from the Abbott Reader device. Only subjects with >70% completeness of CGM data were included. Data in the “cloud” as transmitted to Abbott were not utilized due to concerns of the Regional Ethics Review Board regarding patient data privacy. Subjects were instructed to scan the Libre 2 sensor at least once every 8 h. All data were anonymized. Glucose monitoring data were analyzed from the 3-day period immediately before hospital admission and during the 2 days immediately prior to discharge. Metrics calculated included: Q-Score, MSG, GMI, within-day variability measured as average daily glucose range,15,16 Time Above Range (%TAR) using 10 mmol/L (180 mg/dL) as the upper limit of the target range, 16 %TBR using 3.9 mmol/L (70 mg/dL) as lower limit of the target range,15,16 between-day variability—Mean of Daily Differences (MODD),15–17 CGP, 18 and GRI. 21
Reference data for the calculation of Q-Score was based on a previously reported reference population of 1562 patients at Karlsburg Hospital.15,16 The Q-Score has been validated previously by comparison with ratings by experienced clinicians. 15 The inputs for calculation of Q-Score include CGM glucose levels, which can be expressed either as mg/dL or mmol/L, and TAR and TBR, which can be expressed as hours per day or as a percentage of the 24-h day (% = 100 h/24).15,16 We utilized the definition of Q-Score such that %TAR is defined as the percentage of 24 h (%) that glucose exceeds 10 mmol/L (180 mg/dL). 16 Equations for the calculation of the Q-Score that can handle various combinations of units for glucose and duration (h) or percentage of 24 h day periods are provided in Supplementary Data. Statistical analyses were performed using a one-sided paired Student’s t test. 22 We also examined unpaired Student’s t tests 22 and two nonparametric methods, Wilcoxon signed rank test, 23 and sign test. 24 Statistical analyses were performed using PASW Statistics for Windows, version 18.0 (SPSS, Inc., Chicago, IL, USA).
Interventions
Clinical status of patients was reviewed on a daily basis by the diabetes specialist physicians. CGM results were continuously available to the patients and, on a daily basis, to their physicians. Physicians were able to make changes in the subjects’ prescribed medications and provide advice and recommendations regarding diet. Patients were encouraged to participate in moderate physical activity for 45 min per day on a daily basis. The overall goals were to reduce MSG, reduce risk of hypoglycemia, reduce the magnitude of postprandial glucose excursions, and/or reduce glucose variability. The median duration of the intervention (hospitalization) was 8 days (Table 1).
Characteristics of Subjects at Initiation of Intervention
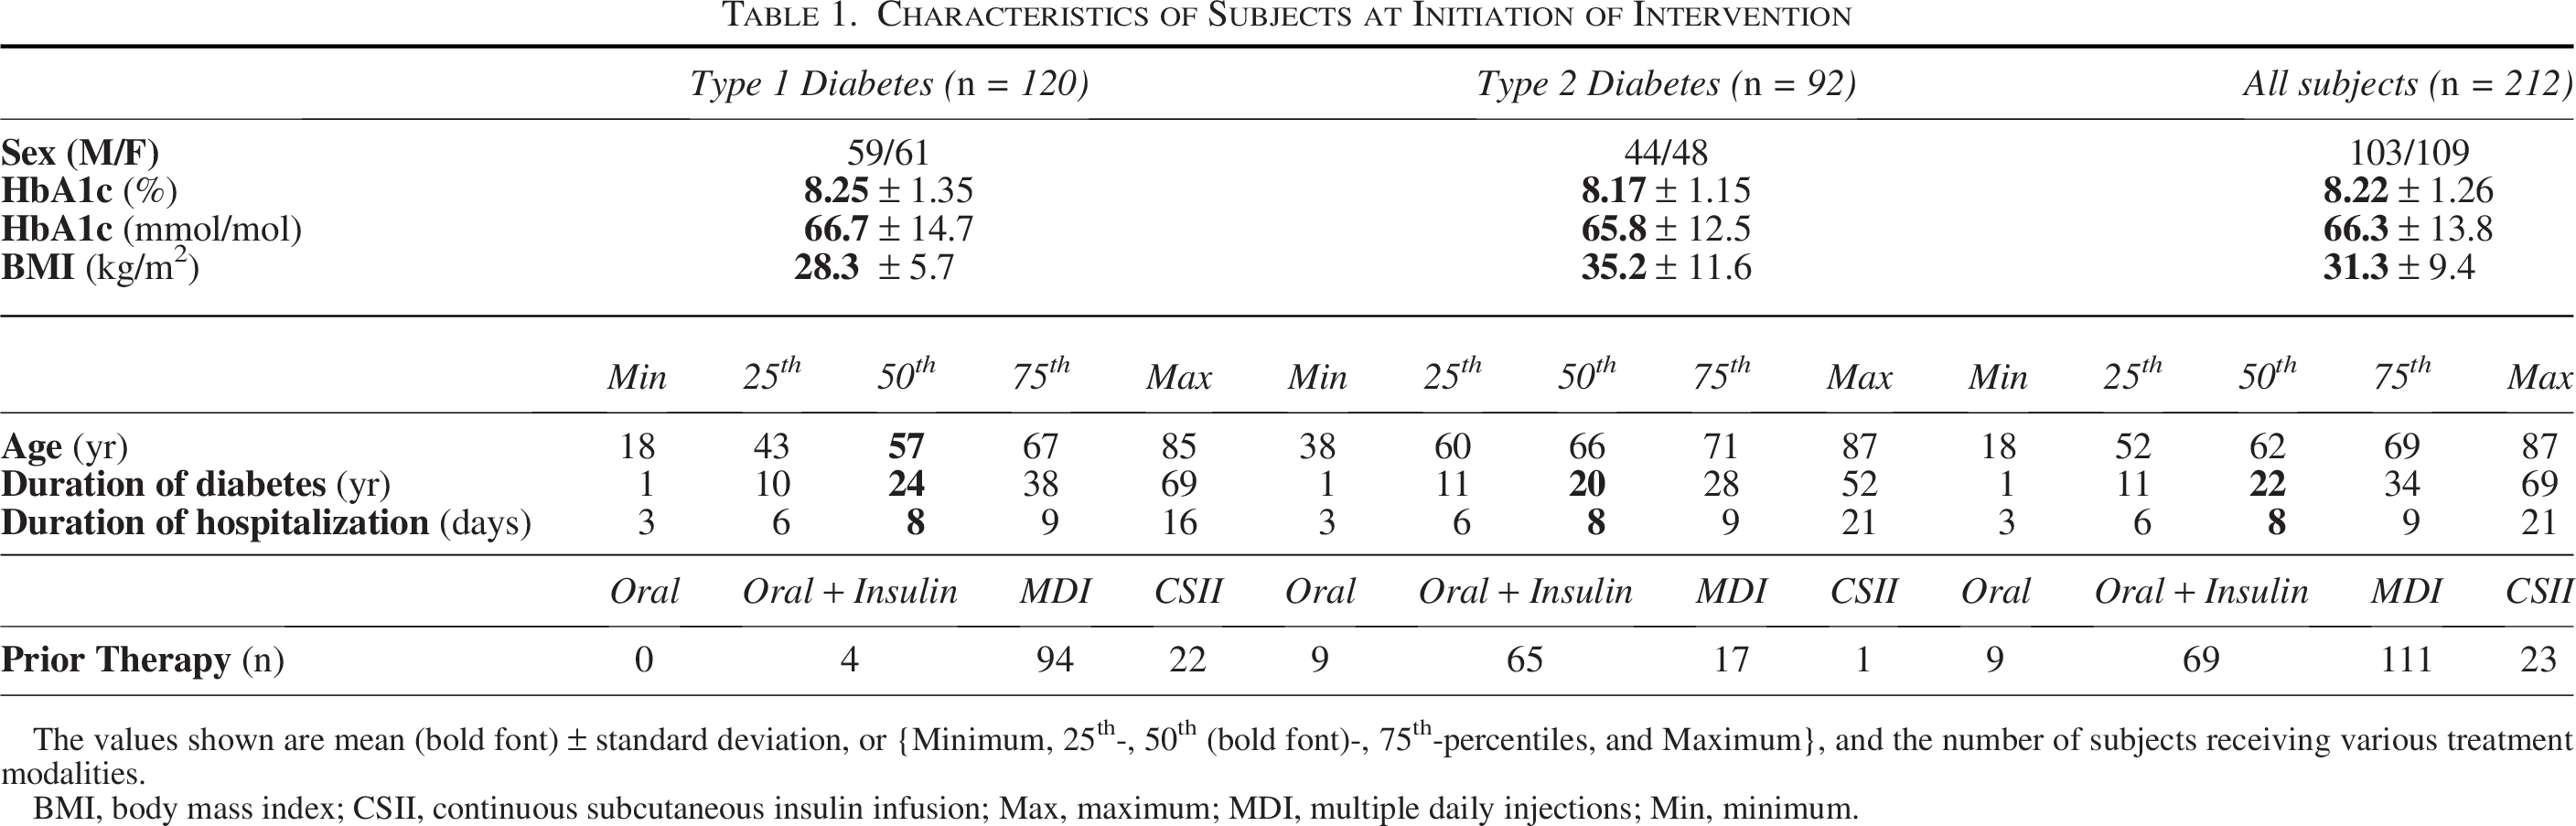
The values shown are mean (bold font) ± standard deviation, or {Minimum, 25th-, 50th (bold font)-, 75th-percentiles, and Maximum}, and the number of subjects receiving various treatment modalities.
BMI, body mass index; CSII, continuous subcutaneous insulin infusion; Max, maximum; MDI, multiple daily injections; Min, minimum.
Results
Patient population
Table 1 shows the characteristics of the patient population at the onset of the intervention (hospitalization).
Responses to intervention to improve quality of glycemic control (Table 2, Fig. 1): type 1 diabetes
Using a conventional “paired Student’s t test,” 22 the mean change in CGM metrics (preadmission vs. discharge CGM) within individuals in Q-Score showed the largest magnitude relative to its corresponding standard error of the mean difference (semd) for data from subjects with T1D, T2D, and for the entire dataset (Table 2, Fig. 1A). The value for the Student’s t test is largest for the Q-Score and is substantially larger than the t-value for %TIR or any of the other seven metrics. The values for t for %TIR and %TAR were similar. The values for the t test for MSG and for the Glycemia Management Indicator (GMI) were also larger than the ones for %TIR. The value of the t test for GRI, t = 7.39, was larger than the values for %TIR, %TAR, MSG, and GMI, but remained smaller than the value for Q-Score (t = 8.43) (Table 2, Fig. 1A).
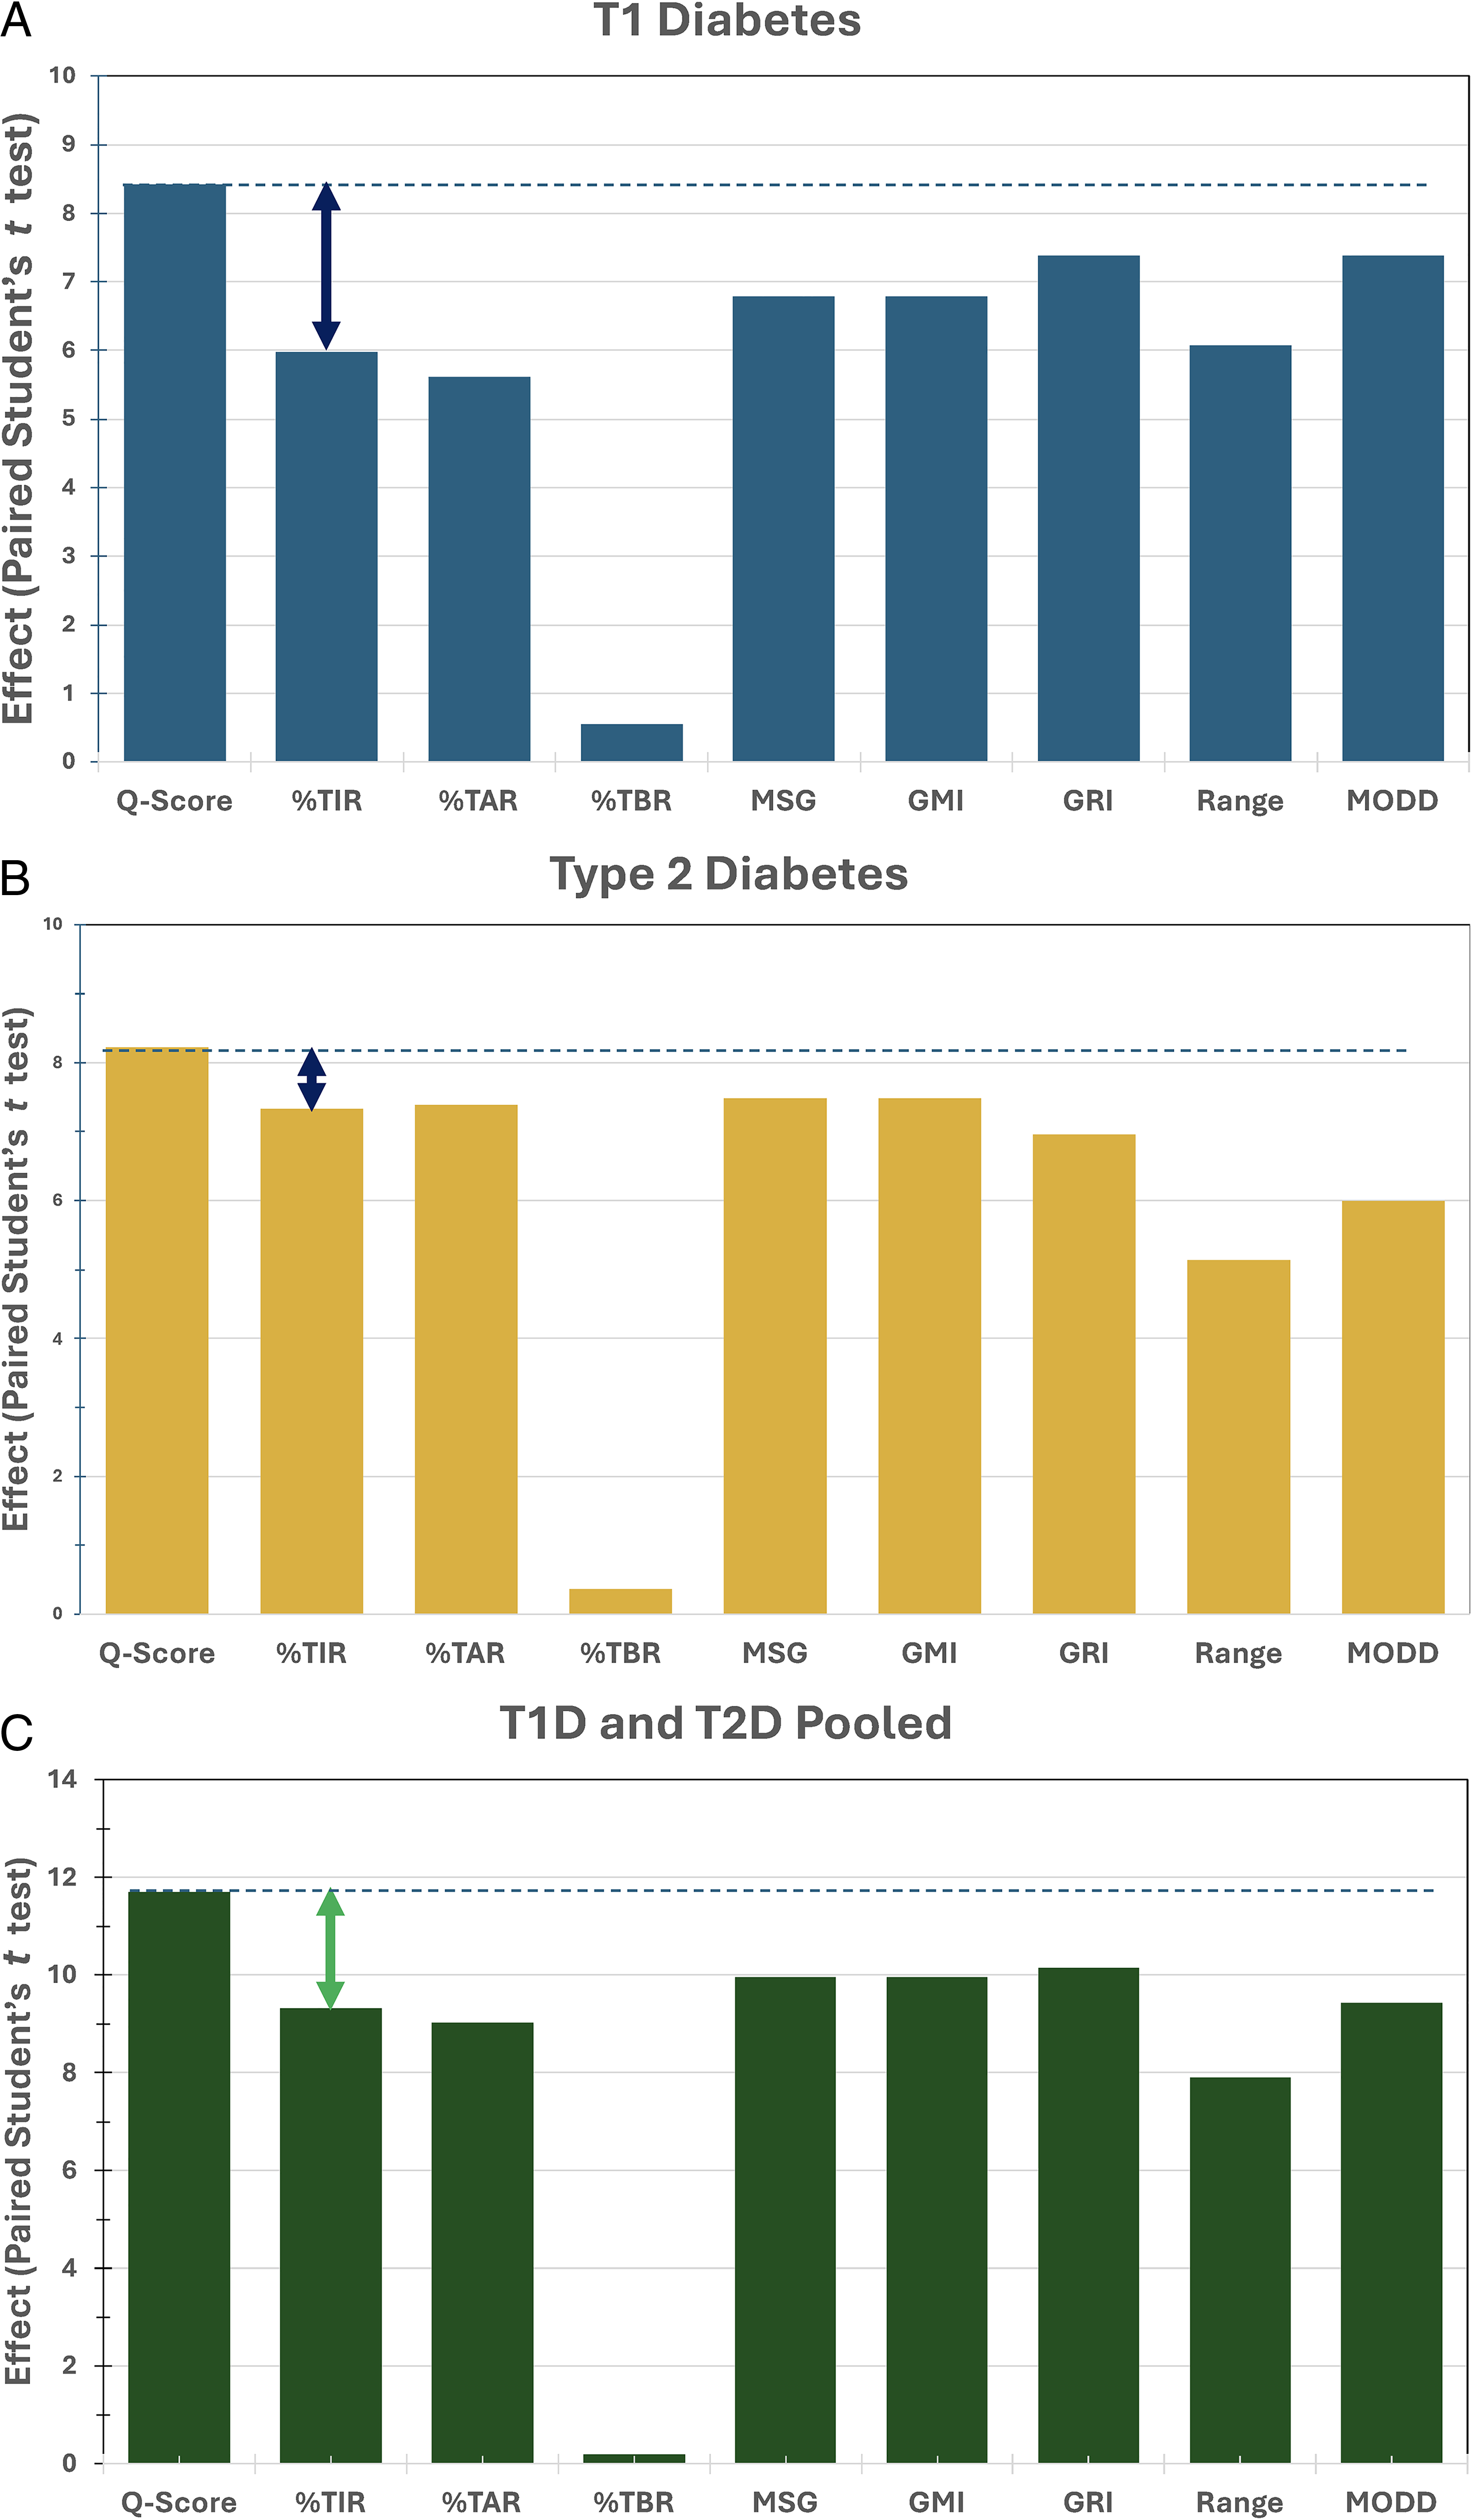
Magnitude of effect size (paired Student’s t-statistic [one-sided]) when examining the differences in CGM metrics between the onset of the intervention (hospitalization) and repeat CGM immediately before discharge from the hospital, for people with T1D, T2D, and when data for T1D and T2D are pooled. %TAR, Time Above Range (>180 mg/dL or > 10 mmol/L); %TBR, time below range (<70 mg/dL or 3.9 mmol/L); %TIR, %time in range 70–180 mg/dL (3.9–10 mmol/L); GMI, Glycemic Management Indicator calculated from mean sensor glucose using a linear relationship
9
; GRI, Glycemia Risk Index
21
; MODD, Mean of absolute Daily Differences (mg/dL or mmol/L)
17
; MSG, mean sensor glucose; Range: average daily glucose range (mg/dL or mmol/L)
Definition of CGM Metrics
Type 2 diabetes
The corresponding results for people with type 2 diabetes are shown in Table 2 and Figure 1B. The Q-Score resulted in the highest value for the paired Student’s t test, although the difference is smaller than observed in the case of people with T1D. For subjects with T2D the t-values for %TIR, %TAR, MSG, GMI, and GRI were fairly similar.
All subjects (T1D and T2D, pooled)
The results for all subjects, pooling data from subjects with either T1D or T2D are shown in Table 2 and Figure 1C. In this case, the t-values were generally higher, due in part to the increased number of subjects (N = 212) as opposed to N = 120 or N = 92. Results were similar to those observed for people with T1D, such that Q-Score performed better (with a larger magnitude of the corresponding t-value) than %TIR or any of the other metrics examined.
The overall patterns of results were similar for T1D, T2D, and the combined T1D, T2D group, but the effects were most evident for people with T1D and the T1D, T2D pooled dataset. The effect size (t) for Q-Score was larger than any of the other metrics examined, that is, TIR, TAR, TBR, MSG, GMI, GRI, range, or MODD (Table 2, Fig. 1).
The other metrics, including %TIR, GMI, mean sensor glucose (MSG), and glycemia risk index (GRI), showed smaller changes than the Q-Score (relative to their corresponding
The %TBR < 3.9 mmol/L (<70 mg/dL) showed no significant changes between pre- and postintervention at the P < 0.05 level for T1D, T2D, or when both groups were combined.
For all metrics, the t-values were substantially higher when all subjects were included (N= 212) than when considering only the T1D (N = 120) or T2D subgroups (N = 92) when used alone. This was likely due in large part to the larger number of subjects after pooling (N = 212).
Discussion
Major findings
All of the metrics studied, with the sole exception of %TBR, showed a highly statistically significant change in response to the intervention. The Q-Score provided largest t-statistic and correspondingly the smallest P values. The t-statistic for Q-Score was greater than the t-statistic for TIR, TAR, TBR, MSG, GMI, or GRI (Table 2, Fig. 1). In some cases, the t-statistic for MSG, GMI, and GRI were also larger than the one for %TIR. Accordingly, %TIR would not be the most sensitive statistical criterion for the present study.
Criteria for “best” metric
The present study shows that the paired Student’s t test can be used to evaluate the sensitivity and comparative sensitivity of several metrics. We have also evaluated three alternative criteria: two nonparametric methods, the Wilcoxon signed rank test and the sign test, and an unpaired Student’s t test. All three of those approaches gave similar results in terms of the relative sensitivity of the various metrics. The paired Student’s t test resulted in the highest level of statistical significance.
Potential effect on sample size requirements for clinical trials
If the value of the t-statistic for one metric (metric A) were two-fold larger than the t
Some degree of sampling variability in t-values is expected, since the numerator for t, mean paired difference, was subject to approximately a 10%–15% error (calculated as 100 × semd
Limitations of the current study
The robustness and replicability of this study design needs to be further evaluated using multiple patient populations and clinical settings utilizing a wide range of potential therapeutic interventions. In addition to testing the primary hypothesis (e.g., “Is there a significant effect of a specified treatment?”), it would be desirable to conduct methodological studies to identify the metrics that appear to be most sensitive. Results of these studies could guide future study designs and choice of primary response variables to be incorporated into Statistical Analysis Plans.
Duration of CGM data collection
The duration of CGM was very brief relative to current standard practice. One would prefer to have longer duration of CGM data collection at the onset and following the interventions. Although it is commonly taught that one should have at least 14 days of CGM data, with 70% data accrual, this would be applicable only when the results are being used to evaluate an individual patient. This guidance does not apply to clinical trials or other clinical or real-world studies involving the pooling of data from multiple subjects, considered simultaneously. In the present study, we have N = 120, 92, and 212 subjects in three groups. respectively. The number of subjects (N) reduces the standard errors of the mean (sem) by a factor of the square root of N, and the use of the paired t test with each subject serving as their own control substantially reduces the effects of between-subject variability. Previous studies have shown that mean or median glucose levels can be evaluated with only 2 or 3 days of CGM data. 26 Several of the early CGM sensors obtained only 3 days of data collection, but nonetheless were utilized successfully for clinical applications for individual patients.
Some investigators may have refrained from the use of CGM in the mistaken belief that it requires 2 weeks or longer to obtain sufficient data. Recognition that even short CGM studies can be valid and informative, as in the present study, may encourage investigators to utilize CGM in more studies, with meaningful reductions in cost and potential burden on the patient.
Need for additional studies of metrics when hypoglycemia is the primary target of intervention
The sensitivity of various metrics may vary when applied to different studies. The present results indicated that the CGM metrics %TBR < 3.9 mmol/L (<70 mg/dL) was the least sensitive (Table 2, Fig. 1). Failure of %TBR to show a significant change in the present study was expected due to the low frequency of glucose values below 3.9 mmol/L for the present study. In studies designed to evaluate risk of hypoglycemia (e.g., in people with elevated risk of severe hypoglycemia), the %TBR (or variations thereof, e.g., %TBR level 1, level 2), or other metrics for hypoglycemia (e.g., the Hypoglycemia Component of GRI,
21
GRADE
Mean of (absolute) daily differences
We examined the performance of MODD, 17 one of the five subcomponents of the Q-Score. MODD was one of the most sensitive metrics for people with T1D for the detection of response to the intervention in the present study. MODD showed large changes (t = 7.38) in T1D. In contrast, for people with T2D, MODD showed a much smaller t-value (5.99) than several other metrics (%TIR, %TAR, MSG, GMI, or GRI) and was only superior to the t-values for daily range and TBR. This contrast between T1D and T2D in terms of the relative sensitivities of CGM metrics deserves further investigation.
Special characteristics of Q-Score metric
Q-Score is the only one of the metrics considered here that includes MODD as a subcomponent. MODD was designed by Molnar et al. 17 in a manner to evaluate both the between-day variability and the stability of the 24-h glucose profile pattern from day to day superimposed on the patterns for all days, and on median glucose by time of day (Ambulatory Glucose Profile [AGP]).25,27 Q-Score preceded several composite scores that have been introduced during the past 10 years (CGP, PGS, COGI, GRI) (cf. Supplementary Data).
None of the other CGM metrics evaluate the stability and reproducibility of glucose profile patterns from day to day. Other statistical and graphical methods have been proposed to examine similarity and stability of glucose patterns or profiles from day to day. 28
Use of one-sided versus two-sided t test: In the present study, we have used a one-sided statistical test, since we were primarily interested in detecting an improvement in the metric evaluating the quality of glycemic control. Figure 1 shows values for the t
Evaluating individual patients: The availability of a composite score with higher sensitivity can facilitate the interpretation of clinical results for individual patients. If the metric is more sensitive overall, viewed in the context of multiple subjects, then it is reasonable to assume that it is likely to be more sensitive for individual subjects, and might, thereby, be able to detect changes more rapidly than other metrics. However, even an excellent composite metric is not sufficient for overall clinical evaluation. The clinician will usually want to examine the individual metrics, whether or not they have been included in the composite metric, for example, to identify the relative magnitude and clinical importance of hyper- and hypoglycemia, mean glucose, and within-day (average within-day range) and between-day variability (MODD). The clinician also needs to evaluate and interpret the AGP,25,27,28 e.g., to identify the times of day when each of the metrics are at their maximum or nadir values and identify the time periods when they are within acceptable and desirable limits. Clinical evaluation may also include trends in individual and composite metrics. No one metric, whether HbA1c, mean glucose, TIR, time in tight range (TITR), TAR, or TBR are sufficient by itself. Additional metrics may be needed to evaluate circadian and post-prandial changes and to evaluate the effects of diet, exercise, illness, stress, and various forms of therapy.
Regulatory implications
Regulatory agencies should consider modifying their current policies to accept multiple forms of evidence, and especially CGM metrics, including Q-Score,16,17 GRI, 21 other composite metrics,18–20 , MSG and GMI. One should consider not only HbA1c, but also composite metrics such as Q-Score,16,17 CGP, 18 PGS, 19 COGI, 20 GRI, 21 and some previously developed metrics1,2 that have their own advantages, properties, and rationale. Several of these metrics had been disregarded for many years, possibly on the basis that they were “too mathematical”, “too theoretical”, “too difficult to calculate”, or “too complicated for clinicians or patients to understand”. However, these metrics could be readily calculated by the data processing systems associated with the CGM devices and can be understood and used as metrics or scores of quality of glycemic control. For some metrics, such as Q-Score,15,16 CGP, 18 personal glycemic score (PGS), 19 composite CGM glycemic index (COGI), 20 and GRI, 21 one can readily identify the particular component or components of glucose control that are most in need of correction, e.g., mean glucose (MSG), hyper- and hypoglycemia (%TAR, %TBR), within-day and between-day variability, and day-to-day stability of glucose profile patterns by time of day. 17 Additional consideration of composite metrics is provided in the Supplementary Data.
The MODD metric is sensitive to synchronization of glucose patterns, e.g., due to use of standardized times of day for meals, standardized meal size and composition, and medication dosage and timing (by time of day and/or in relationships to time of onset of meals, exercise, sleep, and awakening) and other daily activities.
Moscardó et al. 29 have developed methods to evaluate the expected repeatability of many of the most important and frequently used CGM metrics in relation to the duration of CGM data collection.
Conclusions
The Q-Score appears to be one of the most sensitive CGM-derived metrics for detection of changes in response to a short-term intervention in the present study (hospitalization with opportunity for optimization of glycemic control by hospital-based physicians with greater experience in management of subjects with diabetes). This was observed for 120 patients with T1D and 92 patients with T2D in a single-center, nonrandomized, retrospective observational study. The GRI also showed greater sensitivity than %TIR or %TAR for people with T1D. The results were consistent using several statistical criteria. The metrics %TIR (3.9–10 mmol/L, 70–180 mg/dL), MSG, GMI, and GRI showed statistically significant changes but with less sensitivity, i.e., smaller magnitude of change in the response variable (mean difference within subjects relative to the corresponding standard error of the mean difference (Semd).).
Authors’ Contributions
“David Rodbard, MD, Petra Augstein, MD DSc, and Peter Heinke, MSc” made equal contributions to this study.
D.R.: Conceptualization of the need to identify “best metric” or “most sensitive metric” for specific studies and the need for criteria and methods to discriminate between metrics, statistical data analysis, design of graphical displays, and drafting and editing of the article. P.A.: Original development, evaluation, and validation of the Q-Score metric, evaluating correlations among alternative metrics, evolution of Q-Score to use the generally accepted limit for %TAR (10 mmol/L), design of study protocol, overseeing of the clinical study, and writing and editing of the article. P.H.: Development and evaluation of the Q-Score metric, statistical data analysis using both metric and nonparametric methods, development of summary tables, graphical displays, and writing and editing of article. A.T.: Collaboration on the evaluation and validation of the Q-Score metric, evaluation of correlations between alternative metrics. Developer of the composite metric model “Glucose Pentagon.” Writing and editing of the article. E.S.: Contributed to the design of the study, edited, and reviewed the article. J.R.: Project administration, editing, and review of the article. All authors read, approved, and take responsibility for the final article.
Footnotes
Acknowledgments
Author Disclosure Statement
D.R.—no duality of interests; P.A.—no duality of interests; P.H.—no duality of interests; A.T.—no duality of interests; E.S.—owner of patent protection regarding the Q-Score; and J.R.—no duality of interests.
Funding Information
None.
Supplemental Material
References
Supplementary Material
Please find the following supplemental material available below.
For Open Access articles published under a Creative Commons License, all supplemental material carries the same license as the article it is associated with.
For non-Open Access articles published, all supplemental material carries a non-exclusive license, and permission requests for re-use of supplemental material or any part of supplemental material shall be sent directly to the copyright owner as specified in the copyright notice associated with the article.