
Abstract
Objective:
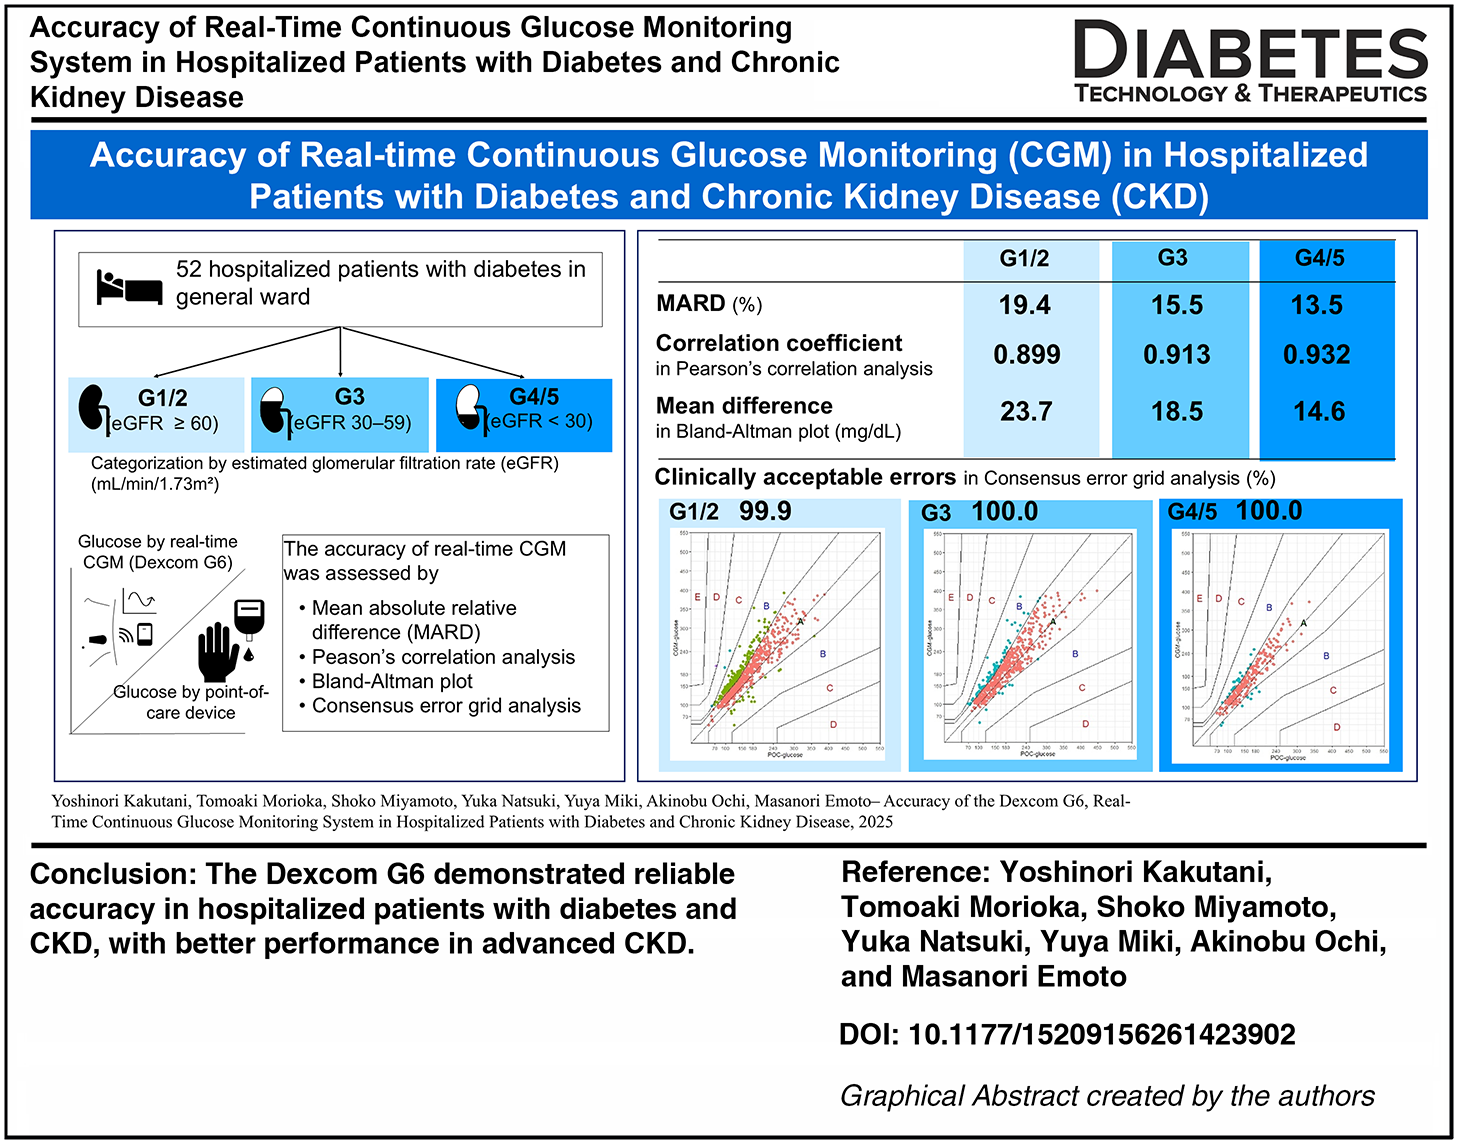
Real-time continuous glucose monitoring (CGM) systems are beneficial for patients with diabetes by providing a comprehensive assessment of glycemic status and reducing hypoglycemia. However, their performance in patients with both diabetes and chronic kidney disease (CKD) during hospitalization remains unclear. This study aimed to evaluate the accuracy of real-time CGM in hospitalized patients with diabetes and CKD.
Research Design and Methods:
We conducted a prospective observational study including 52 patients with diabetes after excluding those with acute kidney injury, active glomerulonephritis, requiring intensive care, or undergoing hemodialysis. Participants were categorized by estimated glomerular filtration rate (eGFR, mL/min/1.73 m2) into G1-2 (≥60), G3 (30–59), and G4-5 (<30). Capillary glucose values were measured with a validated point-of-care (POC) device and paired with corresponding real-time CGM (G6, Dexcom) readings. Accuracy was assessed by mean absolute relative difference (MARD), correlation analyses, Bland–Altman plots, and consensus error grid (CEG) analyses.
Results:
A total of 1603 paired glucose values were analyzed, including 752 in G1/2, 571 in G3, and 280 in G4/5. CGM and POC glucose were strongly correlated (r = 0.91, P < 0.001). The overall MARD was 17.0%, with group-specific values of 19.4% in G1/2, 15.5% in G3, and 13.5% in G4/5 (P < 0.001). Bland–Altman plots showed smaller bias and narrower limits of agreement in advanced CKD. CEG analyses demonstrated high agreement, with >99% of values within clinically acceptable zones.
Conclusions:
The Dexcom G6 demonstrated reliable accuracy in hospitalized patients with diabetes and CKD, with better performance in advanced CKD. These findings support its clinical utility in this population.
Introduction
Chronic kidney disease (CKD), defined by decreased estimated glomerular filtration rate (eGFR) and/or increased urinary excretion of albumin, is a major risk factor for mortality, cardiovascular disease, and hospitalization in patients with diabetes. 1 In patients with diabetes and CKD, appropriate glycemic control is associated with reduced albuminuria, 2 improved composite kidney outcomes, 3 and enhanced survival after the initiation of dialysis.4,5 However, achieving optimal glycemic control in patients with CKD is often complicated by hypoglycemia due to factors such as impaired kidney gluconeogenesis and decreased clearance of insulin and glucose-lowering agents. 6 Furthermore, in patients with diabetes, hypoglycemia is more strongly associated with in-hospital mortality in those with CKD than in those without CKD. 7 Therefore, minimizing the risk of hypoglycemia is essential for effective glycemic control in hospitalized patients with coexisting diabetes and CKD.
Continuous glucose monitoring (CGM) offers advantages by being less invasive and providing a more comprehensive assessment of glycemic status compared with conventional methods such as glycated hemoglobin, glycated albumin, and frequent self-monitoring of capillary glucose with fingerstick. The reliability of these conventional indices can be compromised in hospitalized patients with CKD-related conditions such as renal anemia or urinary albumin excretion. 8 Moreover, they may not accurately reflect the current glycemic status during hospitalization, when substantial changes in daily routines, such as diet and physical activity, often occur. In this context, real-time glucose monitoring using CGM is expected to provide particular benefits for patients with CKD.
The Dexcom G6 (Dexcom, San Diego, CA, USA) is a real-time CGM system that has been shown to reduce hypoglycemia in hospitalized patients. 9 Its accuracy has been validated in both outpatient 10 and inpatient settings. 11 In patients with CKD, potential factors such as uremia, edema, electrolyte disturbances, and elevated blood urea nitrogen have been suggested to influence the accuracy of CGM.12,13 The accuracy of the Dexcom G6 has been reported in hospitalized individuals undergoing hemodialysis, both during dialysis sessions and interdialytic periods 14 ; however, data are lacking for patients with CKD who do not require hemodialysis. In this study, we evaluated the accuracy of the Dexcom G6 in hospitalized patients with both diabetes and CKD by comparing CGM readings with reference blood glucose measurements.
Materials and Methods
Study population and study design
This prospective observational study was conducted among patients with diabetes who were hospitalized in the Diabetes Center of Osaka Metropolitan University Hospital from April 2024 to June 2025. The diagnosis and classification of diabetes were based on the American Diabetes Association 15 and the Japan Diabetes Society 16 criteria or the current use of any antidiabetic medication. Patients were eligible for inclusion if they were aged 18 years or older, underwent glucose monitoring using real-time CGM, and were able to provide informed consent. We excluded patients with acute kidney injury that was expected to cause short-term changes in kidney function, those with active glomerulonephritis, those undergoing hemodialysis, and those requiring intensive care. The study size was not based on a priori power calculation but was determined by the number of patients who met the inclusion criteria during the study period. This study was approved by the Ethical Committee of Osaka Metropolitan University Graduate School of Medicine (Approval No. 2023-118). Written informed consent was obtained from all participants.
CGM and blood glucose measurement
Each participant underwent glucose monitoring using the Dexcom G6 system, a real-time CGM, which was performed following a standardized protocol to minimize measurement bias. The Dexcom G6 sensor was attached to participant’s abdomen by a physician. The sensor was factory-calibrated, and no additional calibration was performed during the monitoring period. Glucose readings were recorded every 5 min by the Dexcom G6 system with the dedicated receiver (Dexcom G6 monitor), not with a smartphone application. After sensor removal, the data were retrieved using Dexcom Clarity software. For patients admitted with hyperglycemic emergencies, CGM was initiated after resolution of hyperosmolality and ketoacidosis.
Capillary glucose levels were routinely measured before each meal and at bedtime, using the Accu-Chek Guide One (Roche Diabetes Care, Rotkreuz, Switzerland), a point-of-care (POC) device whose accuracy has been well validated, with 100% of measurements meeting the %15/15 metric, defined as values within ± 15 mg/dL of laboratory reference glucose concentrations when glucose levels were <100 mg/dL and within ± 15% when glucose levels were ≥100 mg/dL, and 99.7% meeting the %10/10 metric.17,18 Additional measurements, such as at postprandial time points or during episodes of hypoglycemia, were performed as needed. The measurement times were documented based on the device log.
During hospitalization, patients received meals adjusted for their body size as standard diet therapy. Decisions regarding diabetes medications and target glucose levels were made independently of this study.
Laboratory measurements
Biochemical parameters were measured using standard protocols at the Central Laboratory of Osaka Metropolitan University Hospital, with blood samples collected after an overnight fast within 3 days of hospital admission. Glycated hemoglobin A1c (HbA1c) was expressed as the National Glycohemoglobin Standardization Program equivalent value (%), using the conversion formula established by the Japan Diabetes Society. 16 The eGFR based on creatinine (eGFRcr) 19 and cystatin C (eGFRcys) 20 were calculated using equations specifically developed for the Japanese population established by the Japanese Society of Nephrology. Participants were categorized into three groups according to eGFRcr (mL/min/1.73m2): G1/2 (eGFRcr ≥ 60), G3 (eGFRcr 30–59), and G4/5 (eGFRcr < 30). Plasma osmolality was calculated using the following formula: 2 × Na + blood urea nitrogen/2.8 + glucose/18, based on their molar concentrations. 21
Statistical analysis
Comparisons of clinical characteristics among kidney function groups were performed using analysis of variance (ANOVA) or the Kruskal–Wallis test for continuous variables and the chi-square test for categorical variables.
Each capillary glucose value obtained from the POC device was paired with the CGM readings recorded at the closest corresponding time within 2.5 min. Glucose values without corresponding CGM readings and those outside the Dexcom G6 measurement range (40–400 mg/dL) were excluded from analyses. Data imputation was not performed.
Analyses were performed for paired POC and CGM glucose values in all participants as well as stratified by kidney function groups. Simple correlation analyses between glucose values obtained from CGM and those measured by the POC device were performed using Pearson’s correlation coefficients. Agreement between the two measurement methods was assessed using Bland–Altman plots, in which the mean difference and the limits of agreement are plotted against the mean of the two methods. Limits of agreement were defined as ±1.96 standard deviations (SD), indicating that 95% of all measurements were included within this range. 22 CGM accuracy was further assessed by calculating the mean absolute relative differences (MARD), and the proportions of CGM readings meeting predefined accuracy thresholds (%15/15, %20/20, and %30/30). Comparisons of MARD and accuracy metrics at each threshold among kidney function groups were performed using ANOVA. Consensus error grid (CEG) analyses were conducted to assess the clinical impact of the differences between CGM and POC glucose values. The glucose readings obtained from CGM were plotted against those measured by the POC device, and the proportions were calculated for five predefined zones as follows: A, no effect on clinical action; B, altered clinical action with little or no effect on clinical outcome; C, altered clinical action likely to affect clinical outcome; D, altered clinical action that could have significant medical risk; and E, altered clinical action that could have dangerous consequences. Errors falling within zones A and B are considered clinically acceptable. 23
To explore clinical factors associated with CGM accuracy, Pearson’s correlation coefficients were calculated between each patient’s mean or median absolute relative difference (ARD) and various clinical parameters, including body mass index (BMI), hemoglobin, hematocrit, uric acid, urea nitrogen, eGFRcr, eGFRcys, sodium, chloride, plasma osmolality, HbA1c, log-transformed urinary albumin to creatinine ratio (ACR) and CGM metrics such as mean glucose, SD, coefficient of variation, and time in range (70–180 mg/dL). 24 Because the accuracy of CGM is known to be influenced by the time elapsed after sensor attachment, 25 MARD was compared between glucose values obtained within the first 24 h after CGM sensor attachment and those obtained beyond 24 h using unpaired t-test. In addition, clinical characteristics, including glucose values obtained within the first 24 h and beyond 24 h after CGM sensor attachment, were compared between the patients with a MARD < 20% and those with a MARD ≥ 20% using unpaired t-test, Mann–Whitney U test, or chi-square test. Furthermore, MARD was compared among subgroups stratified by glucose ranges measured by POC (<70, 71–180, 181–250, and >250 mg/dL), 11 and by urinary albumin excretion and serum albumin levels 26 using ANOVA. Subgroups based on albuminuria status and serum albumin levels were defined using a serum albumin cutoff of 3.5 g/dL, in accordance with widely accepted definitions of nephrotic syndrome, 27 as follows: normoalbuminuria (urinary ACR < 30 mg/gCr), microalbuminuria (ACR 30–300 mg/gCr), macroalbuminuria without hypoalbuminemia (ACR > 300 mg/gCr and serum albumin ≥ 3.5 g/dL), and macroalbuminuria with hypoalbuminemia (ACR > 300 mg/gCr and serum albumin < 3.5 g/dL).
A P value < 0.05 was considered statistically significant. CEG analyses were performed using the R package “ega” 28 within EZR software version 2.15.0 (Saitama Medical Center, Jichi Medical University, Saitama, Japan), 29 which is a graphical user interface for R (The R Foundation for Statistical Computing, Vienna, Austria). All other statistical analyses were conducted using JMP academic program (SAS Institute Inc., Cary, NC, USA).
Data and resource availability
The datasets generated during and/or analyzed during the current study are not publicly available due to restrictions as they contain information that could compromise the privacy of research participants.
Results
Study population
A total of 70 hospitalized patients met the eligibility criteria during the study period, of whom 15 patients declined to participate. We excluded 2 patients who could not perform CGM due to scheduled radiological examinations and 1 patient due to missing CGM data, resulting in the final analysis dataset of 52 patients (Fig. 1).
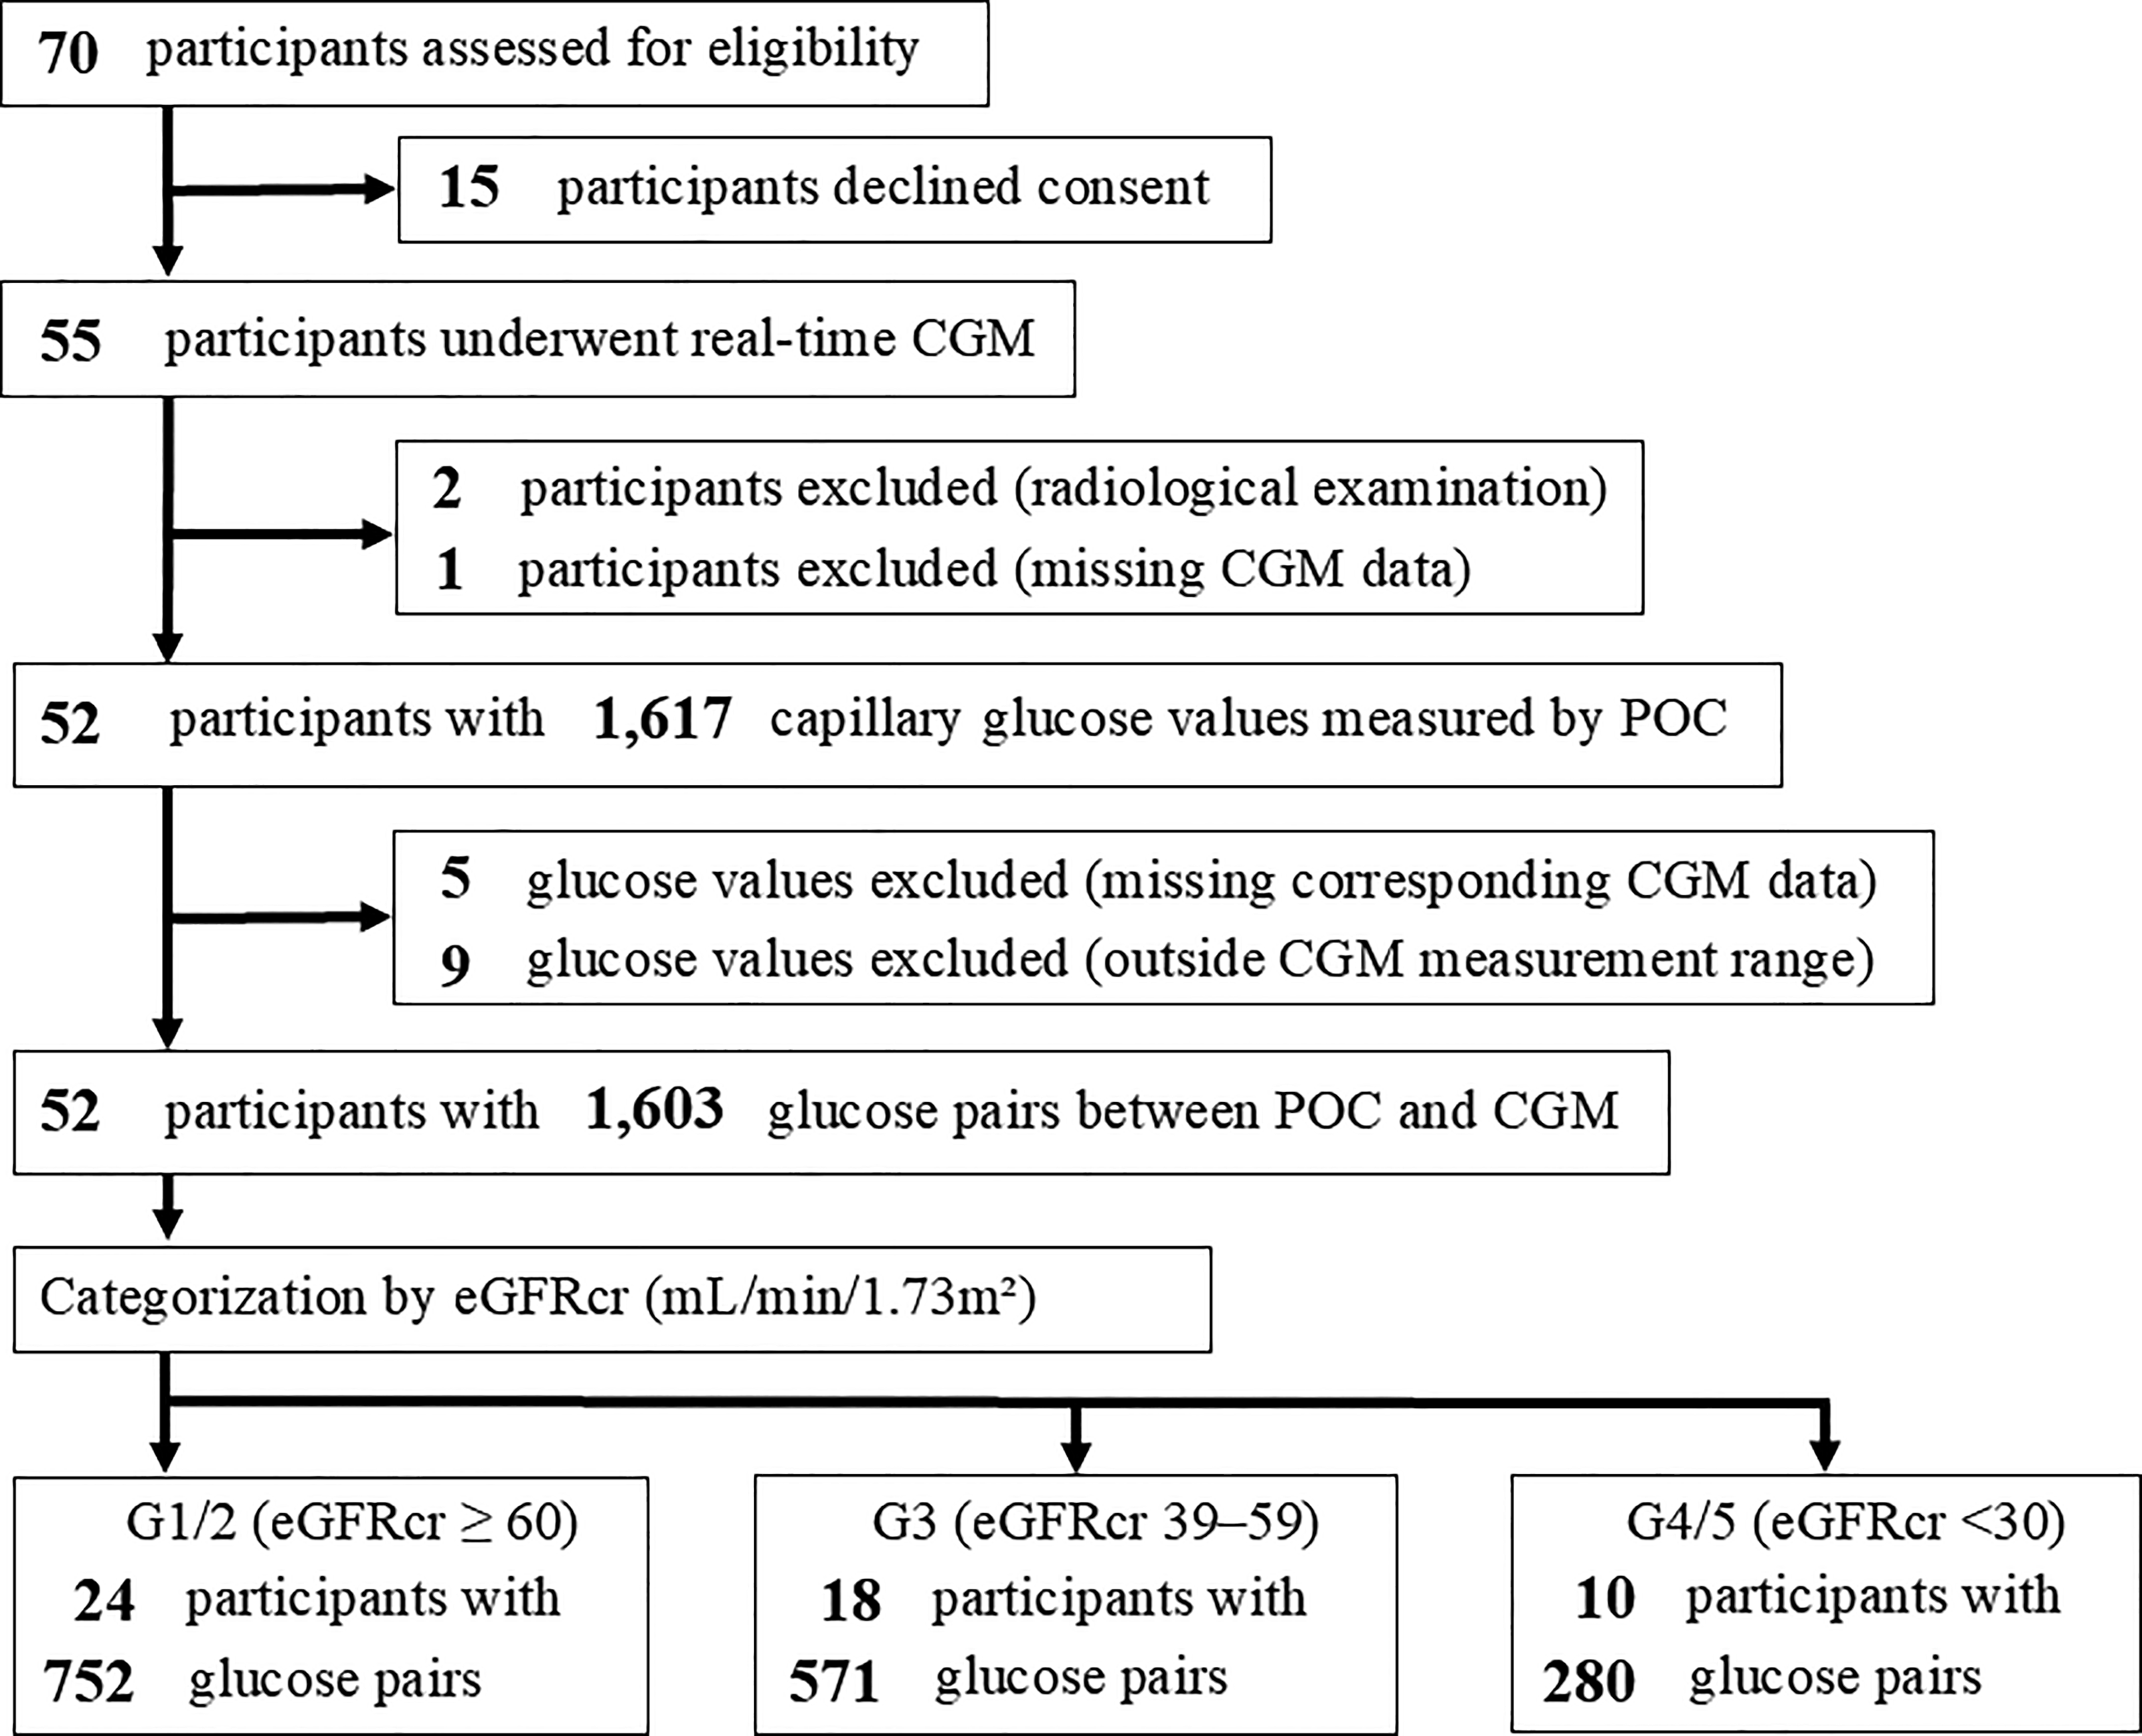
Consort diagram showing the numbers of patients and glucose measurements at each step of participant eligibility assessment, POC-CGM glucose pairing, and categorization by kidney function. CGM, continuous glucose monitoring; eGFRcr, estimated glomerular filtration rate based on creatinine; POC, point-of-care device.
Baseline characteristics of the study population are summarized in Table 1. Of the 52 participants, 9 (17%) had type 1 diabetes, 39 (75%) with type 2 diabetes, and 4 (8%) with pancreatic diabetes. According to kidney function, 24 patients were categorized into the G1/2 group, 18 into the G3, and 10 into the G4/5. Although the difference was not statistically significant, the G1/2 group included a higher proportion of patients with type 1 diabetes (n = 7) and pancreatic diabetes (n = 3). There were no significant differences among the kidney function groups in the use of antidiabetic medications, except for glucagon-like peptide-1 receptor agonists. In all kidney function groups, the major reason for hospitalization was glycemic control, and a small number of patients were admitted due to hyperglycemic emergencies. No significant differences were observed among the groups in BMI, hemoglobin, and albumin. In contrast, uric acid, urea nitrogen, sodium, and chloride levels differed significantly across groups. Fasting plasma glucose and HbA1c levels also varied among the kidney function groups. As expected, higher urinary albumin excretion was observed in groups with lower eGFR. All CGM metrics except for SD showed no significant differences among the kidney function groups.
Baseline Characteristics of All Hospitalized Patients with Diabetes and among Kidney Function Groups
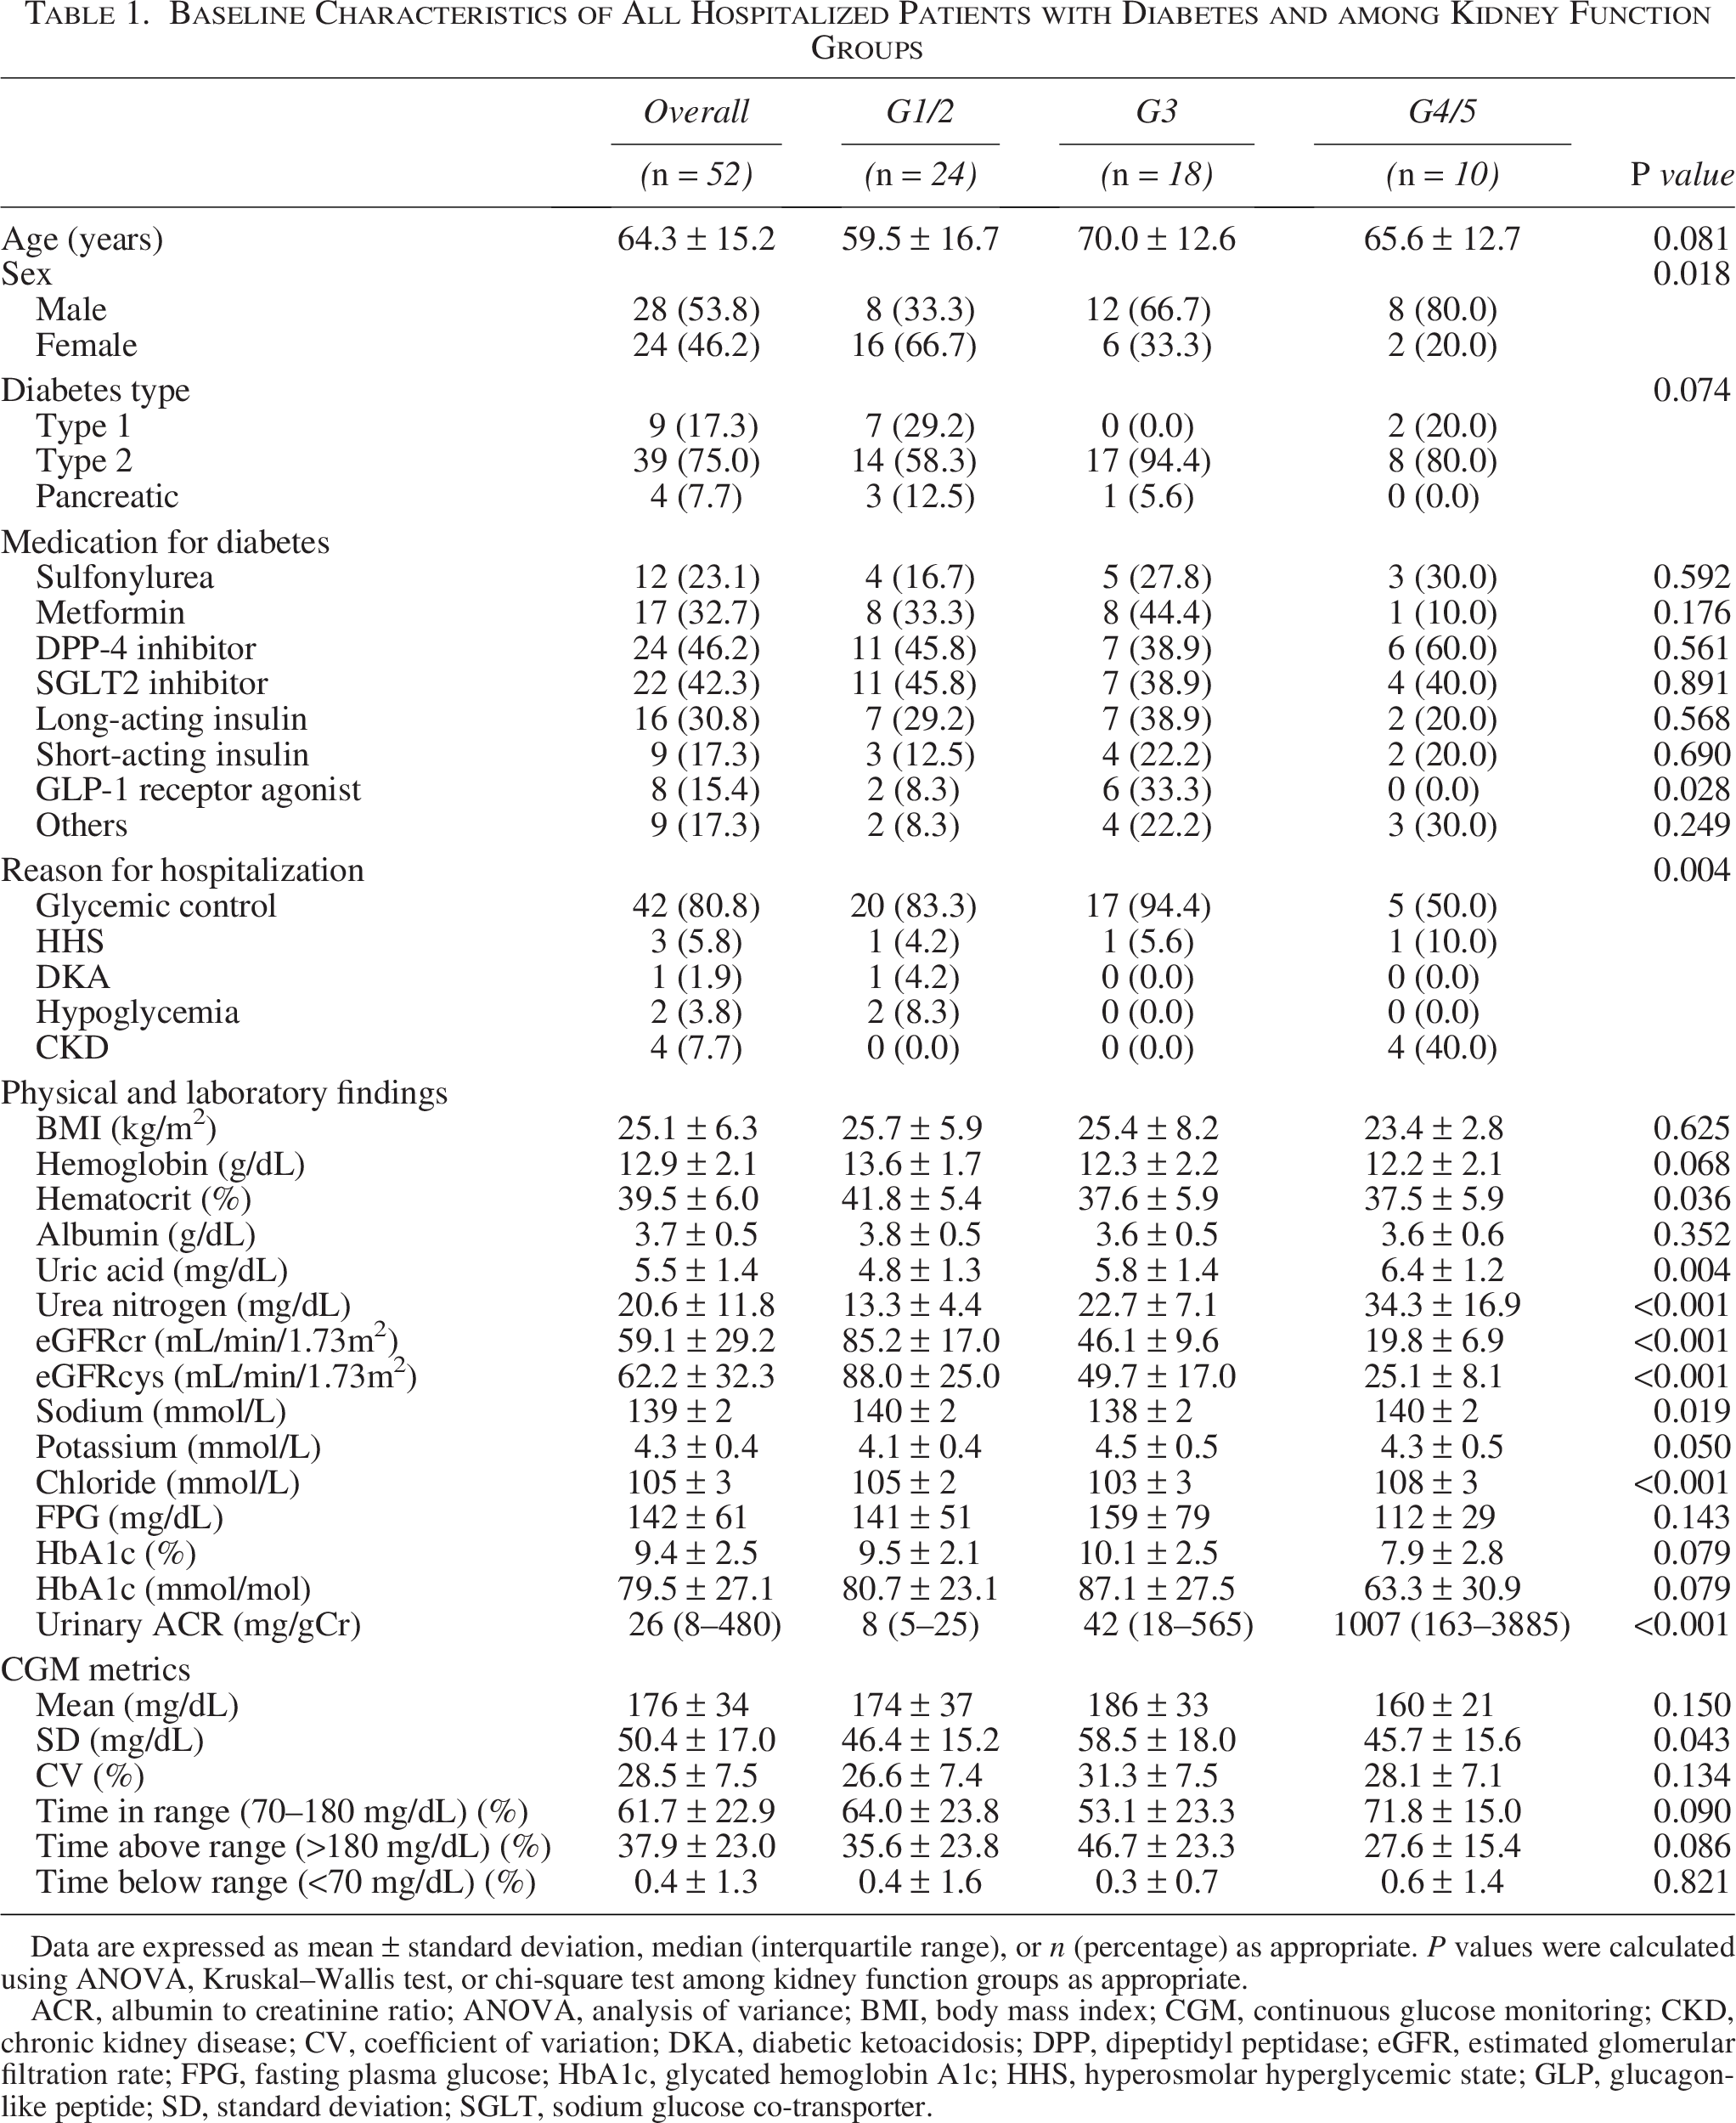
Data are expressed as mean ± standard deviation, median (interquartile range), or n (percentage) as appropriate. P values were calculated using ANOVA, Kruskal–Wallis test, or chi-square test among kidney function groups as appropriate.
ACR, albumin to creatinine ratio; ANOVA, analysis of variance; BMI, body mass index; CGM, continuous glucose monitoring; CKD, chronic kidney disease; CV, coefficient of variation; DKA, diabetic ketoacidosis; DPP, dipeptidyl peptidase; eGFR, estimated glomerular filtration rate; FPG, fasting plasma glucose; HbA1c, glycated hemoglobin A1c; HHS, hyperosmolar hyperglycemic state; GLP, glucagon-like peptide; SD, standard deviation; SGLT, sodium glucose co-transporter.
Glucose pairing, simple correlations and Bland–Altman plots
A total of 1,617 capillary glucose measurements were obtained from all participants. After excluding five measurements without corresponding CGM readings and nine measurements outside the CGM measurement range, 1603 paired capillary and CGM glucose remained for analysis. When stratified by kidney function, 752 pairs were included in the G1/2 group, 571 in the G3, and 280 in the G4/5 (Fig. 1).
Simple correlation analyses demonstrated a strong correlation between CGM and POC glucose values in all participants (r = 0.909, P < 0.001), as well as within each kidney function group (r = 0.899, P < 0.001 in G1/2; r = 0.913, P < 0.001 in G3; and r = 0.932, P < 0.001 in G4/5) (Fig. 2).
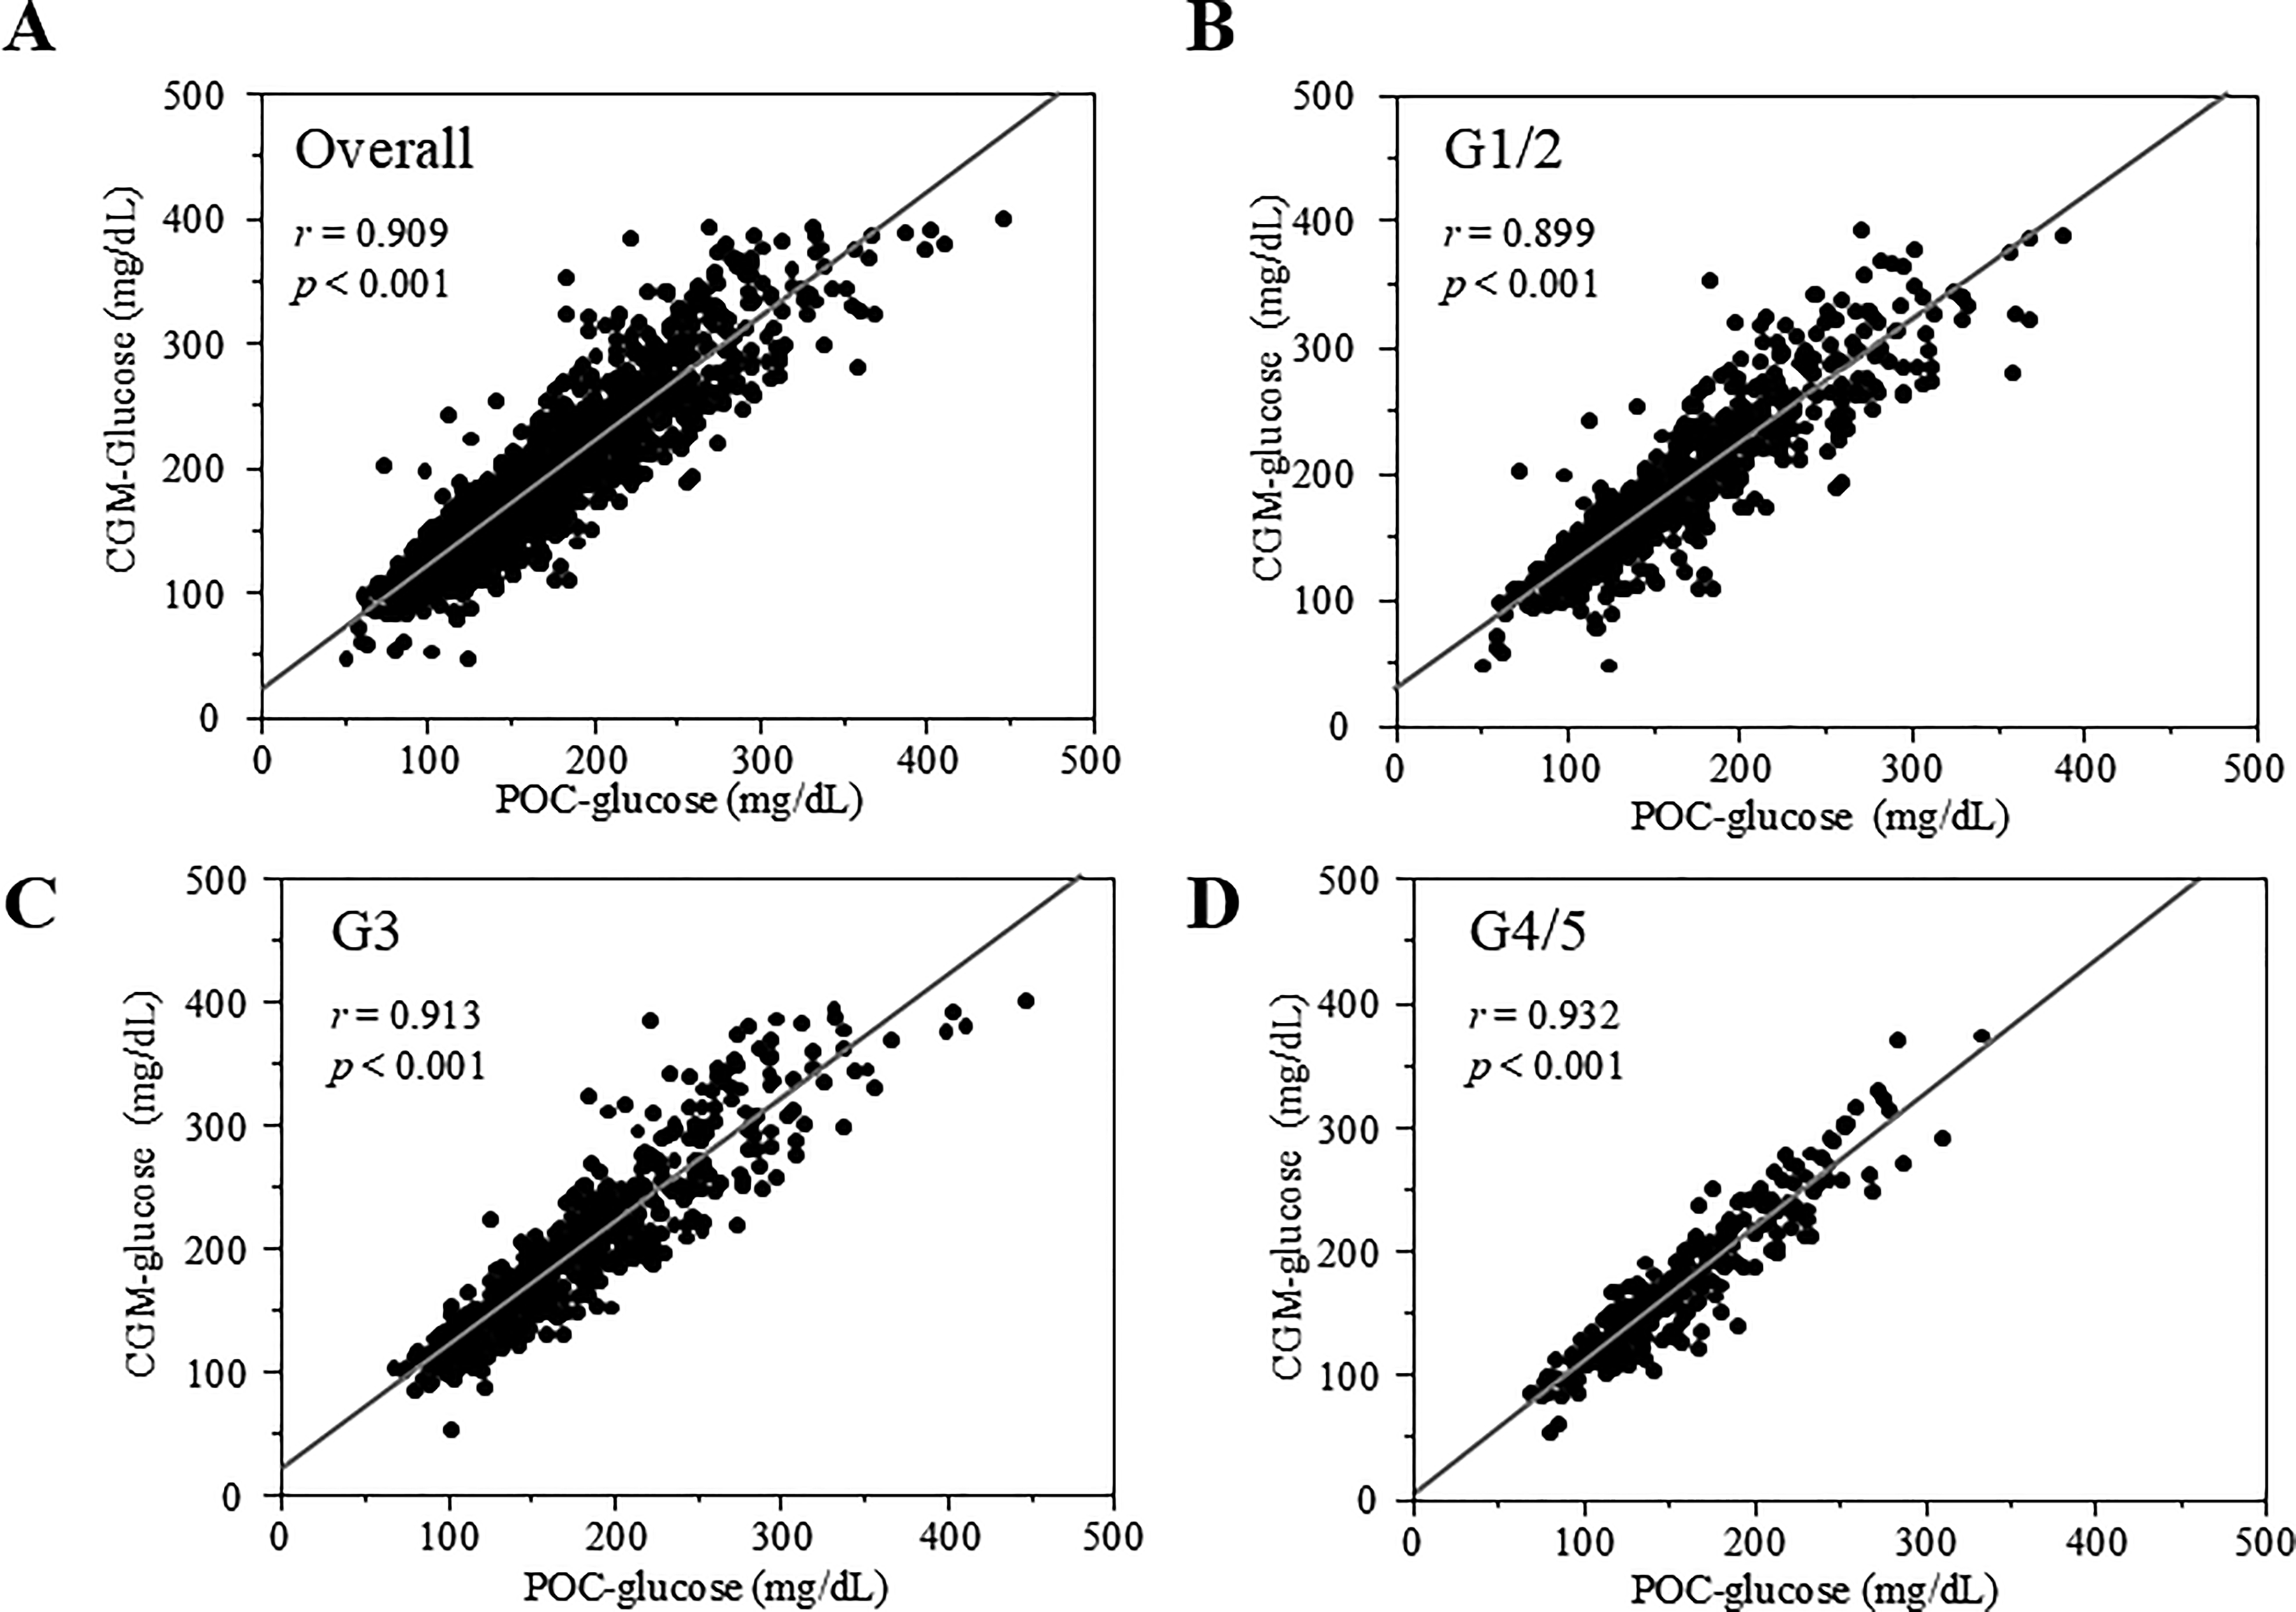
Correlations between glucose values obtained from CGM and those measured by POC were assessed using Pearson’s correlation analyses in all participants
Bland–Altman analysis for all participants showed a mean difference of 20.3 mg/dL (solid line in Fig. 3A), with limits of agreement ranging from –32.2 to 72.8 mg/dL (dotted lines in Fig. 3A). Among kidney function group, the mean differences (limits of agreement) were 23.7 mg/dL (–29.8 to 77.2 mg/dL) in G1/2, 18.5 mg/dL (–36.7 to 73.6 mg/dL) in G3, and 14.6 mg/dL (–25.6 to 54.9 mg/dL) in G4/5, with the smallest mean difference and narrowest limits observed in the G4/5 group (Fig. 3B–D).
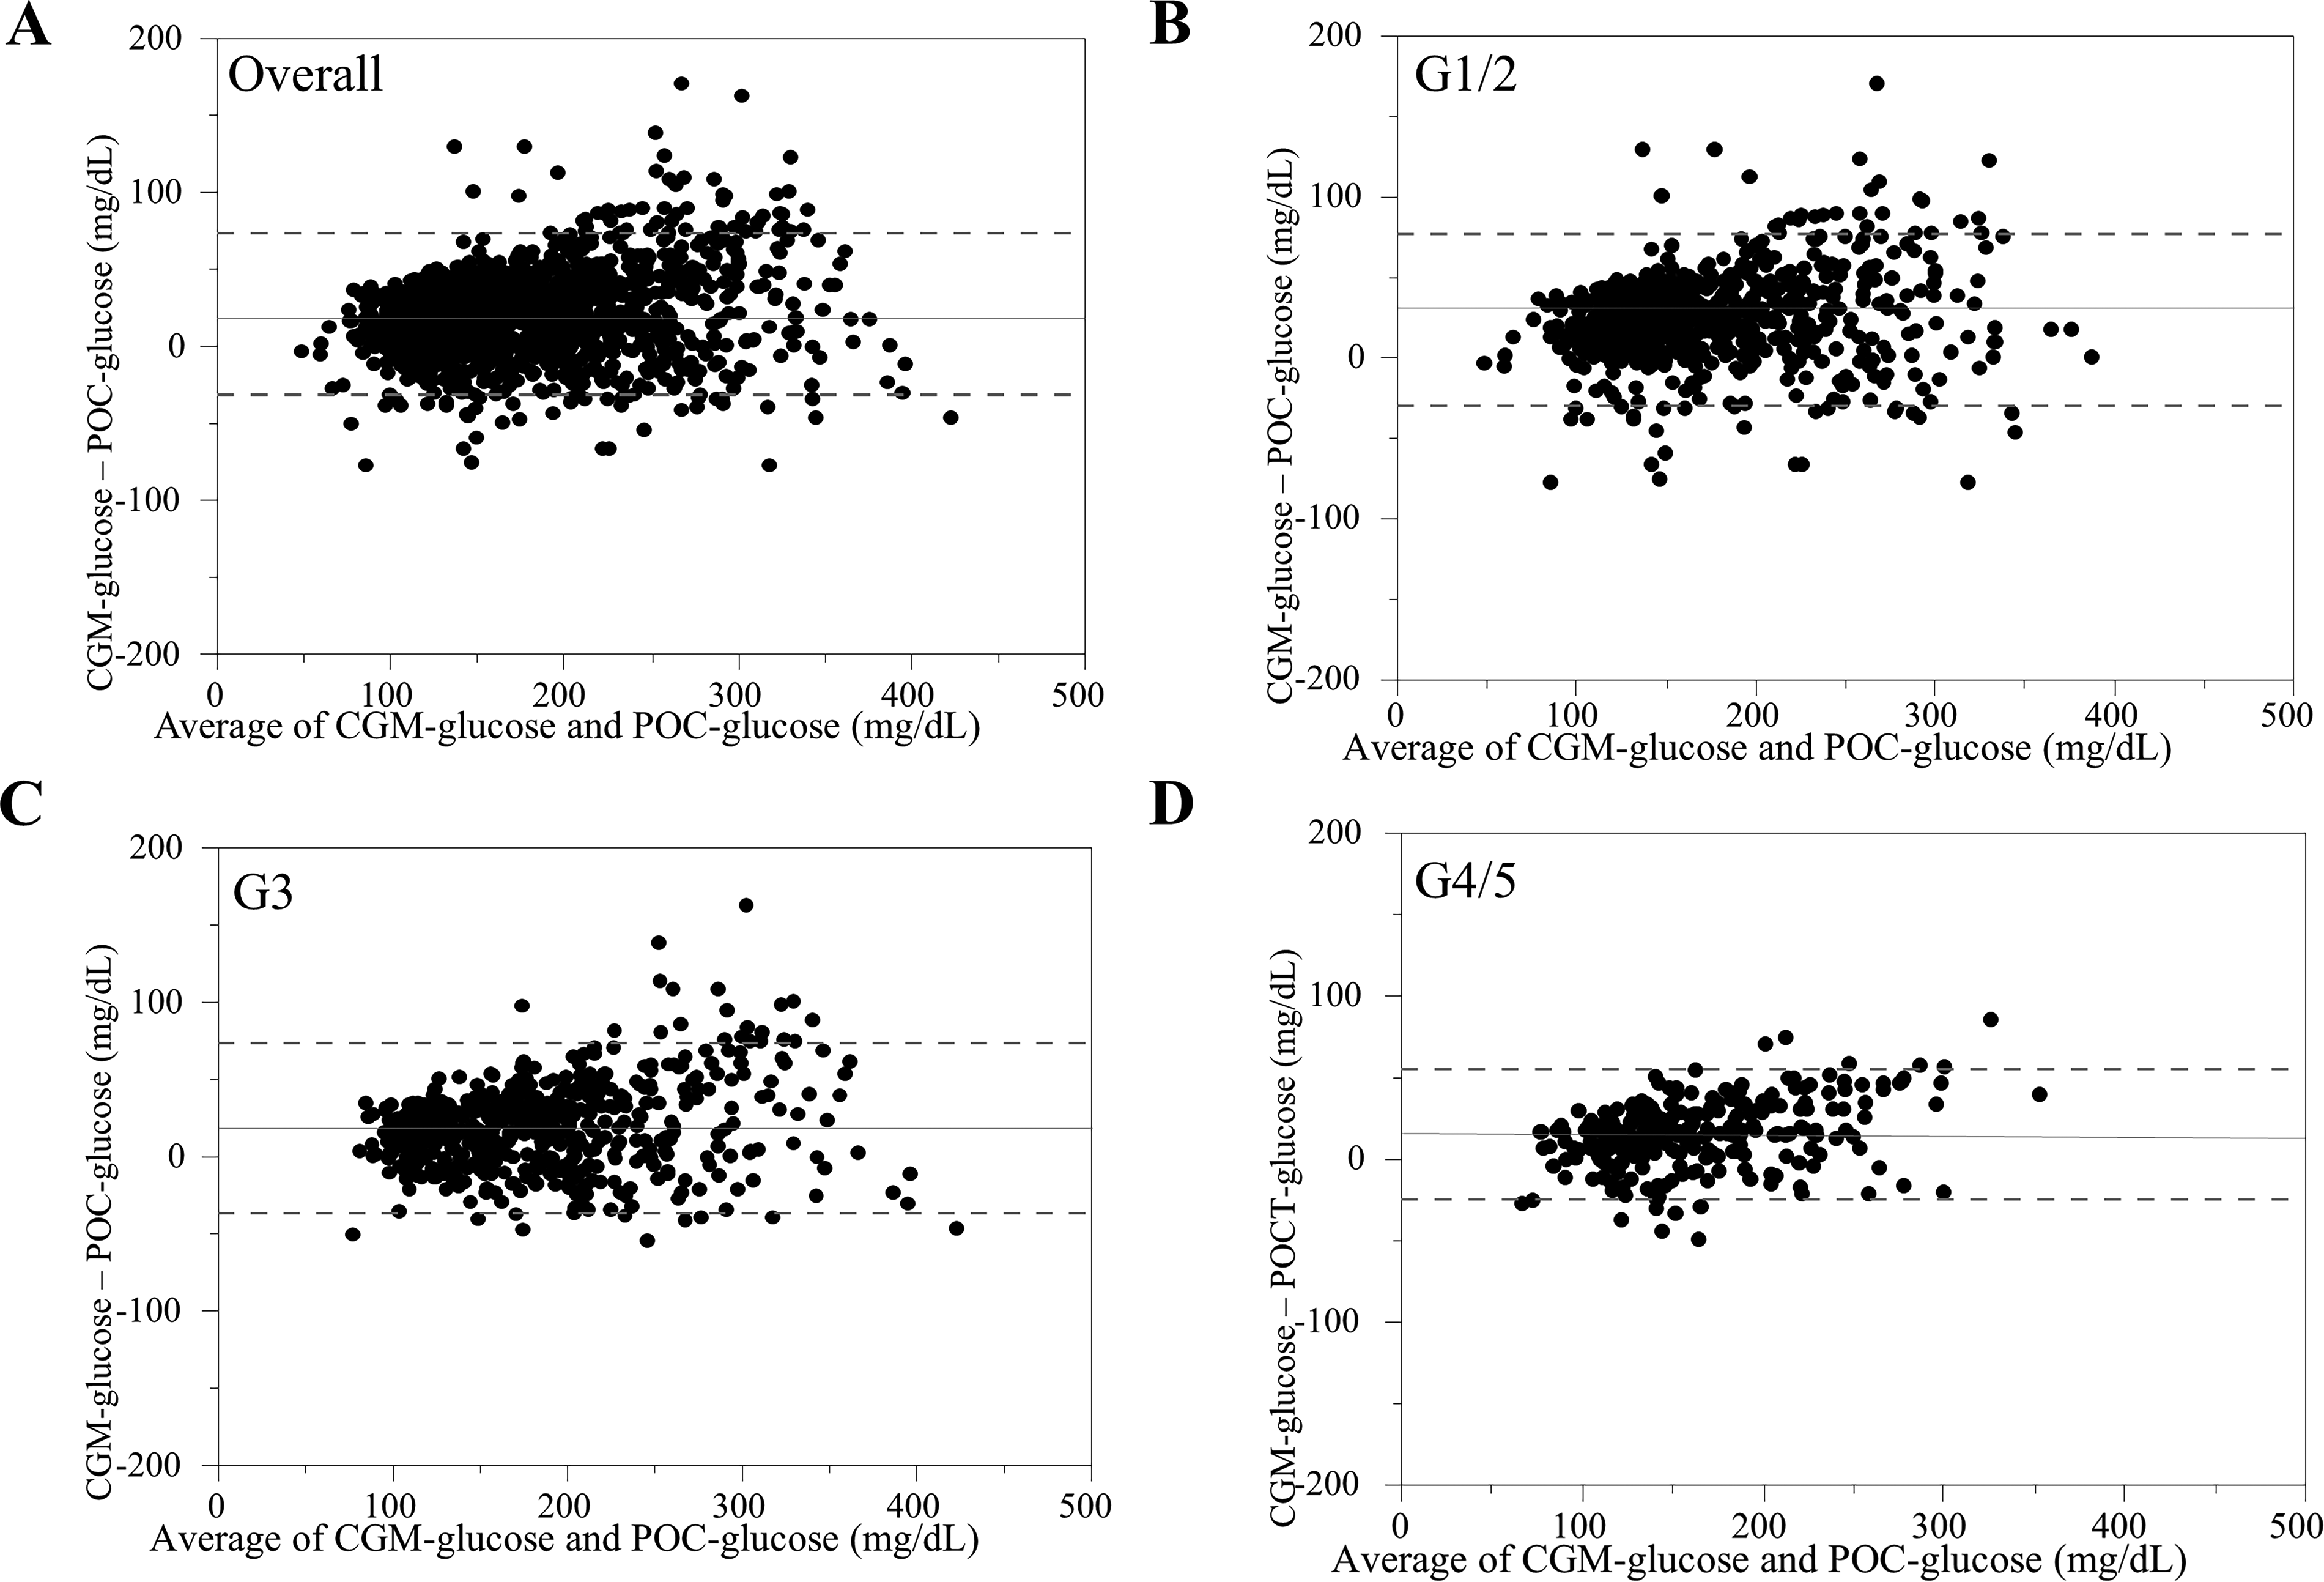
Bland–Altman plots showing the agreement between glucose values measured by CGM and POC. The differences between glucose values obtained from CGM and those measured by POC are plotted against the means of the two methods in all participants
CGM accuracy indices
The MARD for all participants was 17.0%. Among kidney function groups, the MARD was 19.4% in G1/2, 15.5% in G3, and 13.5% in G4/5, showing a significant difference among the groups (P < 0.001) (Table 2). The proportions of %15/15 were 51.0% in all participants, and 44.7% in G1/2, 55.0% in G3, and 60.0% in G4/5 with a significant difference among the kidney function groups (P < 0.001). For other thresholds, similar results were observed, with the highest values in the G4/5 group (79.6% for %20/20 and 96.8% for %30/30) and significant differences (P < 0.001 for all thresholds) (Table 2).
The Accuracy Metrics of Real-Time CGM in All Participants and Among Kidney Function Groups
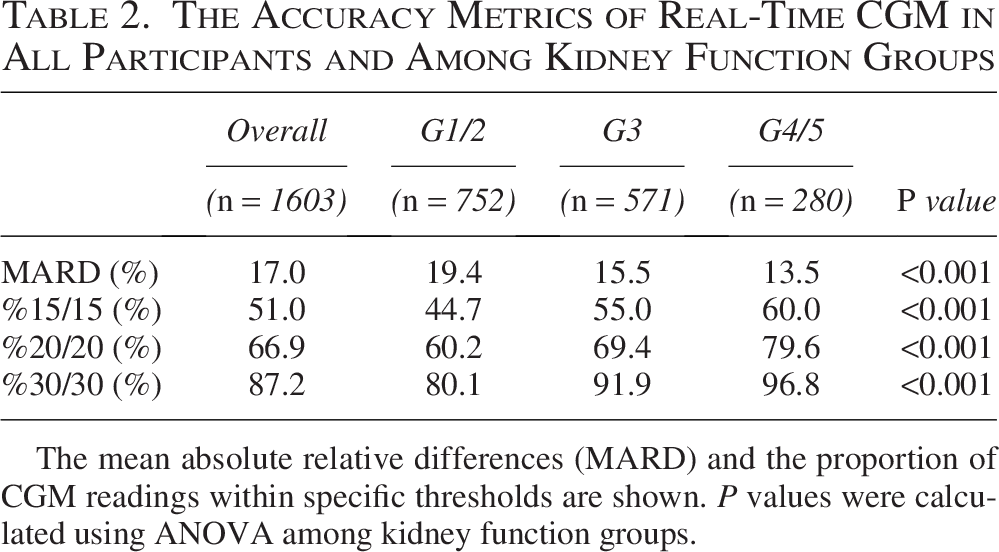
The mean absolute relative differences (MARD) and the proportion of CGM readings within specific thresholds are shown. P values were calculated using ANOVA among kidney function groups.
Consensus error grid analyses
In CEG analysis for all participants, 99.8% of the measurements fell within zones A and B, which represent clinically acceptable errors (Fig. 4A and Supplementary Table S1). The proportions of zones A and B showed consistently high values across all kidney function groups. In particular, all glucose pairs fell within these zones in the G3 and G4/5 groups (Fig. 4C,D and Supplementary Table S1).
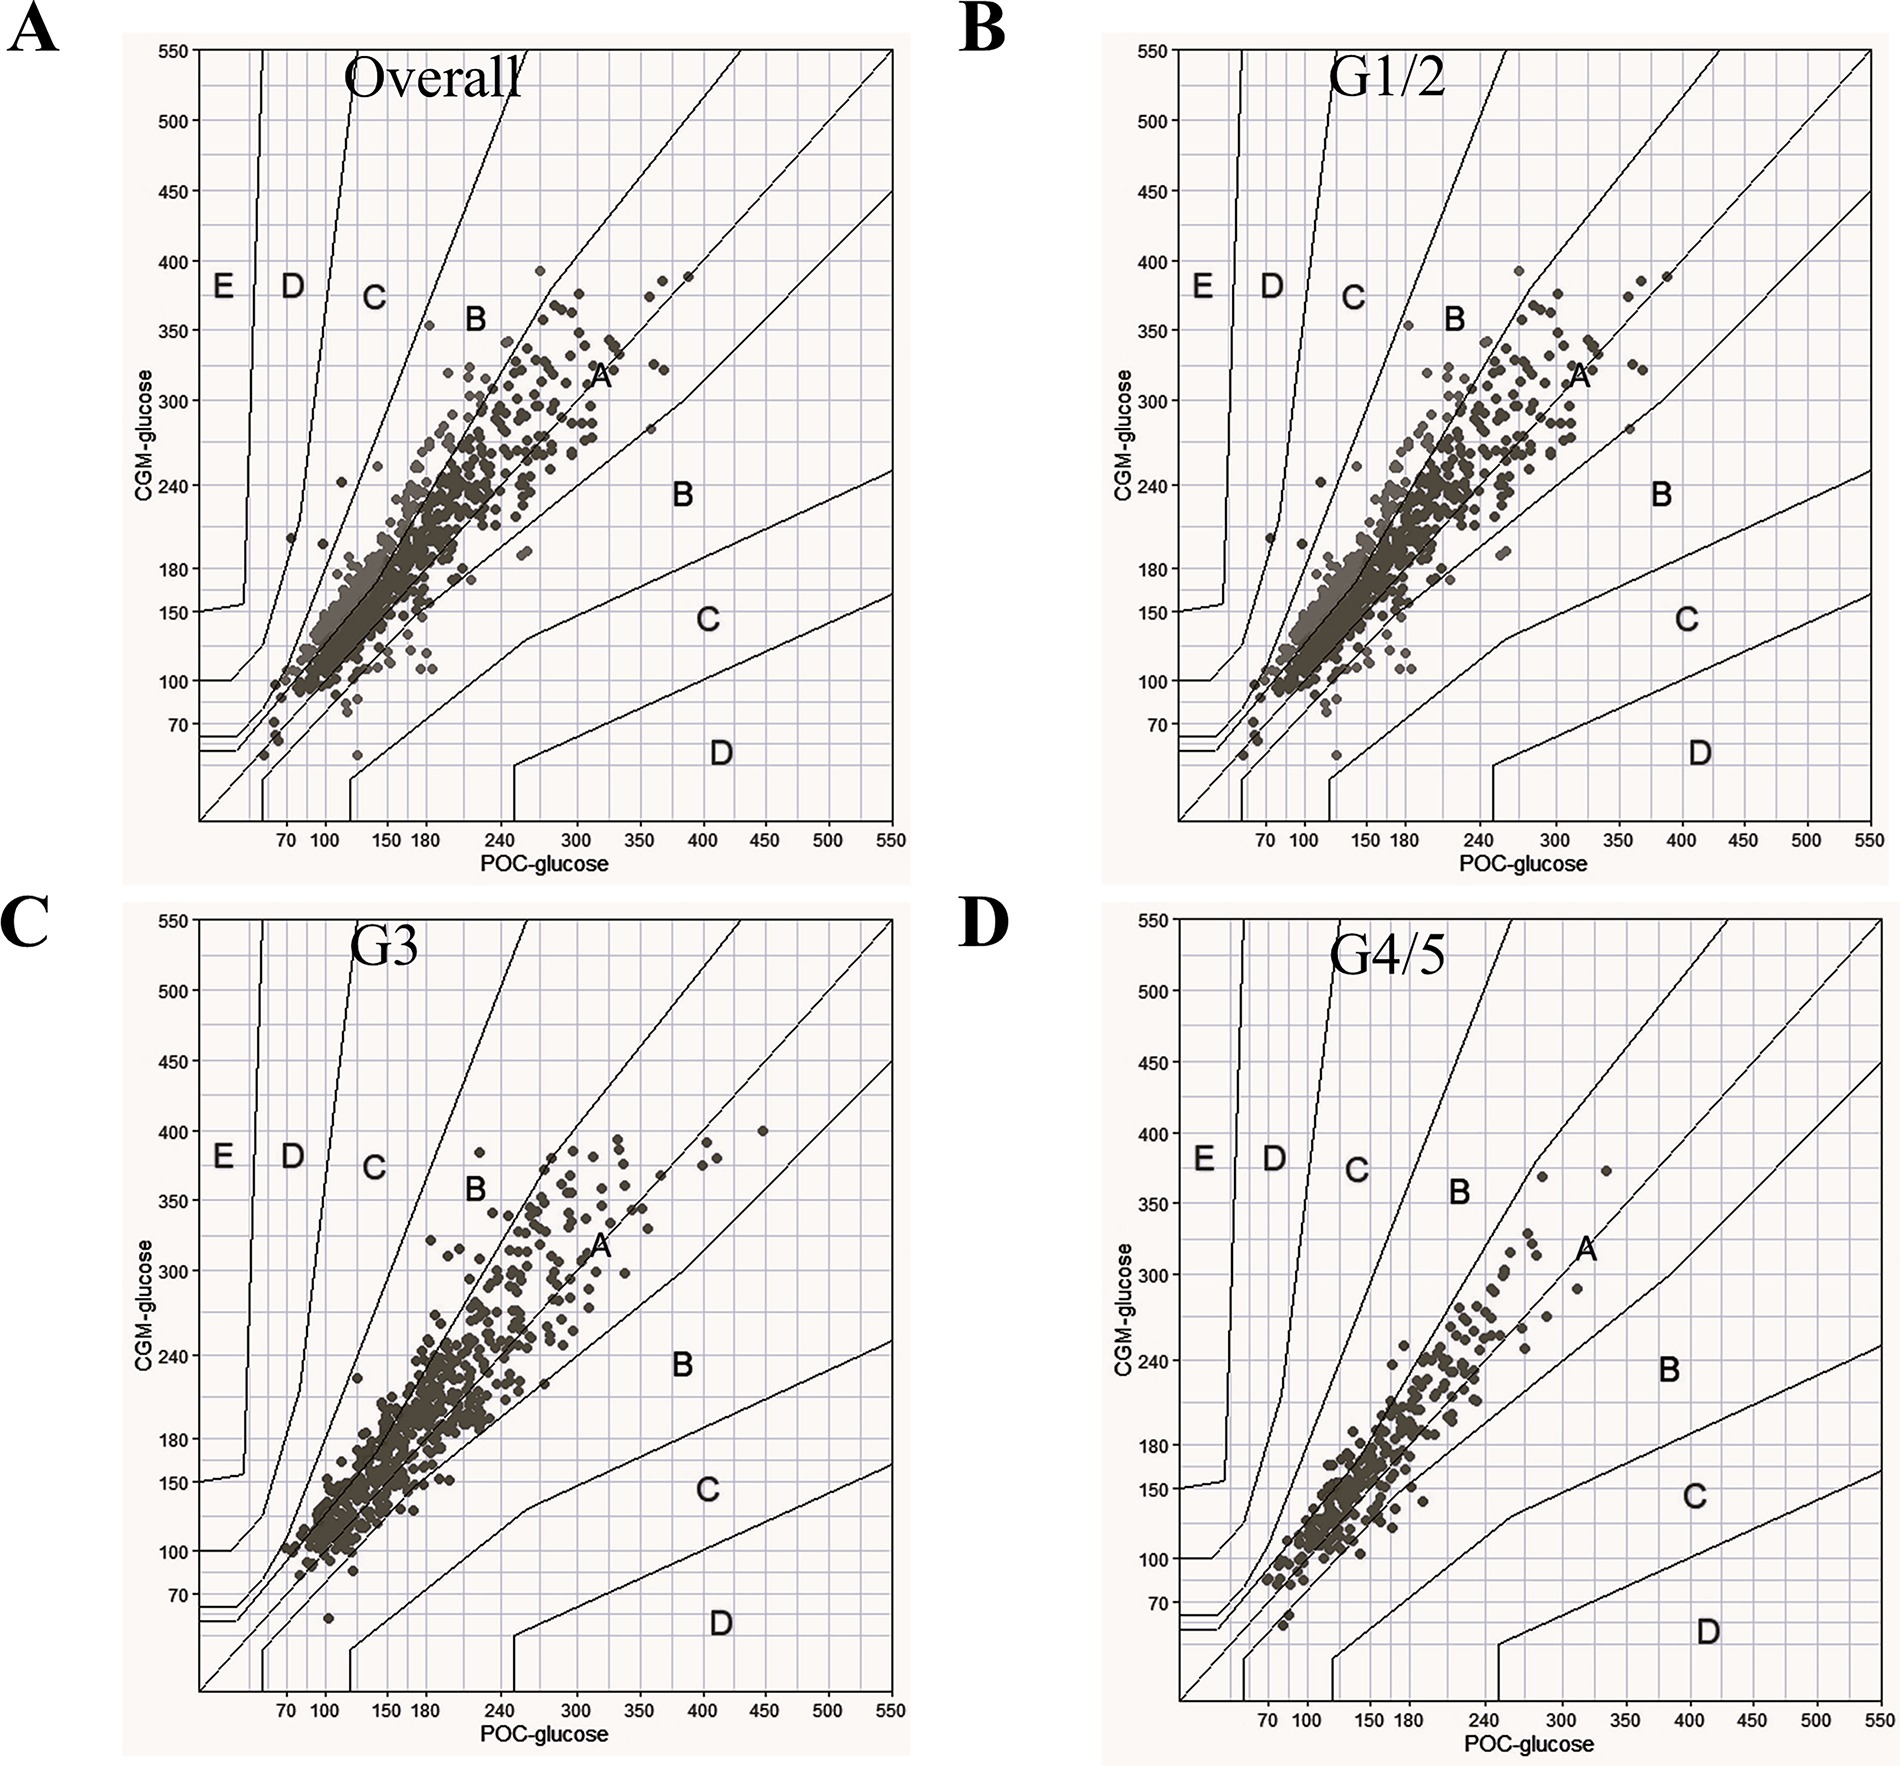
Consensus error grid analyses comparing glucose values obtained from CGM with those measured by POC in all participants
Clinical and temporal factors affecting CGM accuracy
To explore clinical factors associated with CGM accuracy, simple correlation analyses were performed between each patient’s mean or median ARD and various clinical parameters. Both mean ARD (r = 0.346, P = 0.012) and median ARD (r = 0.279, P = 0.045) were significantly correlated with eGFRcr (Supplementary Table S2). Significant correlations were also observed with eGFRcys (r = 0.412, P = 0.004 for mean ARD; r = 0.358, P = 0.013 for median ARD). In contrast, neither mean nor median ARD was significantly correlated with other clinical parameters, including BMI, hemoglobin, hematocrit, uric acid, urea nitrogen, sodium, chloride, plasma osmolality, HbA1c, log [ACR], mean CGM glucose, SD, coefficient of variation, or time in range (Supplementary Table S2).
The MARD within the first 24 h after CGM sensor attachment was 19.5%, which was significantly higher than that observed beyond 24 h, at 16.6% (Table 3). Within the first 24 h after sensor attachment, the mean glucose level measured by CGM was significantly higher in the patients with a MARD ≥ 20% than in those with a MARD < 20%, whereas no significant difference was observed in mean glucose levels measured by POC between the two groups. Beyond 24 h after CGM sensor attachment, mean CGM glucose levels remained higher in the MARD ≥ 20% group than in the MARD < 20% group; in contrast, mean POC glucose levels were significantly lower in the MARD ≥ 20% group. Other clinical parameters, including eGFRcre and eGFRcys, did not differ significantly between the MARD groups (Supplementary Table S3). In the subgroup analysis stratified by glucose range, the number of measurements with glucose levels below 70 mg/dL was very limited, whereas MARD was lower in the higher glucose ranges. When stratified by urinary ACR and serum albumin levels, MARD was similar between patients with macroalbuminuria and hypoalbuminemia and those without hypoalbuminemia, at 13.8% and 13.9%, respectively (Table 3).
MARD Stratified by Temporal and Clinical Parameters Affecting CGM Accuracy
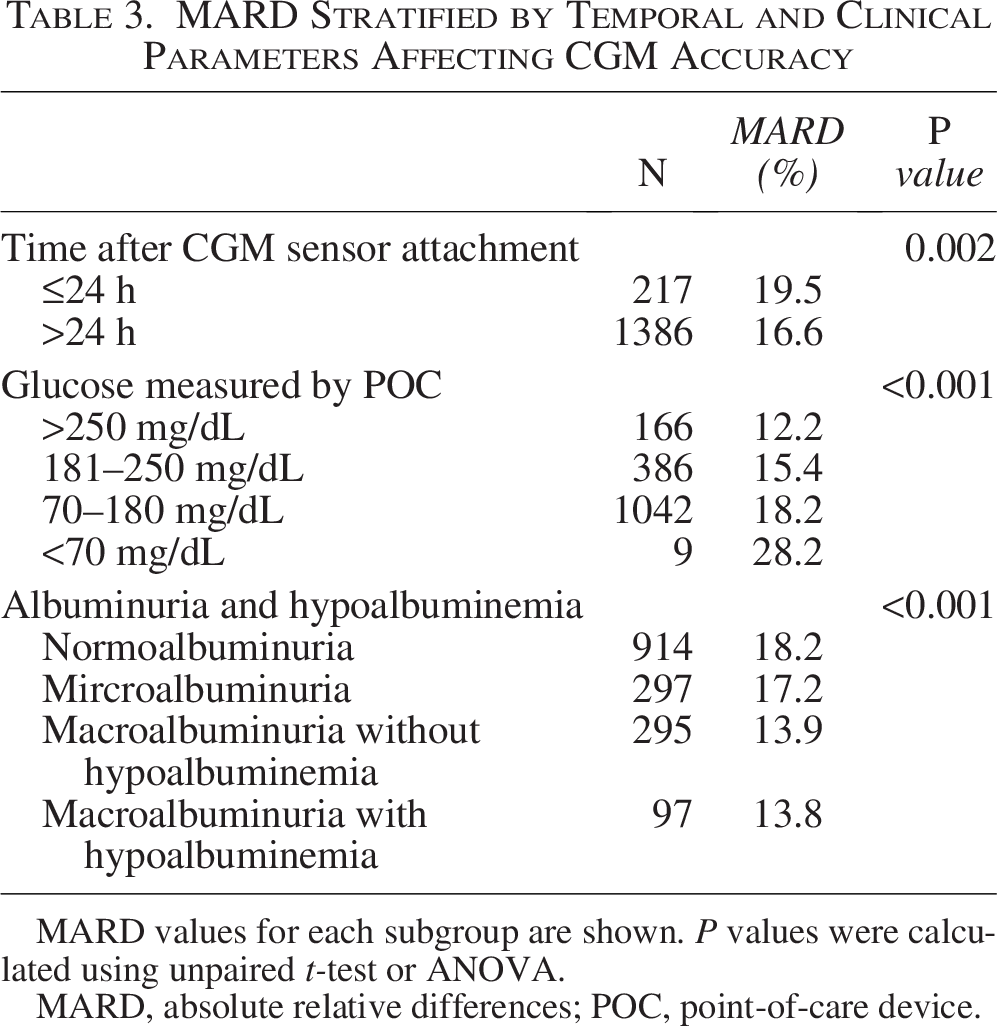
MARD values for each subgroup are shown. P values were calculated using unpaired t-test or ANOVA.
MARD, absolute relative differences; POC, point-of-care device.
Discussion
In this prospective cohort study of hospitalized patients with diabetes and CKD, we observed that Dexcom G6 exhibited a lower MARD in patients with more advanced CKD stages. Consistent findings were observed across other accuracy metrics, including simple correlation analyses, Bland–Altman plots, the proportions within specific thresholds (%15/15, %20/20, and %30/30), and CEG analysis, all of which indicated better CGM performance in patients with more advanced CKD. Interestingly, significant positive correlations between individual ARD and both eGFRcr and eGFRcys were also observed.
Previous studies evaluating the accuracy of real-time CGM in hospitalized patients with CKD remain limited. A subgroup analysis of non-critically ill inpatients reported no significant differences in mean or median ARD among eGFR groups, 11 which contrasts with our findings. In that report, however, the primary reasons for hospitalization were cardiovascular diseases and infections, 11 potentially influencing vascular permeability and the environment of interstitial fluid.30,31 In contrast, our study population included few severely ill patients. This difference in the general conditions of study participants may explain the discrepancy in results.
The reason for improved CGM accuracy in patients with more advanced CKD remains unclear. Candidate factors such as serum uric acid, blood urea nitrogen, and sodium, which have previously been suggested to influence CGM accuracy, showed no significant associations either in previous studies12,32 or in our analyses. In patients undergoing dialysis, ARD of Dexcom G6 has been reported to be lower during the interdialytic period compared to during dialysis sessions. 14 This finding suggests that uremic toxins, which are accumulated in kidney failure and are removed by hemodialysis, may affect CGM accuracy, supporting our results. However, the specific mediators remain unidentified.
Capillary permeability potentially contributes to CGM accuracy in patients with CKD. Glucose diffuses passively from the capillary endothelium into the interstitial fluid along its concentration gradient without requiring an active transporter. 33 This process is regulated by endothelial permeability, 34 which is mainly maintained by the glycocalyx, a glycosaminoglycan-rich layer on endothelial cells. 35 The barrier function of the endothelial glycocalyx was impaired in patients with CKD, 36 and in our previous study, lower eGFR was significantly associated with higher serum syndecan-1 level, a biomarker of the endothelial glycocalyx degradation. 37 Furthermore, histopathological analyses of skin biopsy specimens from patients with CKD have demonstrated microvascular endothelial damage in subcutaneous tissue. 38 Additionally, in the current study, patients in the G4/5 group tended to have lower CGM-derived SD values (Table 1), indicating fluctuations in glucose levels. This finding suggests that the difference in glucose concentration between capillary blood and interstitial fluid was reduced in these patients. Consequently, chronically increased glucose diffusion rates and a smaller glucose concentration gradient in patients with advanced CKD may allow CGM readings to more closely approximate actual blood glucose values during the inherent temporal lag between CGM and POC measurement.
The MARD observed in this study was 17.0% in all participants and 19.4% in the G1/2 group, which was higher than the previously reported value of 12.8% 11 in-hospital settings. One possible explanation for this discrepancy is the absence of calibration in the present study. Previous study has shown that the once-daily calibration improves the accuracy of the Dexcom G6 system. 26 In studies evaluating Dexcom G6 accuracy in hospitalized patients using protocols without calibration, reported MARD values were 19.2%, 26 19.4%, 14 and 22.7%, 12 which is comparable to the findings of the present study. Another potential factor contributing to the higher MARD is the difference in study design. In the previous study, participants who required CGM sensor replacement within the first 24 h were excluded, 11 whereas in this study, all patients who underwent glucose control using CGM were included. In comparisons between patients with a MARD ≥ 20% and those with a MARD < 20%, a discrepancy between CGM and POC was already evident within the first 24 h after sensor attachment and persisted beyond 24 h (Supplementary Table S3). When the analysis was restricted to glucose values obtained beyond the first 24 h after CGM sensor attachment, MARD showed only a modest improvement, reaching 16.6% in all participants (Table 3) and 19.0% in the G1/2 group. Despite additional subgroup and two-group analyses, the specific clinical factors contributing to MARD, particularly in the G1/2 group, remain only partially explained and cannot be fully accounted for by the available data. No obvious differences in clinical parameters were identified that could explain the higher MARD observed in the present study. In subgroup analyses, higher MARD was observed for glucose measurement within the hypoglycemic range (<70 mg/dL). However, only nine glucose measurements fell within the hypoglycemic range, which was unlikely to have substantially influenced the overall MARD.
This study has several limitations. First, because this was a single-center study with a relatively small sample size, the possibility that sensor accuracy may have been biased by chance cannot be completely excluded. Although not strictly the same product, a mean absolute difference was reported to be 24 mg/dL between two simultaneously worn Dexcom G6 Pro sensors; 39 therefore, random sensor-to-sensor variability may have influenced the observed accuracy in the present study. Second, we were unable to comprehensively evaluate factors thought to influence CGM sensor accuracy. Although fluid retention may affect CGM accuracy, 26 the presence or severity of edema was not directly assessed in this study. In stratified analyses using albuminuria and hypoalbuminemia as alternative markers of fluid retention, MARD was not elevated in patients with macroalbuminuria and hypoalbuminemia, suggesting that the impact of fluid retention on CGM accuracy may be limited. However, direct assessment will be necessary to draw firm conclusions. Third, the proportion of patients with type 1 diabetes (17.3%) and those treated with insulin (30.8% receiving long-acting insulin and 17.3% receiving short-acting insulin) was relatively small in the present study. Although real-time CGM is particularly beneficial in clinical practice for these patients at high risk of hypoglycemia, the reliability of real-time CGM observed in this study may not be fully generalizable to these populations. Fourth, patients with severe systemic illness were rarely included because poorly controlled diabetes was the primary reason for hospitalization. This may minimize the influence of systemic illness on vascular permeability and the interstitial environment, 31 allowing a clear evaluation of the impact of kidney dysfunction on CGM accuracy. Future studies are needed to determine whether these findings can be generalized to critically ill patients. Fifth, our findings were derived from a single CGM system, and it remains unclear whether similar results would be obtained with other systems. Finally, reference blood glucose values were obtained using capillary blood with a POC device. Although such values correlate well with plasma glucose values measured by standard laboratory methods, 17 they are not identical.
Conclusions
In conclusion, the Dexcom G6 demonstrated clinically acceptable accuracy in hospitalized patients with CKD, particularly in those with advanced kidney dysfunction. Although the observed accuracy of real-time CGM supports its broader use in this population, the adoption of more reliable protocols, such as the combined use of CGM and POC glucose measurements and once-daily calibration of CGM in the morning or evening before meals, is desirable in clinical practice for patients with a high risk of hypoglycemia. Further studies are needed to determine whether the use of real-time CGM improves in-hospital glycemic control compared to conventional management approaches.
Authors’ Contributions
Y.K., T.M., and E.M. were involved in the conception, design, conduct of the study, and interpretation of the results. Y.K. and S.M. were involved in the acquisition and analysis of data. Y.N., Y.M., and O.A. advised on the study design and provided specialist input. Y.K. and T.M. wrote the first draft of the article. All authors edited, reviewed, and approved the final version of the article. Y.K. is the guarantor of this work and, as such, has full access to all the data in the study and takes responsibility for the integrity of the data and the accuracy of the data analysis.
Footnotes
Acknowledgments
The authors acknowledge the valuable assistance of all the data entry staff at the Department of Metabolism, Endocrinology, and Molecular Medicine, Osaka Metropolitan University Graduate School of Medicine.
Author Disclosure Statement
T.M. received consulting fee from Dexcom Japan G.K. E.M. received grand support and/or honoraria from Nippon Boehringer Ingelheim, Dexcom Japan, Abott Janan, Novo Nordisk Pharma, and Sumitomo Pharmaceutical. These companies had no involvement in the study design, data collection, analysis, interpretation, or article preparation. Y.K., S.M, Y.N., Y.M., and A.O. declare that there are no conflicts of interest.
Funding Information
This study received no specific grant from any funding agency in the public, commercial, or not-for-profit sectors.
Supplemental Material
References
Supplementary Material
Please find the following supplemental material available below.
For Open Access articles published under a Creative Commons License, all supplemental material carries the same license as the article it is associated with.
For non-Open Access articles published, all supplemental material carries a non-exclusive license, and permission requests for re-use of supplemental material or any part of supplemental material shall be sent directly to the copyright owner as specified in the copyright notice associated with the article.