
Abstract
Objective:
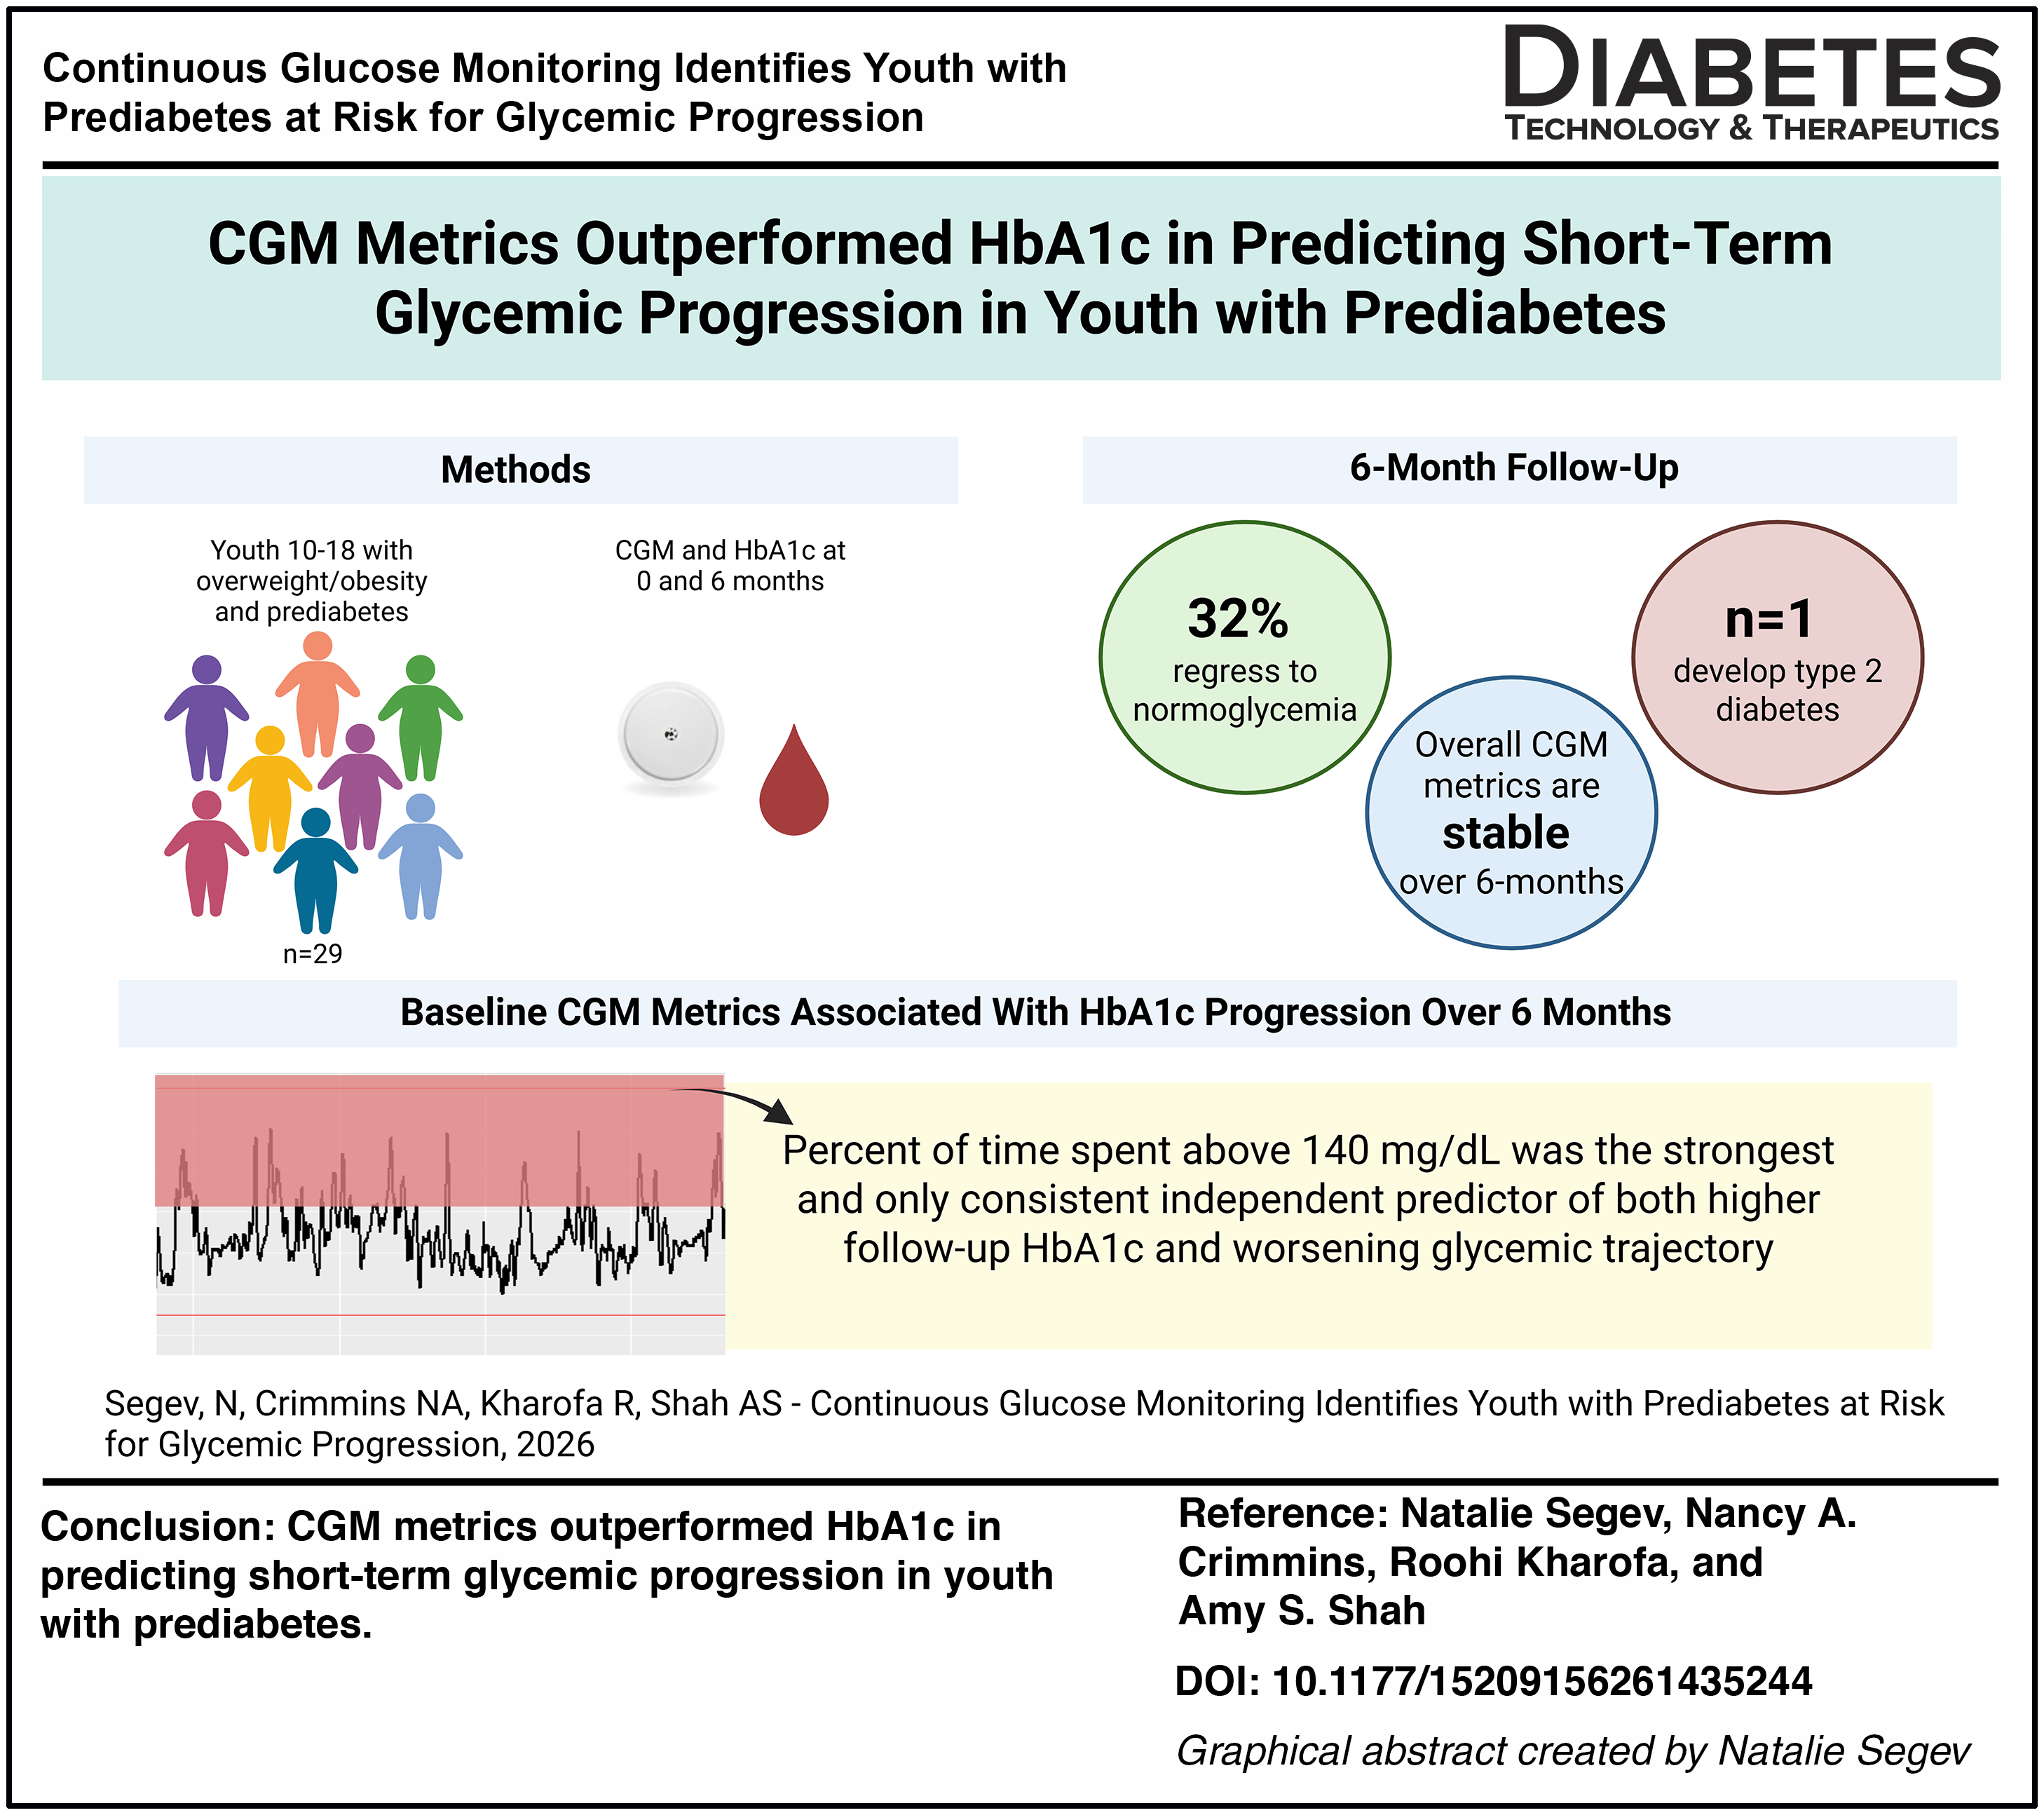
Pediatric prediabetes is common among youth with obesity, yet most do not progress to type 2 diabetes, and many regress to normoglycemia. Youth-onset type 2 diabetes has a severe course not well predicted by degree of adiposity or hemoglobin A1c (HbA1c) alone. This study used continuous glucose monitoring (CGM) to characterize glycemic patterns in youth with prediabetes and to determine whether baseline CGM metrics identify those at highest risk for HbA1c progression over 6 months.
Research Design and Methods:
Youth aged 10–18 years with obesity and HbA1c 5.7%–6.4% were enrolled in a prospective 6-month observational cohort study, with baseline and follow-up assessments including HbA1c and 14 days of CGM wear. CGM metrics were derived using the R iglu package. Changes over time and associations with follow-up HbA1c and HbA1c change were analyzed using paired t-tests and PRESS-based forward-selected linear regression models, adjusting for clinical covariates.
Results:
Among 29 youth with prediabetes, HbA1c and most CGM metrics remained stable over 6 months, with 32% regressing to normoglycemia. One participant progressed to HbA1c 6.5% who demonstrated markedly elevated baseline CGM glycemic variability and hyperglycemia. While multiple baseline CGM metrics were associated with follow-up HbA1c and HbA1c change in univariable analyses, PRESS-based multivariable models identified time spent above 140 mg/dL as the strongest and only consistent independent predictor of both higher follow-up HbA1c and worsening glycemic trajectory.
Conclusions:
CGM metrics outperformed HbA1c in predicting short-term glycemic progression in youth with prediabetes, supporting CGM as a promising adjunctive tool for early risk stratification.
Objective
Pediatric prediabetes is highly prevalent among youth with obesity, with recent estimates of around 25%. 1 Nonetheless, less than 2% of all youth with obesity will progress to youth-onset type 2 diabetes and, importantly, 22%–52% of youth with prediabetes will regress to normoglycemia without intervention.2–4 Youth-onset type 2 diabetes is characterized by faster beta-cell deterioration, less responsive to traditional diabetes pharmacotherapies, earlier onset of complications, and increased long-term mortality than adult-onset disease.5–11 Excess weight severity alone does not reliably predict which youth are at highest risk to progress from prediabetes to type 2 diabetes, highlighting a critical need for improved risk stratification. While hemoglobin A1c (HbA1c) is considered a valid screening test for pediatric prediabetes and type 2 diabetes, its adoption is widely based on adult data. In pediatric populations, studies have questioned the utility of HbA1c due to poor sensitivity for identifying early dysglycemia and its tendency to underestimate the prevalence of prediabetes and diabetes in youth.7,12,13 Given the severity and health burden of youth-onset type 2 diabetes, additional screening and risk prediction tools are needed to identify youth with prediabetes who are most likely to experience glycemic progression. Improved risk identification is critical to guide appropriate monitoring and follow-up and to inform the design of future therapeutic trials, particularly given the absence of FDA-approved pharmacologic therapies proven to preserve beta-cell function or prevent progression in pediatric prediabetes.
Continuous glucose monitoring (CGM) is a technology that measures interstitial glucose levels continuously, providing real-time information on glycemic values and a more in-depth characterization of day-to-day glucose variability than HbA1c. 14 CGM is utilized in type 2 diabetes to understand glycemic patterns and inform diabetes management, but its use is limited in prediabetes. CGM metrics have shown associations with prediabetes status and insulin resistance in youth with obesity, but data remain limited on whether it can be utilized as a tool to predict glycemic progression.15,16
The objectives of this study were to (1) characterize the CGM-derived glycemic pattern in youth with prediabetes and assess if these patterns change over a 6-month period, and (2) determine if baseline CGM metrics can identify youth at-risk for worsening HbA1c over time. Although prior studies have described CGM metrics in youth with prediabetes,15,16 this is the first longitudinal study to evaluate changes in CGM metrics over a 6-month period and to assess the relationship between CGM metrics and hemoglobin A1c progression in youth with prediabetes. We hypothesized that youth with higher glycemic variability and more time spent above 140 mg/dL at baseline would be more likely to have a worsening HbA1c over 6-month period. This 140 mg/dL threshold was selected due to its use in defining impaired glucose tolerance and its association with clinically relevant glycemic exposure.15,17,18
Research Design and Methods
Pediatric participants aged 10–18 years with history of obesity (body mass index [BMI] ≥ 95th percentile for age and sex) and history of HbA1c in the prediabetes range (5.7%–6.4% [39–46 mmol/mol]) were enrolled in a prospective observational cohort study at Cincinnati Children’s Hospital Medical Center between January 2024 and September 2025. Participants were recruited from subspecialty clinics, including endocrinology and weight management clinics, at the time of or following routine clinical visits, which included lifestyle counseling by dietitians and exercise specialists. Eligibility included participants with prior or current HbA1c in the prediabetes range, including those whose HbA1c had normalized by the baseline study visit. Inclusion of participants with prior or current HbA1c in the prediabetes range, regardless of baseline normalization, allowed evaluation of early glycemic abnormalities that may not be captured by a single HbA1c measurement. Exclusion criteria included any clinical or laboratory concern for type 1 diabetes and current use of medications that interfere with normal glucose dynamics, such as atypical antipsychotics, metformin, and systemic steroids. Islet autoantibody testing was not systematically performed in participants with prediabetes and was reserved for those with clinical features or risk factors raising concern for autoimmune type 1 diabetes. Participants were followed over a 6-month period with study visits conducted at baseline and at 6-month follow-up. At each visit, demographic information and anthropometric measurements, including Tanner stage, blood pressure, height, weight, and BMI, were collected, and a chart review was conducted for any available lipid and hepatic laboratory data. HbA1c was obtained at each visit, and participants had a Libre 3 unblinded CGM placed for a 14-day monitoring period.
Individual CGM device data was collected from the LibreView provider database. CGM metrics evaluated included glucose management indicator (GMI), mean amplitude glycemic excursion (MAGE), glucose standard deviation (SD), coefficient of variability (CV), mean glucose, percent of glucose values above 140, 180, and 200 mg/dL, time in range (TIR) between 70 and 180 mg/dL, percent of glucose values below 70 and 60 mg/dL, maximum glucose value, and mean 7 a.m. value (to potentially represent a fasting state). GMI is considered to be a CGM-derived estimate of HbA1c. MAGE, glucose SD, and CV are measures of glycemic variability—the higher the value, the more glycemic variability.
R Studio statistical software was used with the iglu package to calculate CGM metrics for each participant.19,20 The iglu package was used to create individual CGM tracings. SAS Studio (version 9.4; SAS Institute Inc., Cary, NC) was used for demographic and CGM descriptive statistics, paired t-tests, and regression analysis.
First, paired t-tests were used to compare baseline and 6-month follow-up CGM metrics to assess changes in glycemic CGM patterns over time. Second, univariable linear regression analyses were performed to evaluate individual baseline CGM metrics for their association with two outcomes: (1) 6-month follow-up HbA1c and (2) glycemic progression, defined as the change in HbA1c from baseline to 6 months. Modeling HbA1c change, as opposed to only follow-up HbA1c, allowed assessment of predictors of glycemic trajectory rather than persistence of baseline glycemic status.
Given significant collinearity among multiple CGM metrics, to identify CGM metrics with independent predictive value while minimizing overfitting, candidate CGM variables were subsequently evaluated using forward selection based on the prediction residual sum of squares (PRESS) criteria for each outcome. Demographic and clinical covariates, including age, sex, race, BMI z-score, and baseline HbA1c, were also considered as candidate predictors. Variables retained through PRESS-based selection were entered into final multivariable linear regression models for inference. This study was powered to answer whether lower TIR is associated with worsening glycemia, assuming a 0.5% increase in hemoglobin A1c over 6 months among youth with low TIR compared with no change among those with higher TIR; under these assumptions, a sample size of 29 provided 80% power at a two-sided α of 0.05. Statistical significance was defined as a two-sided P value < 0.05. Results are reported as β-coefficients with corresponding 95% confidence intervals and P values.
Results
Baseline demographic and clinical characteristics are summarized in Table 1. Twenty-nine participants with a history of HbA1c in the prediabetes range were enrolled. This cohort of youth with prediabetes had a mean ± SD age of 14.2 ± 2.3 years, was predominantly female (83%), and was predominantly non-Hispanic Black (62%). Mean ± SD BMI z-score was 2.6 ± 1.0; 28% had a blood pressure value ≥95 percentile for age and sex at the time of visit, and 17% had elevated low-density lipoprotein cholesterol and/or triglycerides for age on current or fasting labs in the previous 12 months. Among females (n = 24), 23 had attained menarche at a mean ± SD age of 11.8 ± 1.6 years. When evaluating all participants, 59% were Tanner V at the time of enrollment, 10% Tanner IV, 7% Tanner III, and 7% Tanner II, while 17% declined puberty examination. Participants had a mean ± SD duration of prediabetes (time from first HbA1c in the prediabetes range) of 2.2 ± 2.0 years, with a mean ± SD HbA1c at diagnosis of 5.9 ± 0.2% (41 ± 2 mmol/mol). The mean ± SD interval between study visits was 6.1 ± 2.3 months. At follow-up, HbA1c data were available for 27 participants and CGM data for 24 participants. The n = 5 who were lost to follow-up were all female and spread across race/ethnicity (2 non-Hispanic White, 1 non-Hispanic Black, 1 Hispanic, and 1 mixed race) but otherwise similar to the overall cohort in terms of age, race/ethnicity, and sex.
Participant Demographics and Clinical Characteristics at Baseline Visit
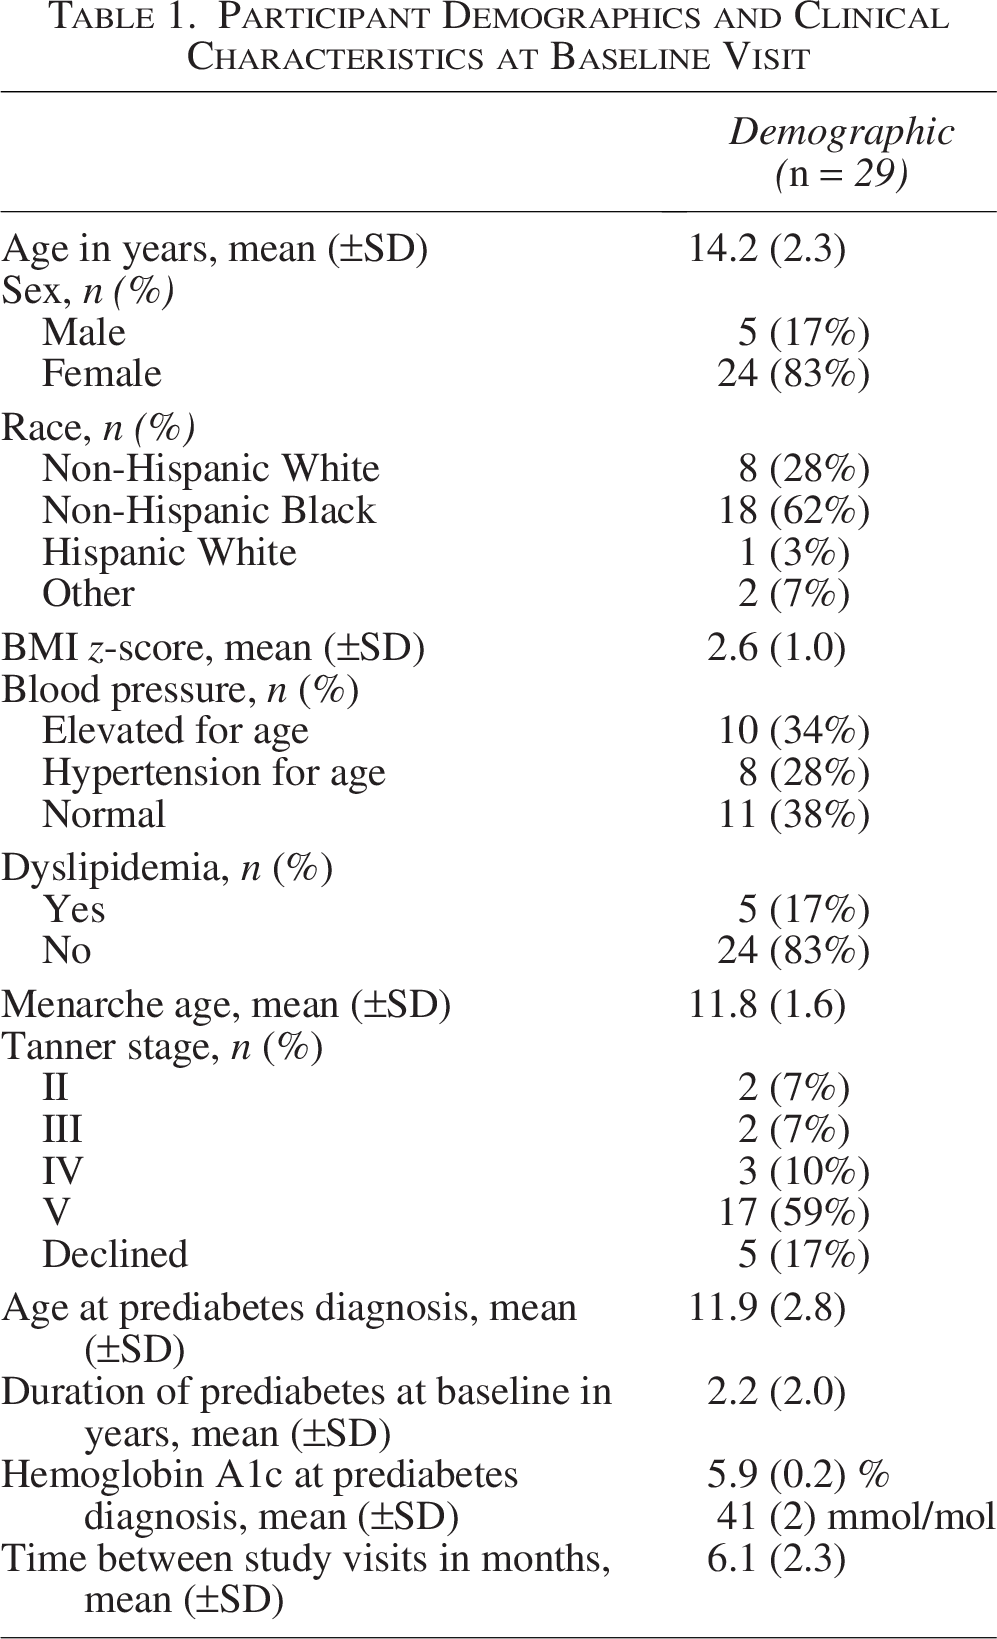
Data are presented as mean ± standard deviation (SD) for continuous variables and number (percentage) for categorical variables unless otherwise indicated. BMI z-score reflects age- and sex-adjusted body mass index. Blood pressure categories are defined using age-, sex-, and height-specific pediatric criteria. Menarche age is reported among participants who had reached menarche at baseline (n = 23). Tanner stage reflects pubertal development at baseline. Hemoglobin A1c values are shown in both percent (%) and mmol/mol. Time between study visits represents the interval between baseline and follow-up assessments.
At the time of baseline study visit, HbA1c was ≥ 5.7% (39 mmol/mol) for n = 22 and < 5.7% (39 mmol/mol) for n = 7. At 6-month follow-up HbA1c was ≥ 5.7% (39 mmol/mol) for n = 15, <5.7% (39 mmol/mol) for n = 11, and n = 1 had HbA1c of 6.5% (48 mmol/mol), in the diabetes range. Seven youth (32%) with HbA1c in the prediabetes range at the baseline visit regressed to normal HbA1c at follow-up. The one individual who developed follow-up HbA1c in the diabetes range had a baseline HbA1c of 6.0% (42 mmol/mol). Interestingly, their baseline CGM GMI was 6.6% (49 mmol/mol). They represent the individual with the highest CGM metrics, including the highest glucose variability (MAGE, glucose SD, CV), the highest percent of values above 140, 180, and 200 mg/dL, and a maximum CGM glucose documented of 255 mg/dL. Unfortunately, this individual was lost to follow-up, and follow-up CGM or repeat HbA1c for confirmatory diabetes diagnosis has not been obtained. Baseline CGM tracing for this individual is shown in Figure 1. Of the other n = 4 participants with missing CGM at follow-up, 2 were lost-to-follow-up, and the other 2 had clinical HbA1cs of 6.0% and 6.1%.
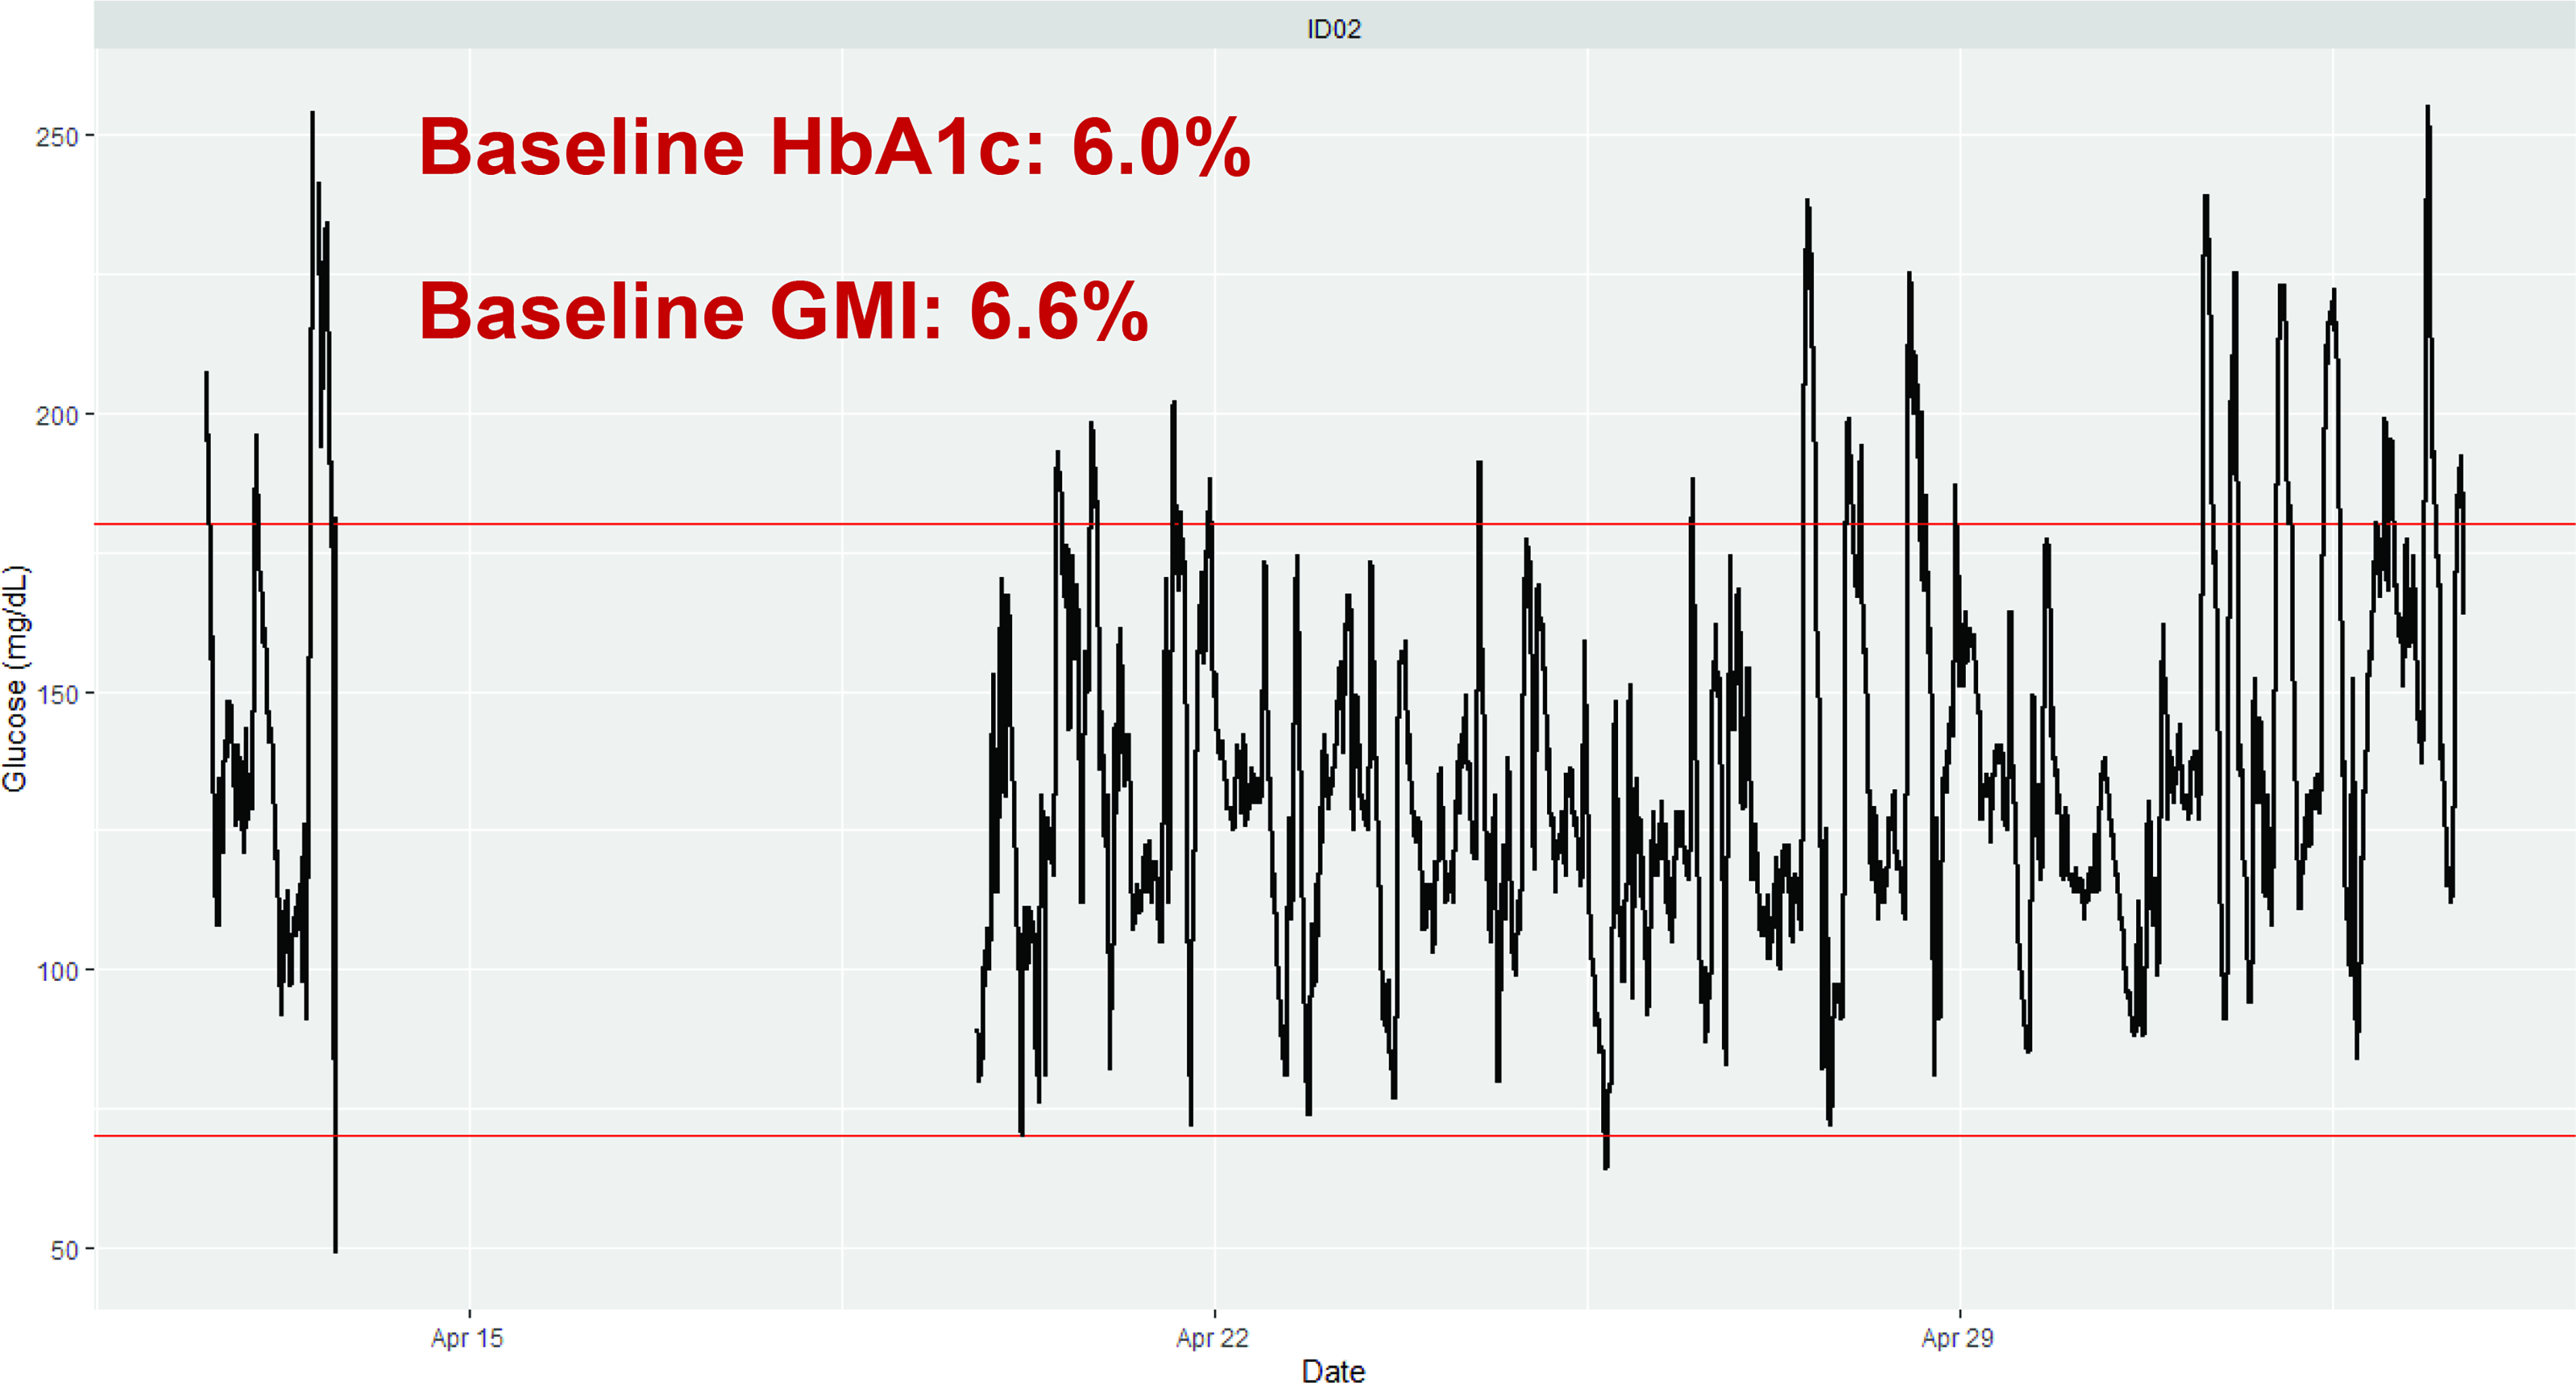
CGM baseline tracing of individual with follow-up HbA1c of 6.5%. Representative 14-day CGM profile from a participant with a baseline HbA1c of 6.0% (42 mmol/mol). The CGM-derived GMI over the monitoring period was 6.6% (49 mmol/mol). The tracing demonstrates day-to-day glycemic variability, including postprandial excursions and overnight glucose patterns. Red horizontal lines across the tracing represent time in the range of 70–180 mg/dL. CGM, continuous glucose monitoring; GMI, glucose management indicator; HbA1c, hemoglobin A1c.
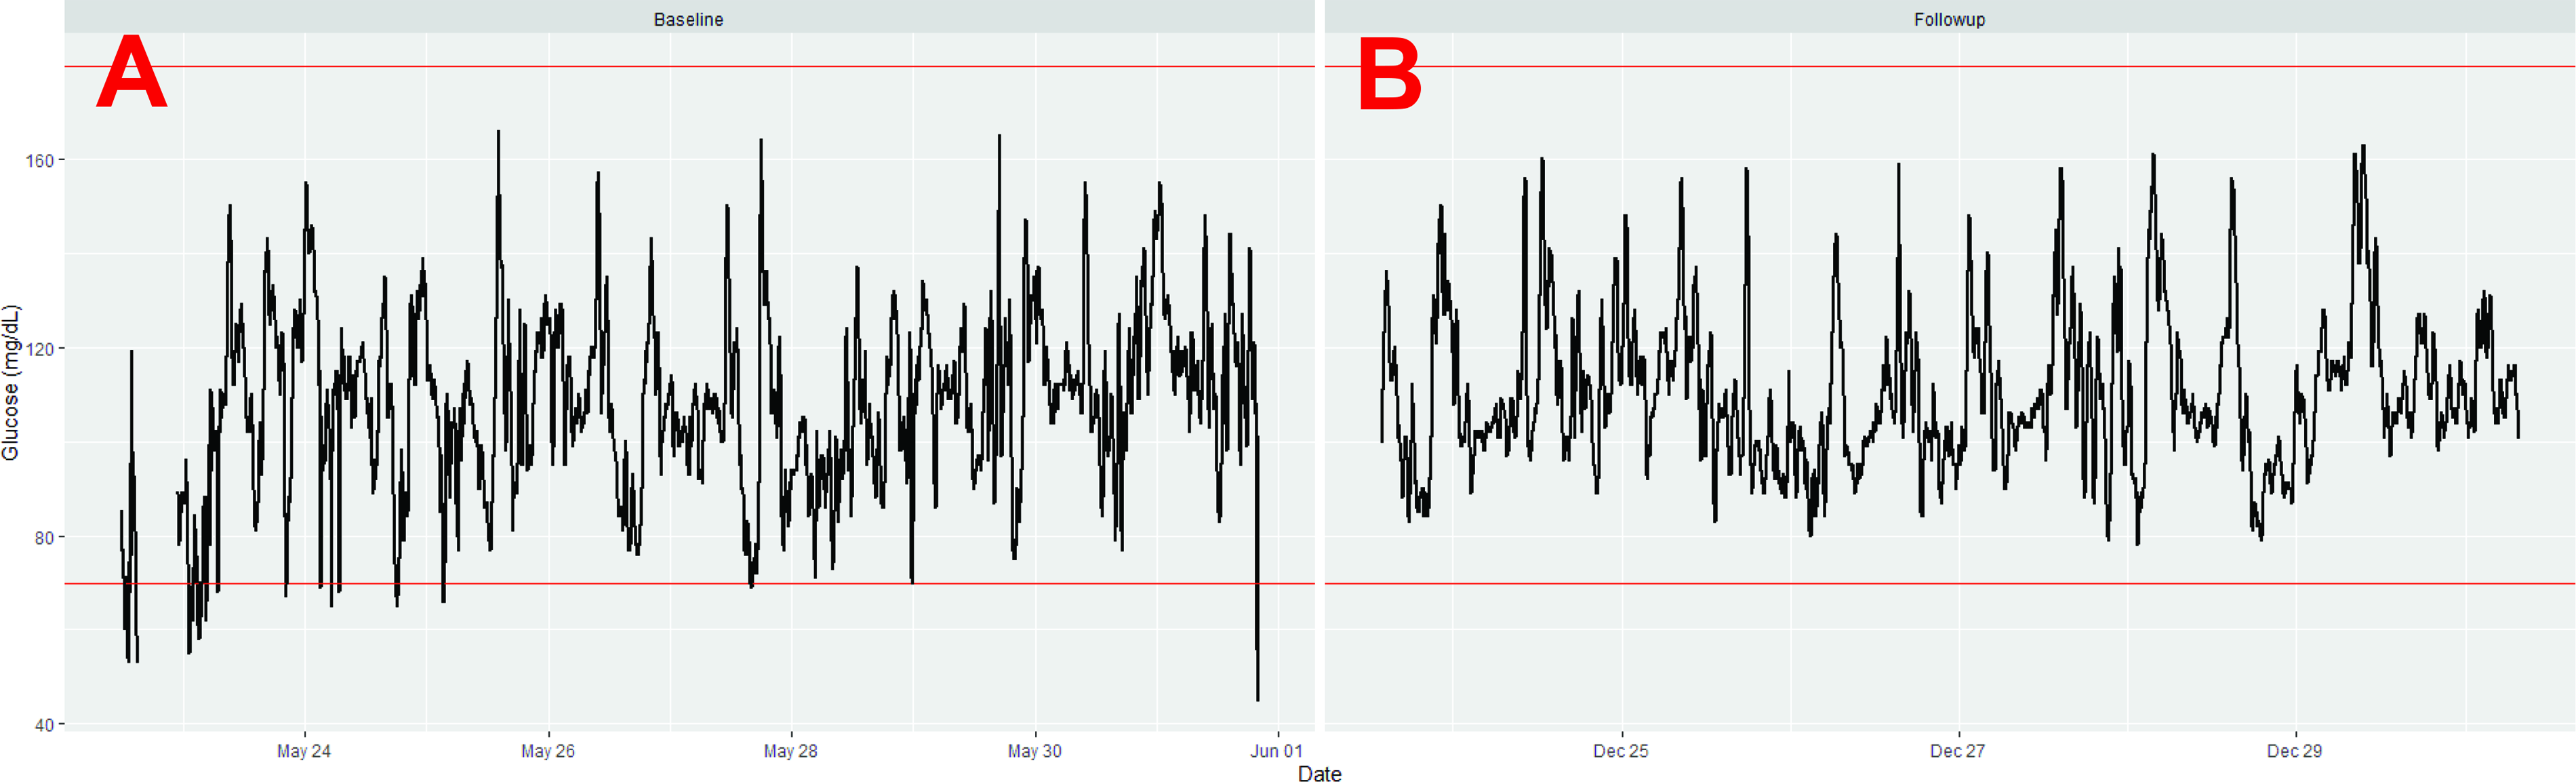
CGM metrics at baseline and follow-up are listed in Table 2. Participants wore CGM for a mean ± SD of 11.1 ± 4.8 days at baseline and 9.0 ± 4.8 days at follow-up. At baseline and 6-month follow-up, mean ± SD HbA1c was 5.8 ± 0.2% (40 ± 2 mmol/mol) and 5.8 ± 0.3% (40 ± 3 mmol/mol), and GMI was 5.8 ± 0.2% (40 ± 2 mmol/mol) and 5.7 ± 0.3% (39 ± 3 mmol/mol), with no significant difference between HbA1c and GMI between baseline and 6-month visits (paired t-tests: P = 0.683 and P = 0.788, respectively). Glycemic variability metrics were not different between 0 and 6 months: MAGE (34.5 ± 11.9 vs. 33.1 ± 6.2 mg/dL), glucose SD (14.7 ± 4.4 vs. 14.2 ± 3.3 mg/dL), and CV (14.1 ± 3.1 vs. 14.0 ± 3.6%). Mean time in range was high at both visits (98.7 ± 1.9% vs. 96.0 ± 7.1%). Time above 140, 180, and 200 mg/dL was < 5%, as was time below 70 and 60 mg/dL. Mean glucose (104.0 ± 9.4 vs. 101.6 ± 11.1 mg/dL), maximum glucose (167.7 ± 28.2 vs. 154.0 ± 17.5 mg/dL), and mean 7 a.m. glucose (101.0 ± 8.8 vs. 98.2 ± 12.2 mg/dL) were comparable between visits, although maximum glucose decreased over time (paired t-test, P = 0.017). No other CGM metrics changed significantly from baseline to follow-up. An example of a typical participant’s CGM tracing at baseline (HbA1c = 5.9% [41 mmol/mol]) and follow-up (HbA1c = 6.3% [45 mmol/mol]) is representative in Figure 2.
CGM Metrics at Baseline and Follow-Up
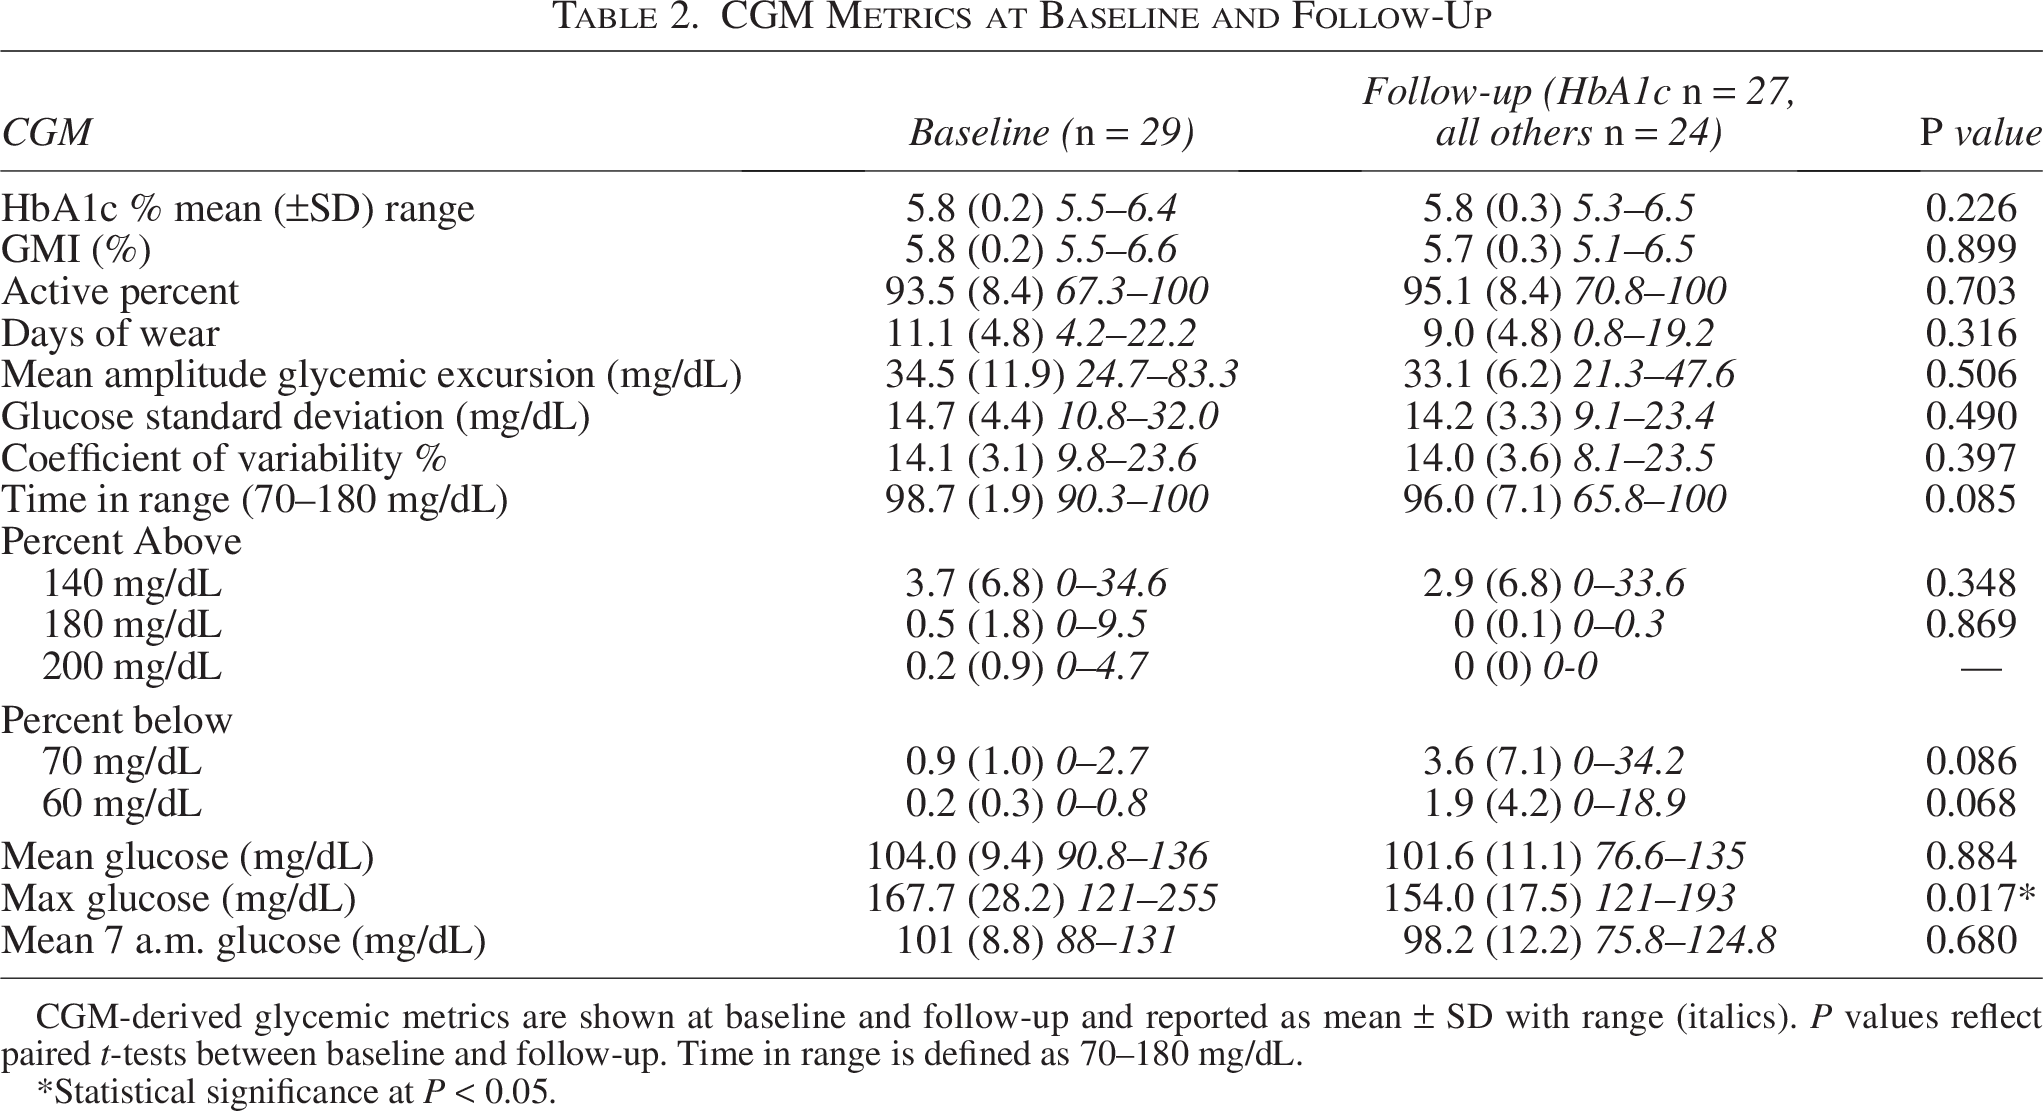
CGM-derived glycemic metrics are shown at baseline and follow-up and reported as mean ± SD with range (italics). P values reflect paired t-tests between baseline and follow-up. Time in range is defined as 70–180 mg/dL.
*Statistical significance at P < 0.05.
CGM baseline
In univariable linear regression analyses, multiple baseline CGM metrics were associated with 6-month follow-up HbA1c (Table 3), including GMI, MAGE, mean glucose, TIR, percent above 140, 180, and 200, mean 7 a.m. glucose, and baseline HbA1c (all P < 0.05). Similarly, several baseline CGM metrics were associated with 6-month change in HbA1c (Table 3), including GMI, MAGE, glucose SD, mean glucose, TIR, and percent of time spent above 140, 180, and 200 mg/dL (all P < 0.05).
Univariable Associations Between Baseline CGM Metrics and HbA1c Outcomes
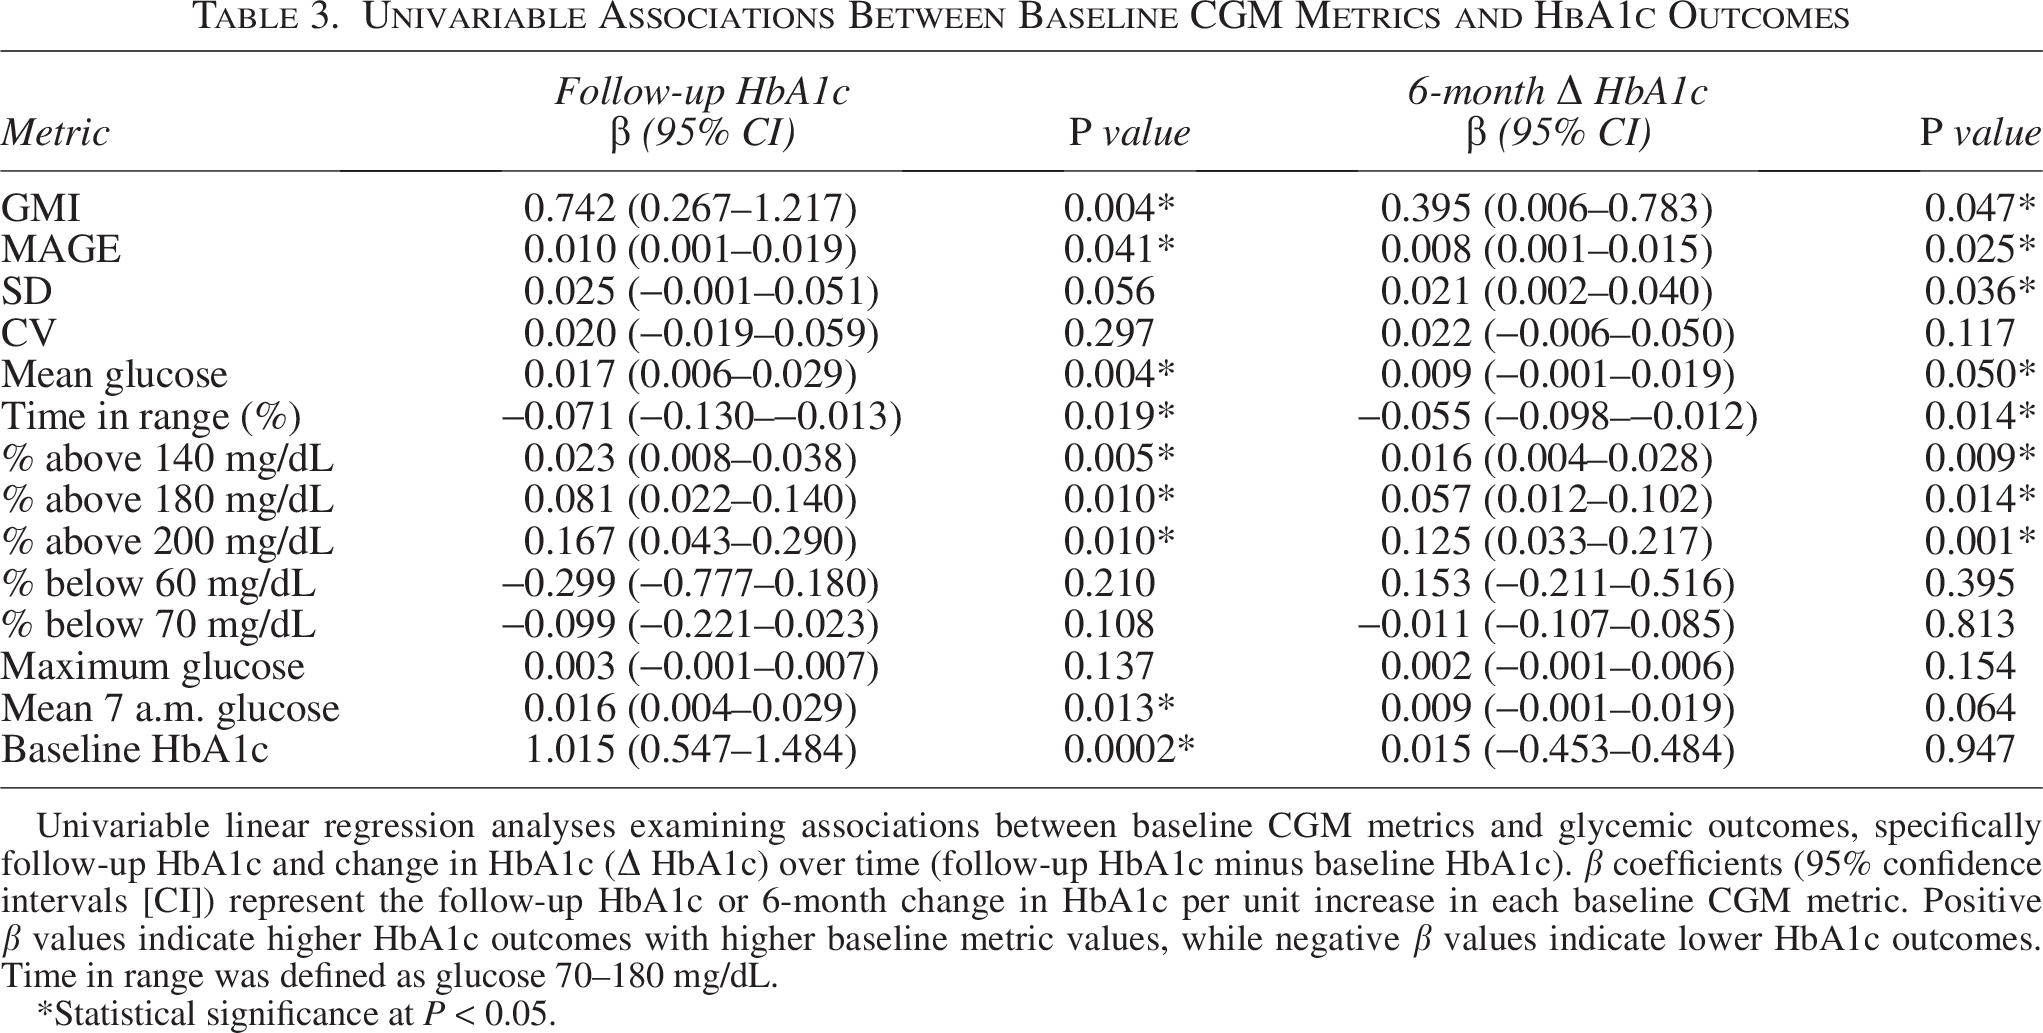
Univariable linear regression analyses examining associations between baseline CGM metrics and glycemic outcomes, specifically follow-up HbA1c and change in HbA1c (Δ HbA1c) over time (follow-up HbA1c minus baseline HbA1c). β coefficients (95% confidence intervals [CI]) represent the follow-up HbA1c or 6-month change in HbA1c per unit increase in each baseline CGM metric. Positive β values indicate higher HbA1c outcomes with higher baseline metric values, while negative β values indicate lower HbA1c outcomes. Time in range was defined as glucose 70–180 mg/dL.
*Statistical significance at P < 0.05.
Given substantial collinearity among CGM metrics, PRESS-based forward selection was used to best identify predictors with independent predictive value. For the outcome of follow-up HbA1c, baseline HbA1c, time spent above 140 mg/dL, maximum glucose, and time spent below 60 and 70 mg/dL were retained in the final model. In this model, baseline HbA1c, percent of time spent above 140 mg/dL, and percent of time spent below 60 mg/dL remained associated with follow-up HbA1c (β = 1.035, 0.033, and 0.628, respectively; all P < 0.05). For the outcome of 6-month HbA1c change, time spent above 140 mg/dL and maximum glucose were retained in the final model; however, only the percent of time spent above 140 mg/dL remained associated with HbA1c change in this model (β = 0.032, P = 0.007). Demographic variables, including age, sex, race, and BMI z-score, were not retained during model selection for either outcome. Further, race, sex, age, and BMI z-score were not independently associated with either 6-month follow-up HbA1c or change in HbA1c over time. Although female sex, higher BMI z-score, and non-White race demonstrated positive trends toward higher HbA1c, these associations did not reach statistical significance.
Conclusions
In this longitudinal observational cohort study, we characterized CGM metrics in youth with prediabetes and evaluated their ability to predict short-term glycemic progression. Overall, CGM metrics in youth with prediabetes remained relatively stable over a 6-month follow-up period, despite some heterogeneity in individual glycemic trajectories. Notably, nearly one-third (32%) of participants with baseline HbA1c in the prediabetes range regressed to normal HbA1c criteria at follow-up, consistent with prior literature demonstrating a large proportion of youth with prediabetes revert to normal glucose tolerance over time.1,2,12,21 This finding highlights the dynamic nature of dysglycemia in adolescents and underscores the limitations of why relying on a single timepoint HbA1c in isolation to poorly predict risk to develop diabetes. Importantly, CGM measures identified the individual at highest risk for progression who was not clearly distinguished by baseline HbA1c alone. The participant who appeared to progress toward type 2 diabetes (although confirmatory HbA1c was lacking) had the highest CGM metrics, despite a baseline HbA1c of 6.0% [42 mmol/mol], reinforcing the concept that HbA1c may underestimate dysglycemia in youth. This aligns with prior pediatric studies suggesting reduced sensitivity of HbA1c in detecting early abnormalities in dysglycemia and beta-cell dysfunction. 7
Across our cohort, multiple CGM metrics were associated with both outcomes of follow-up HbA1c and worsening HbA1c over time. Although several CGM metrics were associated with follow-up HbA1c and HbA1c change in univariable analyses, cross-validated model selection refined these associations. Specifically, for the outcome of follow-up HbA1c, greater time spent above 140 mg/dL and greater time spent below 60 mg/dL remained independently associated with higher follow-up HbA1c. In practical terms, greater cumulative exposure to mildly elevated glucose was clinically meaningful; each 10% increase in time spent above 140 mg/dL, equivalent to roughly 2.4 additional hours per day over the CGM wear period, was associated with an approximately 0.3% higher follow-up HbA1c.
While greater glycemic exposure is an expected predictor of higher HbA1c, the association with hypoglycemia appears counterintuitive and should be interpreted cautiously, particularly given the absence of confirmatory fingerstick or serum glucose measurements. In this cohort, time spent below 60 mg/dL may reflect underlying glycemic instability. Recurrent low glucose excursions may signal dysregulated insulin secretion, with recurrent low glucose excursions serving as a marker of dysregulated glucose homeostasis. Consistent with this interpretation, multiple measures of glycemic variability and sustained higher glucose levels were also associated with HbA1c, suggesting that hypoglycemia may serve as a marker of broader glucose dysregulation.
In contrast, when examining the outcome of change in HbA1c over 6 months, time spent above 140 mg/dL was the only CGM metric that remained associated with subsequent HbA1c worsening/progression, whereas other CGM metrics did not improve model performance. Consistent with prior studies demonstrating reduced time spent in target glucose ranges (70–140 mg/dL) among youth with prediabetes compared with those with normal glucose tolerance, our findings extend this work by demonstrating that, within a prediabetes cohort, sustained time spent above 140 mg/dL predicts subsequent short-term glycemic worsening. 15 Similar to above, for this outcome, each 10% absolute increase in time spent above 140 mg/dL, equivalent to roughly 2.4 additional hours per day over the CGM wear period, was associated with an approximately 0.3% increase in HbA1c over 6 months, underscoring the short-term clinical relevance of sustained hyperglycemia in this population. Notably, this threshold aligns with established clinical benchmarks, as glucose levels below 140 mg/dL confer minimal microvascular risk, particularly for retinopathy, and define the conventional 2-h cutoff for impaired glucose tolerance.17,18
Interestingly, while baseline HbA1c strongly predicted HbA1c at follow-up, it did not predict worsening glycemia over time. The finding that baseline HbA1c predicted follow-up HbA1c but not change in HbA1c highlights an important distinction between glycemic level and glycemic trajectory. HbA1c appears to reflect stable glycemia over short intervals, whereas progression over time likely depends on other factors not captured by a single baseline HbA1c measurement. This supports the added value of CGM metrics that capture ongoing glycemic exposure and variability. These findings also suggest that CGM captures early features of dysglycemia, such as postprandial higher glucoses and glycemic excursions, that may precede sustained elevations in HbA1c.
Demographic variables, including age, sex, race, and BMI z-score, were not independently associated with follow-up HbA1c or HbA1c change and were not retained during model selection, further supporting the concept that CGM-derived measures of glycemic exposure may better reflect short-term risk of HbA1c worsening than baseline demographic characteristics. Although this contrasts with established epidemiological data showing higher rates of youth-onset type 2 diabetes among Black youth and female youth,22,23 the lack of statistically significant associations in our cohort may reflect limited sample size and short follow-up duration, as our study was not powered to detect these subgroup differences. Importantly, our observed trends were consistent with known disparities (higher BMI z-score, female sex, and Black race trended toward worse HbA1c), though not statistically significant.
This study has several strengths. To our knowledge, it is the first longitudinal study to characterize CGM metrics in youth with prediabetes, evaluate their change over time, and assess their predictive value for glycemic progression. The use of detailed CGM data allowed for the assessment of many CGM metrics to explore glycemic variability and hyperglycemic exposure. This study also has limitations to consider. The sample size was modest, with a low proportion of male participants, limiting generalizability and power to detect subgroup differences. Most participants were Tanner stage V, making it challenging to assess the impact of pubertal stage on glycemic progression. The follow-up period was relatively short, and one participant with presumed progression to type 2 diabetes was lost to follow-up. Additionally, HbA1c was used as the primary outcome measure; while clinically relevant, it may inadequately reflect early beta-cell dysfunction in youth. Future studies incorporating oral glucose tolerance testing as a marker of beta-cell dysfunction may provide better insights. Finally, CGM was unblinded, which may have influenced participant behavior, as some individuals may have modified their diet or physical activity in response to glucose values, while others may not have paid attention to the data, potentially introducing differential behavioral effects.
In summary, CGM metrics were superior to HbA1c in predicting short-term glycemic progression in youth with prediabetes. These findings suggest that CGM may serve as a valuable adjunctive tool for identifying high-risk individuals and informing monitoring strategies during this critical window for intervention. Larger studies with longer follow-up and more concrete clinical outcomes, including progression to type 2 diabetes, are needed to better define the role of CGM in pediatric prediabetes management.
Footnotes
Acknowledgment
The authors thank Katherine Bowers, PhD, for assistance with statistical questions and analytic considerations.
Authors’ Contributions
N.S., N.A.C., and A.S.S. were involved in the conception and design of the study. N.S. was involved in result collection and analysis and initial article draft. N.S., N.A.C., R.K., and A.S.S. were involved in the conduction of the study, result interpretation, and article draft review. All authors edited, reviewed, and approved the final version of the article.
Ethical Considerations
This study received ethical approval from the Cincinnati Children’s Hospital Medical Center IRB (approval #2023-0135) on May 17, 2023.
Consent to Participate
All participants and legal guardians provided written informed assent/consent prior to enrollment in the study.
Data Availability
The datasets generated during and/or analyzed during the current study are available from the corresponding author on request.
Author Disclosure Statement
The authors declared no potential conflicts of interest with respect to the research, authorship, and/or publication of this article.
Funding Information
This study was supported by funding from the 2023