
Abstract

The adoption of the coefficient of variation (%CV) and the ambulatory glucose profile (AGP) as consensus measures of glycemic variability (GV) represented a major advance in diabetes care. These parameters identify individuals at heightened risk of hypoglycemia and are associated with micro- and macrovascular complications. 1 However, they are often treated as synonymous with GV itself, when in fact they capture only one dimension: the dispersion of glucose values around the mean, irrespective of temporal order.
A second, equally important component of GV is the temporal dimension—volatility: how frequently and rapidly glucose levels change. Emerging evidence shows that volatility is clinically significant. Rapid glucose fluctuations, distinct from dispersion, are linked to acute hypoglycemia-like symptoms during normoglycemia, 2 intensive care mortality, 3 future severe hypoglycemia, 4 and long-term diabetes progression. 5 Various measures have been proposed to capture this temporal aspect, including the recently introduced time with rapid change (TRC) 6 and earlier metrics such as Mean-Absolute Glucose change (MAG) and Continuous Overlapping Net Glycaemic Action (CONGA).7–9 These temporal metrics are highly correlated, 10 and so any single metric can effectively reflect volatility. However, none have transitioned into routine clinical reporting, where consensus interpretation of GV relies exclusively on dispersion-based metrics like %CV and the AGP. This letter aims to: (1) visually illustrate how consensus reports obscure volatility, (2) present an AGP-analogous visual summary for volatility, and (3) explicitly frame GV along two distinct axes: dispersion and volatility.
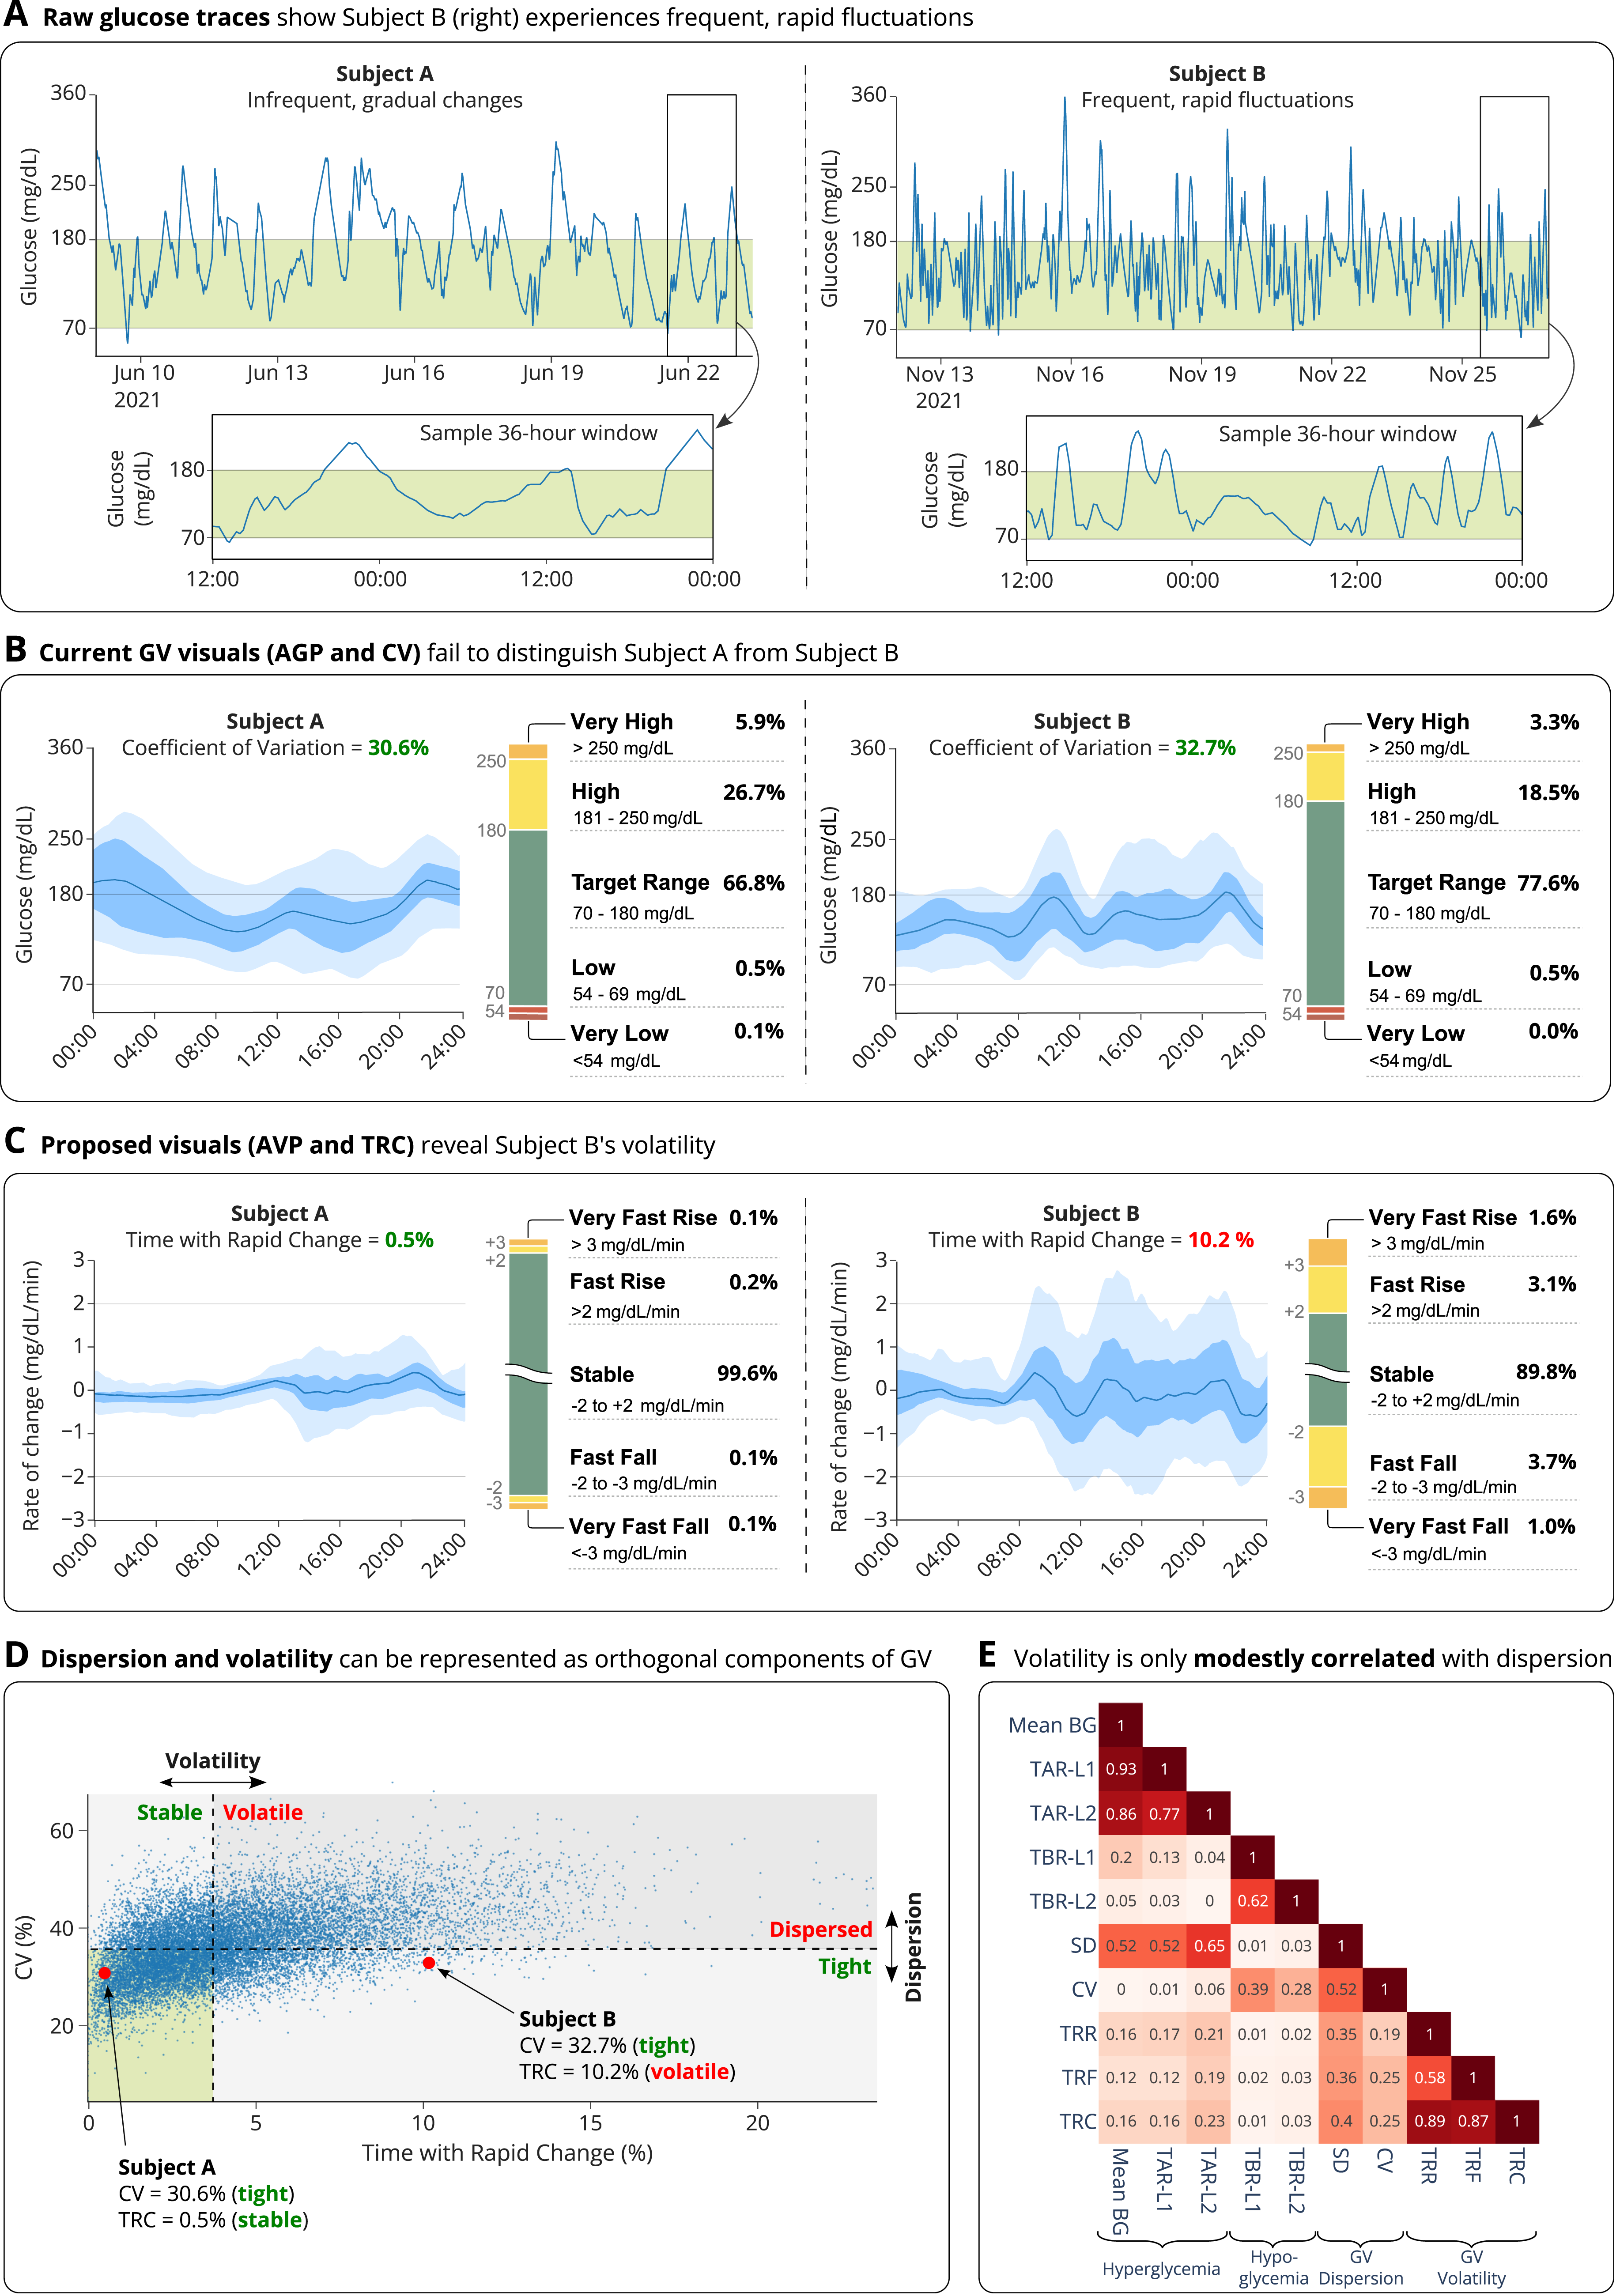
The limited visibility of volatility in standard reports is illustrated in Figure 1, which compares two 14-day continuous glucose monitoring (CGM) traces from individuals with type 1 diabetes in the T1DiabetesGranada dataset 11 (see Supplementary Data for data processing methodology). Visual inspection of the raw traces (Panel A) immediately conveys a clinical distinction: Subject A exhibits infrequent, gradual excursions, whereas Subject B shows frequent and rapid fluctuations. Intuitively, Subject B’s control is far more volatile. However, standard metrics (Panel B) do not reflect this. With nearly identical %CV values (30.6% vs. 32.7%) and visually similar AGP plots, both appear to have equivalent and satisfactory control. The metrics correctly report similar glucose dispersion but do not adequately convey the starkly different glucose volatilities.
Glycemic variability comprises two dimensions (dispersion and volatility) the latter of which is not captured by standard CV and AGP metrics.
To illustrate this hidden dimension, I present two complementary visualizations (Fig. 1, Panel C). First, the Ambulatory Volatility Profile (AVP), analogous to the standard AGP, plots the distribution (median, IQR, and 95% range) of glucose rate of change (RoC) throughout the day. This highlights periods of routine rapid rises or falls that are otherwise invisible in standard AGPs. Second, the TRC stacked bar chart, mirrors the familiar Time in Range chart but quantifies the proportion of time spent with rapid glucose changes over 15-min windows: rapid rise (>2 mg/dL/min), very rapid rise (>3 mg/dL/min), rapid fall (<−2 mg/dL/min), and very rapid fall (<−3 mg/dL/min). This visual extension of the TRC metric provides an intuitive signature of volatility, conveying both the direction and intensity of rapid changes, as seen in Subject B’s prominent yellow and orange segments. The proposed thresholds (±2 and ±3 mg/dL/min) approximate the 1–99th and 0.1–99.9th percentiles of glucose RoC in nondiabetic individuals, 12 and thus represent changes rarely observed in normal physiology, though further work is needed to quantify their clinical significance. Together, these tools make the dynamic dimension of GV visible and quantifiable, and their alignment with established AGP and Time in Range formats facilitates familiarity and ease of adoption by clinicians and patients.
I further suggest refining terminology to reflect the two principal axes of GV (Fig. 1, Panel D). Dispersion (the spread of values, measured by %CV) can be described as Tight (low) or Dispersed (high), while Volatility (the rates of change, reflected by TRC) can be described as Stable (low) or Volatile (high). This yields a simple 2 × 2 taxonomy distinguishing, for instance, a Tight–Volatile glycemic phenotype (small but rapid swings) from a Dispersed–Stable one (slow, wide excursions). This framework highlights potential therapeutic trade-offs. For example, over-bolusing insulin may reliably mitigate upward drift and thereby limit dispersion, but at the expense of inducing rapid glucose declines that increase volatility.
The distinction between Subjects A and B is representative, not exceptional. Across the n = 15,704 14-day glucose traces in the T1DiabetesGranada dataset, dispersion (CV) and volatility (TRC, >±2 mg/dL/min) showed only a modest association (Pearson R2 = 0.25, Fig. 1 Panel E). Notably, nearly one-third (32.7%) of individuals meeting the consensus definition of “low GV” (CV < 36%) still exhibited above-median TRC (Fig. 1, Panel D), indicating that low dispersion does not imply stable glucose dynamics. A similar pattern was observed in a type 2 diabetes cohort (Supplementary Fig. S1), supporting the generality of this finding. Importantly, low CV should not be equated with overall stability when volatility is high. Misclassifying “tight-volatile” phenotypes as “stable” risks overlooking the need for targeted intervention, as highlighted by a recent illustrative case. 13 More broadly, these findings support adopting a parsimonious, nonredundant set of CGM metrics. This should include at least one dispersion metric (e.g., the consensus %CV) and one volatility metric. I recommend TRC, as its structural similarity to time below and above range facilitates easy clinical adoption and visualization.
In conclusion, dispersion-based metrics such as CV have advanced diabetes care but represent only one axis of GV. Adopting terminology that distinguishes dispersion (tight/dispersed) from volatility (stable/volatile) and integrating visualizations such as the Ambulatory Volatility Profile could help align future treatment goals across both axes of variability, promoting therapy that achieves not only tight but also stable glycemic control.
Author’s Contributions
R.R. performed all aspects of the study, including design, analysis, and article preparation. R.R. is the guarantor of this work and, as such, had full access to all the data in the study and takes responsibility for the integrity of the data and the accuracy of the data analysis.
Footnotes
Author Disclosure Statement
No competing financial interests exist.
Funding Information
This research received no specific grant from any funding agency in the public, commercial or not-for-profit sectors.
Supplemental Material
References
Supplementary Material
Please find the following supplemental material available below.
For Open Access articles published under a Creative Commons License, all supplemental material carries the same license as the article it is associated with.
For non-Open Access articles published, all supplemental material carries a non-exclusive license, and permission requests for re-use of supplemental material or any part of supplemental material shall be sent directly to the copyright owner as specified in the copyright notice associated with the article.