
Abstract
Introduction and Objective:
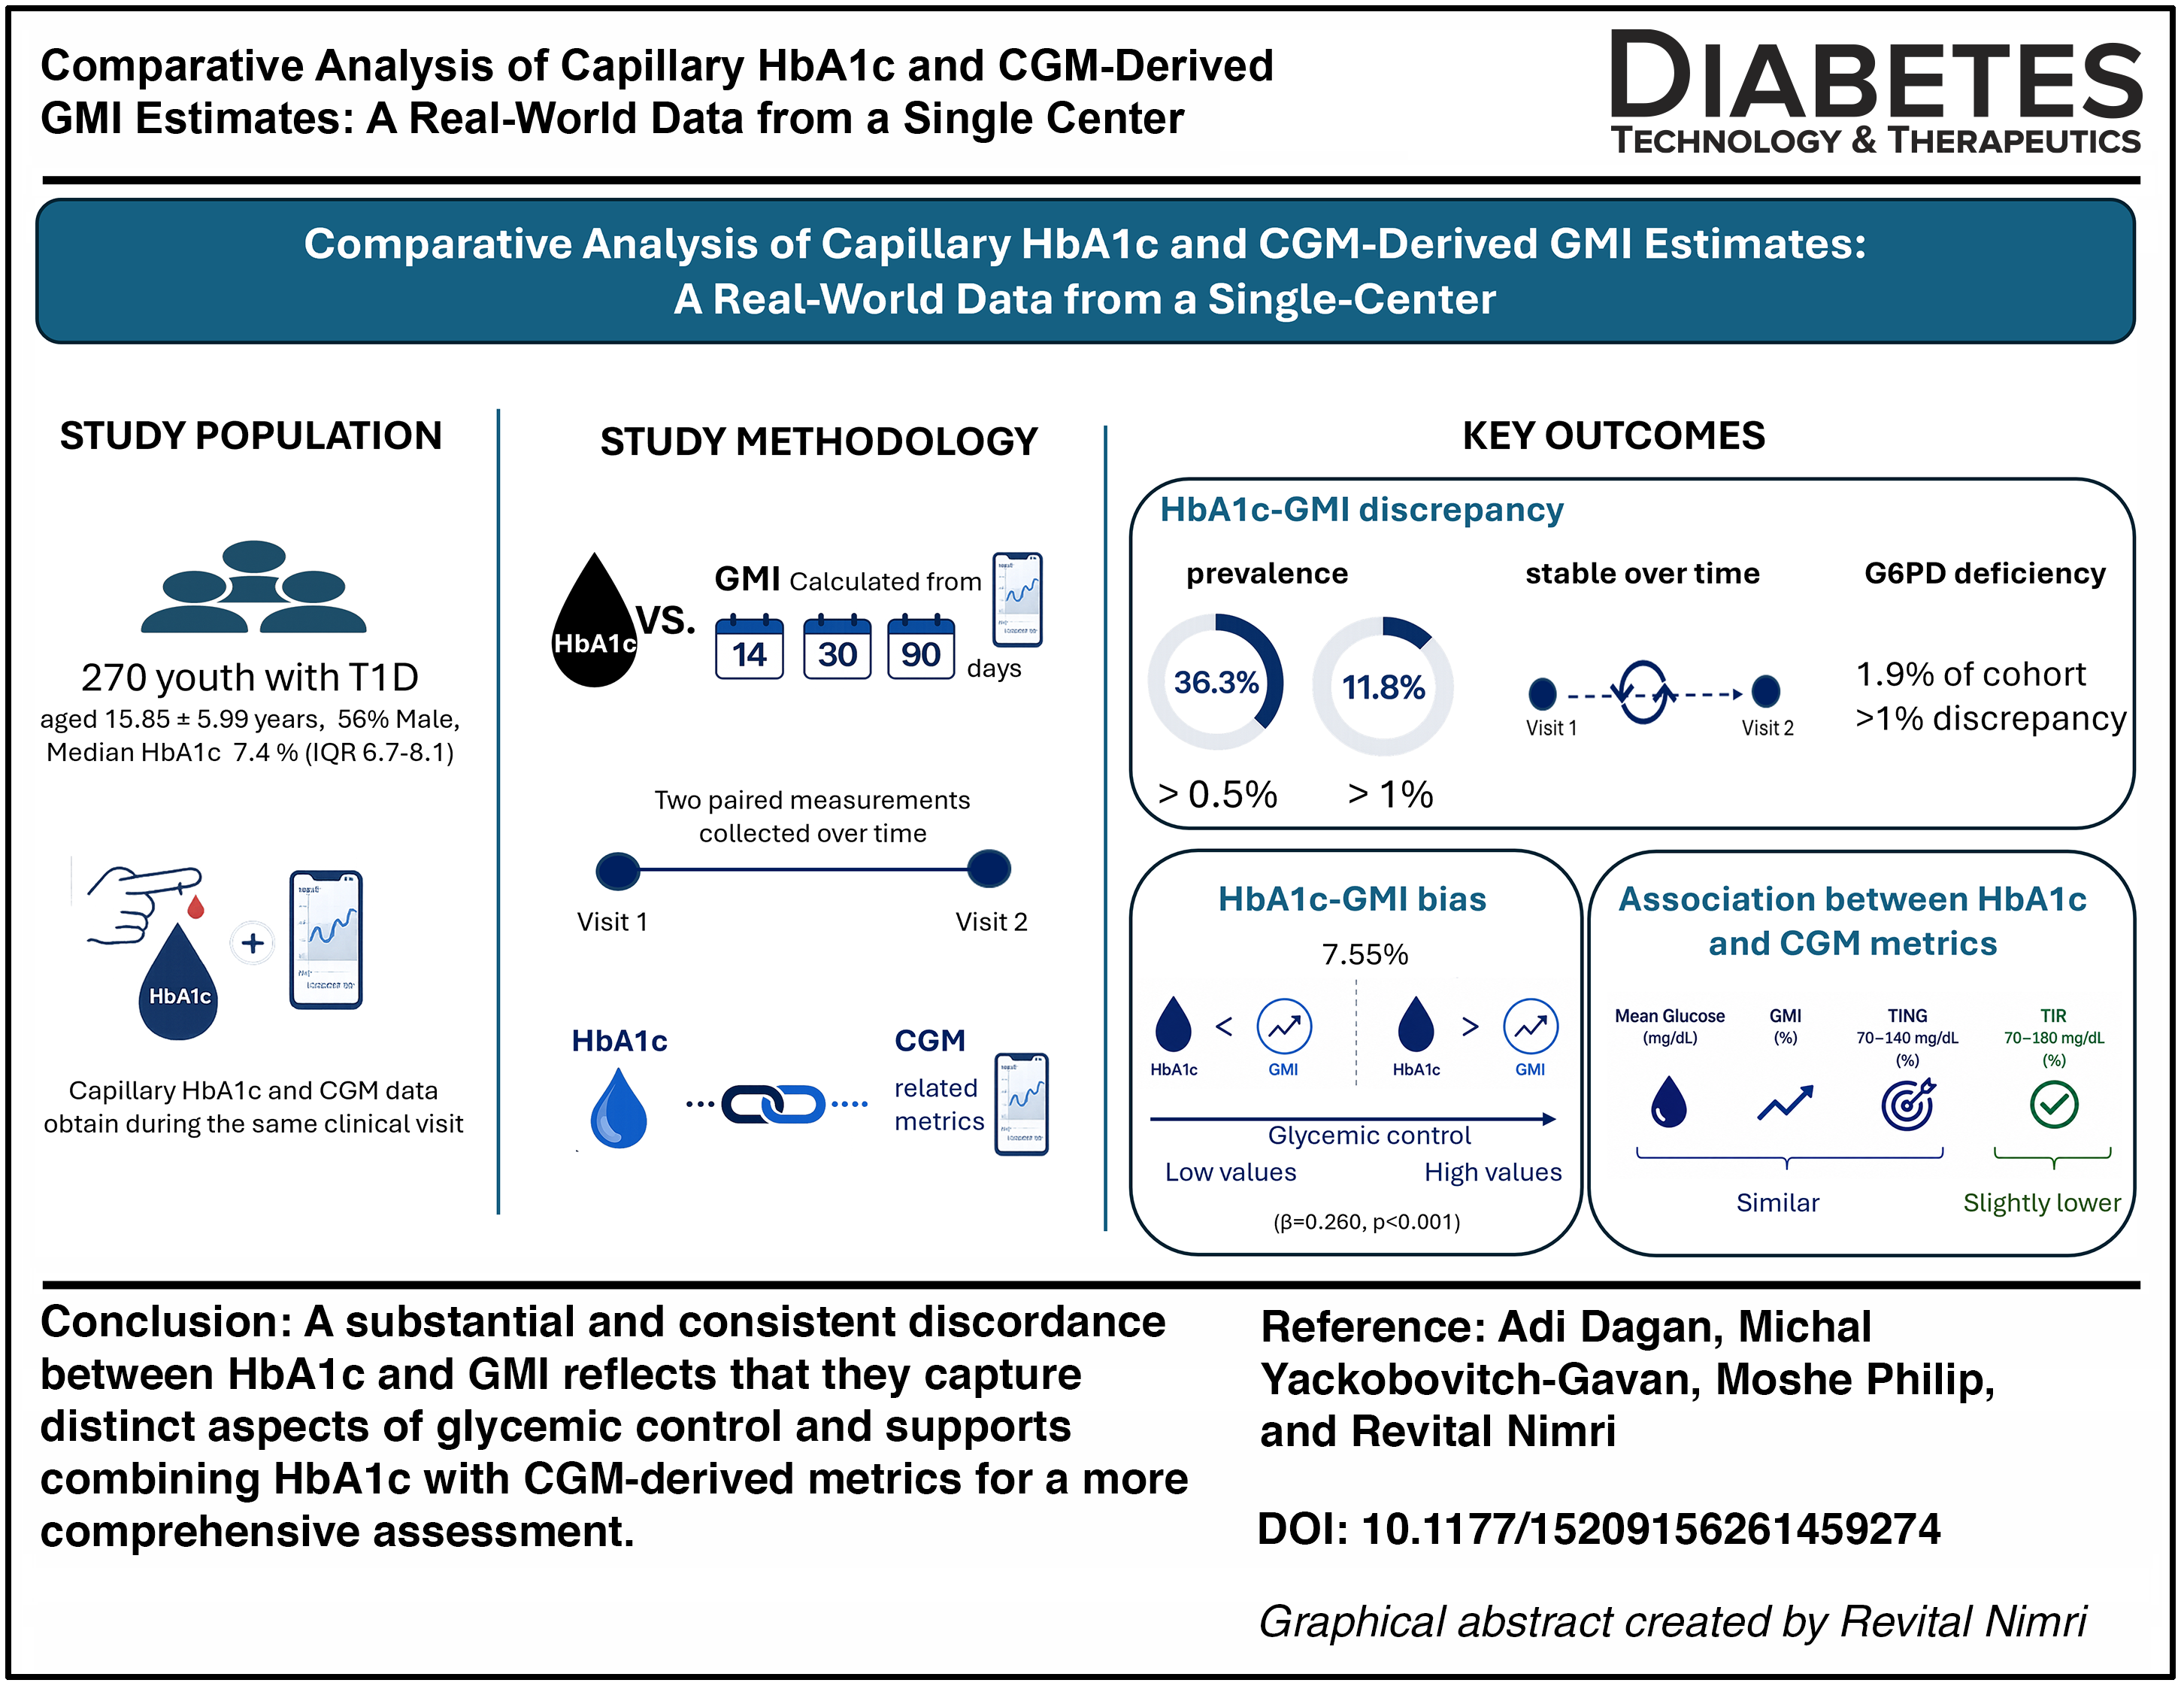
Understanding the relationship between hemoglobin A1c (HbA1c) and continuous glucose monitoring (CGM)-derived Glucose Management Indicator (GMI) is essential for accurate glycemic assessment. This study evaluates the correlation between paired capillary HbA1c and GMI across different assessment periods and identifies factors associated with significant discrepancies.
Methods:
This retrospective observational study included 270 youth with type 1 diabetes (mean age 15.85 ± 5.99 years, 56% male, median HbA1c 7.4% (interquartile range: 6.7–8.1). Capillary HbA1c and CGM data obtained during the same clinical visit were analyzed to assess discrepancies between measured HbA1c and GMI values, calculated using 14, 30, and 90 days of CGM data. For each individual, two paired measurements were collected over time.
Results:
Across paired measurements, 37.3% of individuals demonstrated a HbA1c–GMI discrepancy greater than 0.5%, while 11.8% exceeding a discrepancy of 1%. Discrepancies showed no significant correlation with age, sex, body mass index, and disease duration. Glucose-6-phosphate dehydrogenase deficiency, present in 1.9% of the cohort, was consistently correlated with discrepancies >1% in all measurements. A significant proportional bias was identified (β = 0.260, P < 0.001), with HbA1c underestimating GMI at lower values and overestimating at higher values. Among CGM metrics, mean glucose, GMI, and time in normal glucose (TING) (70–140 mg/dL) showed similar associations with HbA1c, whereas TIR showed a slightly lower magnitude of association.
Conclusion:
A significant number of participants exhibited discrepancies between HbA1c and GMI. This discrepancy was unrelated to CGM sampling duration and stable within individuals, suggesting intrinsic factors may contribute. HbA1c and GMI each reflect different aspects of glycemic control, and neither is sufficient alone. Combining HbA1c with CGM-derived metrics, such as TING, may provide a more accurate and comprehensive assessment of glycemic exposure.
Keywords
Introduction
Hemoglobin A1c (HbA1c) is a key metric in the management of type 1 diabetes (T1D), guiding therapeutic decisions and long-term risk evaluation.1–5 Despite its established clinical utility, HbA1c has important limitations. 6 It does not capture glycemic variability or acute glucose excursions 7 and may be unreliable in conditions that alter red blood cell turnover, such as haemoglobinopathies or iron deficiency anemia.8–12
The widespread adoption of continuous glucose monitoring (CGM) has facilitated the routine use of metrics to assess glycemic control.13,14 Among these, the glucose management indicator (GMI) estimates HbA1c from mean CGM glucose. 15 Although designed to complement or replace laboratory HbA1c, accumulating evidence demonstrates frequent and sometimes substantial discrepancies between the two. 16 This discordance has important therapeutic implications, as reliance on a single metric may misrepresent glycemic control. However, its prevalence and persistence in pediatric and young adult populations remain understudied, and the impact of comorbid conditions on HbA1c–GMI discordance is not well characterized.
This study aimed to evaluate the relationship between capillary HbA1c and CGM-derived metrics, including GMI, time in range (TIR), and time in normal glucose (TING), across multiple CGM durations (14, 30, and 90 days) in a real-world cohort of children, adolescents, and young adults with T1D. The objectives were to quantify the prevalence and magnitude of discrepancies between HbA1c and GMI, assess their reproducibility over time, and identify clinical factors associated with discordance. In addition, we examined correlations between HbA1c and other CGM metrics, including TING, to identify the metric most strongly associated with HbA1c.
Methods
Study design and setting
This retrospective study includes individuals with T1D who were cared for by five participating physicians at the Institute for Endocrinology and Diabetes, the National Center for Childhood Diabetes, Schneider Children’s Medical Center of Israel. The study data were retrieved from September 2021 until January 2024. This study was approved by the Institutional Review Board of the Rabin Medical Center, number 0128-23-RMC, and conducted in accordance with the ethical standards of the 1964 Helsinki Declaration and its later amendments.
Study population
Data were collected from 318 individuals with documented diagnosis of T1D aged up to 30 years, who used CGM and pump therapy or multiple daily injections (MDI). Pregnant individuals and those diagnosed with other types of diabetes, such as type 2 diabetes, neonatal, and MODY diabetes, were excluded. The study population included data from individuals cared for by five participating physicians to comprehensively represent the population and determine the prevalence of discrepancy.
Sampling method and study variables
For the evaluation of study outcomes, data were obtained from two primary sources: the individuals’ electronic medical records (Chameleon software) and their diabetes-related devices. Information regarding the demographics and characteristics of the study cohort was retrieved from the individuals’ electronic medical records (Chameleon software). The following data were gathered for all the individuals in the cohort: age, sex, auxological measurements (height and weight), number of years of diagnosis of diabetes, the mode of current treatment (such as pump therapy, MDI, automated insulin delivery [AID] system), and the brand of CGM used. Medical history and comorbid conditions potentially affecting red blood cell lifespan (e.g., hemoglobinopathies, anemia) were collected from medical records for all participants. HbA1c levels were also retrieved, measured routinely at each visit using a point-of-care standardized capillary glycated hemoglobin measurement using DCA 2000+ (Siemens/Bayer, Erlangen, Germany) or DCA Vantage (Siemens Healthineers, Erlangen, Germany) utilizing the same brand of reagents.
Information on CGM and insulin data was collected from the device-related management platform. This included data routinely downloaded from the individuals’ devices, either downloaded at home or during clinic visits. The CGM devices that were in use include Dexcom G6 (Dexcom Inc., San Diego, CA, USA), FreeStyle Libre 2 (Abbott Diabetes Care, Alameda, CA, USA), and Guardian (Medtronic Inc., Northridge, CA, USA). The corresponding software used are Clarity, Libre View, Carelink, and Tidepool.
CGM metrics were extracted from the standard device-generated CGM reports, including ambulatory glucose profile summaries.
Various CGM measurements and metrics were extracted, including sensor coverage, TIR within the range of 70–180 mg/dL, TING 70–140 mg/dL, time above range (TAR) exceeding 180 mg/dL and 250 mg/dL, time below range (TBR) falling below 70 mg/dL and 54 mg/dL, mean CGM glucose levels, and the coefficient of variation (CV%). These CGM measurements were documented for 14, 30, and 90 days from the day of the capillary HbA1c measurement. The primary analysis utilized 14-day CGM data, consistent with established clinical practice.7,14,17 Additional analyses were performed using 30- and 90-day CGM windows. Although the 90-day window is physiologically more aligned with the period reflected by HbA1c, the 14-day window was retained as the primary clinical analysis because it reflects the most commonly used CGM reporting period in routine care.
For each individual, two retrospective capillary measurements were collected from different visits (interval of 5.8 ± 4.0 months), with the estimated HbA1c calculated based on the CGM data using the glucose management indicator formula (GMI). GMI (Percentage) = 3.31 + 0.02392 x (average glucose reading in mg/dL).
Therefore, the study combines cross-sectional analyses with an analysis based on two repeated measurements to explore the relationship between HbA1c and GMI in a population of youth with T1D.
To evaluate the discrepancy between the capillary HbA1c and estimated HbA1c (GMI), the absolute difference between the HbA1c and GMI values was calculated. The results obtained from this calculation were categorized into three levels of discrepancy (mild, acceptable <0.5%, moderate 0.5%–1%, and high >1%).
The data collected for the study were anonymized, and individuals’ confidentiality was maintained throughout the survey. The data were recorded in a Microsoft Excel database.
Statistical analysis
The primary study outcome was the discrepancy between measured capillary HbA1c and GMI levels (discrepancy = HbA1c–GMI). Three discrepancy levels were determined: <0.5%, between 0.5% and 1%, and >1%.
Continuous variables with a normal distribution are presented as mean ± SD, those with a skewed distribution are presented as median and interquartile range (IQR), and categorical variables are reported using numbers and percentages.
Spearman’s correlation analyses were conducted to evaluate the correlations between the discrepancy between HbA1c and GMI (skewed distribution) and different continuous clinical variables. Given the small cell count, Fisher’s exact test was used to examine the differences in categorical data.
The associations between HbA1c and CGM metrics were analyzed using generalized estimating equation (GEE) linear regression models, accounting for repeated measurements (up to two per participant). Participant ID was specified as the clustering variable to account for within-subject correlation, and robust standard errors were estimated. Analyses were restricted to observations with available GMI values. Model fit was assessed using the quasi-likelihood under the independence model criteria (QIC), with lower values indicating better model fit. QIC was used to compare competing GEE models fitted to the same outcome, with differences in QIC interpreted as reflecting relative model adequacy. However, it is important to note that QIC does not provide a formal statistical test of significance between models.
We further analyzed the association between HbA1c and TIRs using a scatter dot plot and adjusted the regression line using univariate linear regression.
Agreement between measured HbA1c and GMI was evaluated using Bland–Altman analysis. For each observation, the difference between HbA1c and GMI was calculated, and the mean of the two measurements was used as the reference value on the horizontal axis. The mean difference (bias) and the standard deviation (SD) of the differences were estimated. The limits of agreement (LoAs) were calculated as the mean difference ±1.96 × SD, representing the range within which 95% of the differences between the two measures are expected to lie. A one-sample t-test was used to evaluate the null hypothesis that the mean of the difference equals zero.
A Bland–Altman plot was constructed by plotting the differences against the mean of the two measurements to visually assess potential proportional bias across the measurement range. Ninety-five percent confidence intervals (CIs) were calculated for the mean difference and for the LoAs. Agreement between HbA1c and GMI was interpreted based on the magnitude of the mean difference and the width of the LoAs. Proportional bias was assessed by linear regression of the difference between HbA1c and GMI on their mean value. A statistically significant slope was interpreted as evidence of proportional bias across the measurement range. The statistical analysis was done using the Statistical Package for the Social Sciences (SPSS) software version 29 for Windows (IBM Corp, New York, NY, USA). All statistical analyses were carried out with two-sided tests, and a significance level of P ≤ 0.05 was considered for all assessments.
Results
Of 318 individuals assessed for eligibility, 48 were excluded due to insufficient or missing CGM data. Therefore, a total of 270 participants were included in the final analysis (Supplementary Fig. S1). Characteristics of the study population are presented in Table 1. The mean age of participants was 15.85 ± 5.99 years, and 56% were male. The median HbA1c was 7.4% (IQR: 6.7–8.1), and TIR (70–180 mg/dL) was 58% (IQR: 42–69). BMI-SDS (body mass index–standard deviation score) was within the normal range. At the time of the study, most participants were treated with insulin pumps (50.7%) or MDI (25.9%), while only 23% were using AID systems, the low proportion of AID users likely contributed to the observed TIR. The majority of individuals (72.2%) had no significant medical history, while the rest had conditions such as celiac disease (8.5%), thyroid disorders (7.4%), and glucose-6-phosphate dehydrogenase (G6PD) deficiency (1.9%).
Demographic Characteristics of the Study Cohort Population (n = 270)
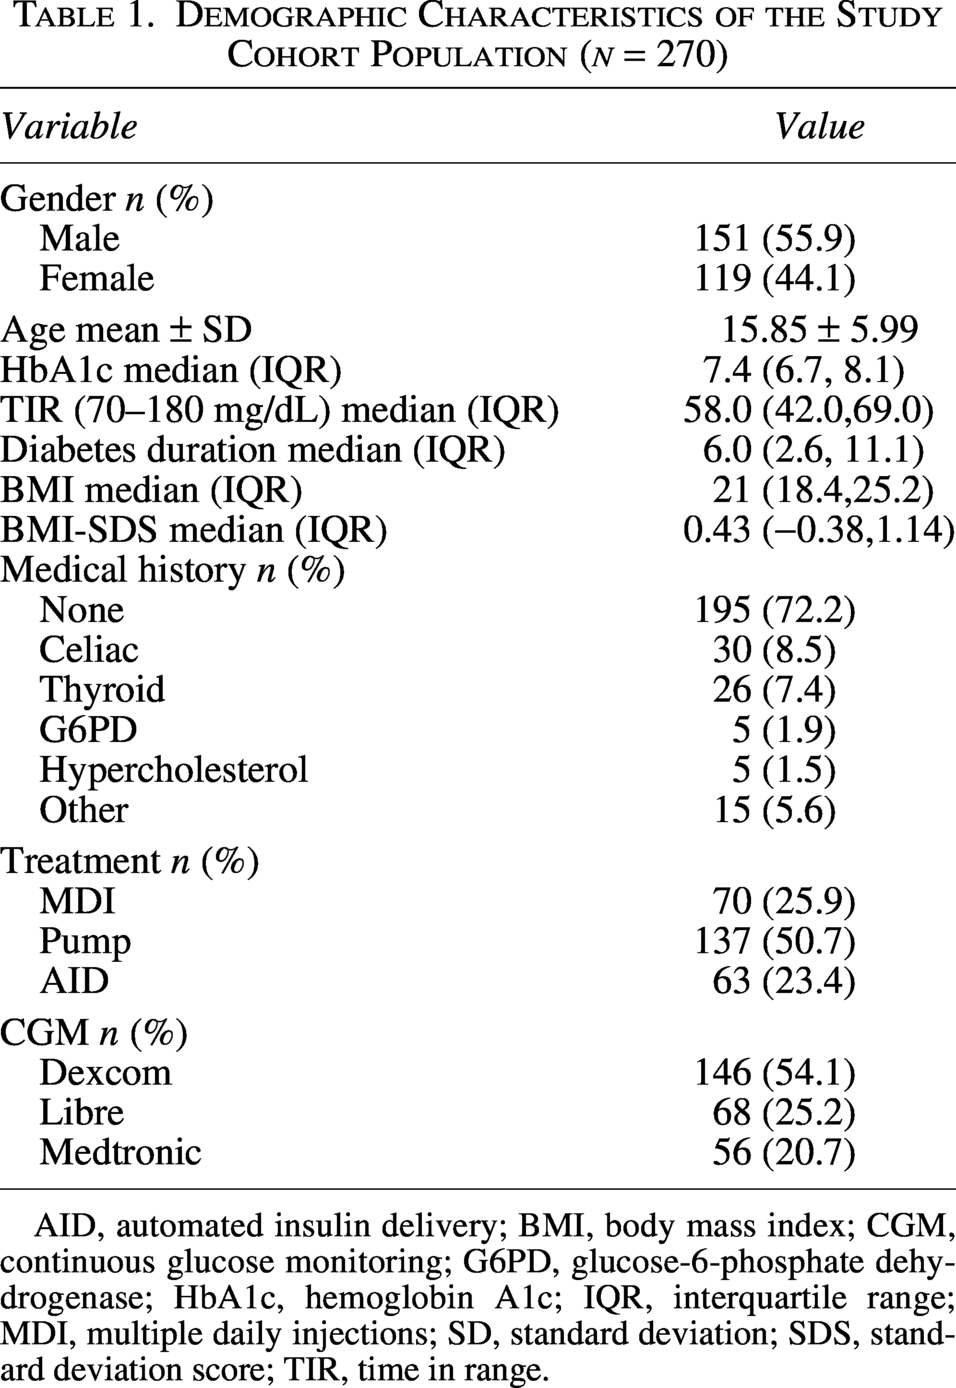
AID, automated insulin delivery; BMI, body mass index; CGM, continuous glucose monitoring; G6PD, glucose-6-phosphate dehydrogenase; HbA1c, hemoglobin A1c; IQR, interquartile range; MDI, multiple daily injections; SD, standard deviation; SDS, standard deviation score; TIR, time in range.
Median (IQR) wear-time was 93% (86, 100), 93% (80, 98), and 87% (56, 98) for the 14-, 30-, and 90-day periods, respectively.
The discrepancy between the measured and estimated HbA1c
An absolute difference >0.5% between capillary HbA1c and GMI was observed in 37.1% (37.5%), 35.3% (35.0%), and 36.5% (31.6%) of participants at the first (and second) measurement using 14-, 30-, and 90-day data, respectively. The distribution of these discrepancies within the cohort is shown in Figure 1 (GMI calculated from 14-day data).
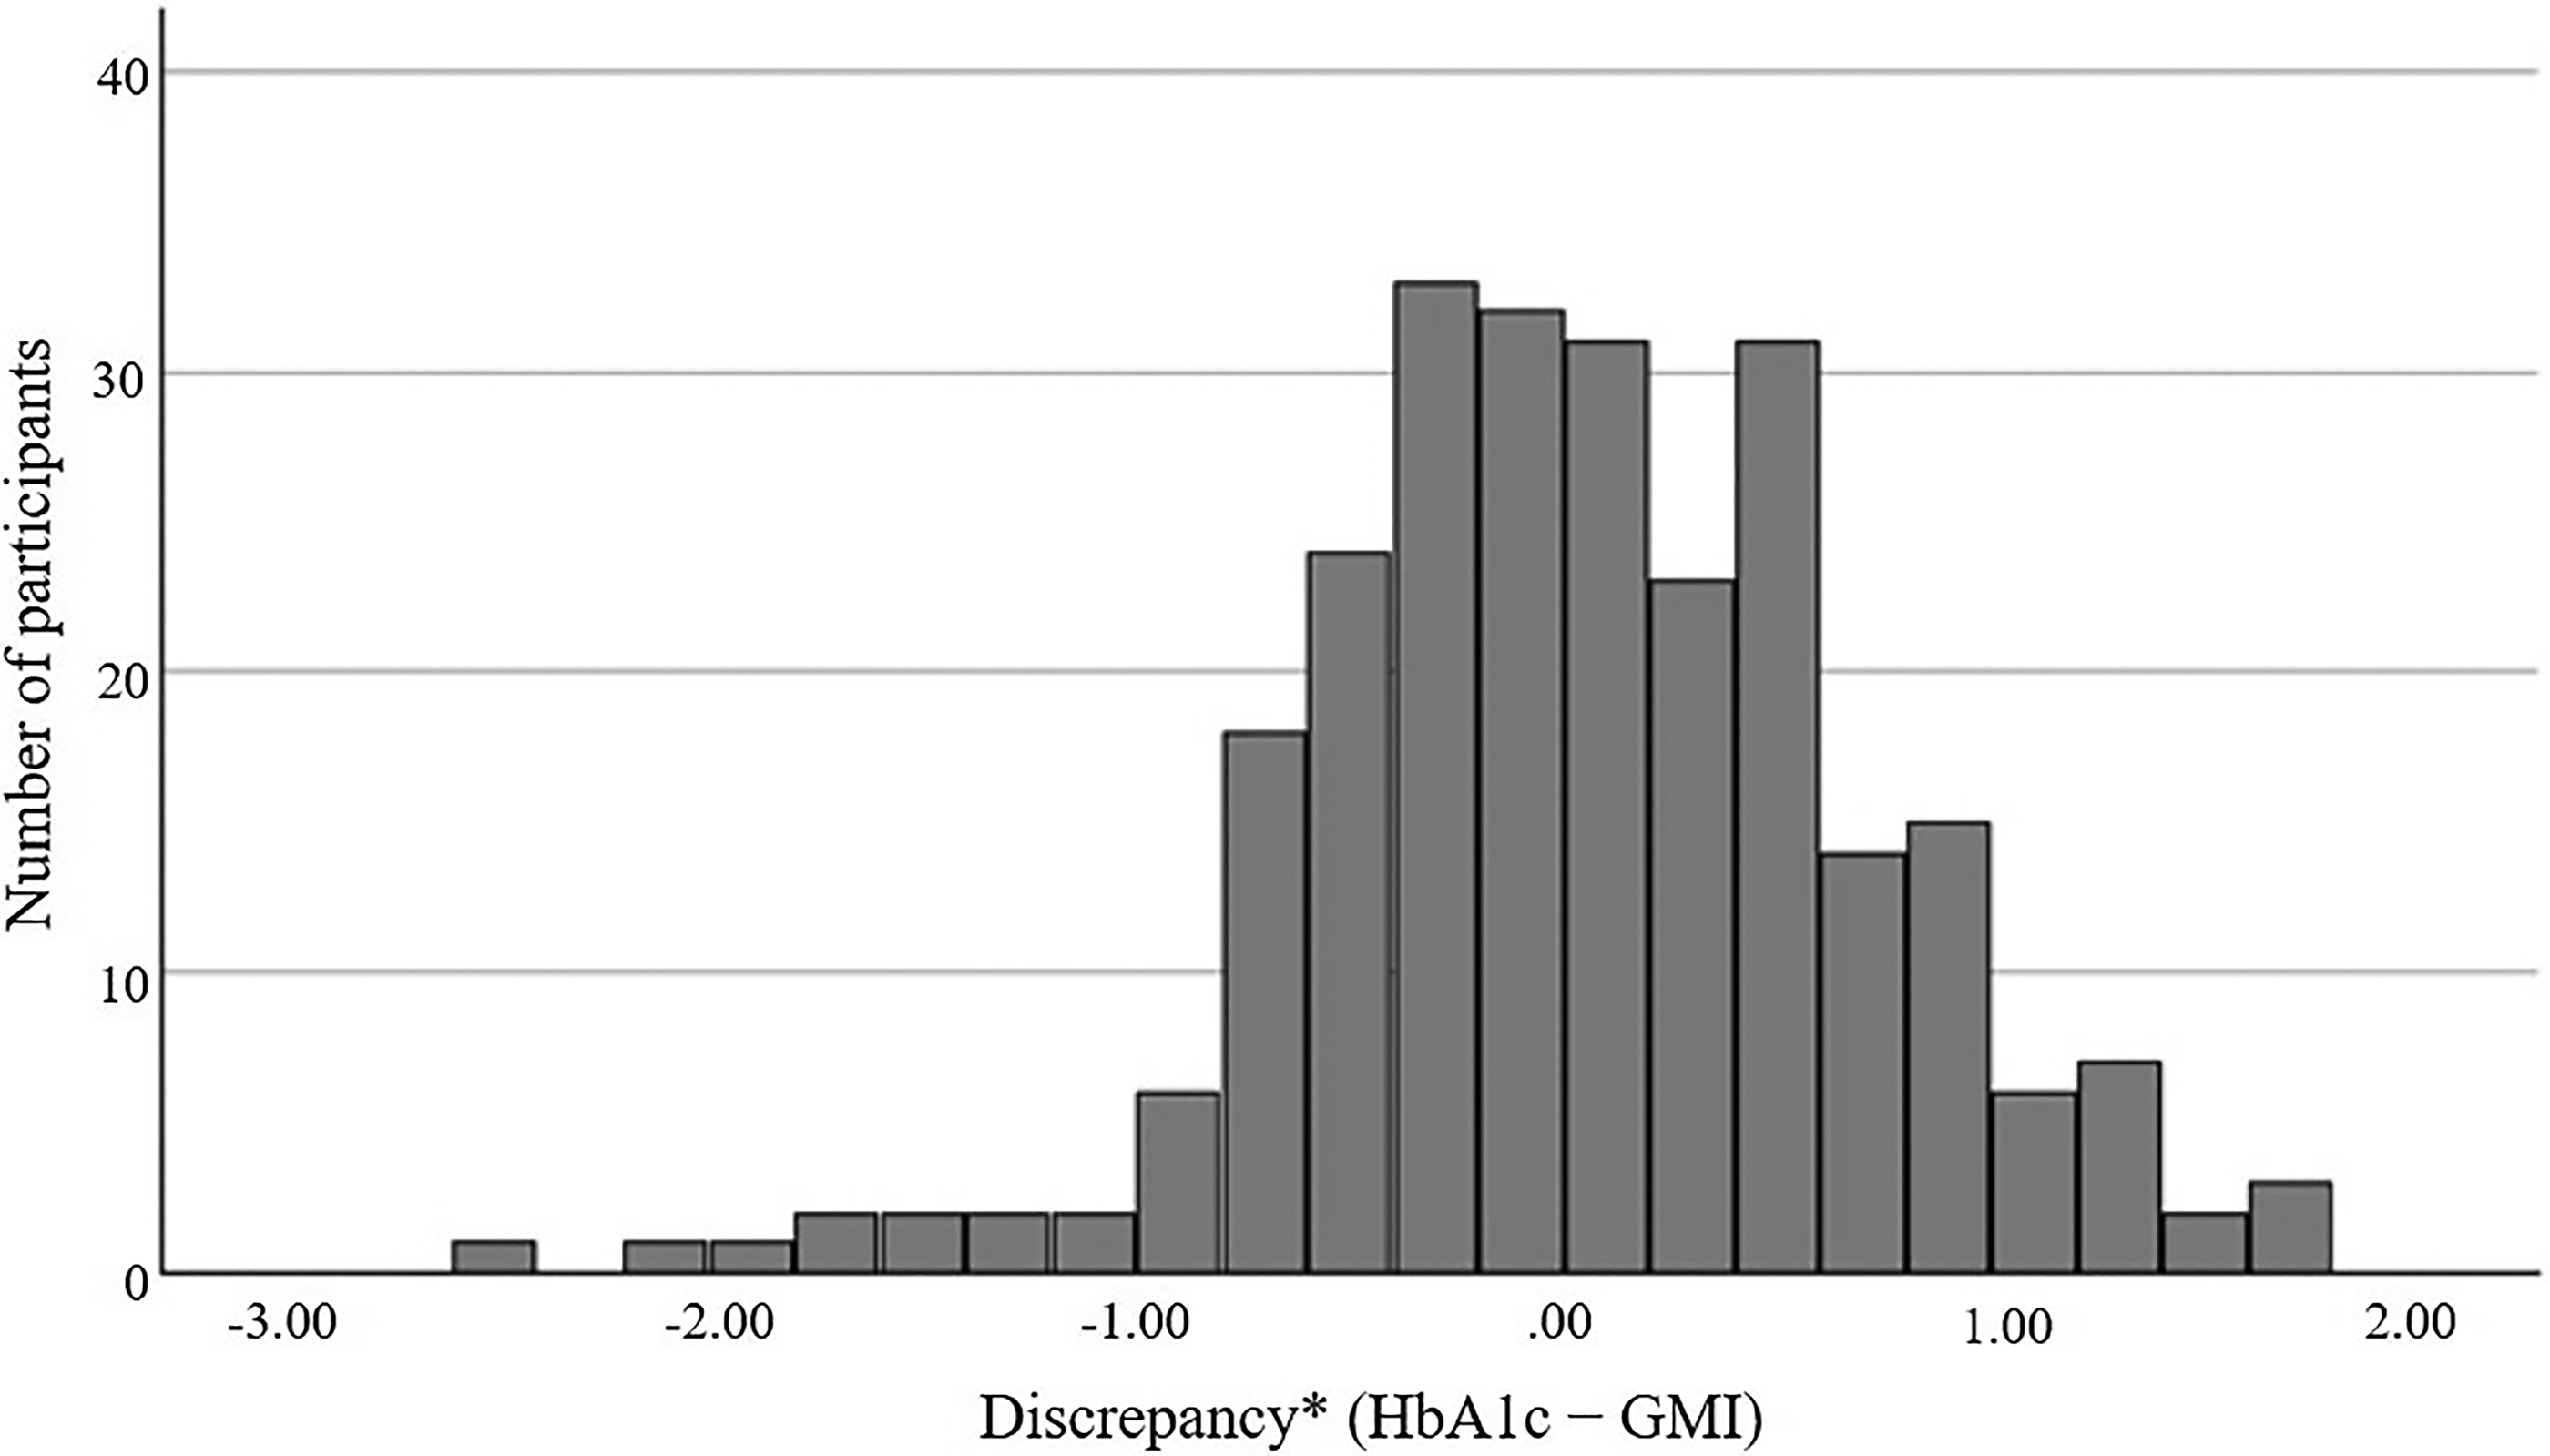
The distribution of discrepancy between HbA1c and GMI. Histogram showing the frequency distribution of the signed differences between measured capillary HbA1c and CGM-derived GMI. *Discrepancy = HbA1c – GMI, calculated using 14 days of CGM data.
For the 90-day CGM window, 63.5% and 68.7% of individuals at the first and second measurements, respectively, had an HbA1c–GMI discrepancy of <0.5%, whereas discrepancies >1% were observed in 11.5% and 8.4%, respectively (Table 2).
Percentage of Individuals with Different Discrepancy Levels (<0.5%, 0.5%–1%, and >1%)
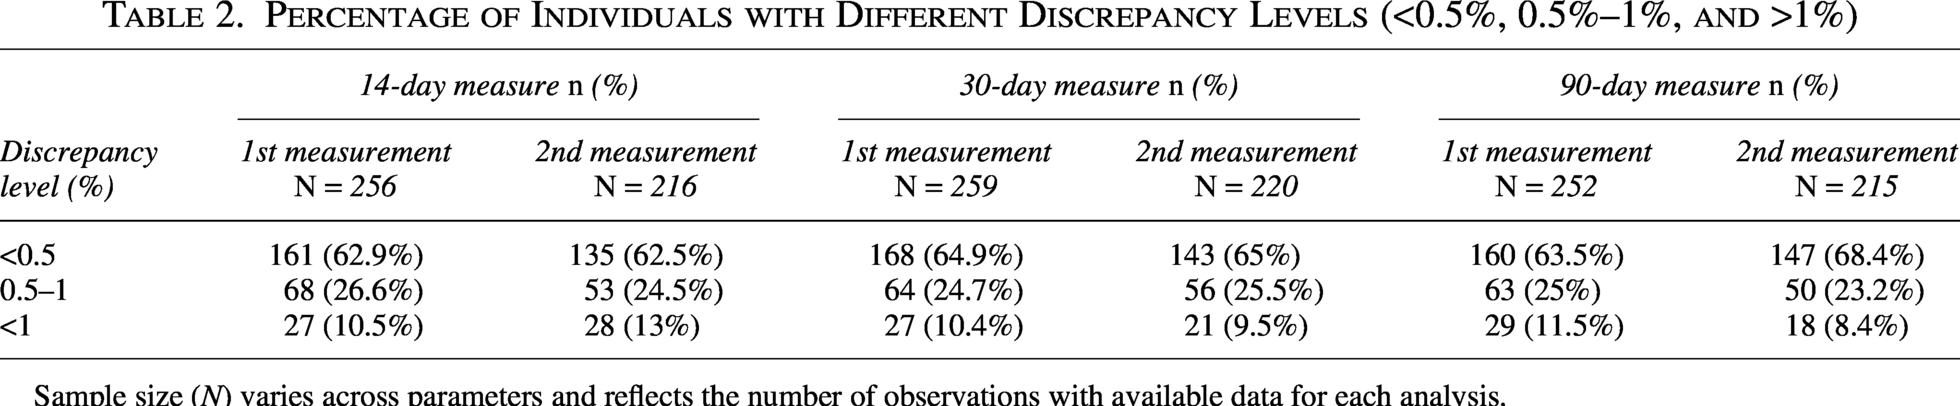
Sample size (N) varies across parameters and reflects the number of observations with available data for each analysis.
The difference in the HbA1c–GMI discrepancy between the two paired measurements per individual was minimal. For GMI calculated from 14 days of CGM data, the median within-individual difference in discrepancy between the first and second measurements was 0.0% (IQR: 0.4% to –0.3%) (Supplementary Fig. S2).
No correlations were found between HbA1c–GMI discrepancy and the age, BMI-SDS, and diabetes duration for any measurement of GMI calculated from the sampling of 14, 30, and 90-day CGM data periods (Supplementary Table S1).
Discrepancy levels were similar between individuals with and without controlled celiac disease and thyroid disorders. Among individuals with G6PD deficiency (n = 5; 1.9% of the cohort), the median discrepancy between capillary HbA1c and GMI exceeded 1.2% across all CGM sampling durations. The median discrepancy among individuals without G6PD deficiency was 0.4%. In addition, discrepancies greater than 1% were observed in 80%–100% of individuals with G6PD deficiency, and in approximately 5% of individuals without G6PD deficiency (Table 3).
The Rates of Individuals with a Discrepancy Greater than 1%: Comparison Between Individuals with Celiac Disease, Thyroid Disease, or Glucose-6-Phosphate Dehydrogenase Deficiency and Individuals without the Underlying Disease
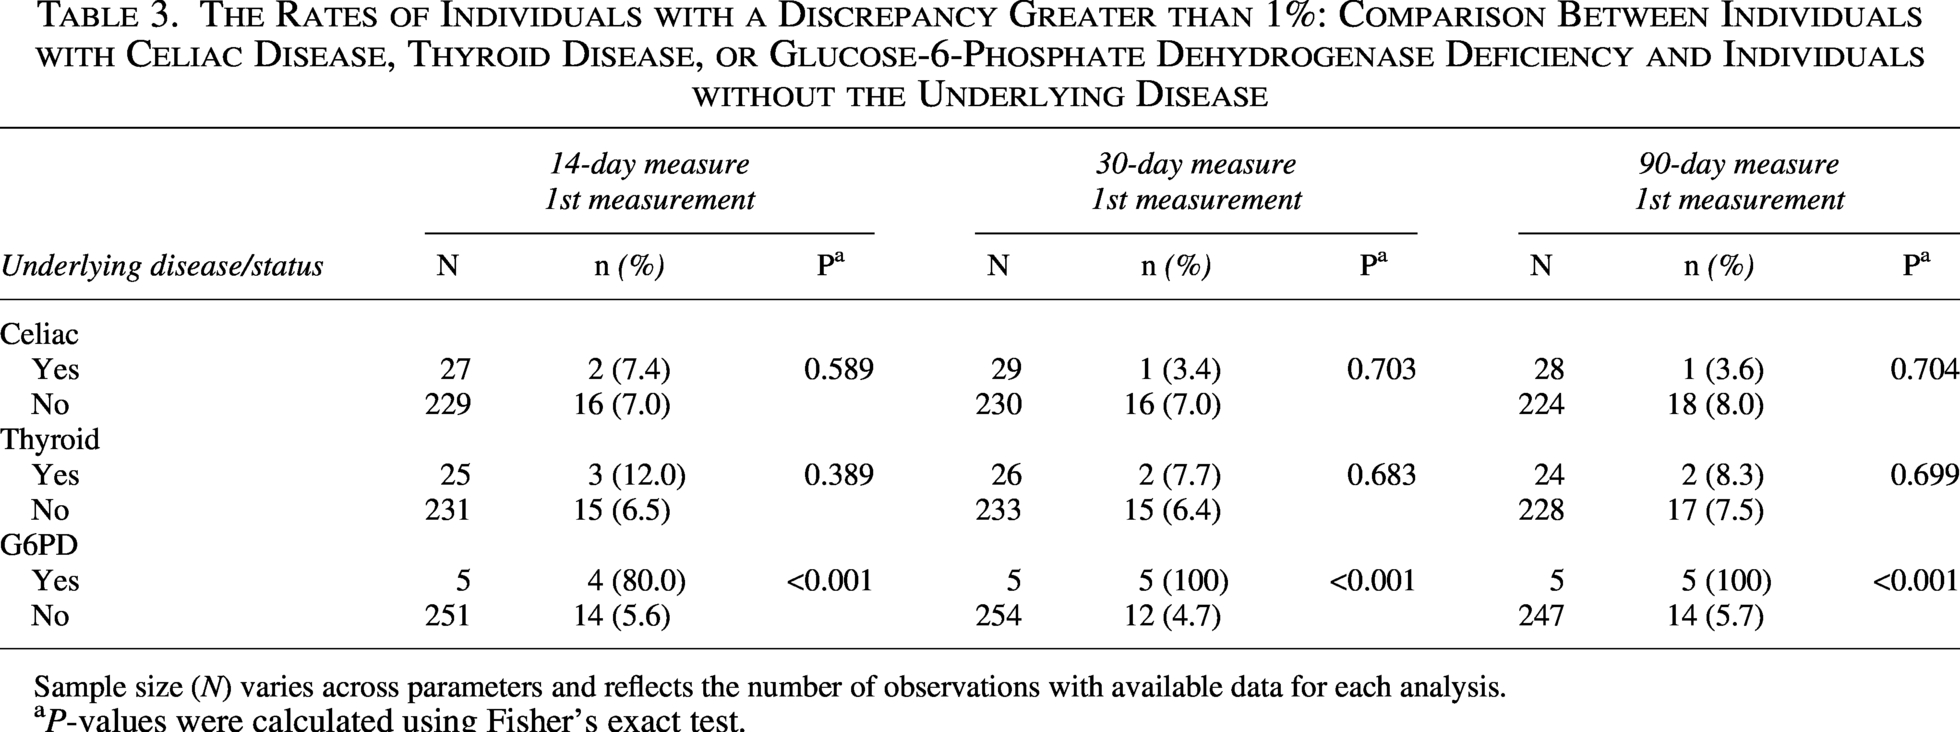
Sample size (N) varies across parameters and reflects the number of observations with available data for each analysis.
aP-values were calculated using Fisher’s exact test.
Agreement between measured HbA1c and GMI
Agreement between HbA1c and GMI was evaluated using Bland–Altman analysis (Fig. 2). The mean discrepancy (bias) of GMI after 90 days (first measure) was −0.052 (95% CI −0.135, 0.031, P = 0.221), indicating no meaningful overall systematic difference between the two measures. However, the limits of agreement were relatively wide (−1.370 to 1.266), with 95% CIs of −1.453 to −1.287 and 1.183 to 1.349, respectively, indicating substantial variability in individual-level differences between HbA1c and GMI. Linear regression analysis demonstrated significant proportional bias, with the difference between the two measures increasing with their mean value (β = 0.260, P < 0.001). The best agreement occurs at an HbA1c of approximately 7.55%; below this value, the discrepancy becomes increasingly negative (HbA1c lower than GMI), whereas above this value, the discrepancy becomes increasingly positive (HbA1c higher than GMI). Together, these findings suggest that although the average difference between HbA1c and GMI was small, agreement between the two measures varied across the range of glycemic values.
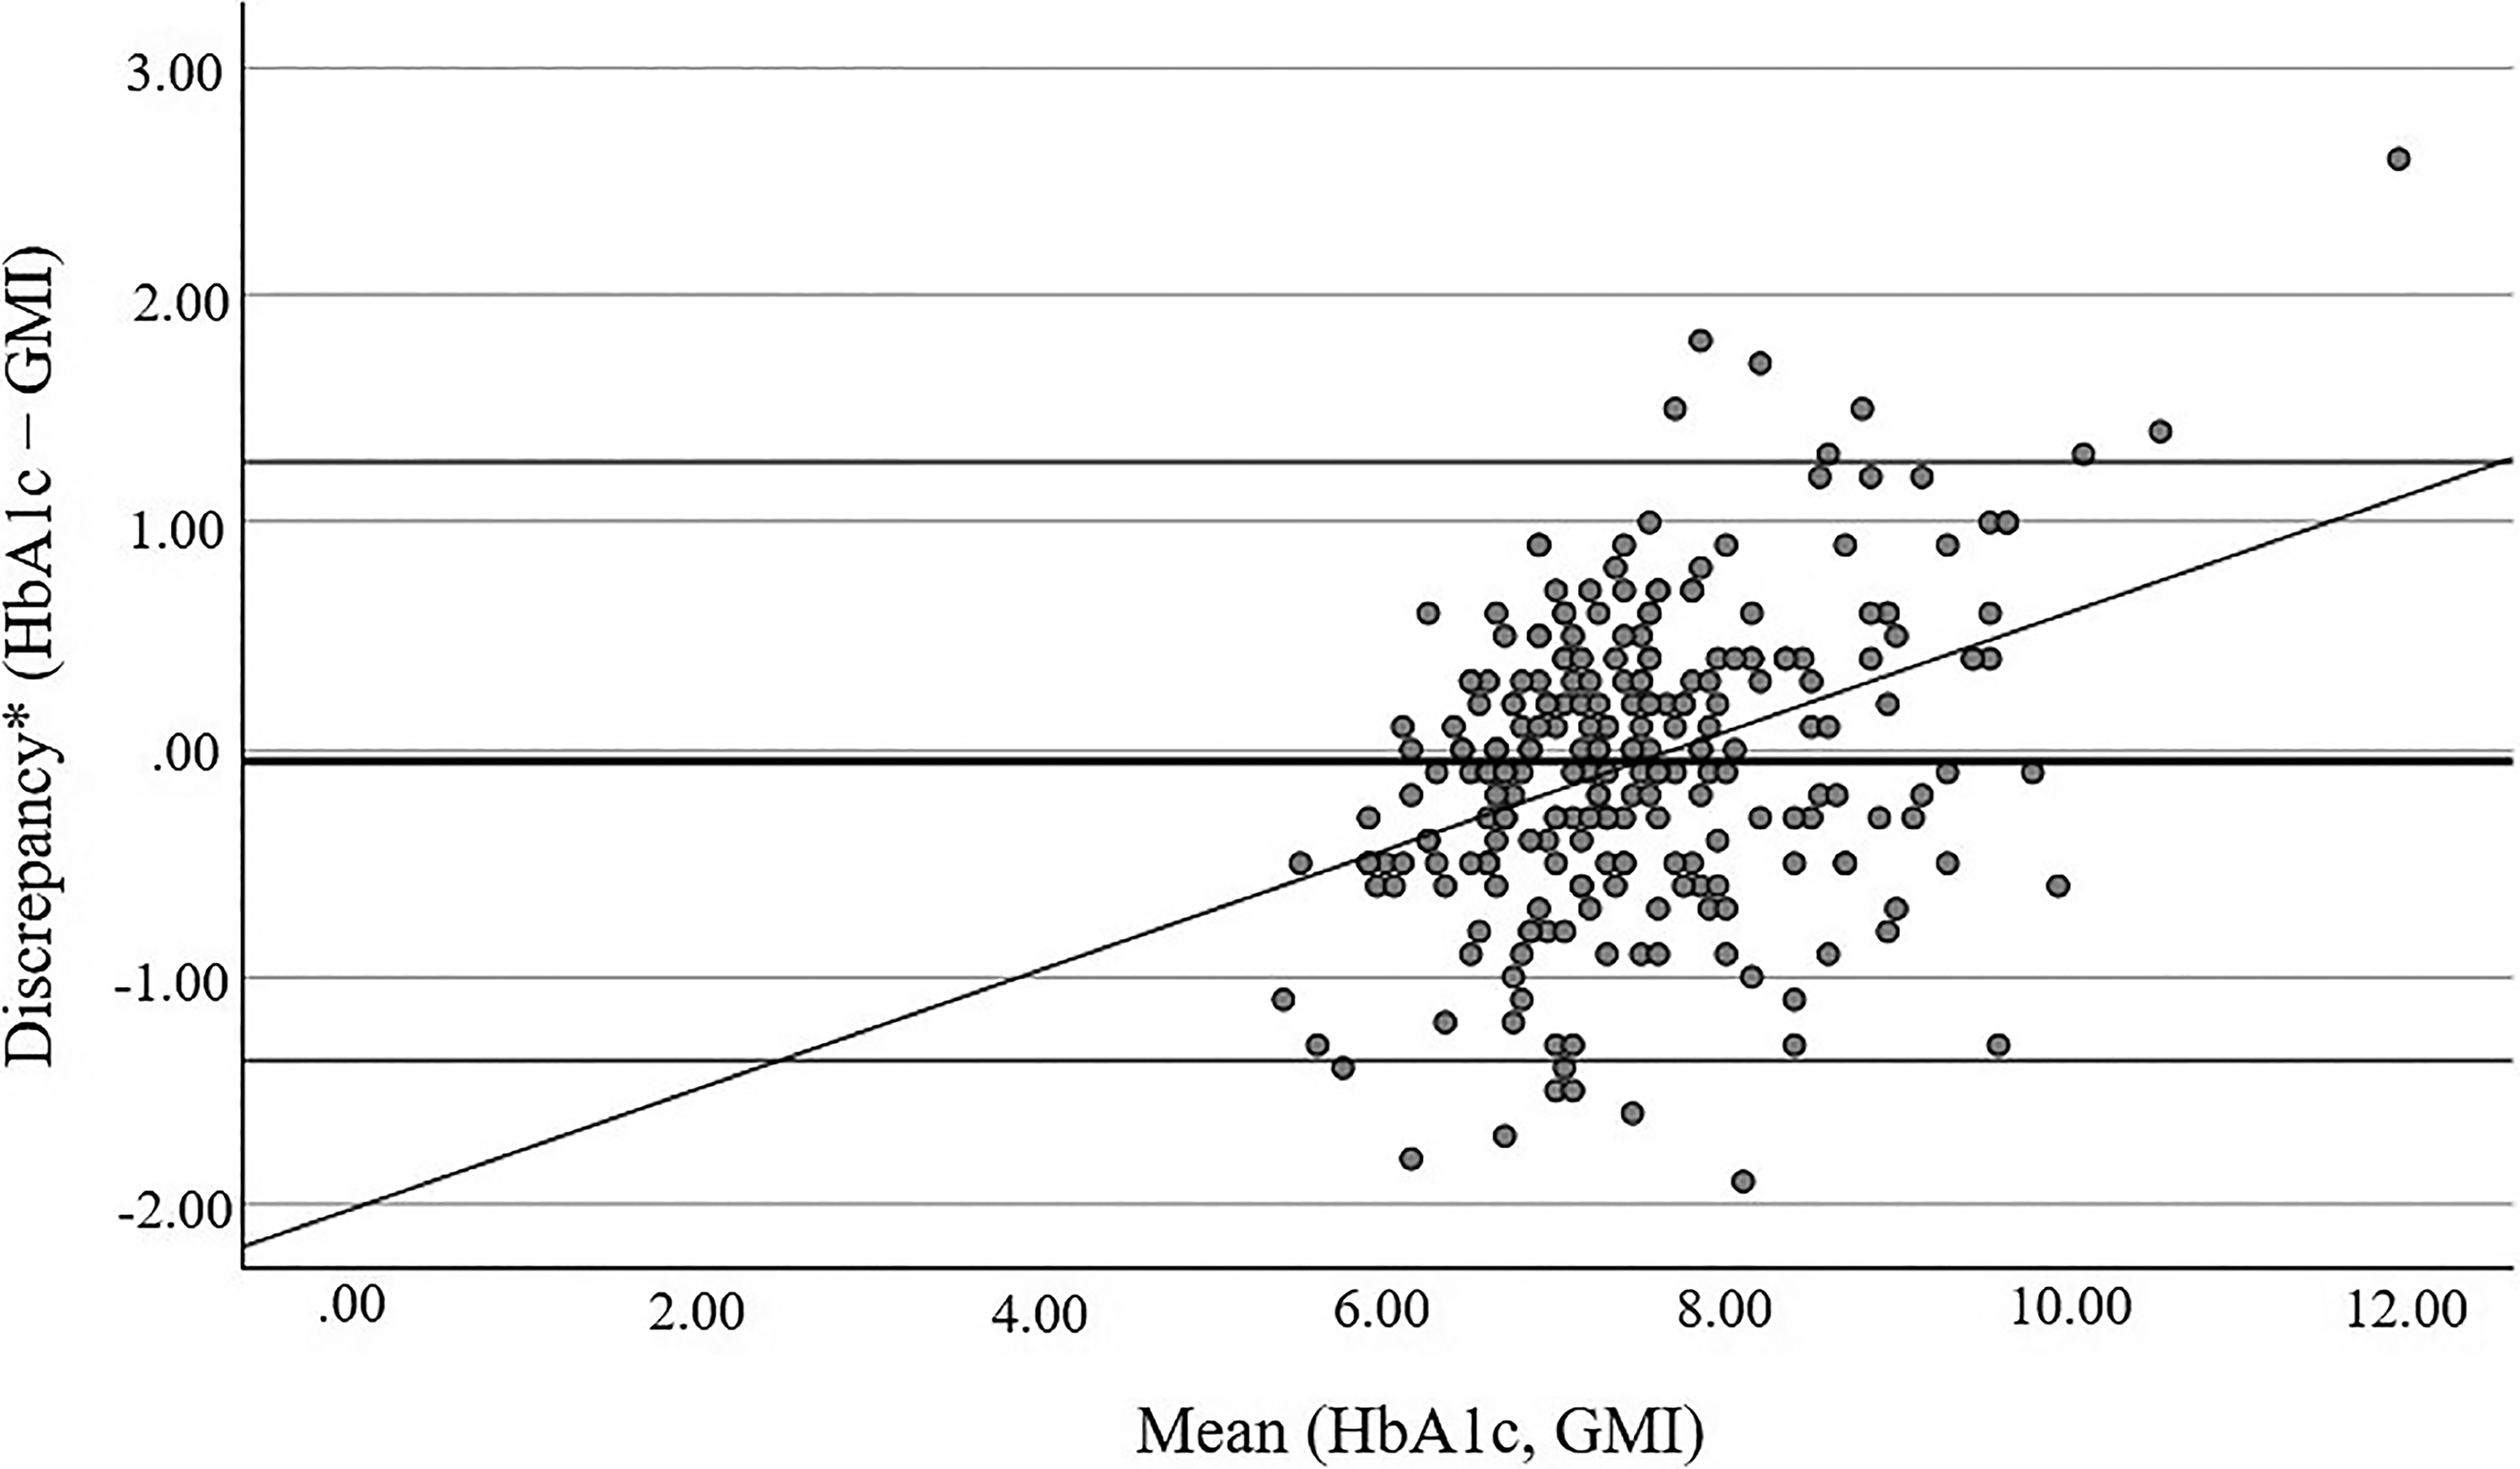
Agreement between HbA1c and GMI (90-day CGM data). Bland–Altman plot assessing agreement between measured HbA1c and the glucose management indicator (GMI) (the data represent 90 days from the day of the capillary HbA1c measurement). The difference between HbA1c and GMI is plotted against their mean. The solid horizontal line represents the mean difference (bias), and the dashed lines indicate the limits of agreement (mean difference ± 1.96 SD). The solid regression line represents the linear association between the discrepancy and the mean values, indicating proportional bias across the measurement range. *Discrepancy = HbA1c – GMI (data represents 90 days from the day of the capillary HbA1c measurement).
Association between measured HbA1c and CGM metrics
A significant statistical association was observed between measured HbA1c and most CGM-related metrics, with the exception of the CV% (Table 4). Both TIR (70–180 mg/dL) and TING (70–140 mg/dL) demonstrated consistent negative associations with measured HbA1c across all CGM durations. TING (70–140 mg/dL) was associated with HbA1c to a slightly greater extent compared to TIR (70–180 mg/dL). A 10% increase in TING and TIR was associated with a 0.54%–0.58% and 0.45%–0.49% decrease in HbA1c, respectively. Model fit statistics (QIC) were lower for TING (213–245) compared with TIR (284–309), indicating a modestly better model fit. However, QIC differences were interpreted descriptively and not as evidence of statistically significant superiority. As expected, the 90-day models generally showed lower QIC values than the corresponding shorter sampling windows, consistent with the closer physiological alignment between 90-day CGM data and HbA1c.
Associations Between Continuous Glucose Monitoring Metrics and Hemoglobin A1c
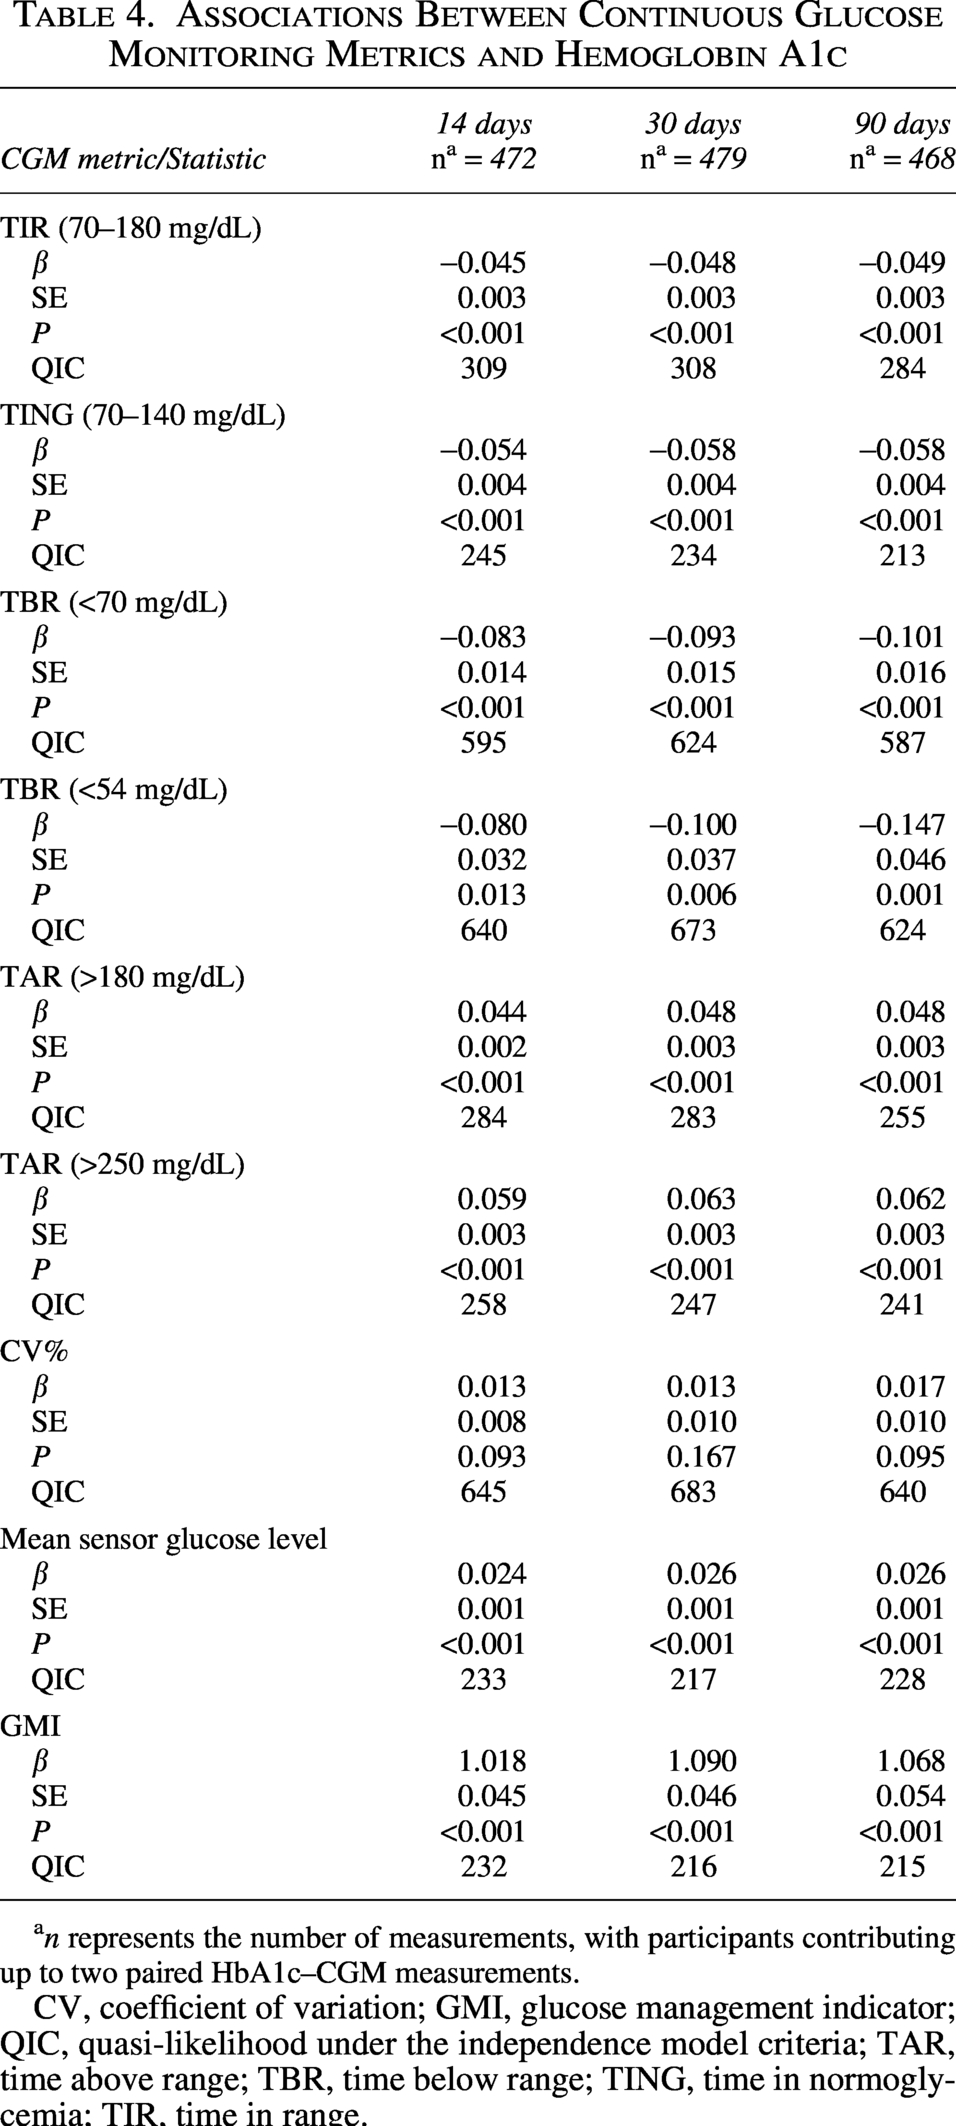
an represents the number of measurements, with participants contributing up to two paired HbA1c–CGM measurements.
CV, coefficient of variation; GMI, glucose management indicator; QIC, quasi-likelihood under the independence model criteria; TAR, time above range; TBR, time below range; TING, time in normoglycemia; TIR, time in range.
Positive associations were found between HbA1c and both TAR and mean glucose levels, while weaker negative associations were observed with TBR. Among all TIRs metrics, TING showed the strongest association with measured HbA1c (Table 4).
Figure 3 presents the relationship between HbA1c and TIR values based on two glucose thresholds (70–180 and 70–140 mg/dL) using 14-day CGM data. A consistent negative linear association was observed for both ranges, corresponding to a 0.5% decrease in HbA1c for every 10% increase in TIR, consistent with the findings of the GEE models.
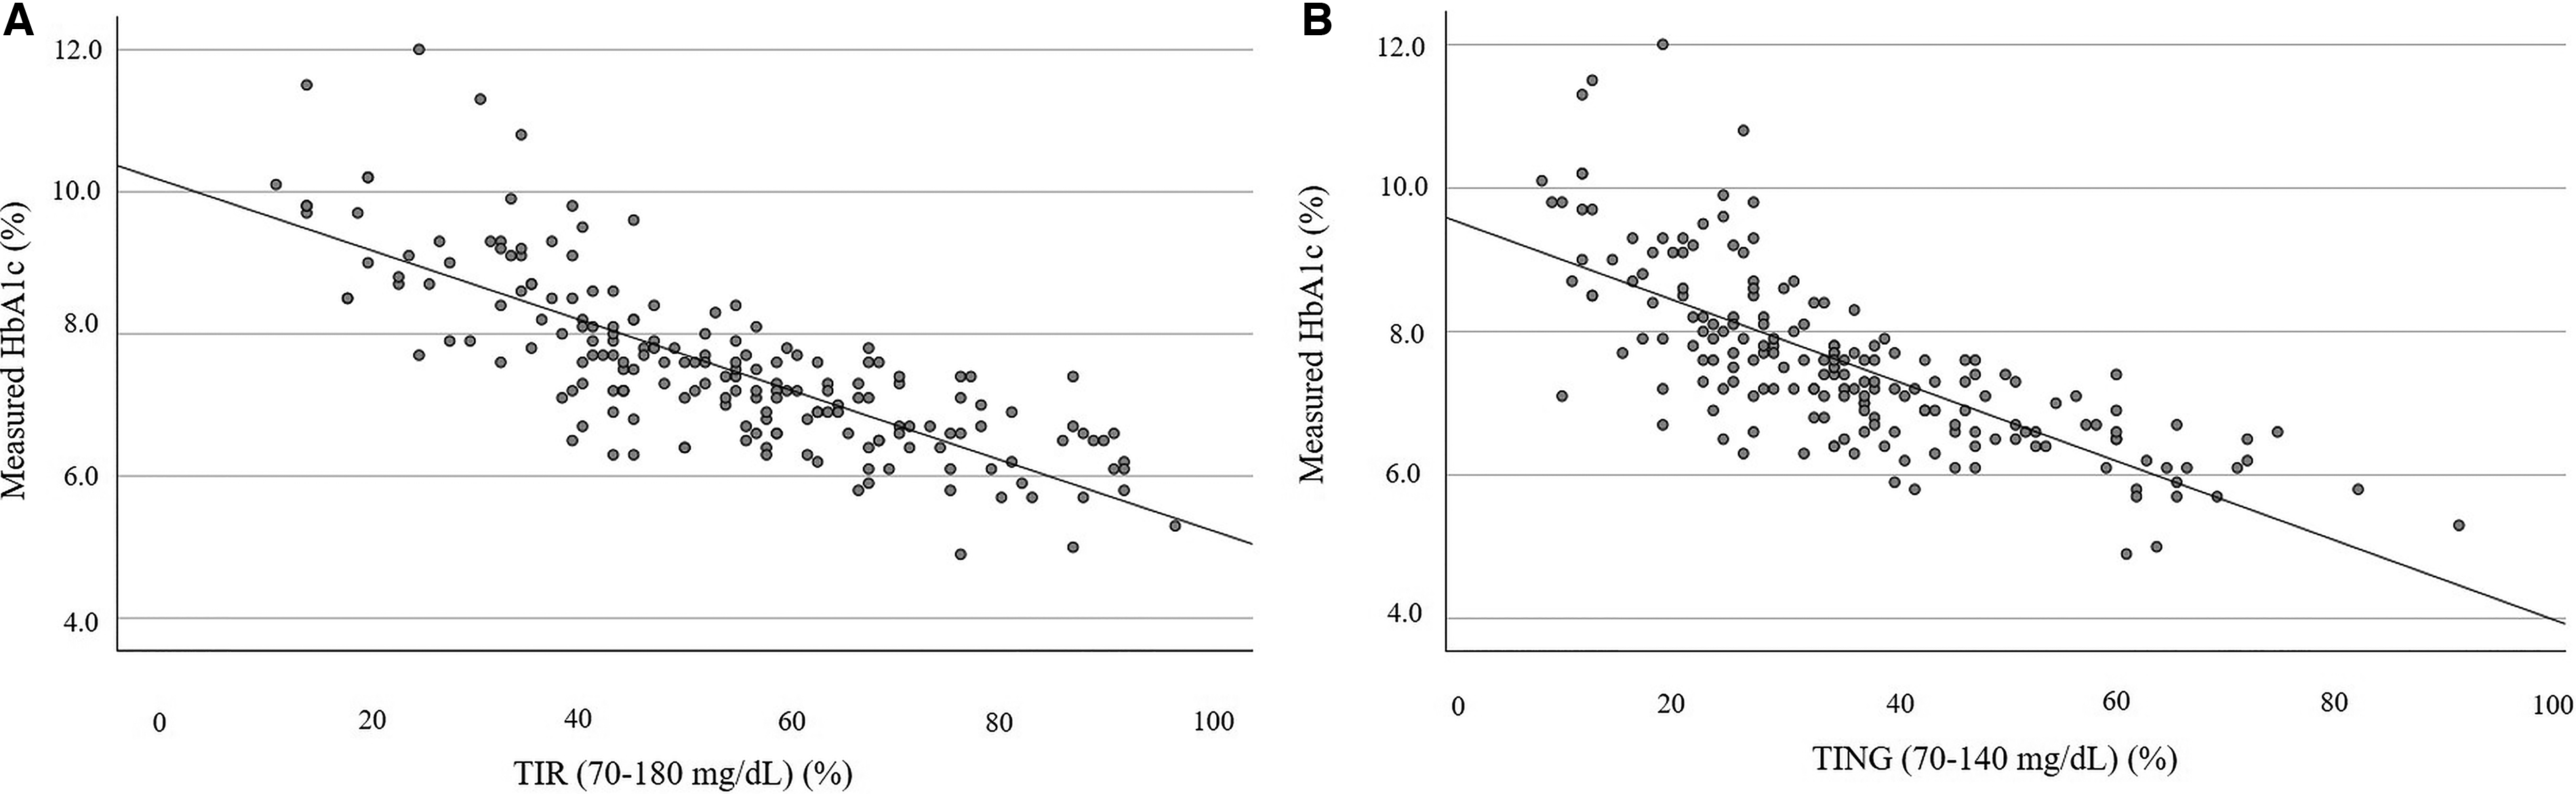
Association between time in ranges and HbA1c. *Data based on 14 days of CGM, using the same dataset of 189 individuals with available data for TIR, TING, and paired measured HbA1c.
Discussion
In this cross-sectional analysis of children, adolescents, and young adults with T1D, the comparison between the measured capillary HbA1c and GMI found that, on average, 62.7% of individuals exhibited an acceptable absolute difference of up to 0.5%. While 37.3% of individuals exhibited an absolute difference above 0.5%, and 11.8% showed an absolute difference above 1%. These findings were consistent across three different CGM sampling durations (14, 30, and 90 days) and across two repeated measurements, highlighting that HbA1c–GMI discordance is not only prevalent but also stable over time within individuals.
While HbA1c–GMI discordance has been reported primarily in adult populations, pediatric data remain limited. The discrepancy rate in our cohort aligns with previous pediatric findings 18 and is somewhat lower than the rates seen in adult cohorts, where comorbidities such as obesity, type 2 diabetes, renal insufficiency, and chronic inflammation are more prevalent.16,19–21 The lower discrepancy rate observed in our cohort (37%) may reflect the relatively young, healthy-weight population and the use of point-of-care capillary HbA1c measured concurrently with CGM data upload, which reduces temporal mismatch between metrics. In the current study, no significant correlation was observed between age, sex, duration of diabetes, or BMI and discrepancies between HbA1c and GMI. This differs from some previous reports. For example, Fellinger et al. demonstrated that higher BMI was associated with greater HbA1c–GMI discordance in adults with type 2 diabetes. 22 Notably, the mean BMI in that cohort was substantially higher (∼28 kg/m2) than in our study (mean BMI 21 kg/m2, median BMI-SDS 0.43), which may partly explain the differing results. In contrast, our findings are consistent with those of a previous study in individuals with T1D with a comparable mean BMI (∼20 kg/m2), which similarly reported no association between BMI and HbA1c–GMI discrepancies. 18
The discrepancy (HbA1c–GMI) varied with HbA1c levels. Regression analysis demonstrated significant proportional bias. The observed significant proportional bias indicates that agreement between the two measures varies across the glycemic range, with optimal concordance around an HbA1c of 7.55% and increasing divergence at lower and higher values.
Taken together, these findings suggest that while HbA1c and GMI show good agreement on average, their agreement is variable across individuals and across the spectrum of glycemic control. Therefore, GMI should be interpreted as a complementary metric rather than a direct substitute for HbA1c when assessing glycemic status.
These observations are consistent with findings from Montaser et al, who, in a pooled clinical trial analysis across age groups, showed that discrepancies between changes in GMI and HbA1c varied by baseline HbA1c level, most notably among participants with HbA1c >9%, in whom GMI substantially underestimated the observed HbA1c. 23 These findings suggest that adjusting GMI according to the measured HbA1c level may improve its concordance with laboratory values and provide a more reliable estimate of glycemic control. This effect was consistent across 14, 30, and 90-day CGM calculated GMI. One possible explanation is that at higher glucose levels, non-linear increases in HbA1c glycation may result in disproportionately higher HbA1c values relative to GMI derived from mean glucose.
Among the background diseases examined, celiac disease and thyroid disorders did not show a significant effect on the discrepancy between the capillary HbA1c and GMI. Thyroid disorders, such as hypothyroidism, are known to influence red blood cell lifespan by accelerating erythrocyte turnover. Similarly, celiac disease can lead to anemia, which may impact these measurements. However, it is possible that these conditions were well-managed with appropriate treatments, minimizing their potential effect on the observed discrepancies in our study population. In contrast, individuals with G6PD deficiency, comprising 1.9% of the population, consistently exhibited large discrepancies across all sampling durations. This emphasizes the importance of considering this relatively common condition when marked discordance between HbA1c and GMI is observed. 10
The discrepancy between HbA1c and GMI remained consistent for most individuals, showing a stable difference across measurements conducted for the same individual. This pattern was evident across all three CGM sampling periods used to calculate the GMI. For GMI derived from 14-day CGM data, the median discrepancy was 0.0%, with an IQR of −0.3% to 0.4%. Such stability supports the presence of intrinsic biological factors, such as individual differences in glycation efficiency or erythrocyte lifespan, that influence the degree of discordance between HbA1c and GMI. Previous studies have highlighted ethnic and genetic contributions to this variability, including the heritability of the glycation gap and polymorphisms in genes related to glycolysis and red blood cell physiology.12,24,25 Cohen et al. reported that approximately 69% of the glycation gap, defined as the difference between observed and predicted HbA1c, is heritable, indicating a significant genetic contribution to erythrocyte lifespan and intracellular glycation processes. 24 Similarly, Syreeni et al. identified genetic variants in genes such as GCK and HK1 that affect glucose metabolism and red blood cell physiology, contributing to HbA1c variability independent of glucose levels. 25 Although discrepancies were stable over time for most individuals, fluctuations were observed in a subset of individuals. This non-consistent discrepancy may partially reflect transient physiological or behavioral factors not captured in the study, such as acute illness, 26 adjustments in insulin therapy, or short-term lifestyle modifications. These temporary influences may affect either HbA1c levels or glycemic patterns, thereby altering the alignment between HbA1c and GMI.
Given that approximately one-third of our pediatric cohort exhibited significant discrepancies between HbA1c and GMI calculated from mean glucose, we further examined the association between HbA1c and other CGM-related metrics. We found a significant association between measured HbA1c levels and mean glucose levels, TAR and TIR. A stronger association was observed between TAR and HbA1c compared with TBR, further emphasizing that HbA1c is a strong indicator of hyperglycemia rather than hypoglycemia. In addition, no association was found between the coefficient of the variance and HbA1c, supporting the notion that HbA1c primarily reflects elevated glucose levels and less hypoglycemia and glucose variability. An important finding was that TING (70–140 mg/dL) exhibited a slightly stronger association with HbA1c levels compared to TIR of 70–180 mg/dL, together with better relative model fit. This may suggest that a narrower glycemic range captured by TING better reflects average glycemic control. Our findings extend the report by Kim S et al., which demonstrated in an adult Asian population with T1D and T2D that, compared with TIR, TING showed greater accuracy in identifying achievement of clinically relevant GMI and HbA1c targets. 27 In contrast, a large cohort of youth and young adults with T1D demonstrated similarly strong inverse correlations for both TIR and TING, with TIR showing a marginally better predictive fit. 28
The strengths of this study include the relatively large cohort size, the use of real-world clinical data, and the same-day collection of HbA1c and CGM profiles, allowing for accurate matching between laboratory and sensor derived measures. In addition, the comprehensive assessment of associated clinical conditions, together with the availability of both cross-sectional and paired data based on two repeated measurements, enhances the reliability of the observed discrepancy patterns. Several limitations should also be acknowledged, including the single-center design and the use of multiple CGM devices. However, each individual consistently used the same CGM device over time, reducing potential device-related bias. Second, only measurements with sufficient CGM data to calculate GMI were included, without applying a predefined sensor wear-time threshold. Therefore, although overall CGM completeness was high, the amount of available CGM data was not standardized and may have influenced the precision of the CGM-based correlation analyses. Third, in a small proportion of paired measurements (∼5%), the interval between visits was shorter than 90 days, allowing partial overlap of the retrospective 90-day CGM windows. No paired visits were separated by less than 30 days; therefore, the 14- and 30-day analyses were not affected. This overlap may have modestly inflated the apparent reproducibility of the HbA1c–GMI discrepancy in the 90-day analysis. A further methodological consideration is that the primary 14-day CGM window does not fully correspond to the longer period of glycemic exposure reflected by HbA1c. However, similar patterns were observed when the analyses were repeated using 30-day and 90-day CGM windows. Finally, the evaluation of multiple, highly correlated CGM metrics across different sampling durations without formal adjustment for multiple comparisons may have increased the risk of type I error; therefore, these findings should be interpreted with caution.
In summary, our study showed that GMI and HbA1c differ significantly in approximately one-third of youth with T1D. This discrepancy was independent of CGM sampling duration and remained stable within individuals, suggesting a contribution of intrinsic factors. G6PD deficiency, a relatively common condition in this cohort, was associated with large discrepancies between HbA1c and GMI, highlighting the limitations of relying solely on HbA1c in these individuals. HbA1c and GMI capture different aspects of glycemic exposure, and neither metric alone provides a complete assessment. Given that discrepancies varied across the full HbA1c spectrum, estimation of HbA1c from CGM-derived metrics may require level-specific adjustment based on average glucose, CGM-derived metrics such as TING, and an individual-specific factor.
Authors’ Contributions
A.D. and R.N. contributed to the study design, data collection, interpretation, and article preparation. R.N. served as the academic supervisor of A.D. and supervised the research as part of A.D.’s MD thesis work. A.D. wrote the first draft of the article. M.Y.-G. performed the statistical analysis. M.P. contributed to study design and coordination and study interpretation. All authors reviewed and approved the final version of the article.
Footnotes
Acknowledgments
This work was conducted as part of the final thesis for the MD degree at Tel Aviv University, Gray Faculty of Medicine.
Author Disclosure Statement
M.P. has participated on advisory boards for AstraZeneca, Eli Lilly, Insulet, MannKind, Medtronic Diabetes, Pfizer, Sanofi, Bayer, Ascensia, ProventionBio, embecta, Dompe, and Tandem. He has received consulting fees from Qulab Medical and ProventionBio, and received, through his institute, research grants from Eli Lilly, Medtronic Diabetes, Novo Nordisk, Pfizer, Sanofi, DreaMed Diabetes, NG Solutions, Dompe, Lumos, GWAVE, OPKO, ProventionBio, AstraZeneca, and Omega Galil. M.P. owns stocks in DreaMed-Diabetes and NG Solutions.
R.N. served on the advisory board of Tandem Diabetes and DreaMed Diabetes and received honoraria for participating in the speaker’s bureau of Novo Nordisk, Pfizer, Sanofi, Medscape, and Insulet. R.N. is a shareholder of DreaMed Diabetes and has an active position in DreaMed Diabetes. R.N.’s institution received research grant support from Abbott Diabetes, Eli Lilly, Geffen Medical, Medtronic Diabetes, Novo Nordisk, Pfizer, and Sanofi.
Adi Dagan and Michal Yackobovitch-Gavan have no disclosure.
Funding Information
This study received no external funding.
Supplemental Material
References
Supplementary Material
Please find the following supplemental material available below.
For Open Access articles published under a Creative Commons License, all supplemental material carries the same license as the article it is associated with.
For non-Open Access articles published, all supplemental material carries a non-exclusive license, and permission requests for re-use of supplemental material or any part of supplemental material shall be sent directly to the copyright owner as specified in the copyright notice associated with the article.