
Abstract
This study examined the relationship between financial stress and student retention for post-secondary students. Data from 2014 collected at a Pacific Northwest University using The Ohio State's National Student Financial Wellness Study were used to examine the students’ reported levels of stress related to finances. Students reported the most financial stress came from their student loan debt. Data analyses showed significance between participants who reported “large” and “extreme” amounts of stress from debt and their decisions to reduce course work, drop out, and/or take a break. Although future research is needed to determine the exact relationship between financial stress and retention rates, it is important to acknowledge that financial stress influences students’ educational decisions.
Review of Literature
Debt
Research shows that American adults generally have low financial literacy levels and struggle to apply decision making skills in day-to-day financial decisions (FINRA Investor Education Foundation, 2022). The National Financial Capability Study, a project of the FINRA Investor Education Foundation, found that 66% of US participants could not correctly answer more than 3 out of 5 questions addressing finances and economics in everyday life (FINRA Investor Education Foundation, 2022). This study also found that over the last year 19% of individuals reported their household spent more than they earned, 35% of those with credit cards paid only the minimum amount due for some months, 29% reported using a non-bank borrowing method, and 46% do not have a “rainy day” fund set aside to cover three months of living expenses (FINRA Investor Education Foundation, 2022).
It should not come as a surprise that debt is a rising concern across the United States, with the total debt load of households in the US at a record high of over $15.84 trillion (Federal Reserve Bank of New York, 2022). The average household with debt carries an average of $152,612 in total debt, about $6,913 of that average is credit card debt, and $58,309 is student loan debt (El Issa, 2021). As of 2020, the total student loan debt in the US was $1.71 trillion, the 43.2 million borrowers with Federal student loan debt averaged $36,406 per student, and 65% of graduates have student loan debt (Hanson, 2021a). 2020 saw the largest increase in total national student loan debt since 2013, but many student debt relief efforts have helped decrease the average student loan debt (Hanson, 2021b). Despite these debt relief efforts, students leave college with an existing financial burden.
Population
This study focuses on the traditional college students, ages 18–25 years, who fall in the category of emerging adults and are characterized as being demographically unstable, desiring to become self-sufficient, and desiring to explore their identity (Arnett, 2000). These emerging adults experience unique upheavals and course changes as they move through this formulative 4–6-year period and face many sources of stress such as change in sleeping habits, change in eating habits, new responsibilities, and class workload (Ross et al., 1999). Financial stress is also an impactful source of stress; students experiencing financial stress from either actual or perceived financial hardship were more likely than their peers to discontinue college (Britt et al., 2017), take fewer credits, drop out of school, and work part or full time while being enrolled (Joo et al., 2008). The financial burden of student loan debt can significantly affect the lives of young adults as they delay life accomplishments such as marriage, starting a family, and home ownership (American Student Assistance, 2013). The financial stress from student loan debt can also cause young adults to accept any job that pays the bills instead of looking for a career job. This can lead to poor job performance which affects the employer, company, and community (American Student Assistance, 2013).
Cost of Education
Based on data from Trends in College Pricing from College Board, over the last 10 years the total cost of tuition, fees, and room and board increased by 11% at public four-year institutions and by 14% at private nonprofit four-year institutions after adjusting for inflation (Ma & Pender, 2021). In 2020, of those graduating with a bachelor's degree from a four-year public institution, 55% had debt and the average debt level was $26,700 (Ma & Pender, 2021). Between 2015 and 2020, the number of bachelor's degree recipients who took on debt as well as the average cumulative student debt levels declined in both public and private sectors (Ma & Pender, 2021). As encouraging as it is to see students attaining degrees without acquiring debt, it is still concerning to see the number of students taking on debt. For most students, parental support from parental income, savings, or borrowing is the greatest financial contribution and annually covers about 39% of the cost of college (Hanson, 2021a). Grant aid covers close to 25%, saving for college covers about 11%, and student loans cover about 11%, which leaves about 14% left to be covered through student income or other means (Hanson, 2021b).
If debt is causing a delay in life accomplishments, affecting job satisfaction, academic performance, and over-all health of students, why do college students continue to take out so much debt? One of the most influential factors may be lack of financial education. The Council for Economic Education's Survey of the States takes a biannual look at K-12 economic and financial education across the US. The 2014 report stated that 17 states required high school students to take a personal finance course, while 22 states required an economics course (Council for Economic Education, 2014). The 2020 report states that 21 states now require the personal finance course, and 25 require an economics course (Council for Economic Education, 2020). However, six fewer states conduct tests in economics, and two fewer states conduct personal finance testing than the 2018 report (Council for Economic Education, 2020).
Definition of Terms
Defining terms associated with college retention is difficult due to slight variances in interpretation. For this research, term definitions come from the Integrated Postsecondary Education Data System's (IPEDS) online glossary. A “transfer-out student” is defined as “A student that leaves the reporting institution and enrolls at another institution” (National Center for Education Statistics, 2021). A student taking a break from academics or a “stop out” is defined as “a student who left the institution and returned at a later date” (National Center for Education Statistics, 2021).
For four-year institutions, college “retention rate” is defined as “For four-year institutions, this is the percentage of first-time bachelors (or equivalent) degree-seeking undergraduates from the previous fall who are again enrolled in the current fall.” (National Center for Education Statistics, 2021). “Graduation rates” are defined as “…the number completing their program within 150 percent of normal time to completion,” which for undergraduate students would be 6 years (National Center for Education Statistics, 2021).
It is important to note the possible errors with the above definitions of graduation rates. As Hagedorn (2006) points out this definition excludes several categories of students such as transfer students, part-time students, students with undeclared majors, as well as students who enroll mid-year. Cook and Hartle (2011) also discuss that the reported graduation rates can be misleading, especially with the growing percentage of non-traditional students. Some terms are not defined by IPEDS, but definitions can be found in other scholarly articles. The term “dropout” is one of these and is difficult to define (Hagedorn, 2006). It is often understood to be the opposite of “retention” (Hagedorn, 2006), meaning a “dropout” is someone who does not re-enroll for the next fall semester (Voigt & Hundrieser, 2008).
Importance of Retention Rates
Despite the potential incomplete picture retention rates portray, and the difficulty defining terms, retention rates are an easy measure of how well an institution is accomplishing their goal of helping students acquire a degree (Cook & Hartle, 2011). If the student is succeeding and accomplishing their educational goals then the institution is succeeding (Voigt & Hundrieser, 2008). Graduation rates have been calculated for over a decade but only recently, due to a shift of focus on higher education, have they drawn much attention (Cook & Hartle, 2011). In today's complex learning environment with online and in-person learning, multi-institution enrollment, and increase in non-traditional students, it is more important than ever for institutions to develop effective ways for reporting students’ success to degree completion (Manyanga et al., 2017).
Theories of Retention
Although there is not one overarching theory related to college retention, there are several theories that have greatly influenced the study of college retention over the years (Voigt & Hundrieser, 2008). Building on Durkheim's Suicide Model (Demetriou & Schmitz-Sciborski, 2011), theorist William Spady (1971) presented the first widely recognized theory of college student retention looking at a sociological model of student dropout. He suggested that five main variables contribute to a student's social interaction with their peers and their social integration into the college environment (Spady, 1971). By including variables of student satisfaction and commitment to success at college the five variables could be indirectly linked to the decision to drop out or persist.
One of the most popular theories of retention over the past several decades is American theorist Vincent Tinto's work on a sociological analysis of college student retention (Voigt & Hundrieser, 2008). Like Spady, Tinto’s (1987) integration model builds on Durkheim's Sucide Model (Demetriou & Schmitz-Sciborski, 2011) and explains how the academic and social interaction of an institution affects an individual's decision to voluntarily leave. Positive formal and informal interactions during college life encouraces students to persist to a degree and accomplish their goals (Tinto, 1987). He also suggested that the more integrated a student is in the more likely they are to accomplish their academic goals (Tinto, 1987).
American theorist John Bean's research is compatable to what Tinto and Spady theorized before him, but Bean did not build on Durkheim's theory. Bean (1990) suggested that students leaving college was similar to employees leaving places of work. His work in 1983 suggested that a student's beliefs about school led to their additudes toward school which affected their intent to stay or leave, which then caused them to actually stay or actually leave (Bean, 1990). He also included factors outside of school and was one of the first to incorporate enviromental variables into the college student attration puzzle (Bean, 1990).
Data on Retention and Graduation Rates
The National Center for Education Statistics (2020) compiles a yearly report titled “The Condition of Education.” The 2018 overall six-year graduation rate was about 62%, with females having a higher graduation rate than males (65% vs. 59%). As for student retention for first-time undergraduates, at public four-year institutions the 2018 overall retention rate was 81%; there was a range from 63–97% retention between the least selective (open admission) and most selective (less than 25% acceptance rate) institutions (National Center for Education Statistics, 2020).
Bean (1990) pointed out that although there are innumerable reasons a student might choose to drop out of school, the one factor that is consistent is that they feel like they do not fit in. It may be a combination of the student and institution not addressing the needs of the student so one area cannot be blamed for this ill fit (Bean, 1990). Bean (1990) also points out that students with different demographics leave, or persist, for varying reasons. Other factors to consider are GPA and academic achievement (Adelman, 2006; Hanson & Swann, 1993; Molnar, 1996; Tinto, 1987), academic preparedness (Hanson & Swann, 1993; Swail, 2004), commitment to educational goals (Tinto, 1993), demographic characteristics (Chen & St. John, 2011; Wohlgemuth et al., 2007) and amount of student debt (Robb et al., 2012). Historically, financial need and financial stress were not identified as main factors for persisting or leaving, but more recent research is drawing attention to this factor (Joo et al., 2008; Millea et al., 2018; Moore et al., 2021; Pratt et al., 2017; Robb et al., 2012).
Methods
Data were collected in the fall of 2014 at a Pacific Northwest University using The Ohio State's National Student Financial Wellness Study (NSFWS). The purpose of this survey was to examine the financial attitudes, practices, and knowledge of students at all types of post-secondary institutions across the Unites States (The Ohio State University, 2014). The collected data was expected to paint a picture of students’ financial wellness and provide a better understanding of how to help students navigate personal finances.
The survey design was based on research conducted at The Ohio State University in 2000–2010 regarding financial wellness in college students; specifically, research from the field of personal finance regarding financial behaviors, the field of higher education regarding student finance, previous dissertation research done at The Ohio State University, and previous survey research done at The Ohio State University. The questions were developed by the University's Center for the Study of Student Life, designed to have students self-report, and included the following sections: personal financial management, financial support, financial socialization, credit cards, student loans, finance-related stress, cost of college, academic plans, and financial knowledge (The Ohio State University, 2014).
The survey questionnaire was reviewed by content experts at The Ohio State University and six co-investigator institutions to establish validity and reliability (The Ohio State University, 2014). In 2010, the survey was piloted to 5,729 students at 19 Ohio postsecondary institutions, including public two-year institutions, public four-year institutions, and private four-year institutions (The Ohio State University, 2014). There were significant findings regarding personal finances in general, student loan debt causing stress, and personal finance classes improving money management skills (Center for the Study of Student Life, 2011).
In the fall of 2014 and winter of 2015, the NSFWS was administered to 52 institutions across the United States: four-year public (n = 32, 61.5% of participating institutions), four-year private (n = 12, 23.1% of participating institutions), and two-year public (n = 8, 15.3% of participating institutions) (The Ohio State University, 2015). The survey was administered to 163,714 students and response rates were as follows (Table 1):
Response Rate for NSFWS.
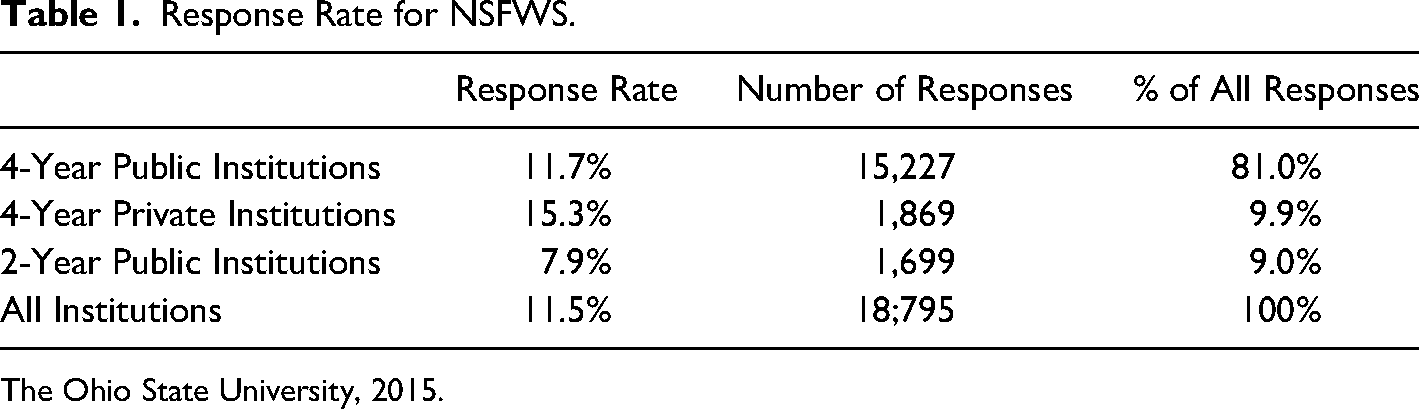
For this research, data was used from The Ohio State's study conducted at a four-year public institution in the Pacific Northwest. Approval was obtained from the institution's Institutional Review Board and in the fall of 2014, an email invite to participate in the survey was sent to 2,000 of this institution's full-time undergraduate students, randomly selected by the Registrar's Office. If the student did not complete the survey within three days, they received a reminder email. Students received a total of three reminder emails, each being sent three to five days later. Three weeks after the initial email the survey closed. To increase response rate, students were entered into a drawing to win one of ten $50 gift certificates to the university bookstore.
Before beginning the survey, the students were given a study information sheet that informed them of the details about the survey as well as their rights as participants. After reading the information sheet students answered “yes” or “no” to giving their consent to participate in the study. Data was collected by The Ohio State research team using Qualtrics survey software. Out of the 2,000 randomly selected, full time, undergraduate students selected to participate from this university in the Pacific Northwest, 347 completed the survey (n = 347) for a response rate of 17.4%.
Results
Descriptive demographic statistics were obtained from the data set. Of those who completed the survey (n = 347), 97 participants reported their gender as “male”, 196 as “female”, two as “transgender”, two as “self-defined”, and the remaining 50 either skipped this question or preferred not to answer. When asked their race/ethnicity, most of the participants (80.1%) selected “White”, with the next three highest percentages being “more than one race or ethnicity” (7.6%), “Hispanic or Latino(a)” (5%), and “Asian American/ Asian” (2%).
Data was recoded from the participants reporting their parents’ education and showed that 40% of the participants were first generation students. The number of years enrolled in higher education was evenly distributed with 20.9% in their 1st year, 18.5% in their 2nd year, 24.2% in their 3rd year, 20.5% in their 4th year, and 15.9% in their 5th or later year. Most participants (74.5%) were majoring in one field of study. The majority of participants (90.8%) reported GPA's of 2.0 or higher.
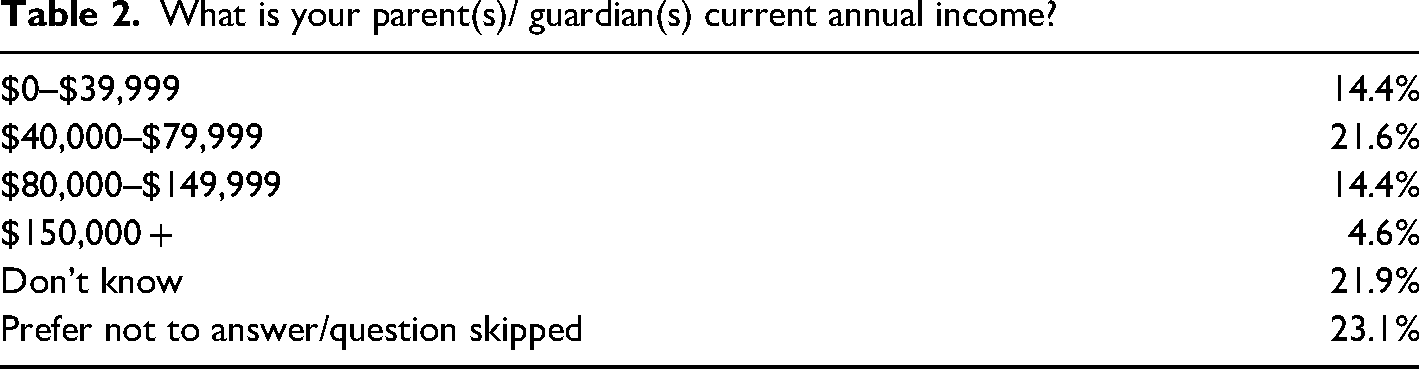
When asked about income, 22% of participants reported they did not know their parent/guardians’ current annual income. About 14% reported their parent/guardians’ current annual income as less than $40,000, about 22% reported income of $40,000–$79,999, about 14% reported income of $80,000–$149,999, and about 5% reported income of $150,000 or higher (see Table 2).
What is your parent(s)/ guardian(s) current annual income?
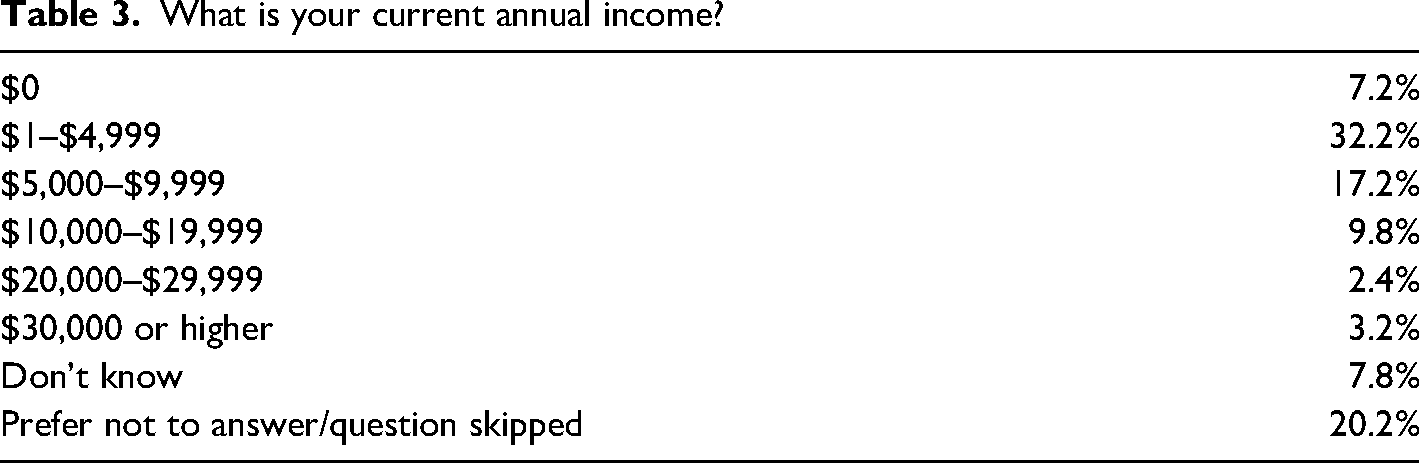
Participants were asked about their own employment and income. About half (50.4%) of the participants reported they were employed part-time, while about 5% reported full-time employment, 32% reported not being employed, and 13% either skipped or chose not to answer the question. When asked about their current annual income, about 8% reported they did not know, about 7% reported an income of $0, about 32% reported income of $1–$4,999, about 17% reported income of $5,000–$9,999, about 10% reported income of $10,000–$19,999 (see Table 3).
What is your current annual income?
Financial Behaviors
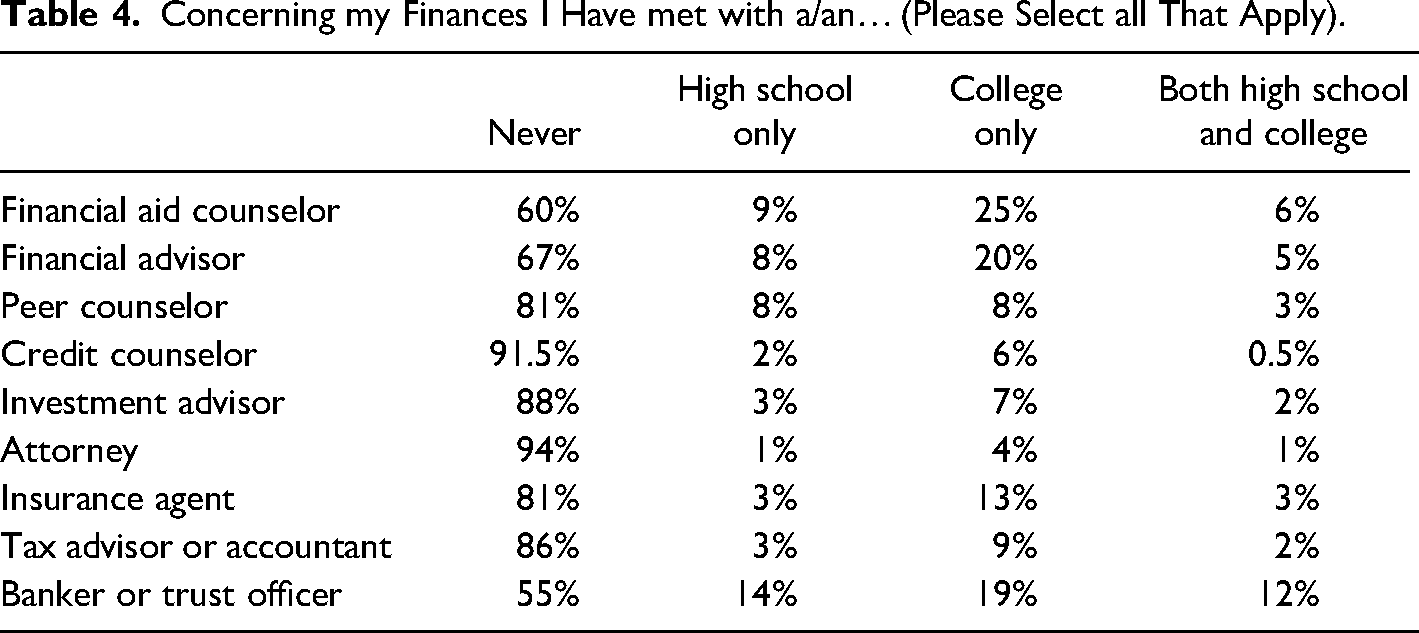
Most (70%) of these participants reported tracking their spending and about half followed a weekly or monthly budget. Although the majority reported always paying bills on time (77%), it is concerning that almost a quarter are often late making payments. These participants are very confident about their ability to manage their money well even though the majority (over 80%) have never met with a finance professional other than a banker or trust advisor (see Table 4).
Concerning my Finances I Have met with a/an… (Please Select all That Apply).
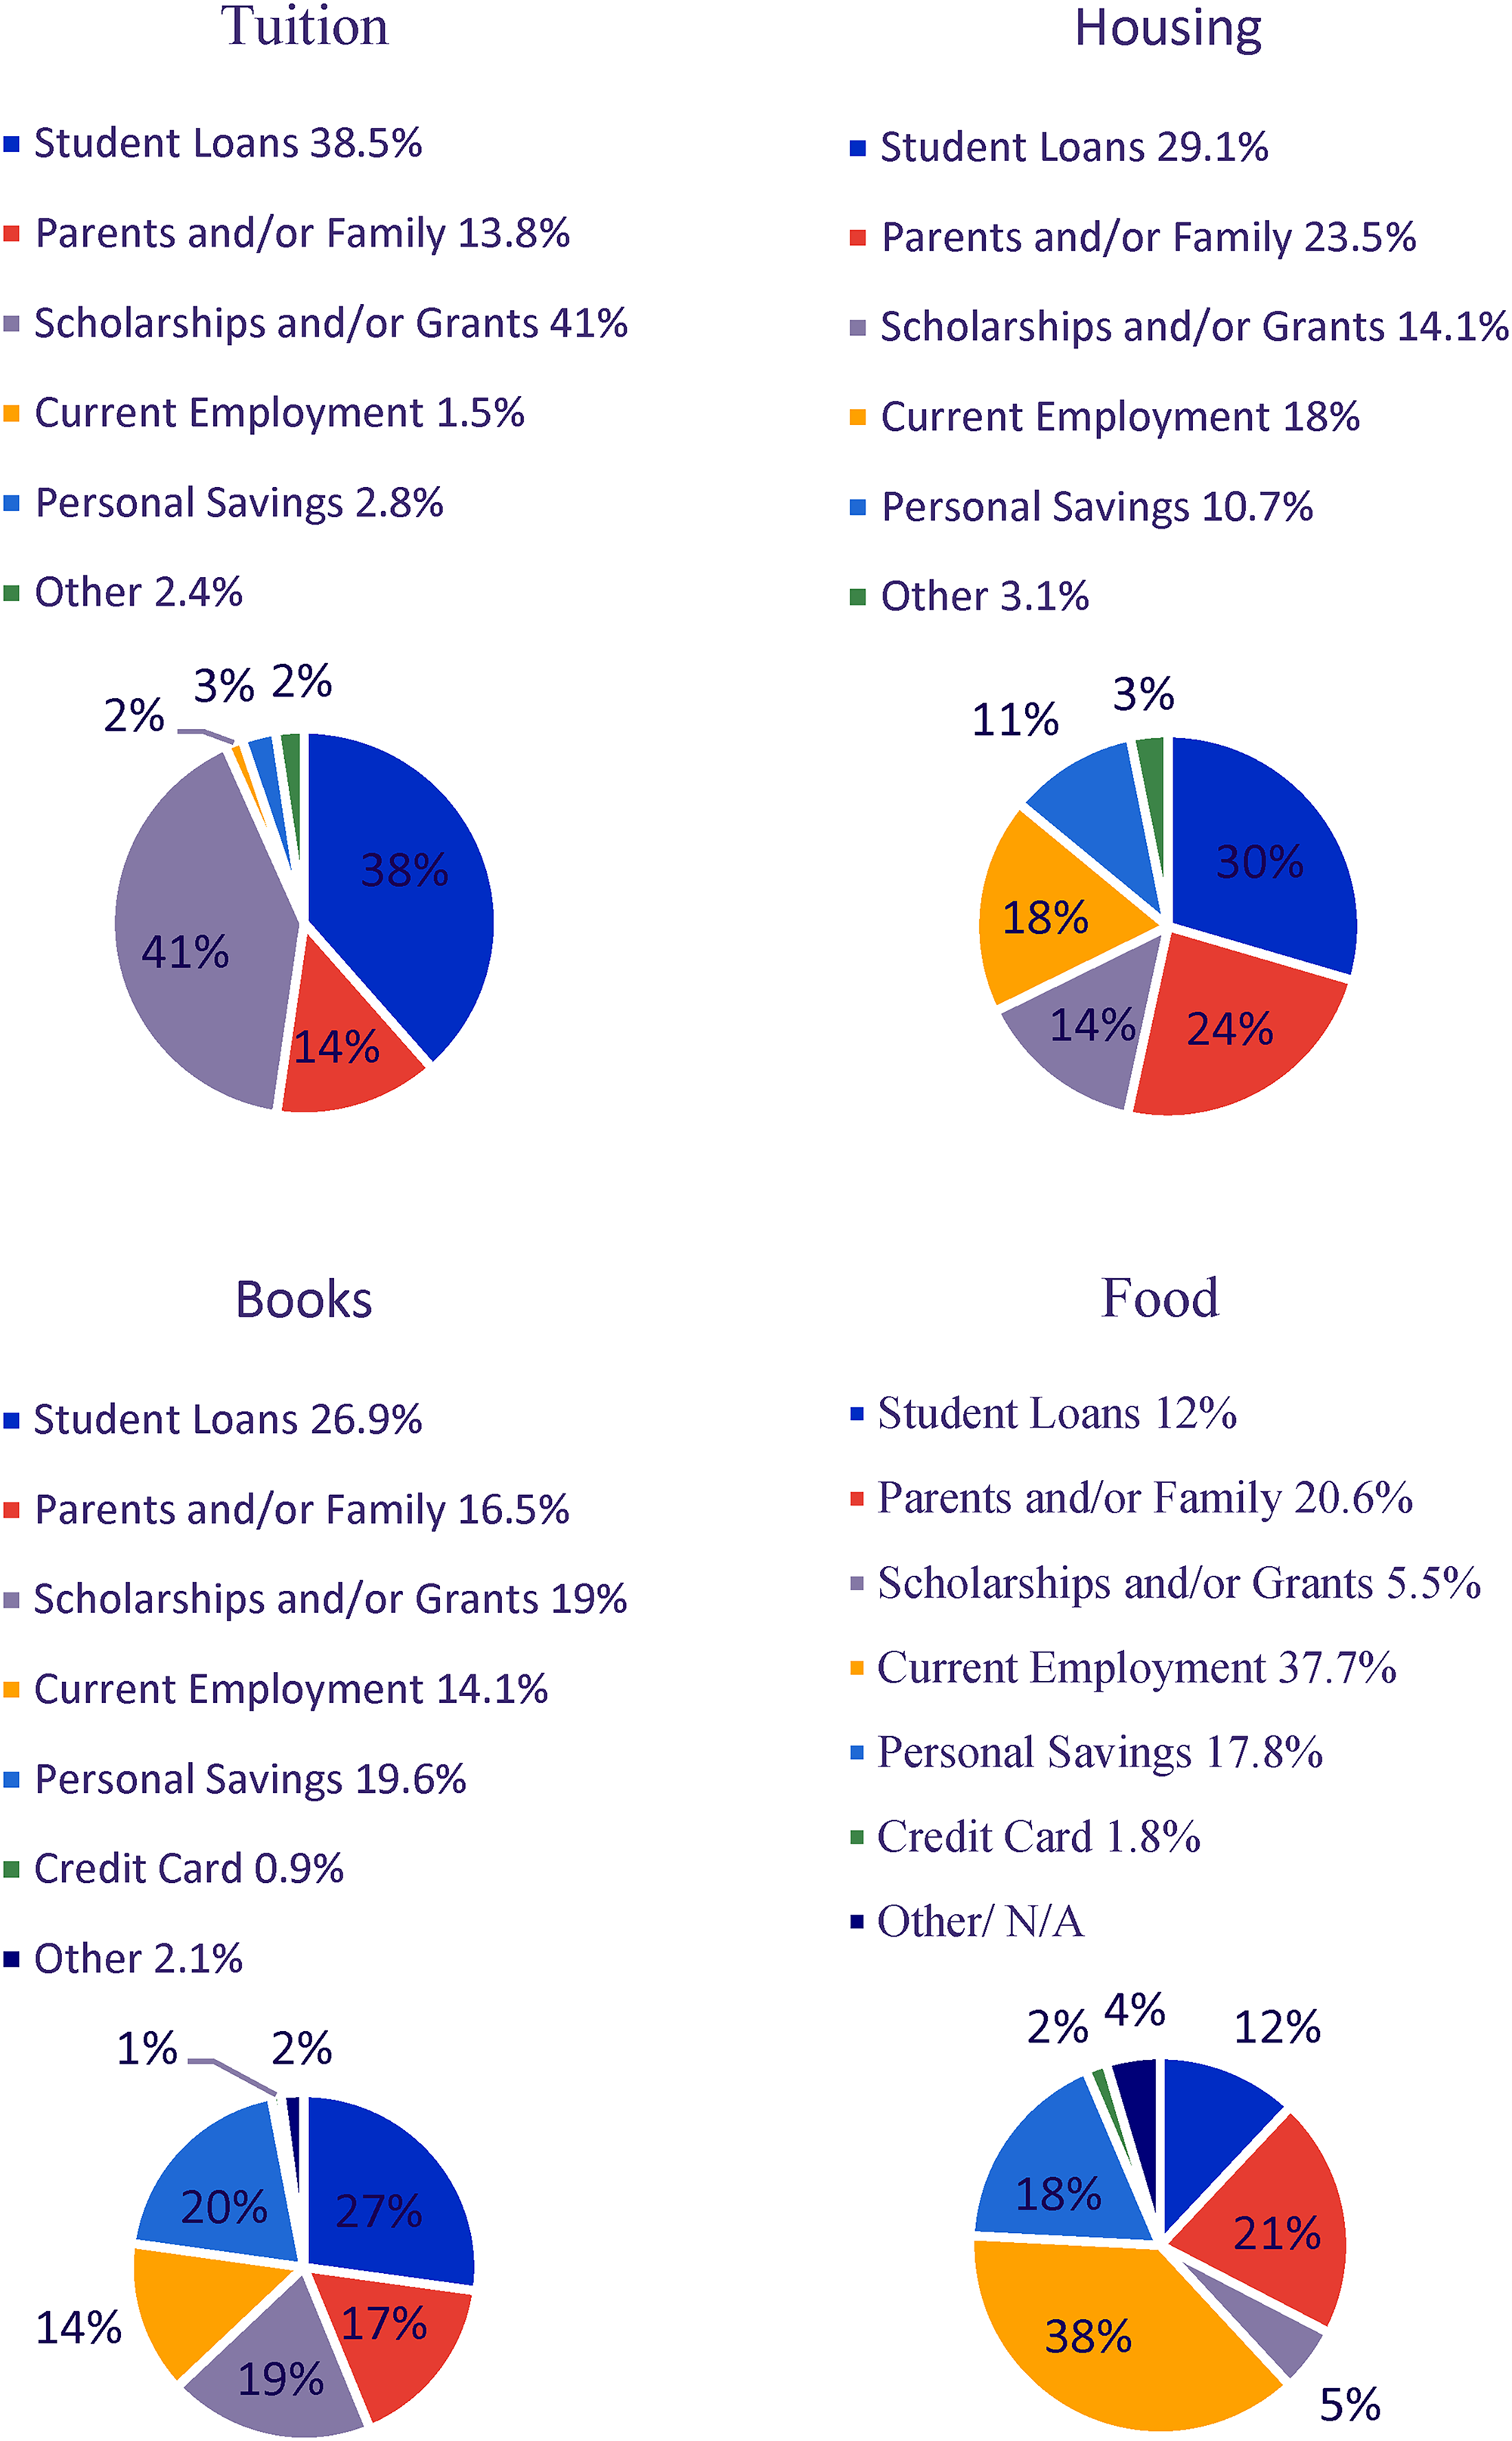
Over 90% of these participants reported receiving scholarship or grant aid to help pay for their education. Over 60% took out student loans, used current employment, and used personal savings to pay for their expenses. When asked about how they paid for school expenses, it seems that these participants were using their funds wisely. Over 50% received help paying for expenses from family members. It appeared that these participants used their student loans and scholarships/grants primarily for tuition, housing, and books. Food, entertainment, apparel, transportation, family expenses, and other expenses were primarily paid for by current employment and/or personal savings. Participants were asked to select their primary source of funding for multiple items (see Figure 1). Tuition was primarily paid with scholarships and/or grants (41%), followed by student loans (38%). Housing was primarily paid with student loans (30%) followed by parents and/or family support (24%). Student loans were primarily used to pay for books (27%), followed by personal savings (20%) and scholarships and/or grants (19%).
How participants Pay for college related expenses.
Family Influence
A large proportion of participants reported high levels of comfort and trust in their parents'/guardians' knowledge of money management. Still, nearly 25% of participants did not see their parents/guardians as good role models for money management. Almost 90% of participants were encouraged by their parents/guardians to save money and open a bank account. However, almost 70% of participants were not encouraged to invest. Although participants talked with their parents/guardians about money management, the vast majority did not take a personal finance class in either high school (66%) or college (80%).
Credit Card Debt
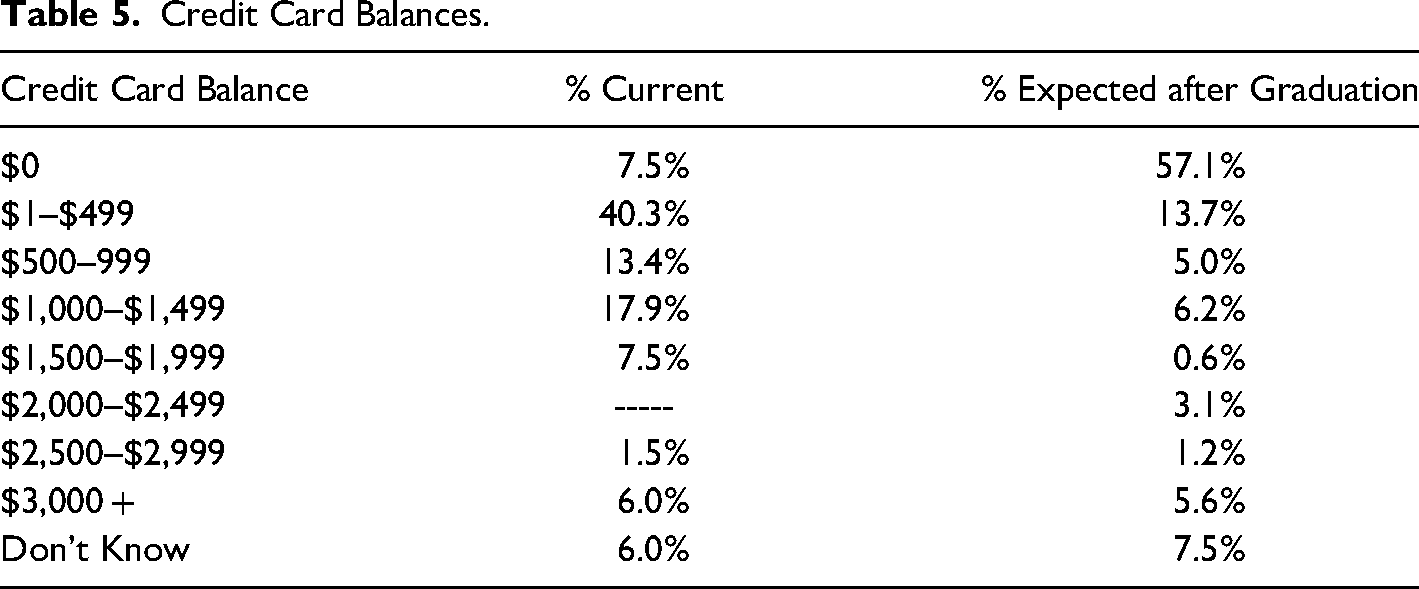
Of the participants surveyed, 51.1% reported having a credit card. Those participants were asked what the typical balance on their credit card was after they made their monthly payment. Most participants (40.3%) carried a balance in the $1–$499 range, 28.8% carried a balance between $500 and $1,999, only 1.4% carried a $0 balance, and 6% carried $3,000 or more. However, there is a discrepancy in the participants' report as 58% report paying off their credit card balance in full when they received the bill. Fifty-seven percent did not expect to have credit card debt at the time of graduation, and then 14% expected to have between $1- $499, which meant 29% expect to have more than $500 in credit card debt when they graduate (see Table 5).
Credit Card Balances.
Student Loan Debt
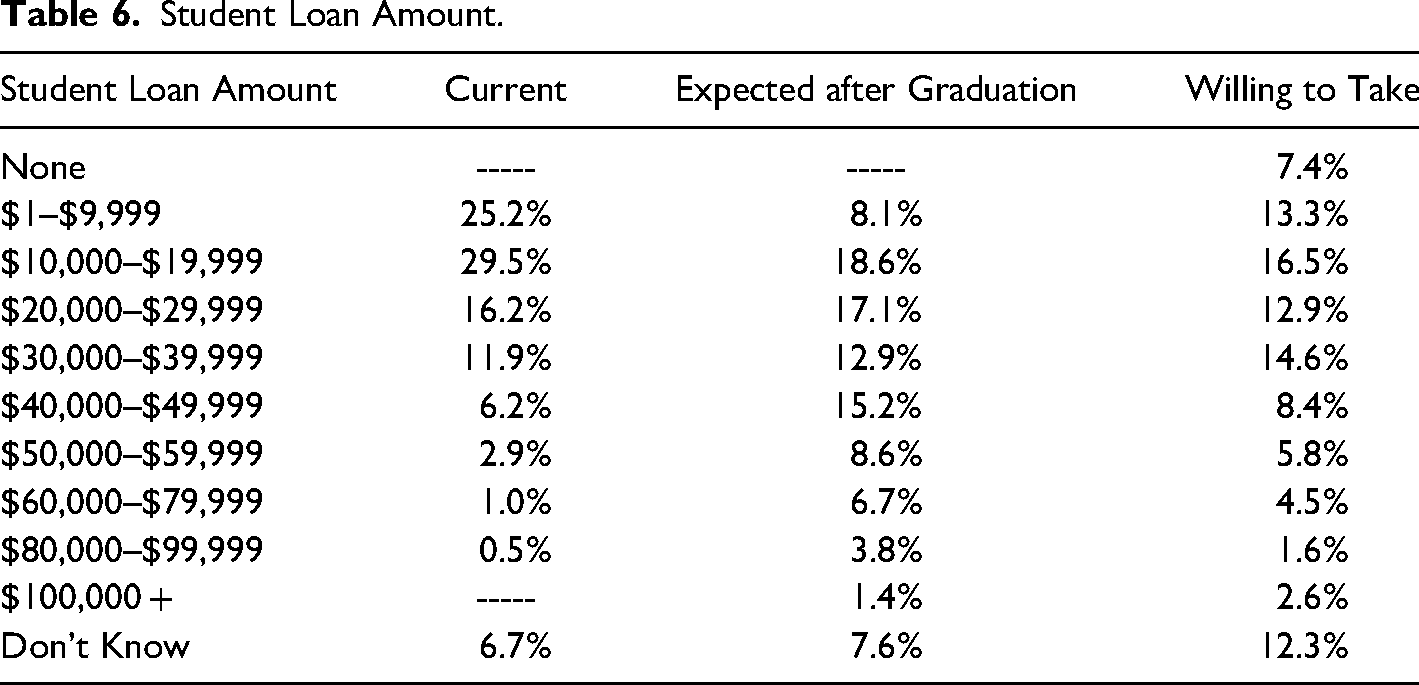
When asked about student loans, 66.8% of participants reported currently having student loans, the majority being federal loans. Participants were asked how much they had in student loans now and the highest percentage (29.5%) fell in the $10,000- $19,999 range closely followed by 25.2% in the $1- $9,999 range. Over 10% of participants had $40,000 or more in student loan debt and 6.7% reported not knowing how much they owed. When asked how much student loan debt they expected to have after graduation, the highest percentage (18.6%) was $10,000–$19,999 range, followed closely by 17.1% in the $20,000–$29,999 range and 15.2% in the $40,000–$49,999 range. Even more participants (7.6%) did not know the amount of student loan debt they expected to graduate with. Eighty percent indicated they were willing to take on some student loan debt to complete their degree; 23% were willing to take on $40,000 or more (see Table 6).
Student Loan Amount.
Overall, when thinking about taking out student loans, the participants considered budgeting and wanting to take out the least amount needed, but 25% reported simply taking out the maximum amount of student loans. When asked to answer “yes” or “no” regarding how they decided on the amount to borrow, the participants mostly decided on their own (60%) or consulted with a family member (53.8%). Eighteen percent of the participants do not think they will be able to pay off their student loans once they graduate.
Degree and Career Choice
Over 60% of this population reported that the amount of student loans they expected to graduate with influenced their current degree choice, as well as their career decision after their current college experience. The actual cost of college influenced their choice of institution (76%) and considering available financial aid (loans as well as grants/ scholarships) influenced of their degree choice (over 80%). Although they are willing to take on loans, 69% say it is moderately or very important to graduate with little or no debt. Forty percent of this population expected to take longer than the traditional four years for their degree, but the majority (over 80%) place importance on graduating on time or as soon as possible and graduating with a high GPA.
Most participants (75%) worked while in high school, but this number drops to 60% who reported working at least part time while enrolled at the college level. This left 40% not making any income during the school year. Although a good portion of participants reported not working while enrolled, 96% placed importance on their degree preparing them for the job market.
Other Debt
Participants were also asked if they currently had any debt including student loans, credit cards, car loans, personal loans, or any other type of credit or loan debt. Over 63% reported having the formerly described debt while 2.9% reported that they did not know.
Stress and Finances
Several questions were asked regarding stress and finances. When asked if they felt stressed about their personal finances in general, 78% of participants responded with “agree” (44.2%) and “strongly agree” (33.9%) to feeling stressed. Over 38% of participants reported the stress from accruing student loans caused them “large amounts” (25.3%) or “extreme amounts” (13.2%) of stress. Only 10.9% of participants reported the stress from accruing credit card debt caused them “large amounts” (4.3%) or “extreme amounts” (6.6%) of stress. About 44% of participants reported the stress from the total amount of money owed caused them “large amounts” (24.3%) or “extreme amounts” (19.4%) of stress.
Of the main population, the participants reported that stress impacts their college decisions regarding taking a break from college, dropping out, or transferring to a different institution. When asked if stress from the amount of money owed ever cause them to actually take a break from college/university, 12.7% answered “yes.” When asked about actually dropping out 4.0% answered “yes,” and when asked about actually transferring to another institution 11.8% answered “yes.” These may initially seem like small percentages, but one should be concerned that debt is causing so much stress that students are willing to make potentially life altering changes to decrease that stress.
Stressed Population
This study specifically aimed to analyze those students who reported being stressed. To do that, data analyses were focused on those participants who responded with “agree” or “strongly agree” when asked if they felt stressed about their personal finances in general (N = 242). Of those, 57% “agreed” with feeling stressed about their personal finances in general and 43% “strongly agreed.”
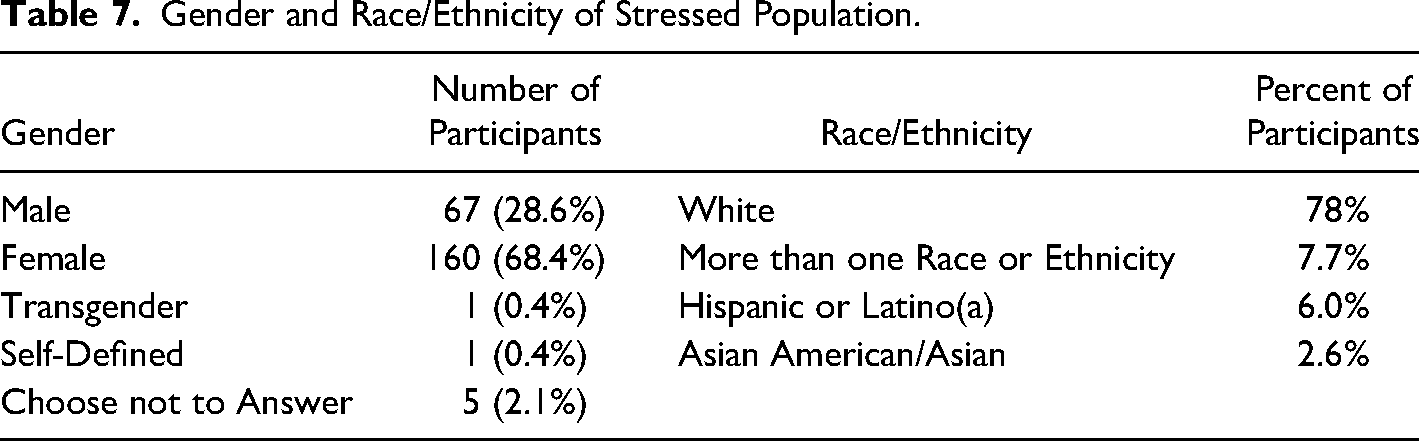
This stressed population reported their gender as 160 “female,” 67 “male,” one “transgender,” one “self-defined,” and five who preferred not to answer. In other words, 81.6% of females and 69% of males from the main population are stressed. When asked about “race/ethnicity” this population was mostly “White” (78%), with the next highest percentage being “more than one race or ethnicity” (7.7%), “Hispanic or Latino” (6%), and 2.6% “Asian or Asian American” (see Table 7).
Gender and Race/Ethnicity of Stressed Population.
Like the main population the number of years was evenly distributed, with slightly more in their third or later year: 19.7% 1st year, 17.9% 2nd year, 24.8% 3rd year, 22.6% 4th year, 15% 5 or more years. Just under 78% reported majoring in only one field of study, with 65.4% reporting a GPA in the 3.0–3.99 range, and 27.1% in the 2.0–2.99 range.
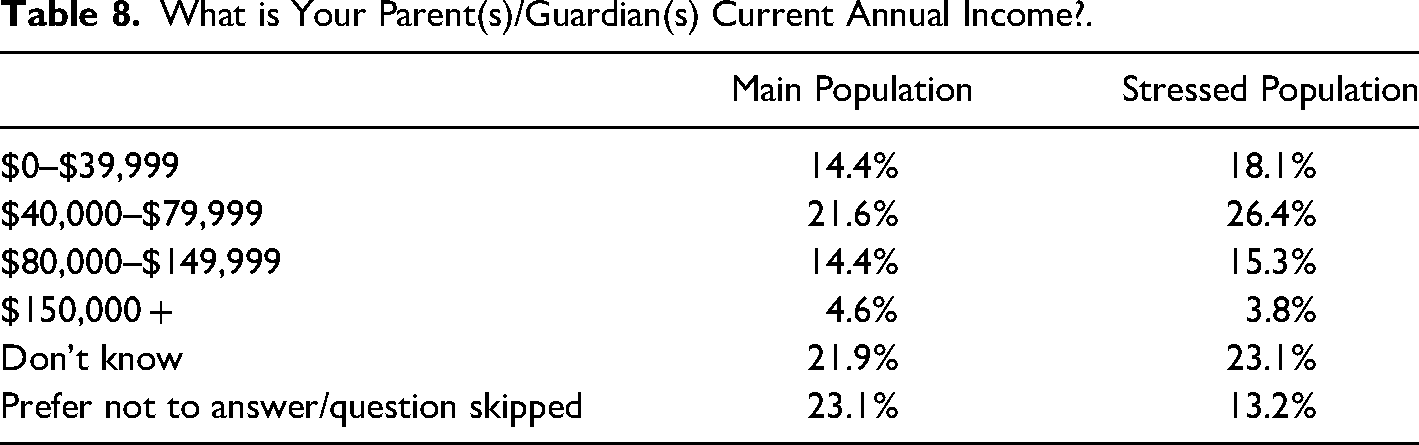
Reported parent/guardian income and self-income was also like the main population, with slightly more participants (8.5%) reporting parent/guardian income below $80,000 (see Table 8).
What is Your Parent(s)/Guardian(s) Current Annual Income?.
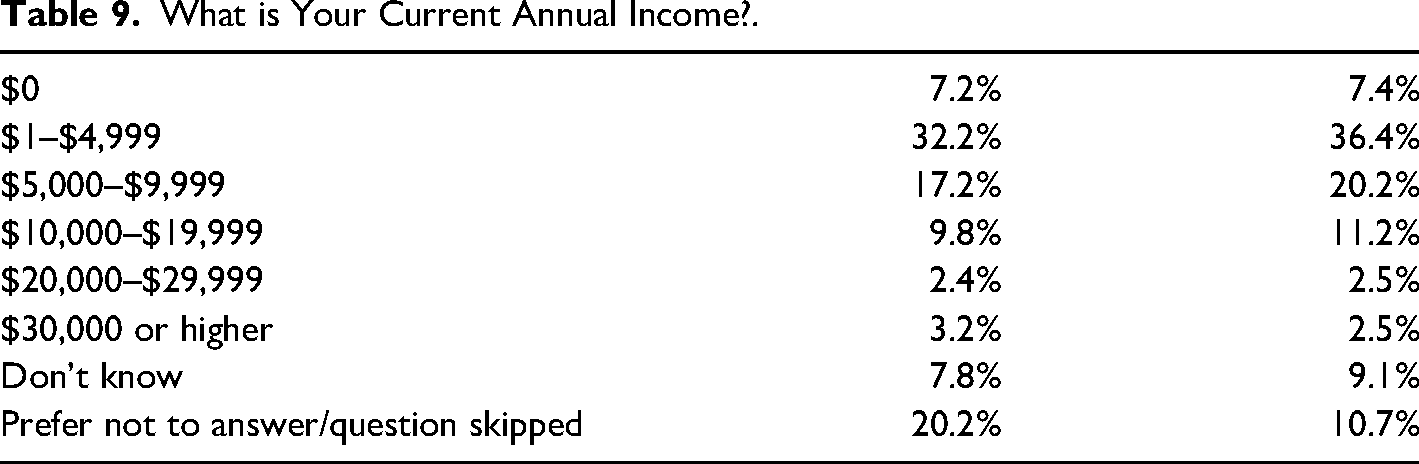
Employment status was very similar with only slightly more of these stressed participants reported being employed part-time (58.1% vs. 50.4%). When asked about their current annual income the percentages were very similar to the main population, with the biggest difference being that a larger percentage of the stressed population chose to answer the question. This seems to indicate that neither parental nor self-earned income or employment status have a strong impact on the reported levels of stress (see Table 9).
What is Your Current Annual Income?.
Of the stressed population, 47.5% reported having at least one credit card (51.1% of main population had a credit card). When asked about the typical balance left on their credit cards after making the monthly payments, 37.9% reported a balance of $1–$499. Slightly more reported a balance of $0 (5.2%) than the main population (1.4%), but like the main population 6.9% reported not knowing.
Of this stressed population, 73.4% reported having student loans compared to the 66.8% from the main population. The largest percentage of the stressed population (29.8%) reported having $10,000–$19,999 in student loans up to this point in time, and 25.3% had $1–$9,999. Over 10% reported having $40,000 or more in student loans and 6.7% did not know how much they owed.
When asked if they currently have debt from any source such as credit cards, student loans, car loans, personal loans, or any other type of credit or loans, 71.5% of this stressed population reported having this type of debt compared to 63% of the main population. Like the main population, approximately 3% did not know if they had this type of debt.
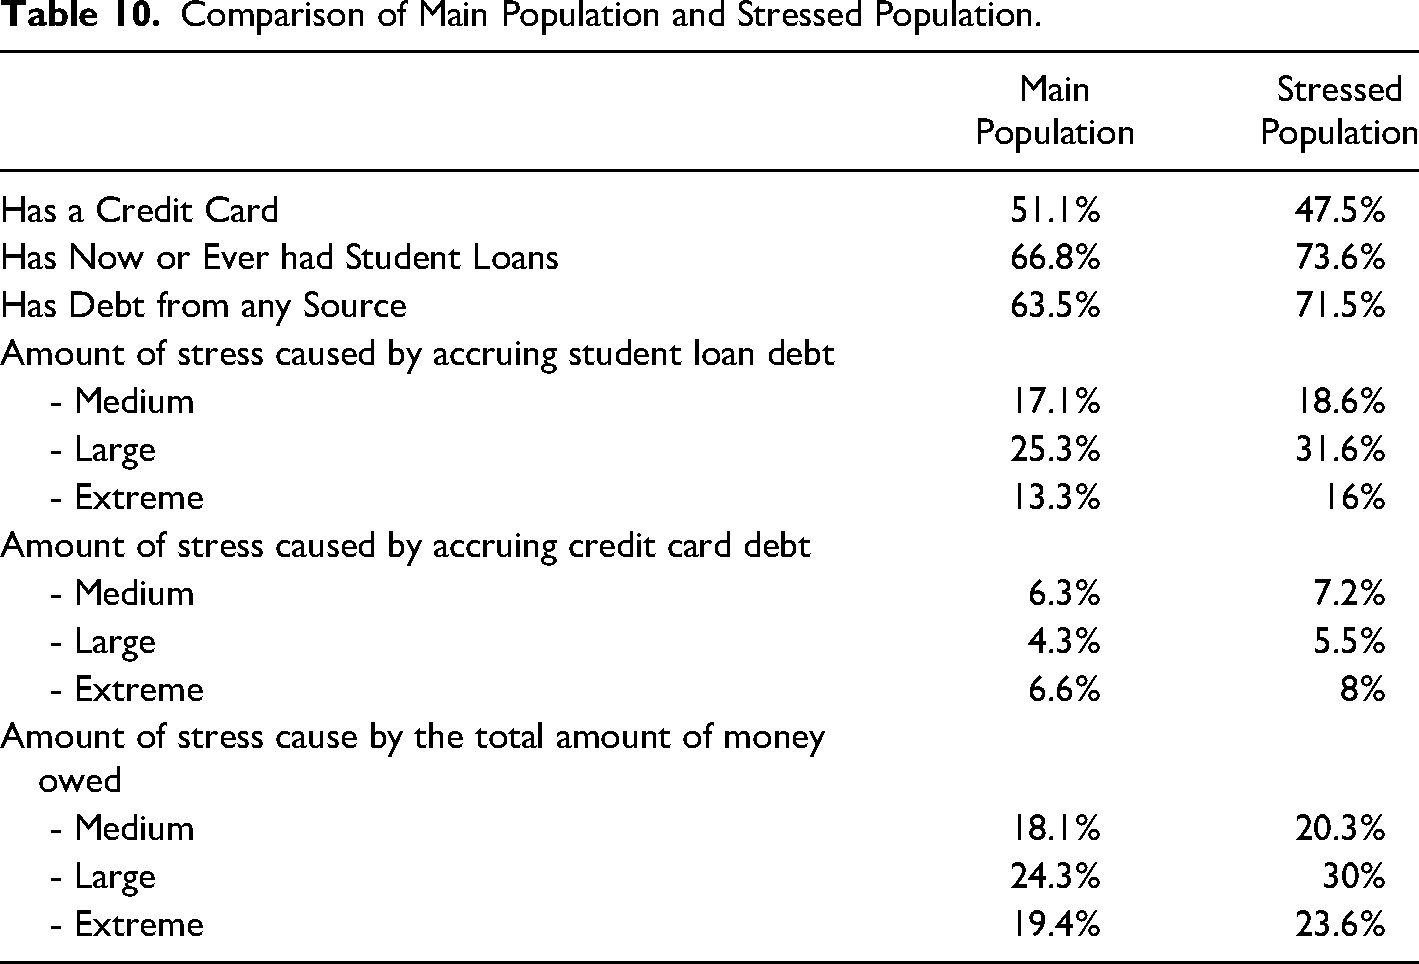
For the questions asking about participants' level of stress in different areas, 31.6% of this stressed population reported that accruing student loan debt caused them “large” amounts of stress, and 16% reported “extreme” amounts of stress. Together this is almost 10% more than the main population. When asked about stress caused by the accruing credit card debt, 13.5% of the stressed population reported “large” or “extreme” amounts. This is only about 3% more than the main population. When asked about their level of stress regarding the total amount of money owed, 30% of the stressed population reported “large” amounts of stress and 23.6% reported “extreme” amounts. Again, together this is almost 10% more reported stress than the main population (see Table 10).
Comparison of Main Population and Stressed Population.
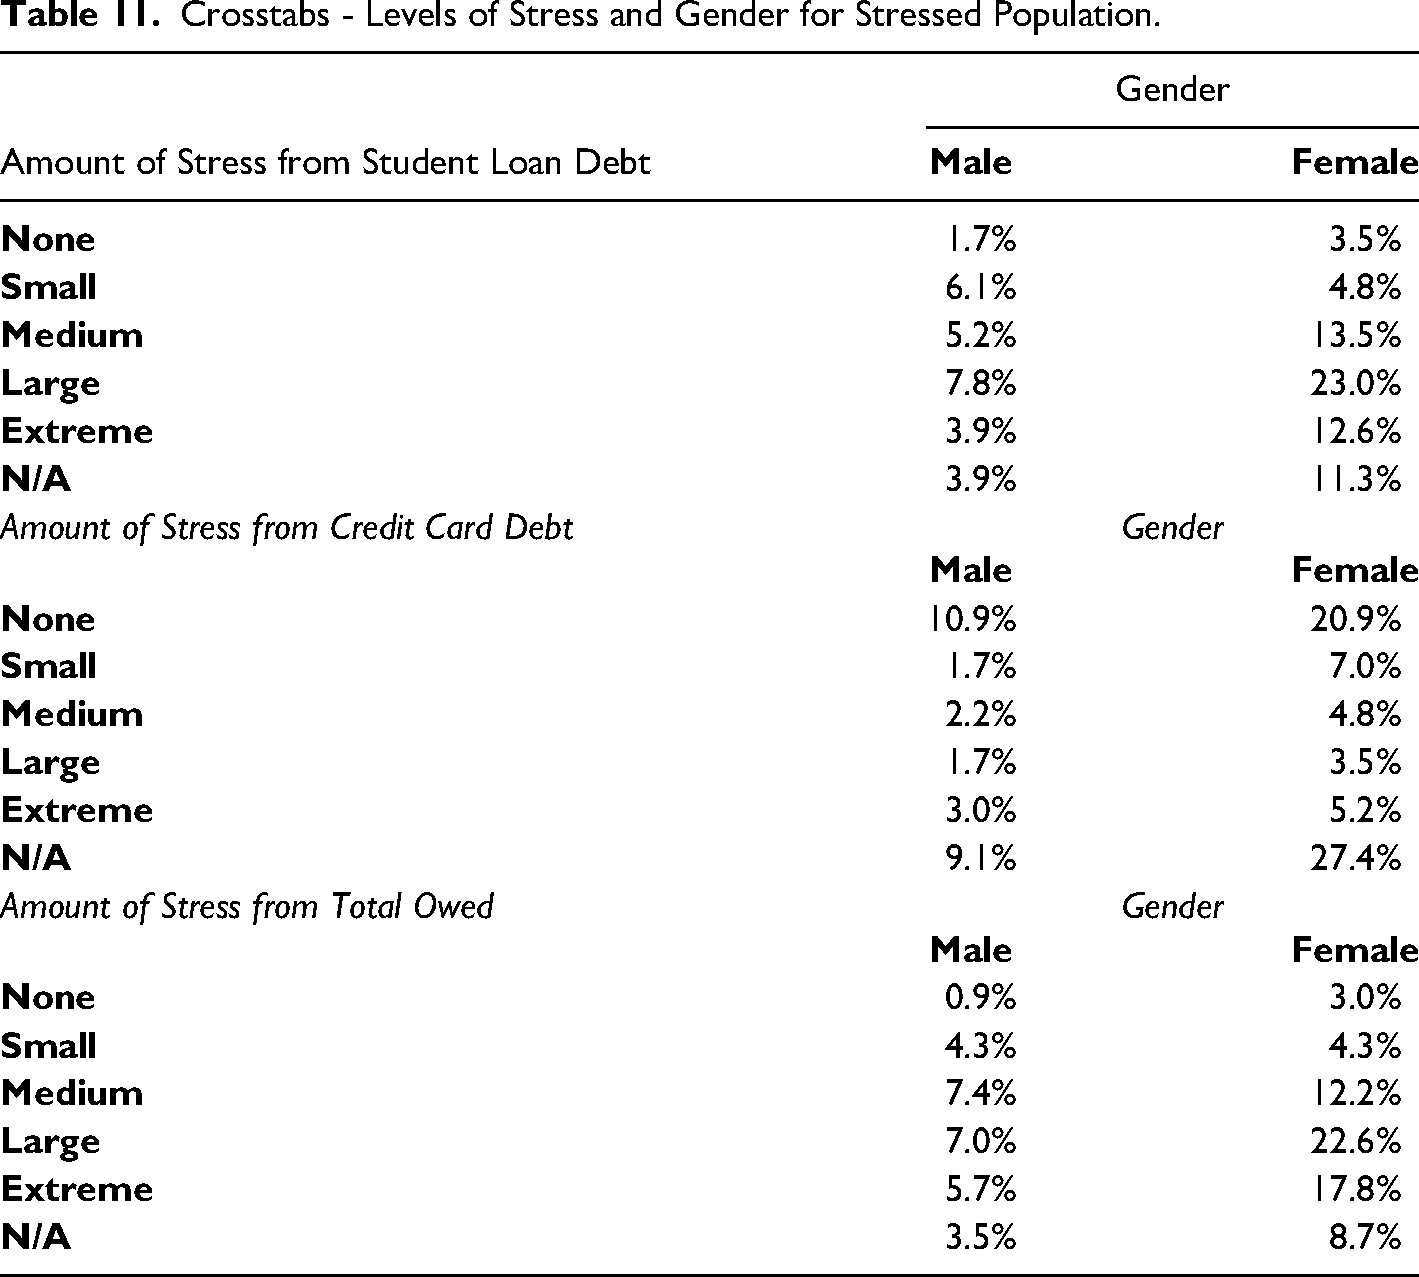
To further understand this stressed population, cross tabulations examined the participants' reported stress levels and their gender (see Table 11). Due to low numbers of responses in the categories of “Transgender,” and “Self-defined,” only “Female” and “Male” responses were evaluated. Females reported over three times as much “large” and “extreme” amounts of stress from student loan debt than males. For credit card debt, the stress levels were low for both genders, but females still had higher levels of stress. When considering stress from the total amount owed, females again reported three times as much “large” and “extreme” amounts of stress than males. It is important to keep in mind that this stressed population had more female (68%) participants than male (29%).
Crosstabs - Levels of Stress and Gender for Stressed Population.
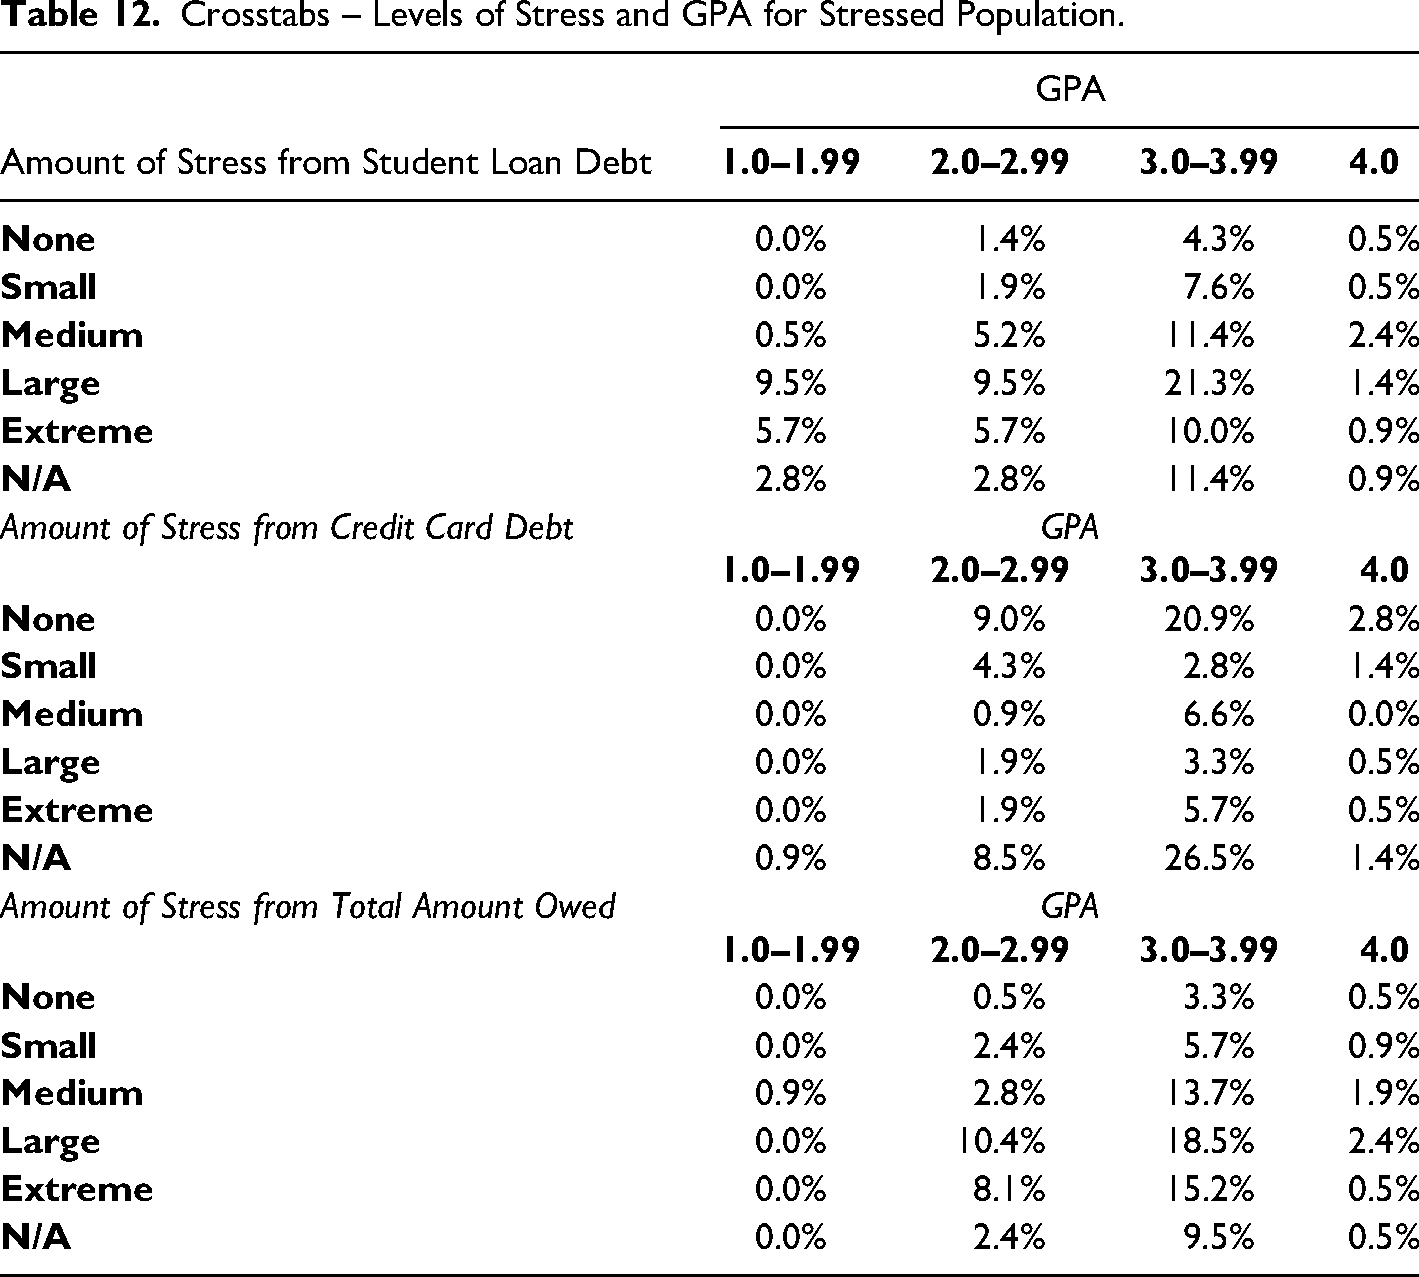
Cross tabulations also examined the reported stress and reported cumulative GPA's (see Table 12). It appears that the most stressed participants have GPA's in the 3.0–3.99 range, which is to be expected since the majority have GPA's in that range (65.4%). Very few stressed participants are in the 1.0–1.99 range and the 4.0 range. There is more reported stress from student loan debt and the total amount owed than from credit card debt.
Crosstabs – Levels of Stress and GPA for Stressed Population.
For data analyses, Pearson's Chi-Square tests were performed comparing the observed versus expected responses of stress attributed to student loan debt and the decision to reduce class load, consider dropping out, or consider taking a break. Significance was found on all levels indicating there is an association of some kind between stress from student loan debt and the decision to reduce class load (p <.001), considering dropping out (p <.001), and considering taking a break (p <.001) (see Table 13).
Chi-Squares for the Stressed Population.
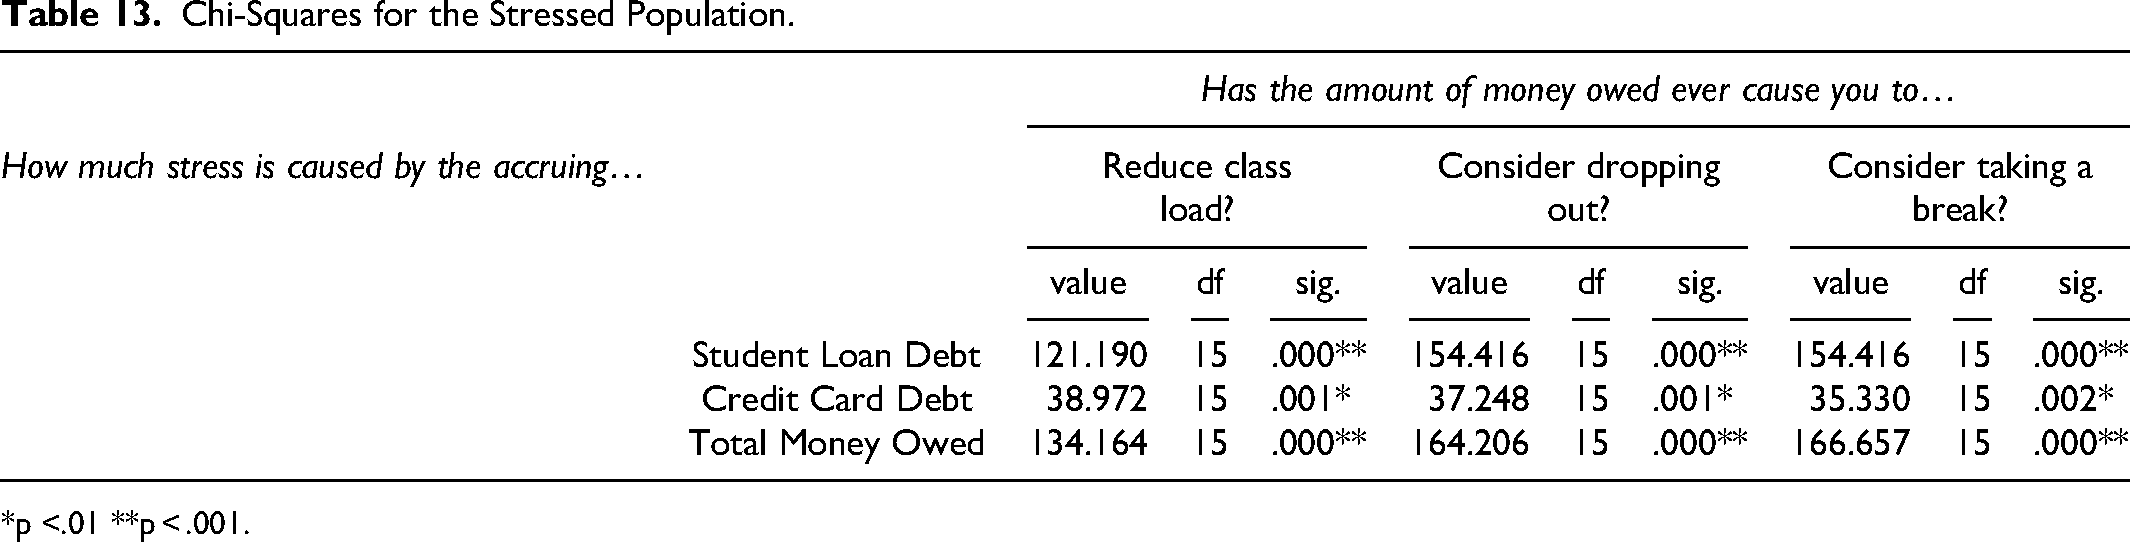
*p <.01 **p < .001.
More Chi-Square tests were performed to examine the relationship between stress attributed to credit card debt and the decision to reduce the class load, consider dropping out, or consider taking a break. Significance was found on all levels indicating there is an association of some kind between stress from credit card debt and the decision to reduce class load (p <.01), considering dropping out (p <.01), and considering taking a break (p <.01) (see Table 13).
Finally, Chi-Square tests were performed to examine the relationship between stress attributed to the total amount of money owed and the decision to reduce the class load, consider dropping out, or consider taking a break. Significance was found on all levels indicating there is an association of some kind between stress from the total amount of money owed and the decision to reduce class load (p <.001), considering dropping out (p <.001), and considering taking a break (p <.001) (see Table 13).
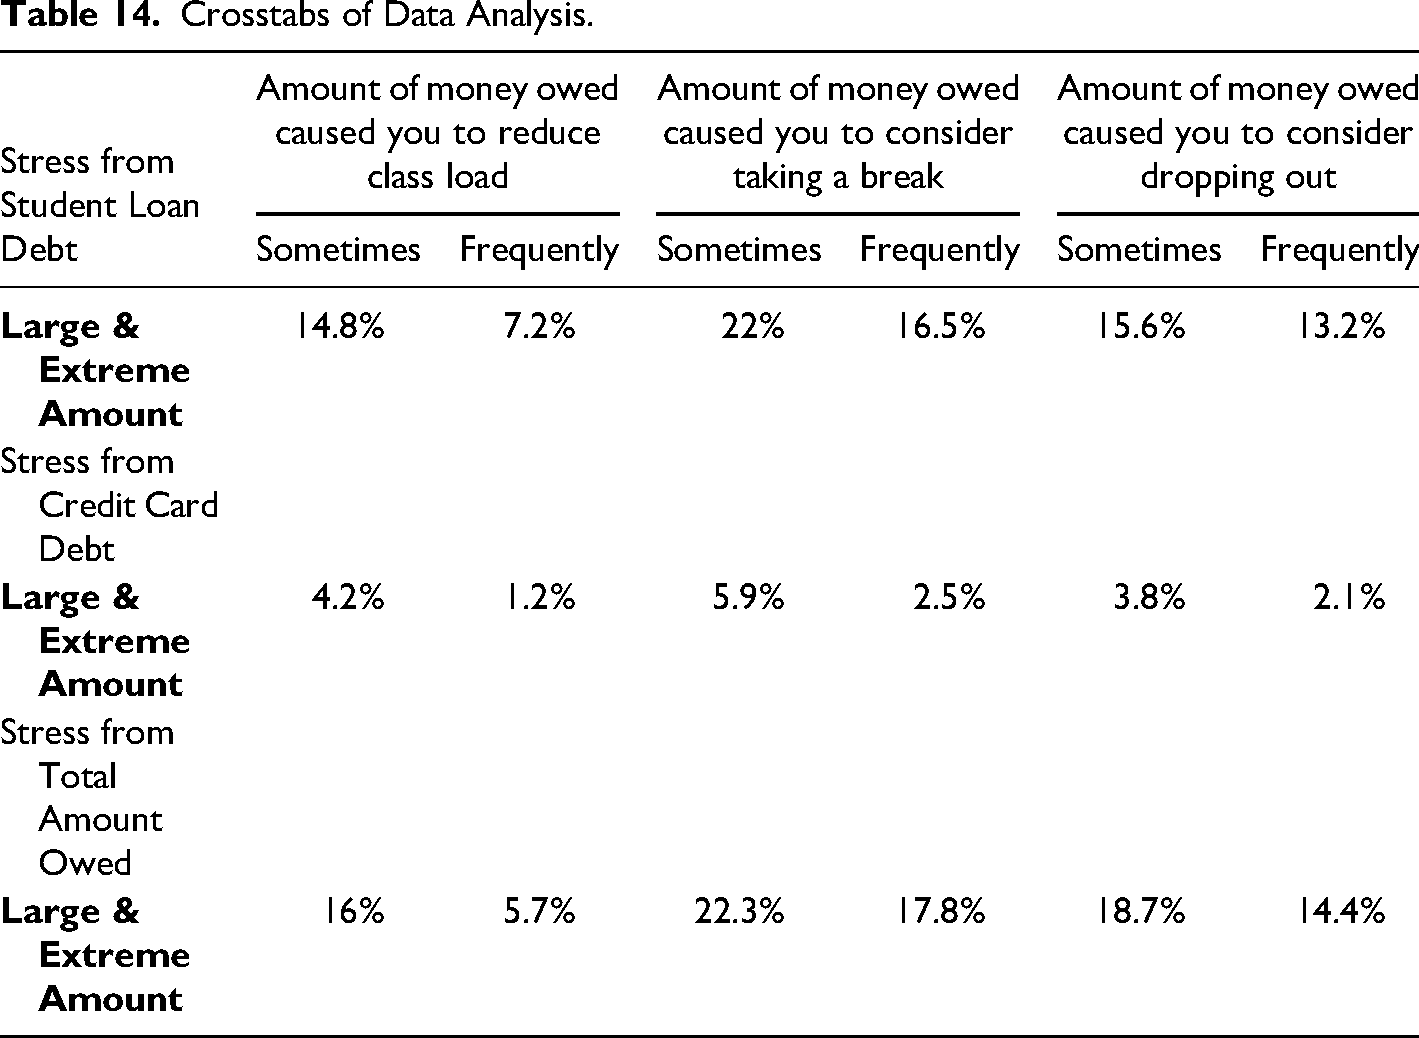
Table 14 demonstrates the significance and shows the cross tabulations from the analyses.
Crosstabs of Data Analysis.
Discussion
One interesting piece of this data is where these participants reported getting their money management information. Overall, these participants did not participate in high school or college personal finance courses or meet with professionals regarding their finance. Instead, over 70% reported agreeing that their parents/guardians taught them everything they needed to know about finances. Over 70% also view their parents/guardians as sound role models for money management. While we cannot label these participants as financially illiterate, more research could be done to examine the level of financial literacy.
Of the students surveyed at this university in the Pacific Northwest, 66.8% reported having student loan debt which is very close to the national average (69%). When deciding how much to borrow for the school year, 54% do not consider the total amount they will own upon graduation, and 63% do not consider the amounts they borrowed in the past. It is very worrisome that over half of participants are not thinking about their future when taking out more loans, nor are they considering how much they already have in loans. Only 25% have good idea of what their monthly student loan payment will be upon graduation.
Future research could look at why students are not considering the amounts they have taken out, and why so few are aware of what their monthly payment will be. This could be a lack of interest on the student's part, or it could be the institution or loan agency failing to make students fully aware of everything involved in taking out student loans.
It appears that these participants have a lower amount of consumer debt than the average American. They also report very little stress regarding their accruing credit card debt. This suggests that they are either managing their credit cards wisely or they have not yet had the time to accrue the amount of credit card debt that the average American has at this age. The worrisome numbers in this report are the 6% of students who do not know what credit card balance they carry, the 6% that carry a balance of $3,000 or more, and the 25% that report making late payments. This may initially seem like a small number not knowing their balance, but the fact that any consumer is unaware of their debt load should be concerning. Again, 6% may seem like a small number but undergraduates carrying $3,000 or more in credit card debt does not bode well for their financial future. Making late payments affects the credit score and could affect important life accomplishments such as their ability to rent an apartment on their own, purchase a car, get good interest rates, or purchase a home.
It is also interesting to consider how these participants are doing academically, demonstrated by their GPA's. The majority of this stressed population had a GPA in the 3.0–3.99 range (65.4%), which means that overall, these stressed students are performing well academically. Past research showed GPA to be a main factor in a student's decision to persist to a degree. Our current research shows that more of the highest performing students are potentially being dissuaded from completing their degree due to financial stress.
Limitations
It is important to note the limitations of this study. The sample is from one public University in the Pacific Northwest so results may not be applicable to all colleges and universities across the United States. The sample size is relatively small so may not be a representation of all students across the nation. This study also only surveys full-time undergraduate students so conclusions cannot be made about the population of part-time undergraduate students, graduate students, or students in terminal professional degree programs.
The survey itself has limitations. Since this is the first iteration of the survey there may only be Face Validity. It is designed as a self-reporting survey thus relying on the participants to have knowledge of their finances and be willing to honestly share that information. There are other factors that may influence a participant's financial wellness that were not included in this survey, so it cannot be assumed that this survey is all inclusive. The survey does not define terms for the participants so they could interpret questions differently than the writers' meaning.
Conclusion and Future Directions
University admission offices, recruitment, financial aid offices, and policy makers will likely be interested to see how financial stress impacts a student's college decisions. They will likely find it concerning that financial stress causes students to consider leaving the institution temporarily or permanently. Perhaps these results will motivate university administrators and student affairs staff to increase strategies to help students avoid or cope with that stress.
Students and parents will likely be interested to learn about the consequences of potential stressors to adequately prepare for the transition to college life. Knowing possible outcomes of taking on debt loads might help students and parents make more informed decisions when considering the cost of college, as well as deciding whether to take on consumer debt. Open discussions on the topic of stress caused by debt might also help students and parents recognize the signs of over indebtedness and be able to avoid becoming extremely indebted.
It should interest parents and educators that parents are a main source of financial education for their children. Many college students did not get financial management course in high school and are simply relying on any taught or observed financial skills from their parents. This is encouraging, but also worrisome. It should encourage parents to know their children are paying attention and that the parents can positively impact their children in financial matters. It is worrisome because not all parents are financially capable, or are staying up to date on the most rapidly changing world of personal finance. Extension educators could look for ways to assist parents so they can keep up to date with money management and know how to model sound financial management.
From this research, it appears that females feel more financially stressed than males, so campus outreach programs offering financial advice, counseling, and education could be offered specifically for females. This could be because females experience more stress, or perhaps males are not as comfortable discussing stress due to social stigmas. There could also be a gender issue influencing the level of stress felt by females due to uneven job salaries. Future research needs to be done on financial stress in other genders to ensure everyone is receiving adequate financial education.
Programs could also be developed to provide support and encouragement for those students who are doing well academically, but still feel heavily burdened by financial stress. These students might feel conflicted that their grades are good, but they still feel an exceptional amount of stress. These middle students can sometimes get lost in the all the programs geared toward helping those with lower grades. Programs could make sure they are including these students with good GPA's.
One way to potentially assist students in reducing their stress loads could be to require a personal finance class as a core requirement for all students. Becoming educated about finances and loan options would hopefully help students feel confident in their decision making and reduce the amount of stress they feel. This could lead to fewer dropouts, less time taking breaks and thus more speedy completion, and fewer students transferring for financial reasons. Overall, this could result in more successful, content college students as well as possible higher retention rates for university enrollment.
For educating college students on debt, it would be interesting to survey students about how they would like to learn such information. Research could be done to find the most effective and most preferred method of relaying personal finance information. This could be especially important for university policy makers to understand how students want to learn this information so they can create programs geared toward certain groups of students.
This research is just a small piece of the solution to college student attrition. Future research could look at stress levels by the student's year in school to see if stress increases or decreases with the student's time in school. Researching if stress levels increased with the amount of debt owed would also build on previous research and add to the picture.
It would also be advised to research a more racially and ethnically diverse population to obtain a better picture of how financial stress effects a broader demographic of students.
University programs need to support any student experiencing financial stress, educate them about debt from the moment they set foot on campus, and strive to give students the tools they need not only to perform well academically, but to have a firm financial foundation on which to build the rest of their lives.
Footnotes
Declaration of Conflicting Interests
The author(s) declared no potential conflicts of interest with respect to the research, authorship, and/or publication of this article.
Funding
The author(s) received no financial support for the research, authorship, and/or publication of this article.