






Abstract
Attrition among undergraduate students contributes to lower retention rates across U.S. higher education institutions (public and private colleges and universities), resulting in academic, financial, and institutional consequences. This scoping review maps evidence on the use of machine learning (ML) models to predict undergraduate student attrition in the United States. This review also appraises the quality of reporting in the included studies using the TRIPOD + AI checklist. We searched five electronic databases for articles covering this domain, and 14 studies met the inclusion criteria. This review mapped studies according to data sources, attrition indicators, patterns, ML models, and modeling techniques. Across the included studies, attrition varied from one semester to multiple years, and random forest and logistic regression were the most frequently used ML models. This review identifies attrition patterns, ML approaches used for predicting attrition, highlights implications for researchers and practice utilizing ML for attrition prediction, and proposes directions for future research.
Introduction
Attrition in higher education refers to students leaving an institution without completing their intended degree. It is a complex and systemic issue driven by multiple factors, including difficulty adjusting to college, financial challenges, lack of institutional support, lack of basic or physiological needs, mental health, and related factors (Lorenzo-Quiles et al., 2023). It may also involve student withdrawal from a course, discontinuing a program, not returning for the next academic semester/year, etc. Undergraduate student attrition remains a persistent challenge in higher education institutions, with consequences that extend beyond individual students to affect families, communities, and institutions (Tarmizi et al., 2019).
When students leave college before degree completion, institutions face financial and reputational impacts, while students often experience reduced economic opportunities and increased financial burden (Tarmizi et al., 2019). Schneider (2010) estimated that it costs more than $9 billion taxpayer dollars to educate first-year students who will not return the following year. The Education Data Initiative indicates that 39% of first-time, full-time bachelor's degree-seeking students do not attain a degree within 8 years, first-time, full-time freshmen have a 12-month dropout rate of 22.3%, and about 43.1 million Americans attended college but left without earning a degree (Hanson, 2025). This increasing population of individuals with some college experience but no degree necessitates mitigating attrition by complementing policy initiatives with methodologies for early identification and timely intervention, thereby improving student retention and degree attainment.
Theoretical Framework
One of the most studied topics in higher education is student retention (Tinto, 2006). Many theoretical frameworks for postsecondary student persistence, retention, and attrition have been proposed (e.g., Braxton et al., 2014; Dewberry & Jackson, 2018), but Tinto's models (e.g., 1975, 1993) are among the most frequently cited (Fung, 2010; Willis et al., 2023). Tinto's theory addresses multiple interacting factors influencing retention and graduation, including the institution's academic and social environment, institutional characteristics (e.g., size, resources), and student characteristics—from attributes students have when entering college to outputs such as graduation (Tinto, 1975). Researchers have built upon Tinto's model (e.g., DesJardins et al., 2002; Goble et al., 2008; Scott et al., 2006), resulting in what Tinto (2006, p. 1) describes as an “ever more sophisticated understanding of the complex web of events that shape student leaving and persistence.”
Applicability of Machine Learning in Predicting Student Attrition
Student attrition is complex (Tinto, 2006, p. 1), calling for advanced data analytic procedures. However, historical approaches to studying attrition in higher education have relied on limited data analysis (Corrigan et al., 2015). More recently, machine learning (ML) models are being used to better predict dropout, retention, and attrition rates (Chien et al., 2020; Bird et al. 2025; Matz et al., 2023) as ML allows for large numbers of data points to be examined, providing more accurate modeled predictions (Corrigan et al., 2015). Machine learning is a branch of artificial intelligence (AI) that involves the development of computer models capable of learning patterns from data and making predictions or decisions without explicitly programming (Kufel et al., 2023). At a high level, ML involves three main stages: (1) data preparation and organization, (2) model training using algorithms with tunable parameters (hyperparameters), and (3) deployment of trained models for prediction or decision-making (Steidl et al., 2023).
Machine learning models are broadly categorized into supervised and unsupervised learning. Supervised learning trains models on labeled data to predict outcomes, while unsupervised learning identifies patterns in unlabeled data (Kufel et al., 2023). In attrition research, supervised learning models such as logistic regression (LR), random forests (RF), support vector machines (SVM), and gradient boosting methods (GBM) are commonly used to predict whether a student is likely to drop out based on features such as grades, engagement, and demographics (Alturki et al., 2022; Cankaya et al., 2025), while unsupervised learning models such as k-means clustering and hierarchical clustering are used to cluster students into groups (e.g., high risk vs. low risk) based on similar behavioral or academic patterns (Delen et al., 2024; Matz et al., 2023).
In predicting at-risk students, institutions use ML to identify students at risk of academic struggle, withdrawal, or noncompletion by analyzing multidimensional data (e.g., grades, attendance, socioeconomic indicators, housing status, campus engagement patterns) (Kohun et al., 2024). After data are collected, cleaned, and transformed into predictive features, algorithms such as RF, SVM, and decision trees (DT) can detect complex, nonlinear patterns associated with attrition (Trivedi, 2022). The resulting models can generate risk scores that allow institutions to trigger timely and personalized intervention (e.g., tutoring, counseling) before students disengage or withdraw (Villegas-Ch et al., 2023).
Recent reviews have examined the use of ML models to predict student outcomes. Namoun & Alshanqiti (2021) reviewed published studies between 2010 and 2020 and found increased adoption of ML models for predicting student performance. Shafiq et al. (2022) conducted a literature review of studies published between 2017 and 2021 on ML use for student retention and academic outcomes, finding that supervised and deep learning approaches were commonly utilized. Although these studies reviewed ML in predicting student outcomes in higher education, their reviews focused on studies published before or up to 2021, and none focused exclusively on attrition in the United States.
This current study uses a scoping review methodology to investigate ML applications for predicting undergraduate student attrition in the United States. Scoping reviews are a type of evidence synthesis that uses a systematic approach to identify, map, and chart the breadth of available evidence on a topic, clarifying key concepts, characteristics, gaps, and determining areas where further research may be needed (Campbell et al., 2023; Tricco et al., 2016). This review maps data sources, ML models, model performance, and outcome measures used for predicting undergraduate student attrition while also examining reporting practices and methodological trends to inform future research and practice. The research questions addressed include:
What ML models have been used to predict undergraduate student attrition in higher education, and how have these models performed? What data sources and predictive factors are used in ML studies examining undergraduate student attrition? What methodological trends and research gaps exist in the current literature on ML approaches for predicting undergraduate student attrition?
Method
Search Strategy and Inclusionary Criteria
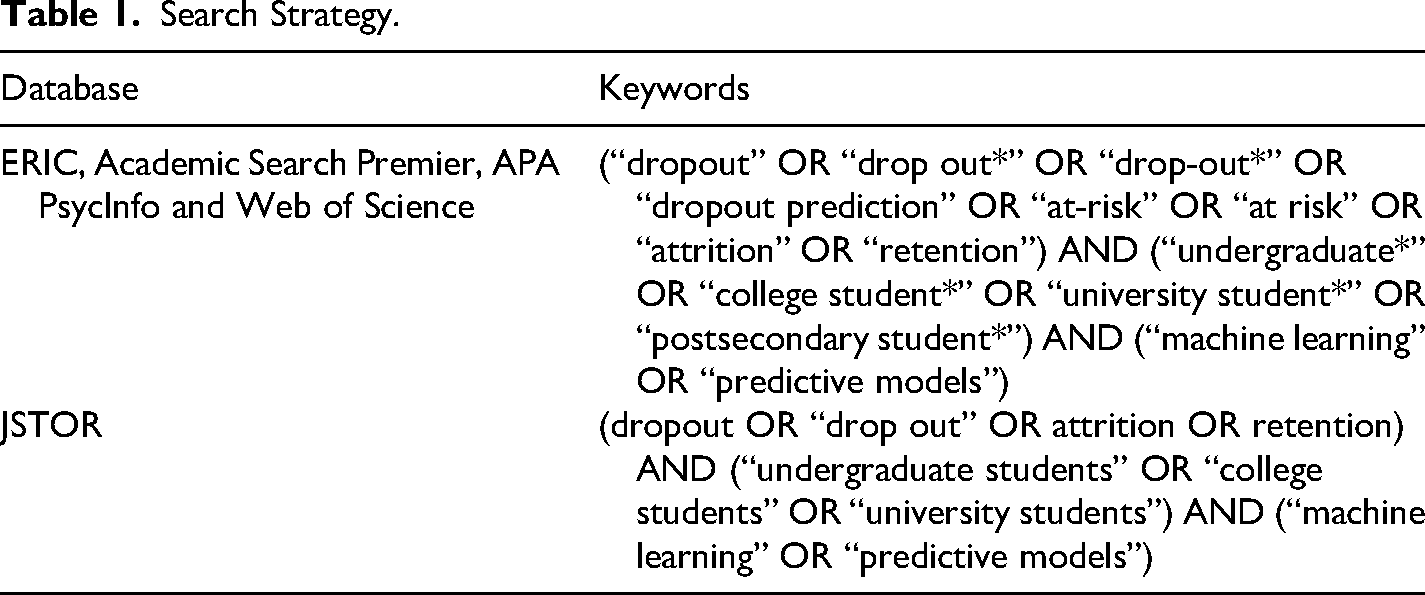
This scoping review followed the Joanna Briggs Institute methodological guidance for scoping reviews and reported in accordance with the PRISMA-ScR reporting guidelines, which detail the identification of search terms and search strategy (Page et al., 2021). Five databases commonly used in education and social science research, which index applicable studies, were searched: Academic Search Premier, APA PsycInfo, ERIC, JSTOR, and Web of Science. In developing search terms, we reviewed terms used in related studies (Alturki et al., 2022; Shafiq et al., 2022) to capture relevant studies on undergraduate student attrition, dropout, and at-risk or retention in higher education. See Table 1 for keywords used in the search strategy.
Search Strategy.
Screening and Data Extraction
This scoping review followed established best practices for systematic screening and data extraction (Polanin et al., 2019), including using predefined eligibility criteria and training screeners to conduct independent title/abstract and full-text screening to enhance consistency and reduce bias. Discrepancies between reviewers were resolved through discussion.
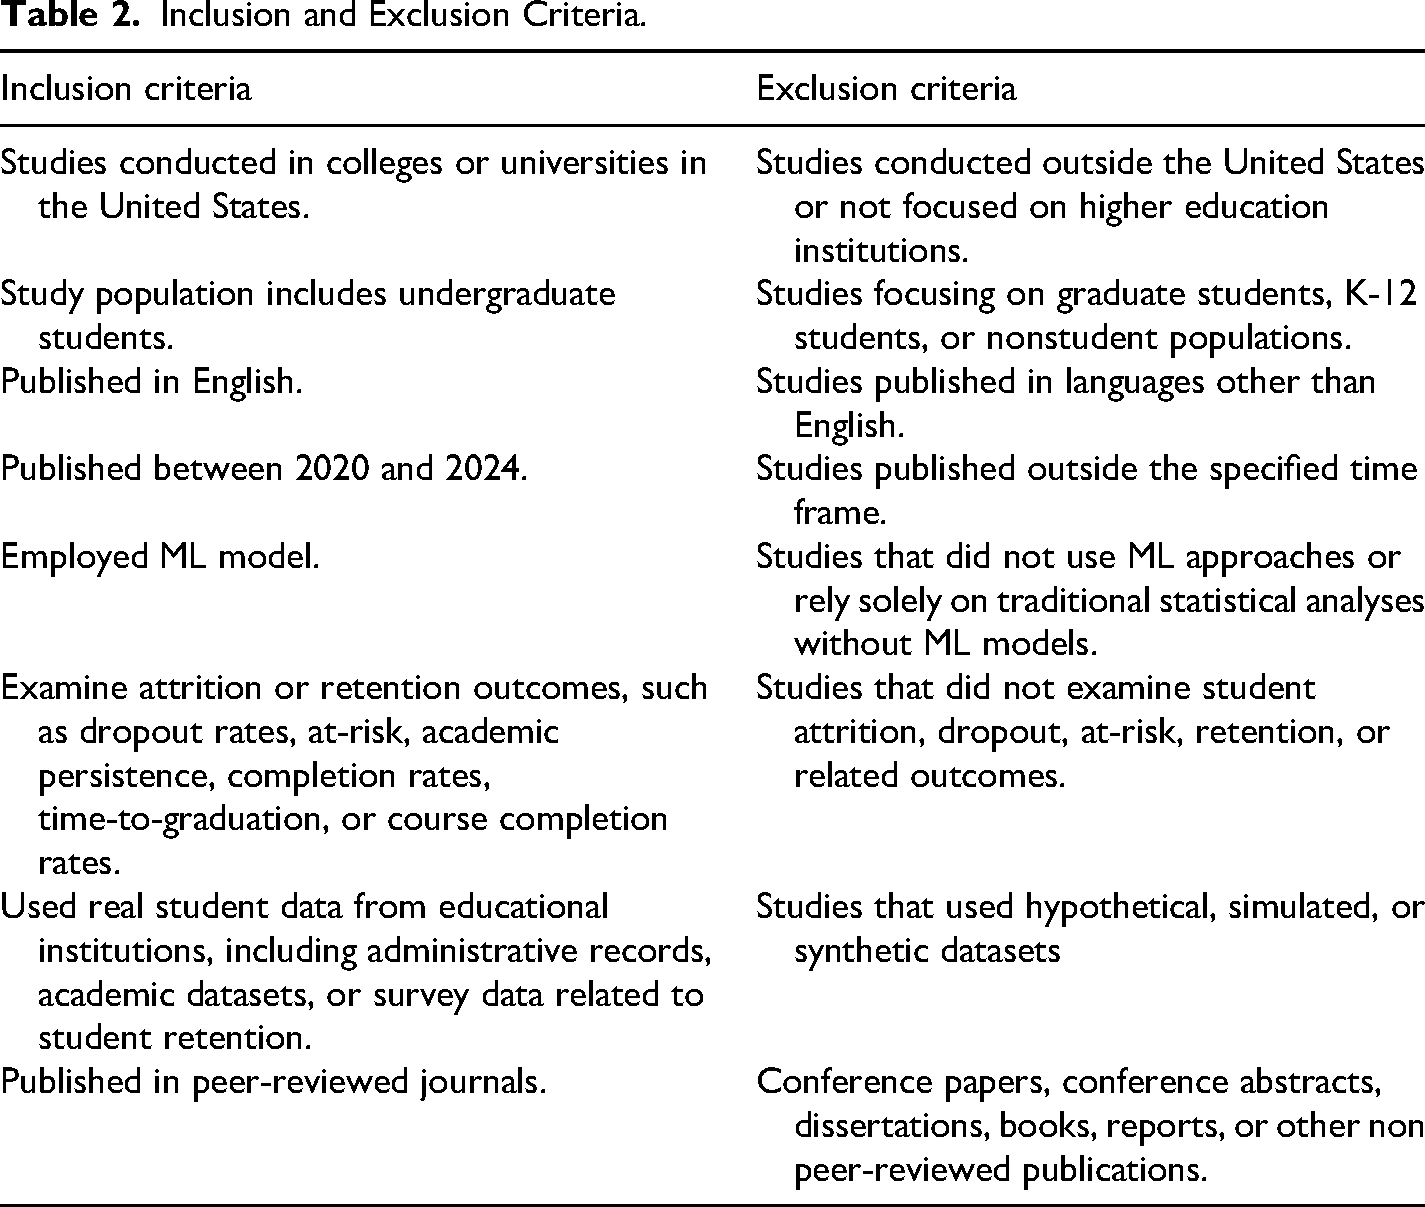
Studies were screened in two stages using Covidence. First, titles and abstracts were reviewed against the inclusion criteria (Table 2), and records that did not meet the criteria were excluded; second, full texts were assessed for final eligibility, with only studies meeting all criteria retained for the review. A PRISMA flowchart (Page et al., 2021), which provides an overview of the screening and exclusion process, is presented in Figure 1.
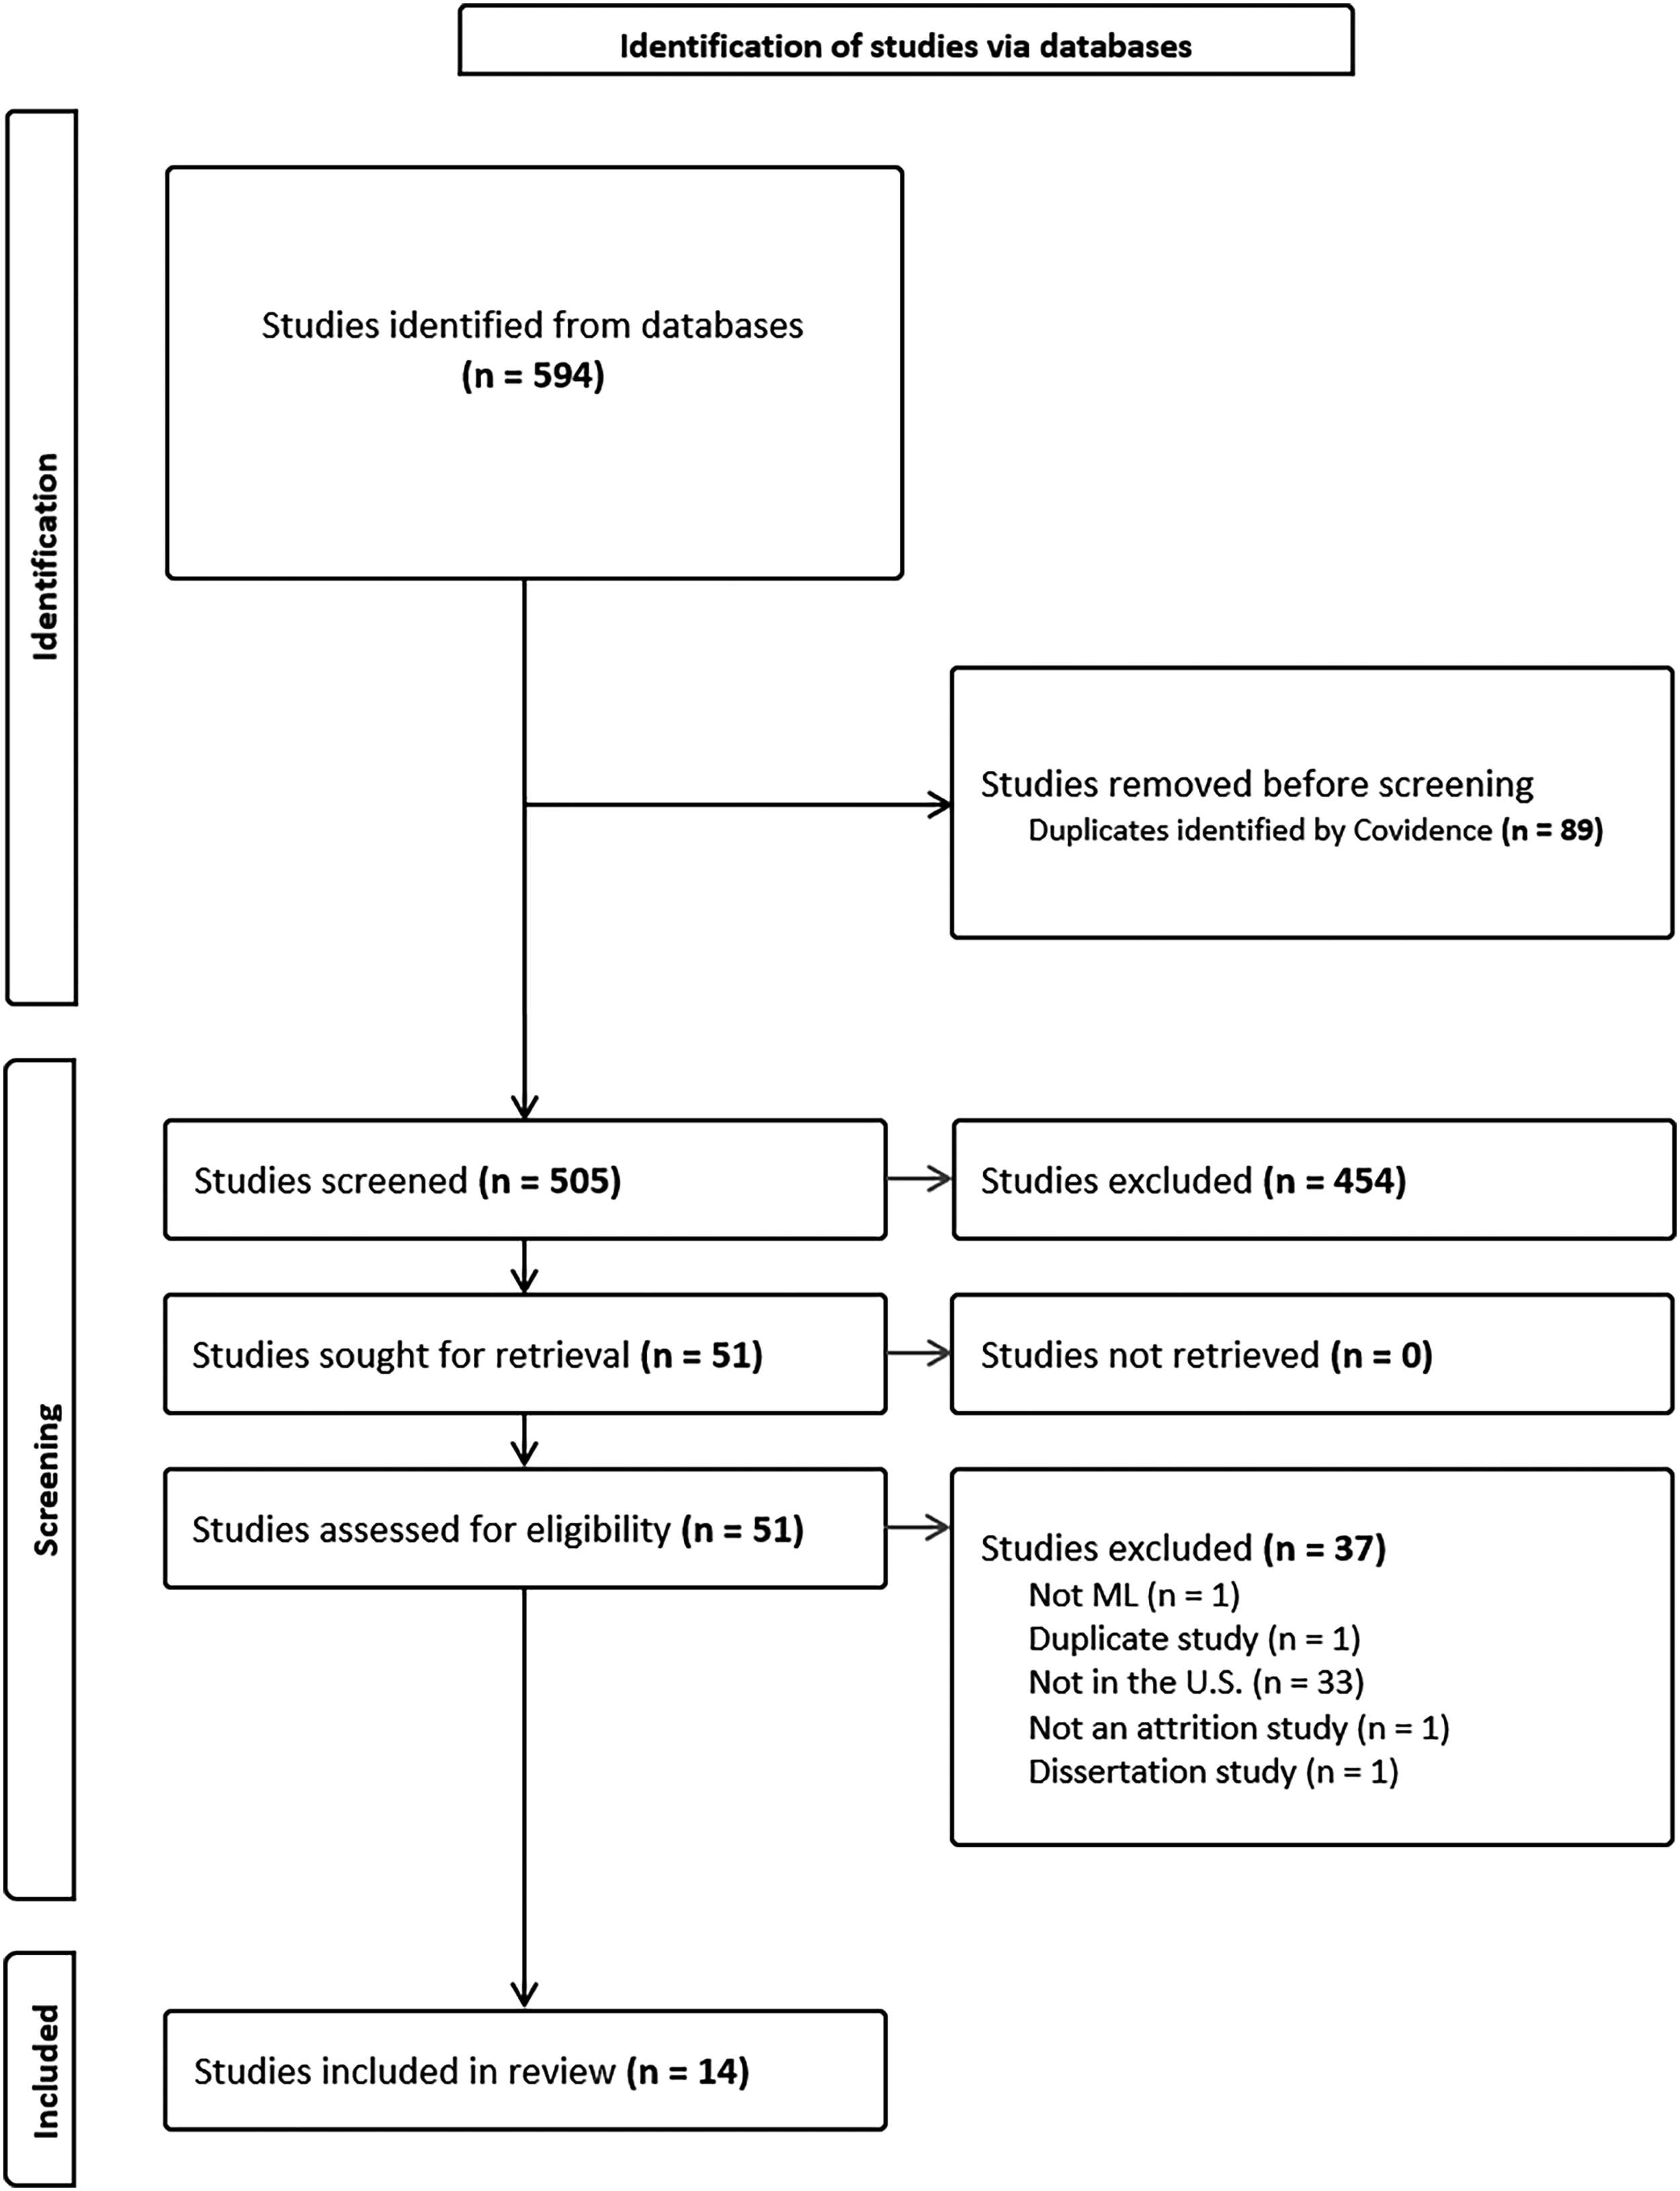
PRISMA flow diagram.
Inclusion and Exclusion Criteria.
We developed a structured data extraction form and pilot-tested it on three of the 14 included studies to ensure clarity, consistency, and alignment with the review objectives. After revisions of the tool, the coders used the finalized extraction tool to extract data.
Results
Study Selection and Characteristics
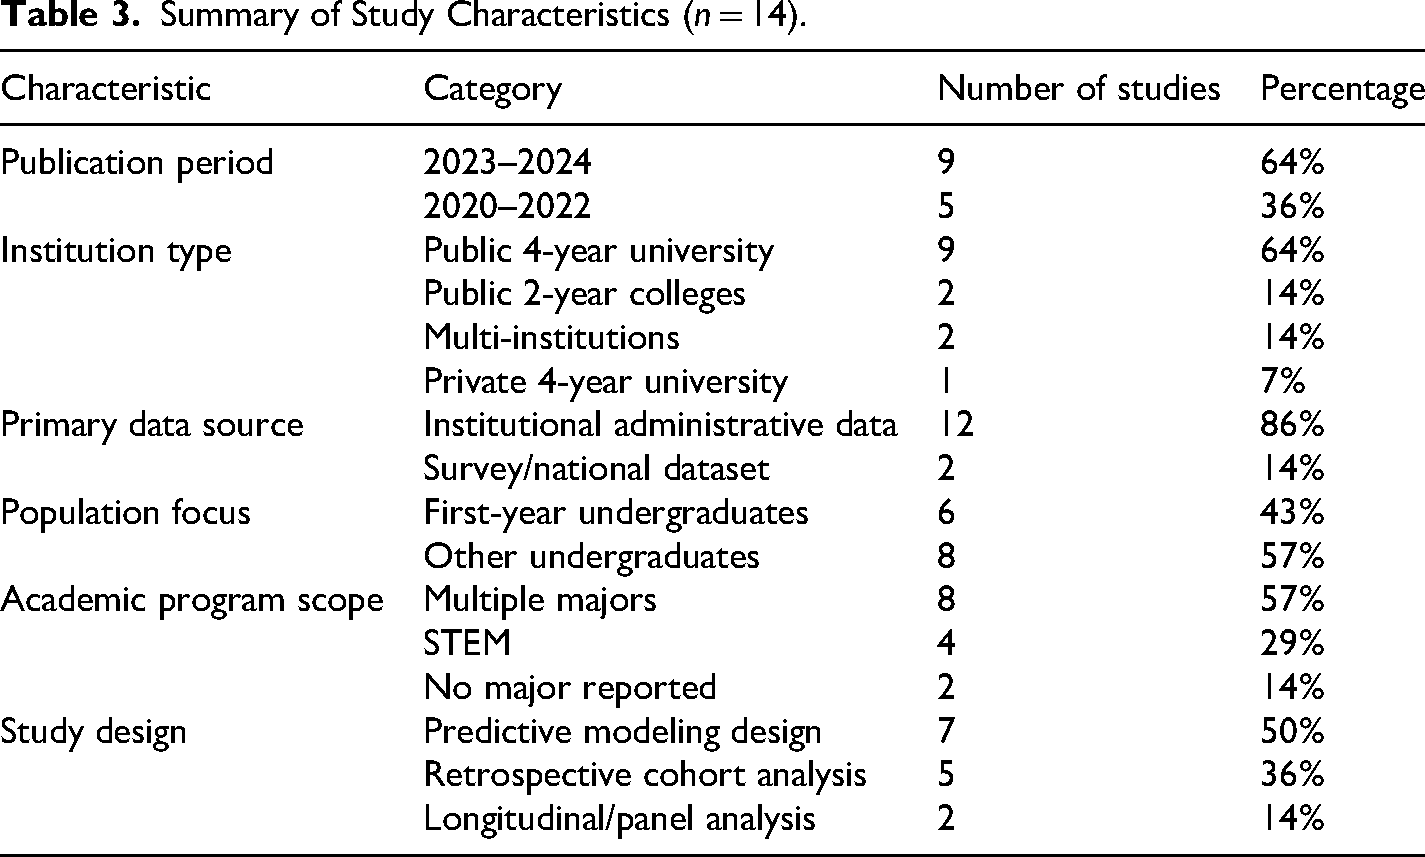
We identified 594 records from the five databases searched. After screening titles and abstracts and assessing 51 full-text articles for eligibility, 14 studies met the inclusion criteria and were included in the final review. The included studies were published between 2020 and 2024, with one study indexed in 2025 despite acceptance in 2024. Most studies were conducted in public 4-year universities (n = 9; 64%), followed by public 2-year colleges (n = 2; 14%), private 4-year universities (n = 1; 7%) and multi-institutions (n = 2; 14%).
Institutional administrative data were the main data source (n = 12; 86%) and included registrar records, course grades, enrollment histories, and LMS activity logs, while two studies (14%) used surveys or national datasets. Sample sizes ranged from small course-level data (n = 133) to large statewide multi-institution archival data (n = 5,168,903). Six studies (43%) specified study delimitation to first-year undergraduates, while four studies (21%) focused on undergraduate cohorts beyond first year, four studies (29%) did not specify the undergraduate level, and no study reported about transfer students.
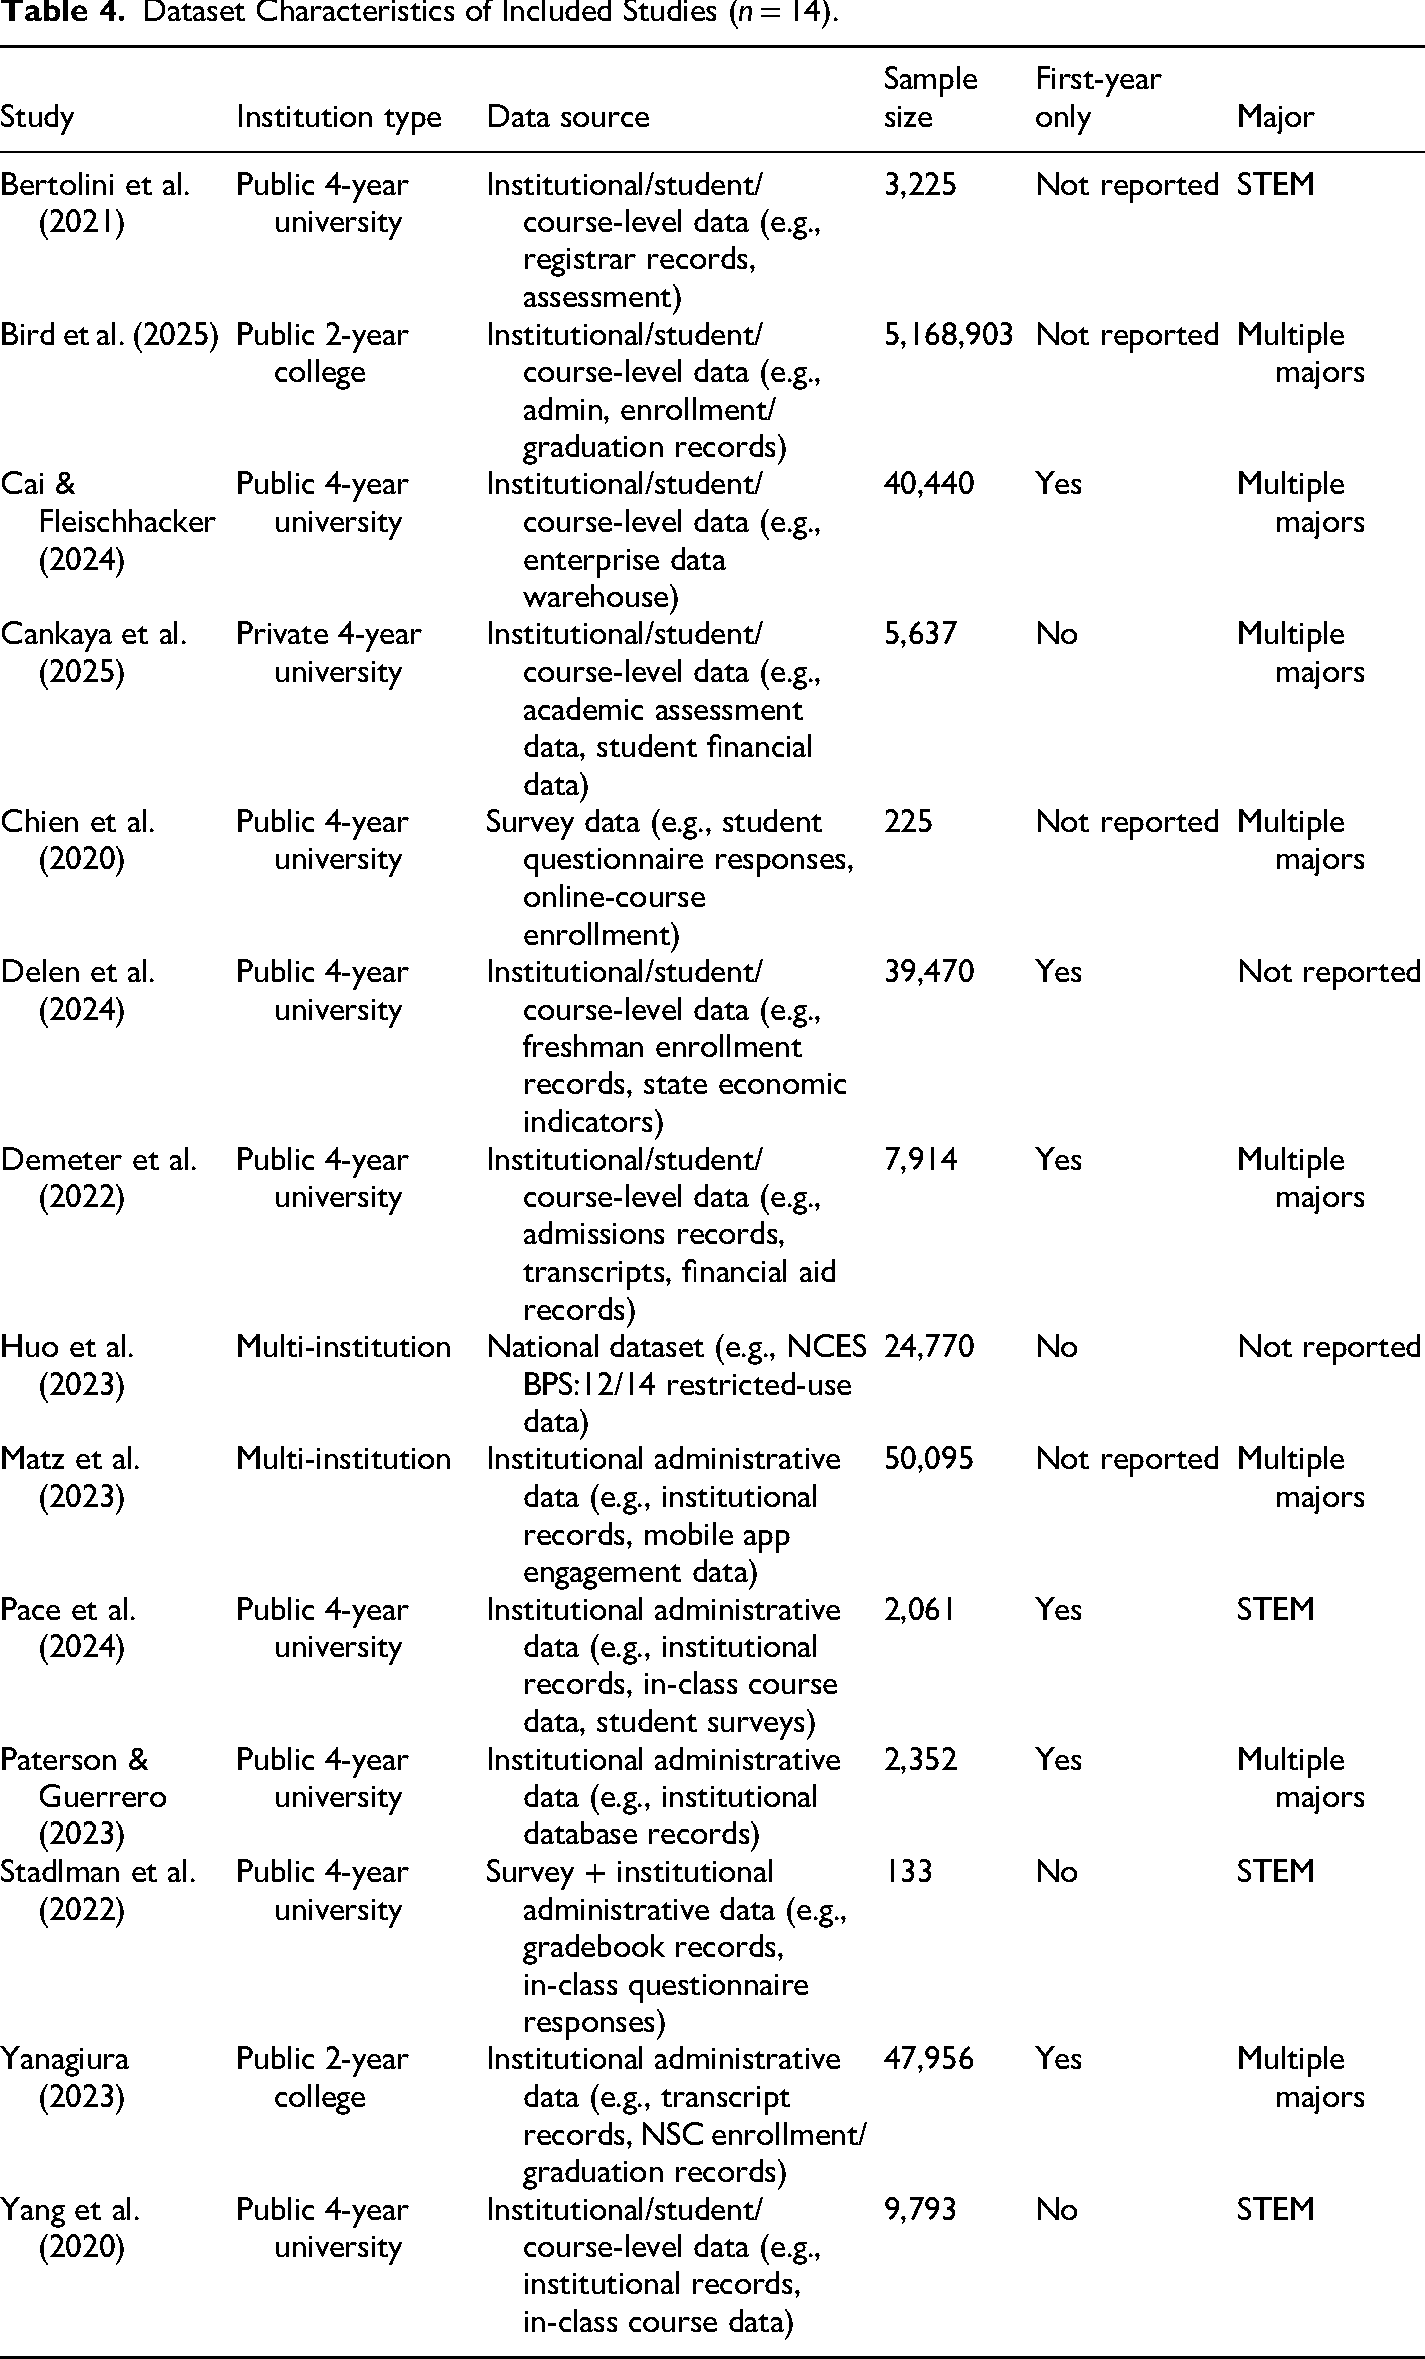
Most studies analyzed students across multiple majors (n = 8; 57%), followed by STEM (n = 4; 29%), while two studies (14%) did not report academic majors. Only five studies (36%) reported the state where the study was conducted: Delaware, New Jersey, North Carolina, Texas, and Virginia. However, 12 studies (86%) reported the region. When categorized by region, most studies were conducted in the South (n = 5; 36%), followed by North, East, Midwest (n = 2; 14% each), and multiple reported regions (n = 1; 7% each). In terms of study design, the studies adopted predictive modeling, retrospective cohort analysis, and longitudinal/panel analysis. Most studies used predictive modeling designs and retrospective cohort analyses (n = 12; 86%), while the remaining studies utilized longitudinal analysis (n = 2; 14%). Study characteristics and dataset characteristics are summarized in Tables 3 and 4, respectively. Table 3 provides an overview of study-level features, and Table 4 details the dataset characteristics reported across the included studies.
Summary of Study Characteristics (n = 14).
Dataset Characteristics of Included Studies (n = 14).
Attrition Outcomes, Timelines, Predictors, and Reported Patterns
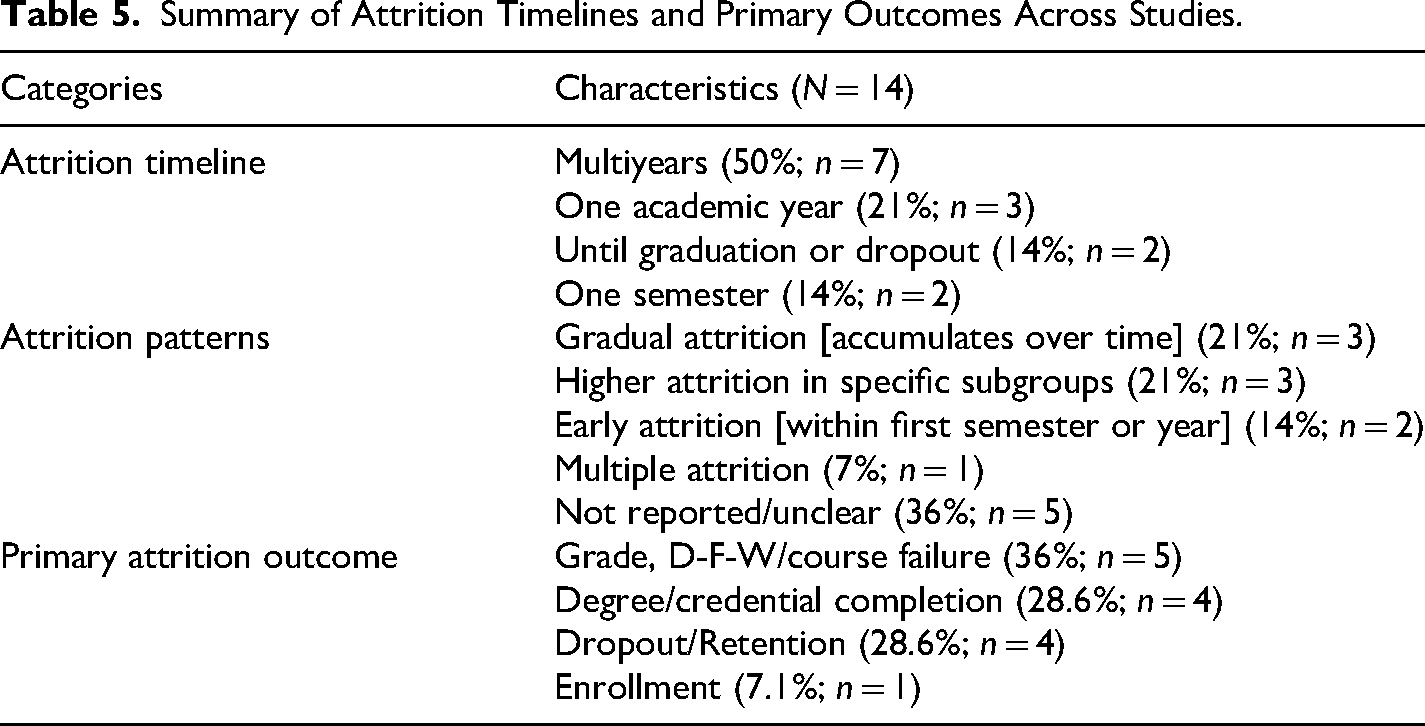
The included studies operationalized attrition heterogeneously, with direct outcomes such as dropout and nonreenrollment alongside related outcomes including persistence, retention, and degree completion (Bird et al., 2025; Chien et al., 2020; Stadlman et al., 2022). Course-level outcomes (e.g., grades, D–F–W) were used as proxies for attrition risk in 36% of the studies (n = 5), while 28.6% (n = 4) examined degree or credential completion, 28.6% (n = 4) investigated dropout or retention, and 7.1% (n = 1) used enrollment outcomes as indicators of attrition.
With respect to timelines, half of the included studies (n = 7, 50%) tracked attrition across multiple years, while others focused on shorter time frames (e.g., single semester, one academic year, or first-year persistence; Cai & Fleischhacker, 2024; Huo et al., 2023; Yang et al., 2020). For studies that reported attrition patterns, the patterns can be grouped into four clusters: (1) early attrition occurring within the first academic year or initial term of enrollment (e.g., Delen et al., 2024; Paterson & Guerrero, 2023); (2) gradual attrition accumulating over time (e.g., Bertolini et al., 2021; Cai & Fleischhacker, 2024; Huo et al., 2023), indicating that departure risk may increase across academic progression; (3) higher attrition among specific subgroups (e.g., Bird et al., 2025; Matz et al., 2023; Pace et al., 2024), suggesting variation across demographic, academic, or programmatic populations; and (4) multiple attrition patterns combining subgroup differences, program-level trends, and temporal behavioral patterns (e.g., Cankaya et al., 2025). The attrition timelines and primary outcomes across the included studies are summarized in Table 5.
Summary of Attrition Timelines and Primary Outcomes Across Studies.
Predictors used in these studies were grouped into eight categories, as shown in Table 6. The most common predictors combined background characteristics (e.g., demographic attributes, prior academic achievement) and indicators of academic progress (e.g., GPA, credits earned, course performance). Across the studies, the most common combination of predictors was demographic characteristics with academic performance indicators, suggesting that both student background and early academic performance are key signals of attrition risk.
Predictors Used in the Included Studies.
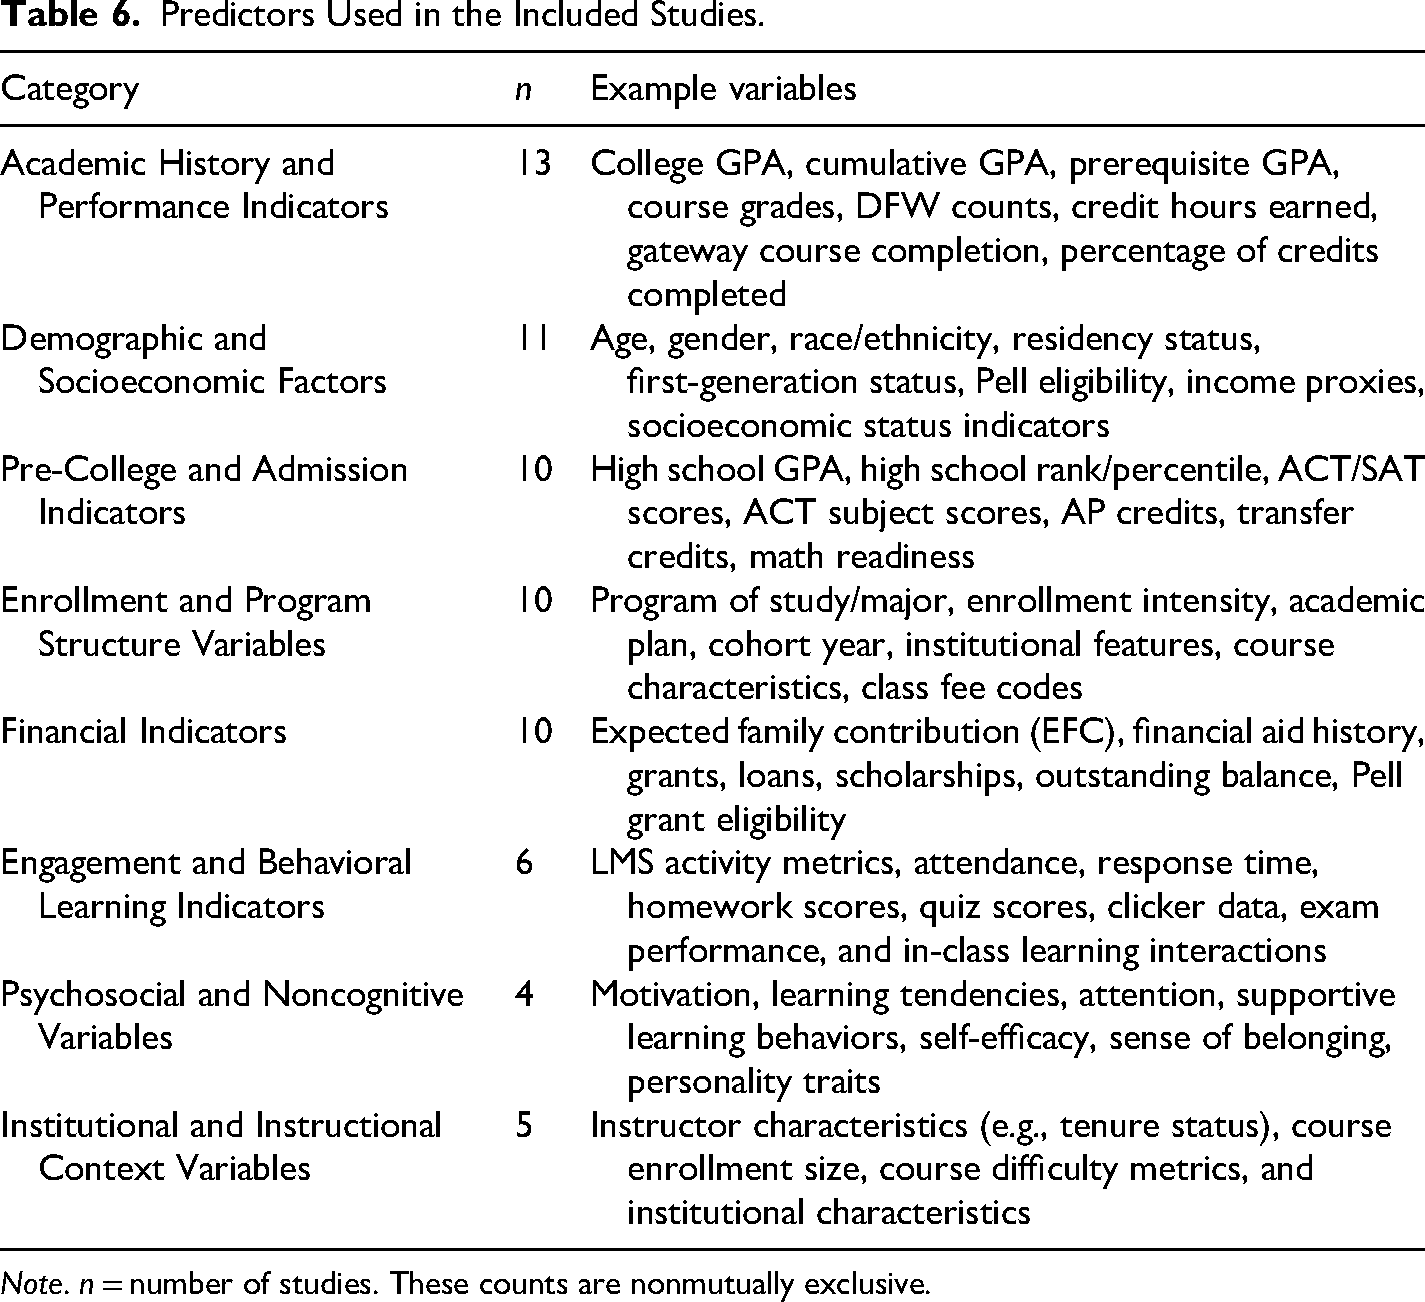
Note. n = number of studies. These counts are nonmutually exclusive.
Missing Data and Data Imbalance Issues
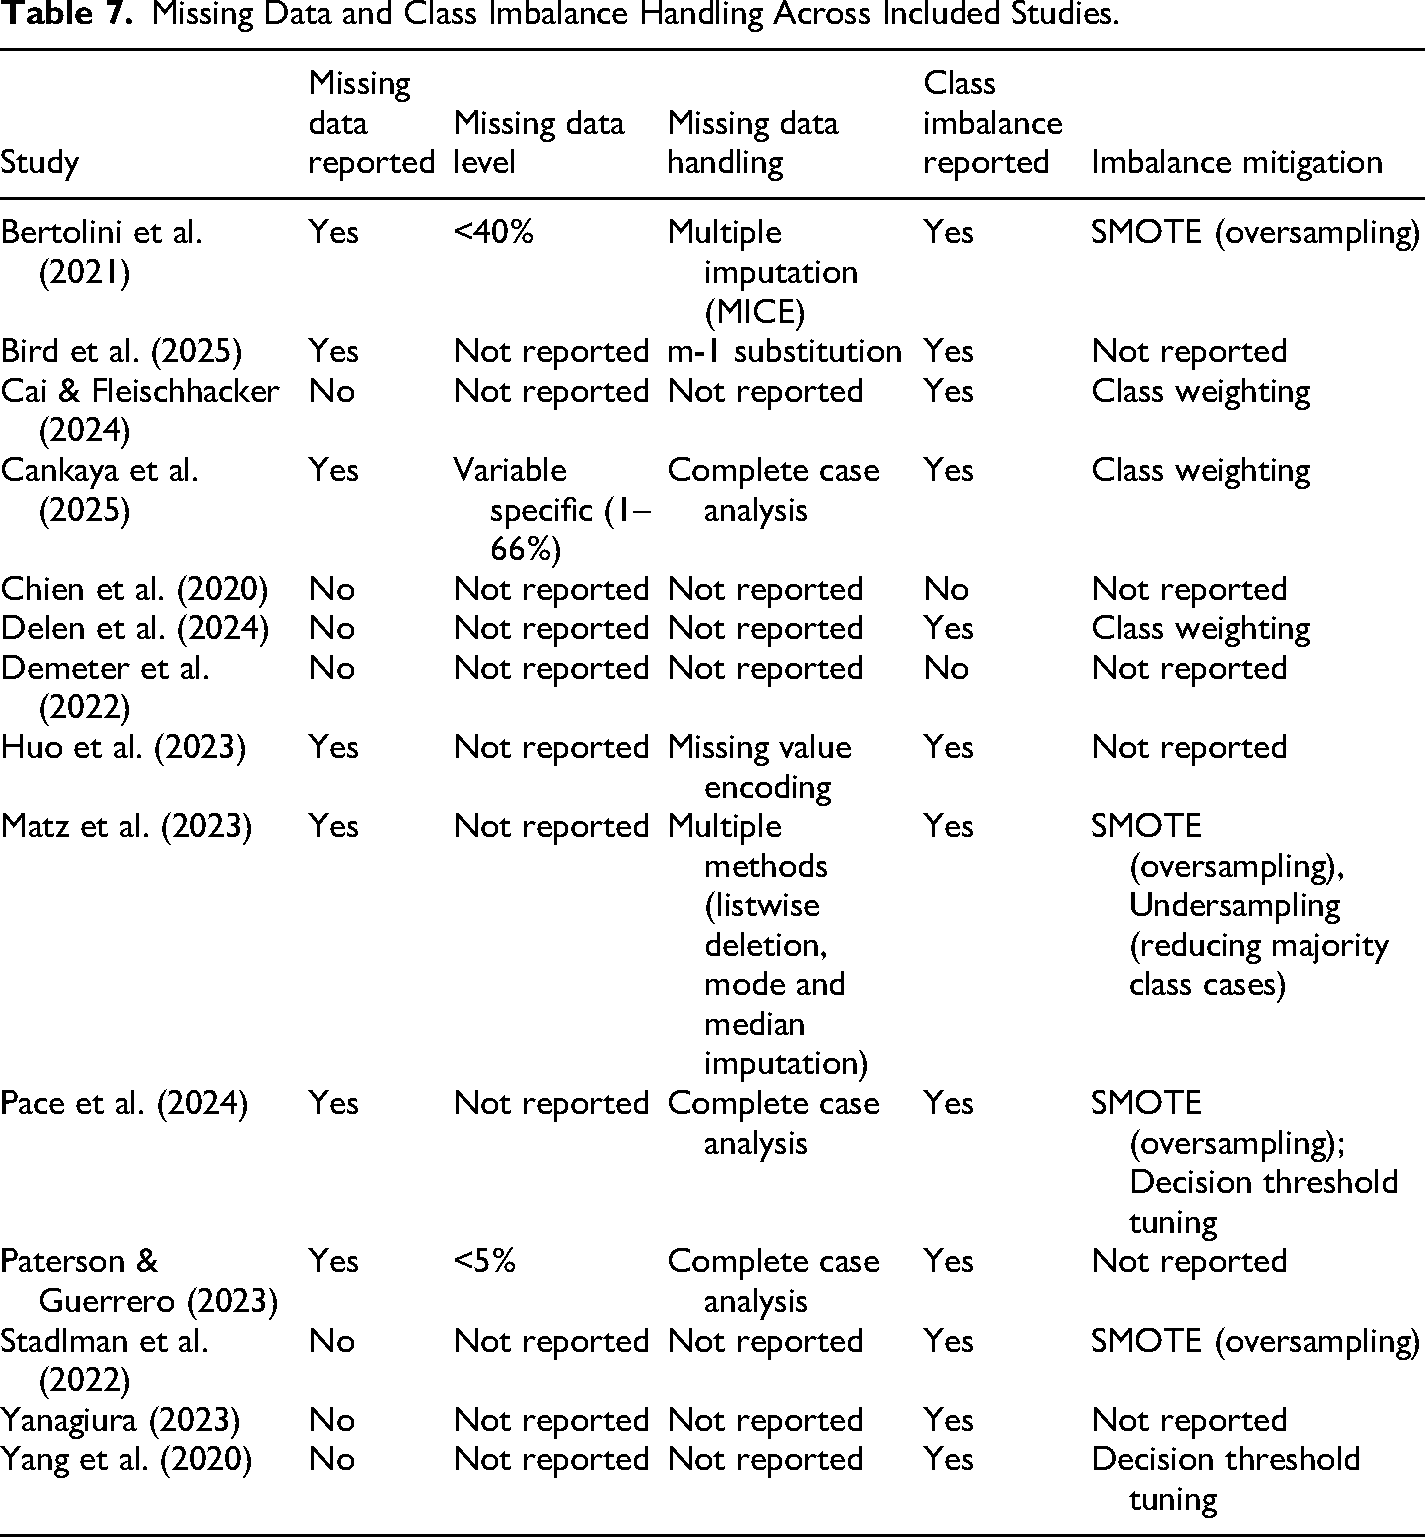
As in other quantitative research, missing data are a methodological issue across the included studies. Seven of the 14 studies (50%) reported the presence of missing data and the strategy used for handling missing data. Of these seven studies, only three quantified the extent of missingness. The remaining studies (n = 7; 50%) did not report the presence of missing data and approach to missing data, leaving it unclear whether missingness was not present, was ignored, or was not documented.
Class imbalance was reported in 12 of the 14 studies (86%), with 67% (n = 8) reporting how it was used in their datasets during model training. Of the studies that reported handling class imbalance, the most common strategies were Synthetic Minority Oversampling Technique (SMOTE) oversampling, undersampling, class-weighting approaches, and decision-threshold tuning. Oversampling techniques such as SMOTE generate additional minority-class observations to balance the training dataset while class weighting assigns higher misclassification penalties to minority attrition cases during model training (Narwane & Sawarkar, 2019; Niaz et al., 2022).
On the other hand, other studies utilized undersampling and threshold tuning. In undersampling, majority-class observations are reduced to achieve a more balanced distribution. However, this approach may lead to loss of information while in threshold tuning, classification probability thresholds are adjusted to optimize sensitivity and specificity (Narwane & Sawarkar, 2019; Niaz et al., 2022). A summary of missing data and class imbalance, along with the methods of handling each, is presented in Table 7.
Missing Data and Class Imbalance Handling Across Included Studies.
Model Selection and Algorithmic Approaches
Across the included studies, the authors provided rationale for their choice of algorithms for attrition prediction, as summarized in Table 8. Some of the rationales are computational ease, effectiveness with small or complex datasets, ability to model nonlinear relationships, and interpretability. Across the included studies, both single-model and multimodel comparison approaches were used. Most studies (n = 12; 86%) employed multi-model comparison designs, directly evaluating the performance of two or more algorithms (e.g., Bertolini et al., 2021; Cai & Fleischhacker, 2024; Paterson & Guerrero, 2023; Stadlman et al., 2022). These studies compared models such as SVM, RF, GBM, XGBoost, and LR to identify the best-performing classifier. On the other hand, 14% of the studies (n = 2) used a single-model approach using one ML algorithm (Delen et al., 2024; Demeter et al., 2022; Yang et al., 2020). We categorized the ML models into their algorithmic families, such as ensemble learning methods, neural network approaches, kernel-based algorithms, probabilistic models, instance-based methods, and baseline statistical models. Random forest, an ensemble learning method, and LR and its variants (baseline models) were the most frequently used algorithms, each reported across 11 studies. Other ML approaches included kernel-based methods such as support vector machines (n = 4), neural network models (n = 3), and ensemble boosting methods such as XGBoost (n = 2). Table 8 summarizes the ML models used across the included studies and the rationales reported by authors for selecting those models.
Machine Learning Models and Reported Rationale for Model Selection.
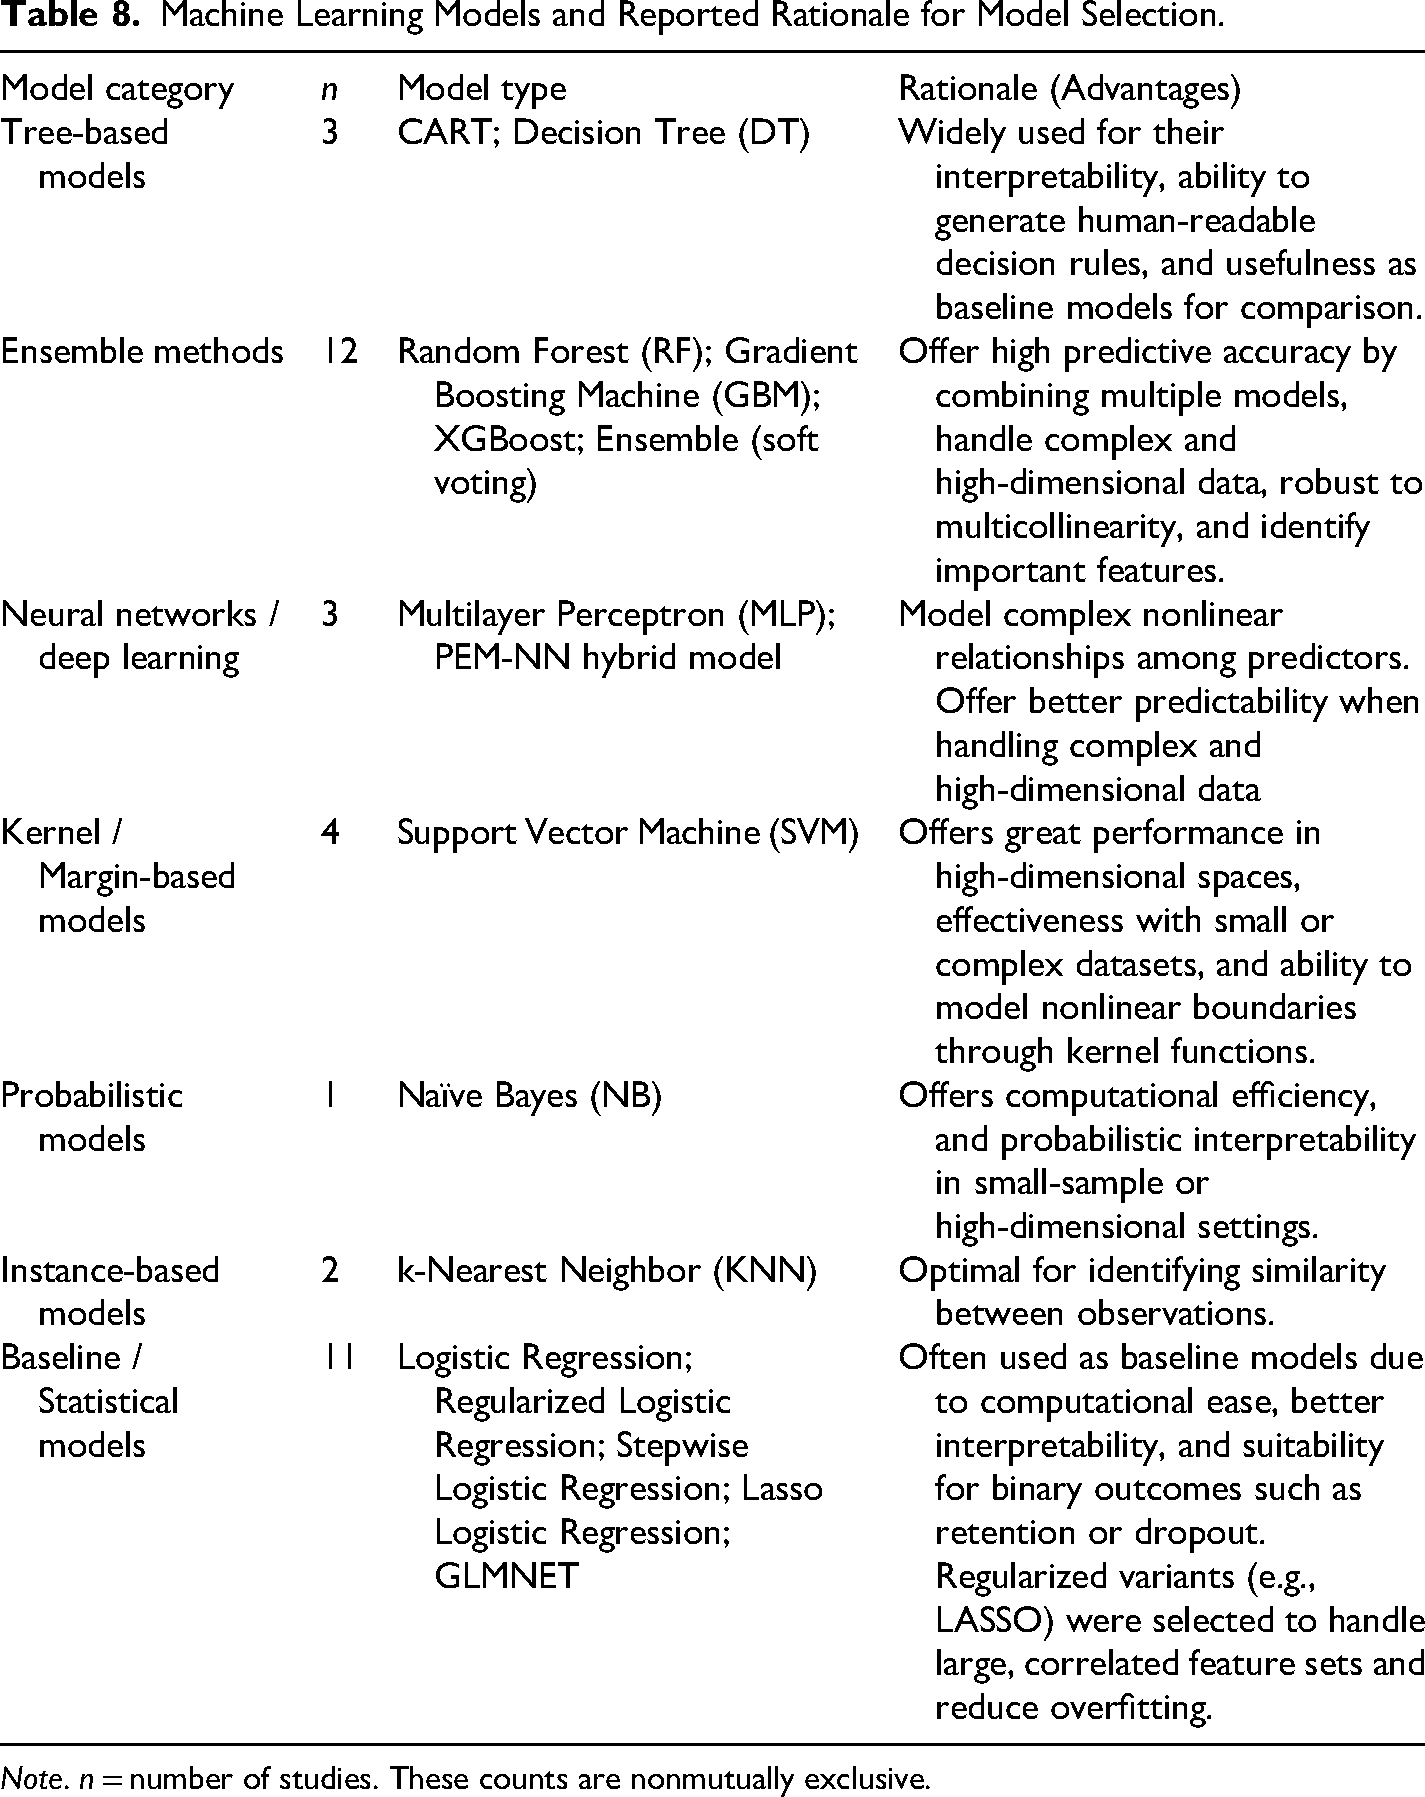
Note. n = number of studies. These counts are nonmutually exclusive.
Model Development, Evaluation, and Validation
Most studies reported their data-splitting strategy (n = 11; 79%), while three did not specify (n = 3; 21%). Reported approaches included conventional train–test splits, with ratios ranging from 90:10 and 80:20 to 70:30 and 50:50, holdout by semester and cohort, and nested cross-validation. Model performance across the included studies was evaluated by using metrics such as area under the curve (AUC), receiver operating characteristic curve (ROC), accuracy, precision, recall (sensitivity), specificity, F1-score, and balanced accuracy (e.g., Pace et al., 2024; Yanagiura, 2023). Table 9 presents the models, reported performance, and identifies the top-performing model in studies that utilized multiple ML models.
Summary of Model and Model Performance.
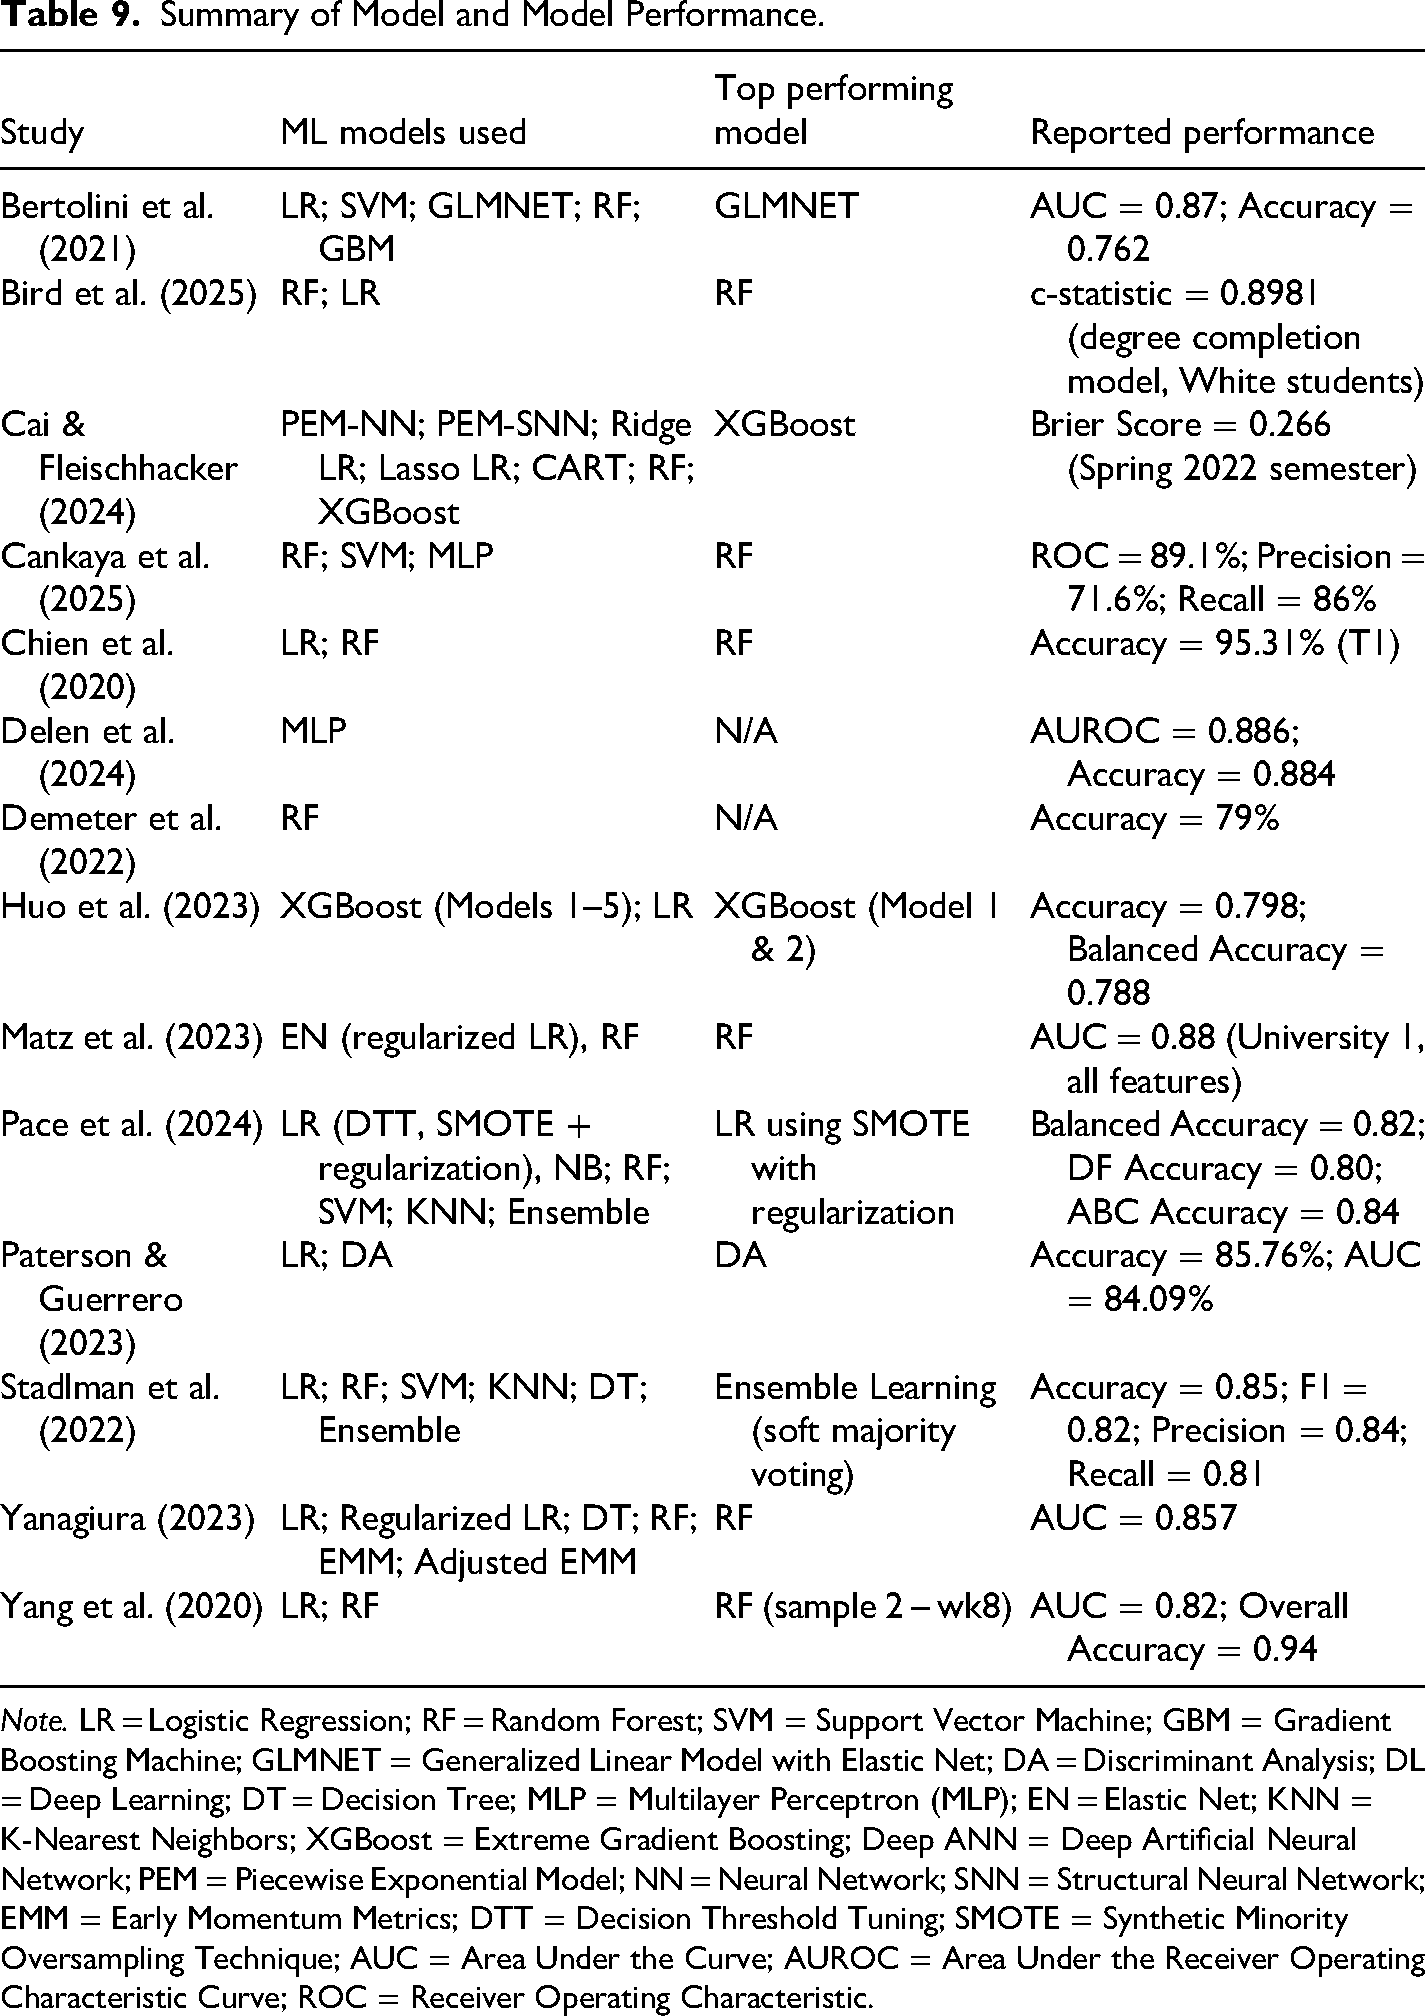
Note. LR = Logistic Regression; RF = Random Forest; SVM = Support Vector Machine; GBM = Gradient Boosting Machine; GLMNET = Generalized Linear Model with Elastic Net; DA = Discriminant Analysis; DL = Deep Learning; DT = Decision Tree; MLP = Multilayer Perceptron (MLP); EN = Elastic Net; KNN = K-Nearest Neighbors; XGBoost = Extreme Gradient Boosting; Deep ANN = Deep Artificial Neural Network; PEM = Piecewise Exponential Model; NN = Neural Network; SNN = Structural Neural Network; EMM = Early Momentum Metrics; DTT = Decision Threshold Tuning; SMOTE = Synthetic Minority Oversampling Technique; AUC = Area Under the Curve; AUROC = Area Under the Receiver Operating Characteristic Curve; ROC = Receiver Operating Characteristic.
Hyperparameter tuning (a process of optimizing model parameters) was reported in most studies (n = 12; 86%), with grid search (often combined with cross-validation) as the most used optimization strategy (n = 5; 36%). Other hyperparameter tuning strategies applied include randomized search, Bayesian optimization, and custom parameter selection (e.g., Huo et al., 2023; Matz et al., 2023). In terms of model validation (evaluation of a trained model's performance on unseen data), cross-validation was the most used validation method (n = 10; 71%) using 5-fold or 10-fold (e.g., Bird et al., 2025; Demeter et al., 2022). Only two studies (14%) used hold-out validation strategies, while two studies did not report the validation method. Table 10 presents the data splitting, validation, and hyperparameter tuning strategies reported across the included studies. R and Python were primarily the programming languages used, along with packages such as caret, MICE, caretList, cutpointr, glmnet, rpart, randomForest, and gbm in R, and scikit-learn, scikit-lego, imbalanced-learn, and SMOTE in Python.
Summary of Data Splitting, Validation Methods, and Hyperparameter Tuning Strategies Across Included Studies.
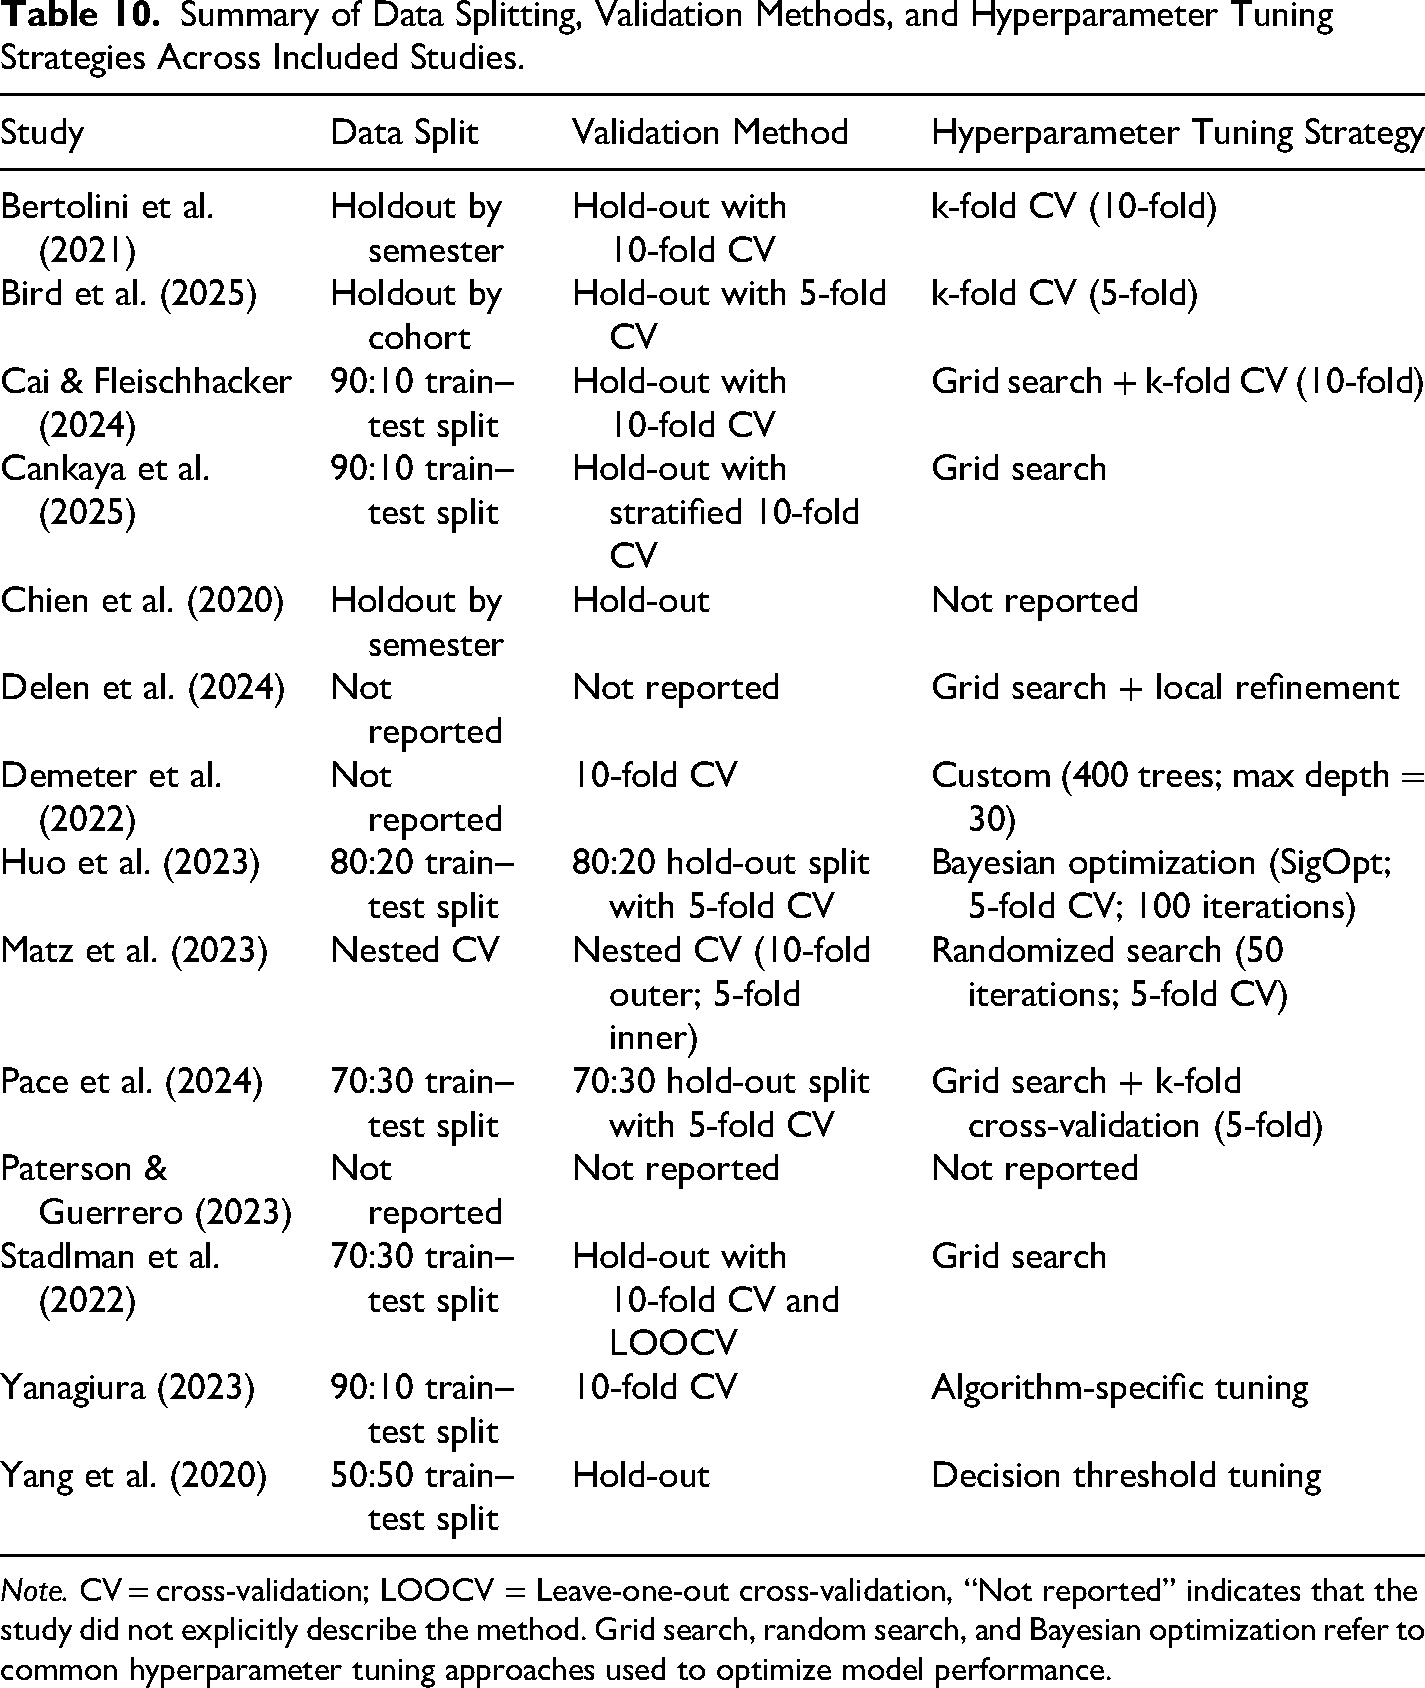
Note. CV = cross-validation; LOOCV = Leave-one-out cross-validation, “Not reported” indicates that the study did not explicitly describe the method. Grid search, random search, and Bayesian optimization refer to common hyperparameter tuning approaches used to optimize model performance.
Adherence to Reporting Standards
We adapted the Transparent Reporting of a Multivariable Prediction Model for Individual Prognosis or Diagnosis (TRIPOD + AI) checklist to appraise whether the included ML studies adhered to reporting standards (Collins et al., 2024). Although the TRIPOD + AI checklist contains 27 broad category reporting items designed to improve the transparency of prediction model development and validation studies with applications in health research, we applied an adapted set of 11 items relevant to the scope of this review and selected via two main criteria: (1) applicability to the education research context, (2) relevance to attrition prediction using ML with institutional, observational, administrative or survey data. The remaining TRIPOD + AI checklist items were excluded from our reporting appraisal because they fall outside the scope of this scoping review. The full TRIPOD + AI checklist items can be found in Collins et al. (2024).
The retained items presented in Table 11 assessed reporting of the study title, abstract, data source, participant description, outcome definition, predictors, sample size, missing data handling, class imbalance procedures, validation strategies, and model performance metrics. Each item was coded as present (1) or absent (0).
11-Included TRIPOD + AI Checklist Appraisal Items.
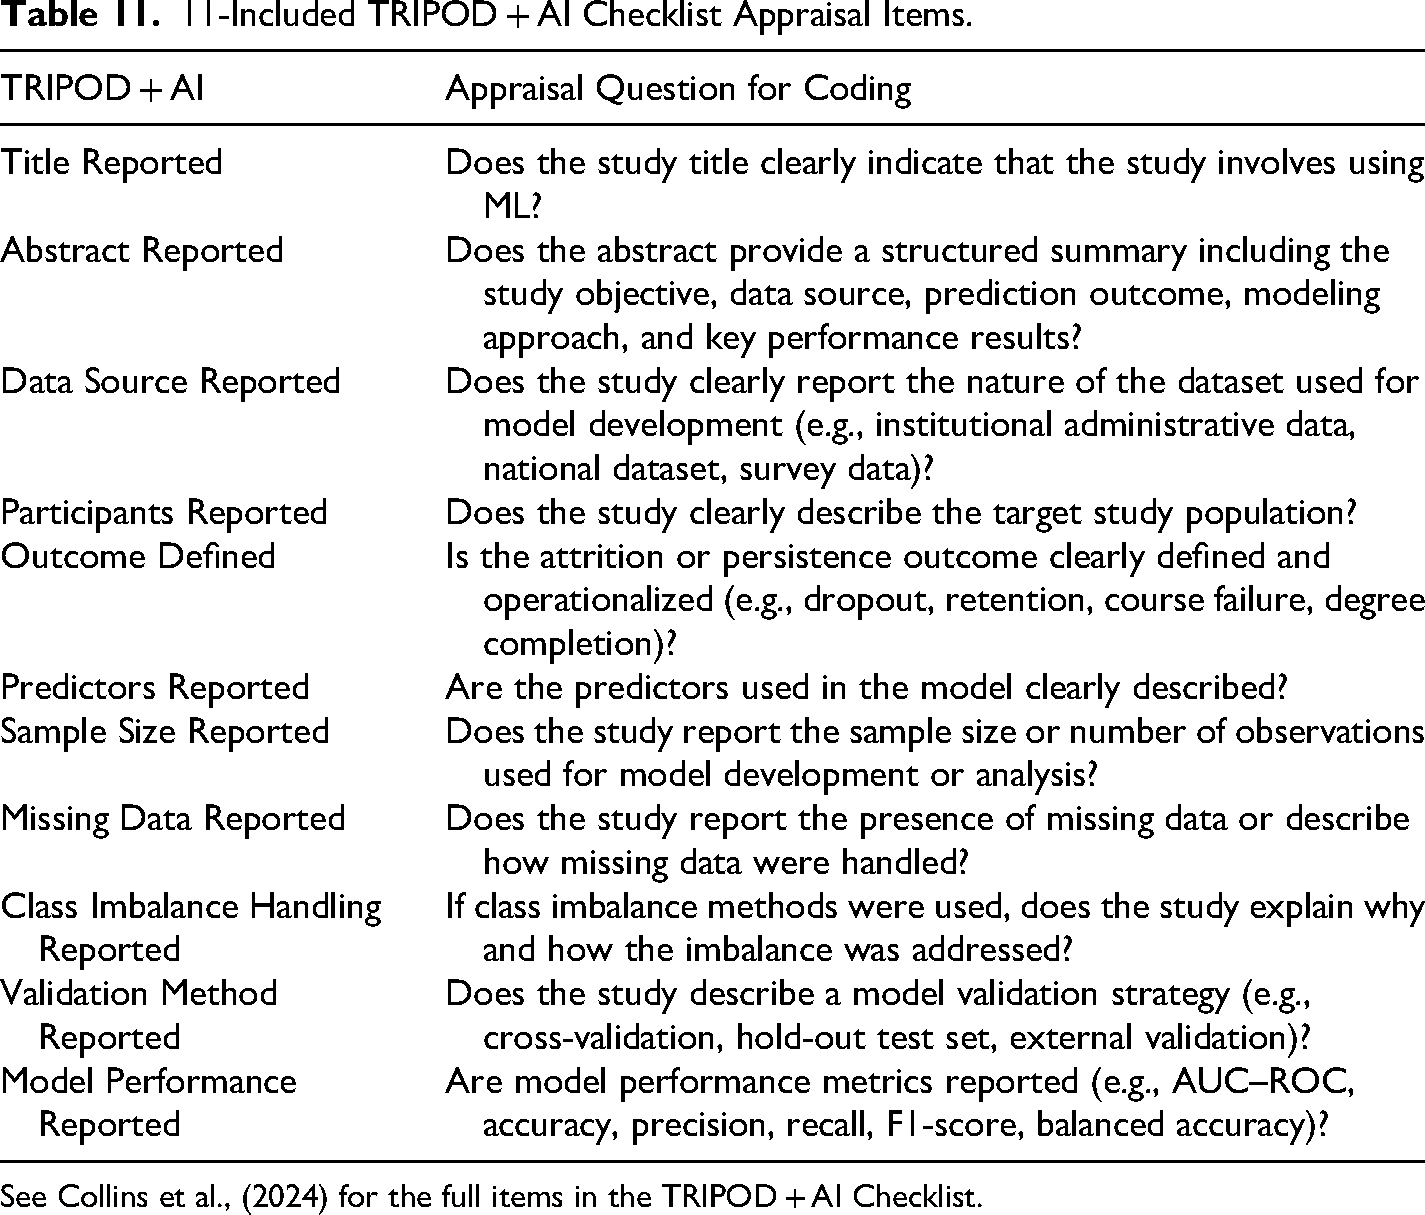
See Collins et al., (2024) for the full items in the TRIPOD + AI Checklist.
Reporting adherence was 80% or higher across nine of the 11 reporting domains, including title, abstract, data source, participants, outcome definition, predictors, sample size, validation method, and model performance. Figure 2 shows the proportion of included studies that adhered to the adapted TRIPOD + AI reporting standards. The lowest adherence was for missing data handling (50%) and class imbalance handling (57%), suggesting that data preprocessing and data quality are underreported in the included studies. Overall adherence across the 11-item adapted TRIPOD + AI checklist was about 88% (data available in Supplemental Material). The findings suggest that while most studies report core elements of ML pipeline for prediction, data preprocessing, which is an important part of every analysis, is underreported.
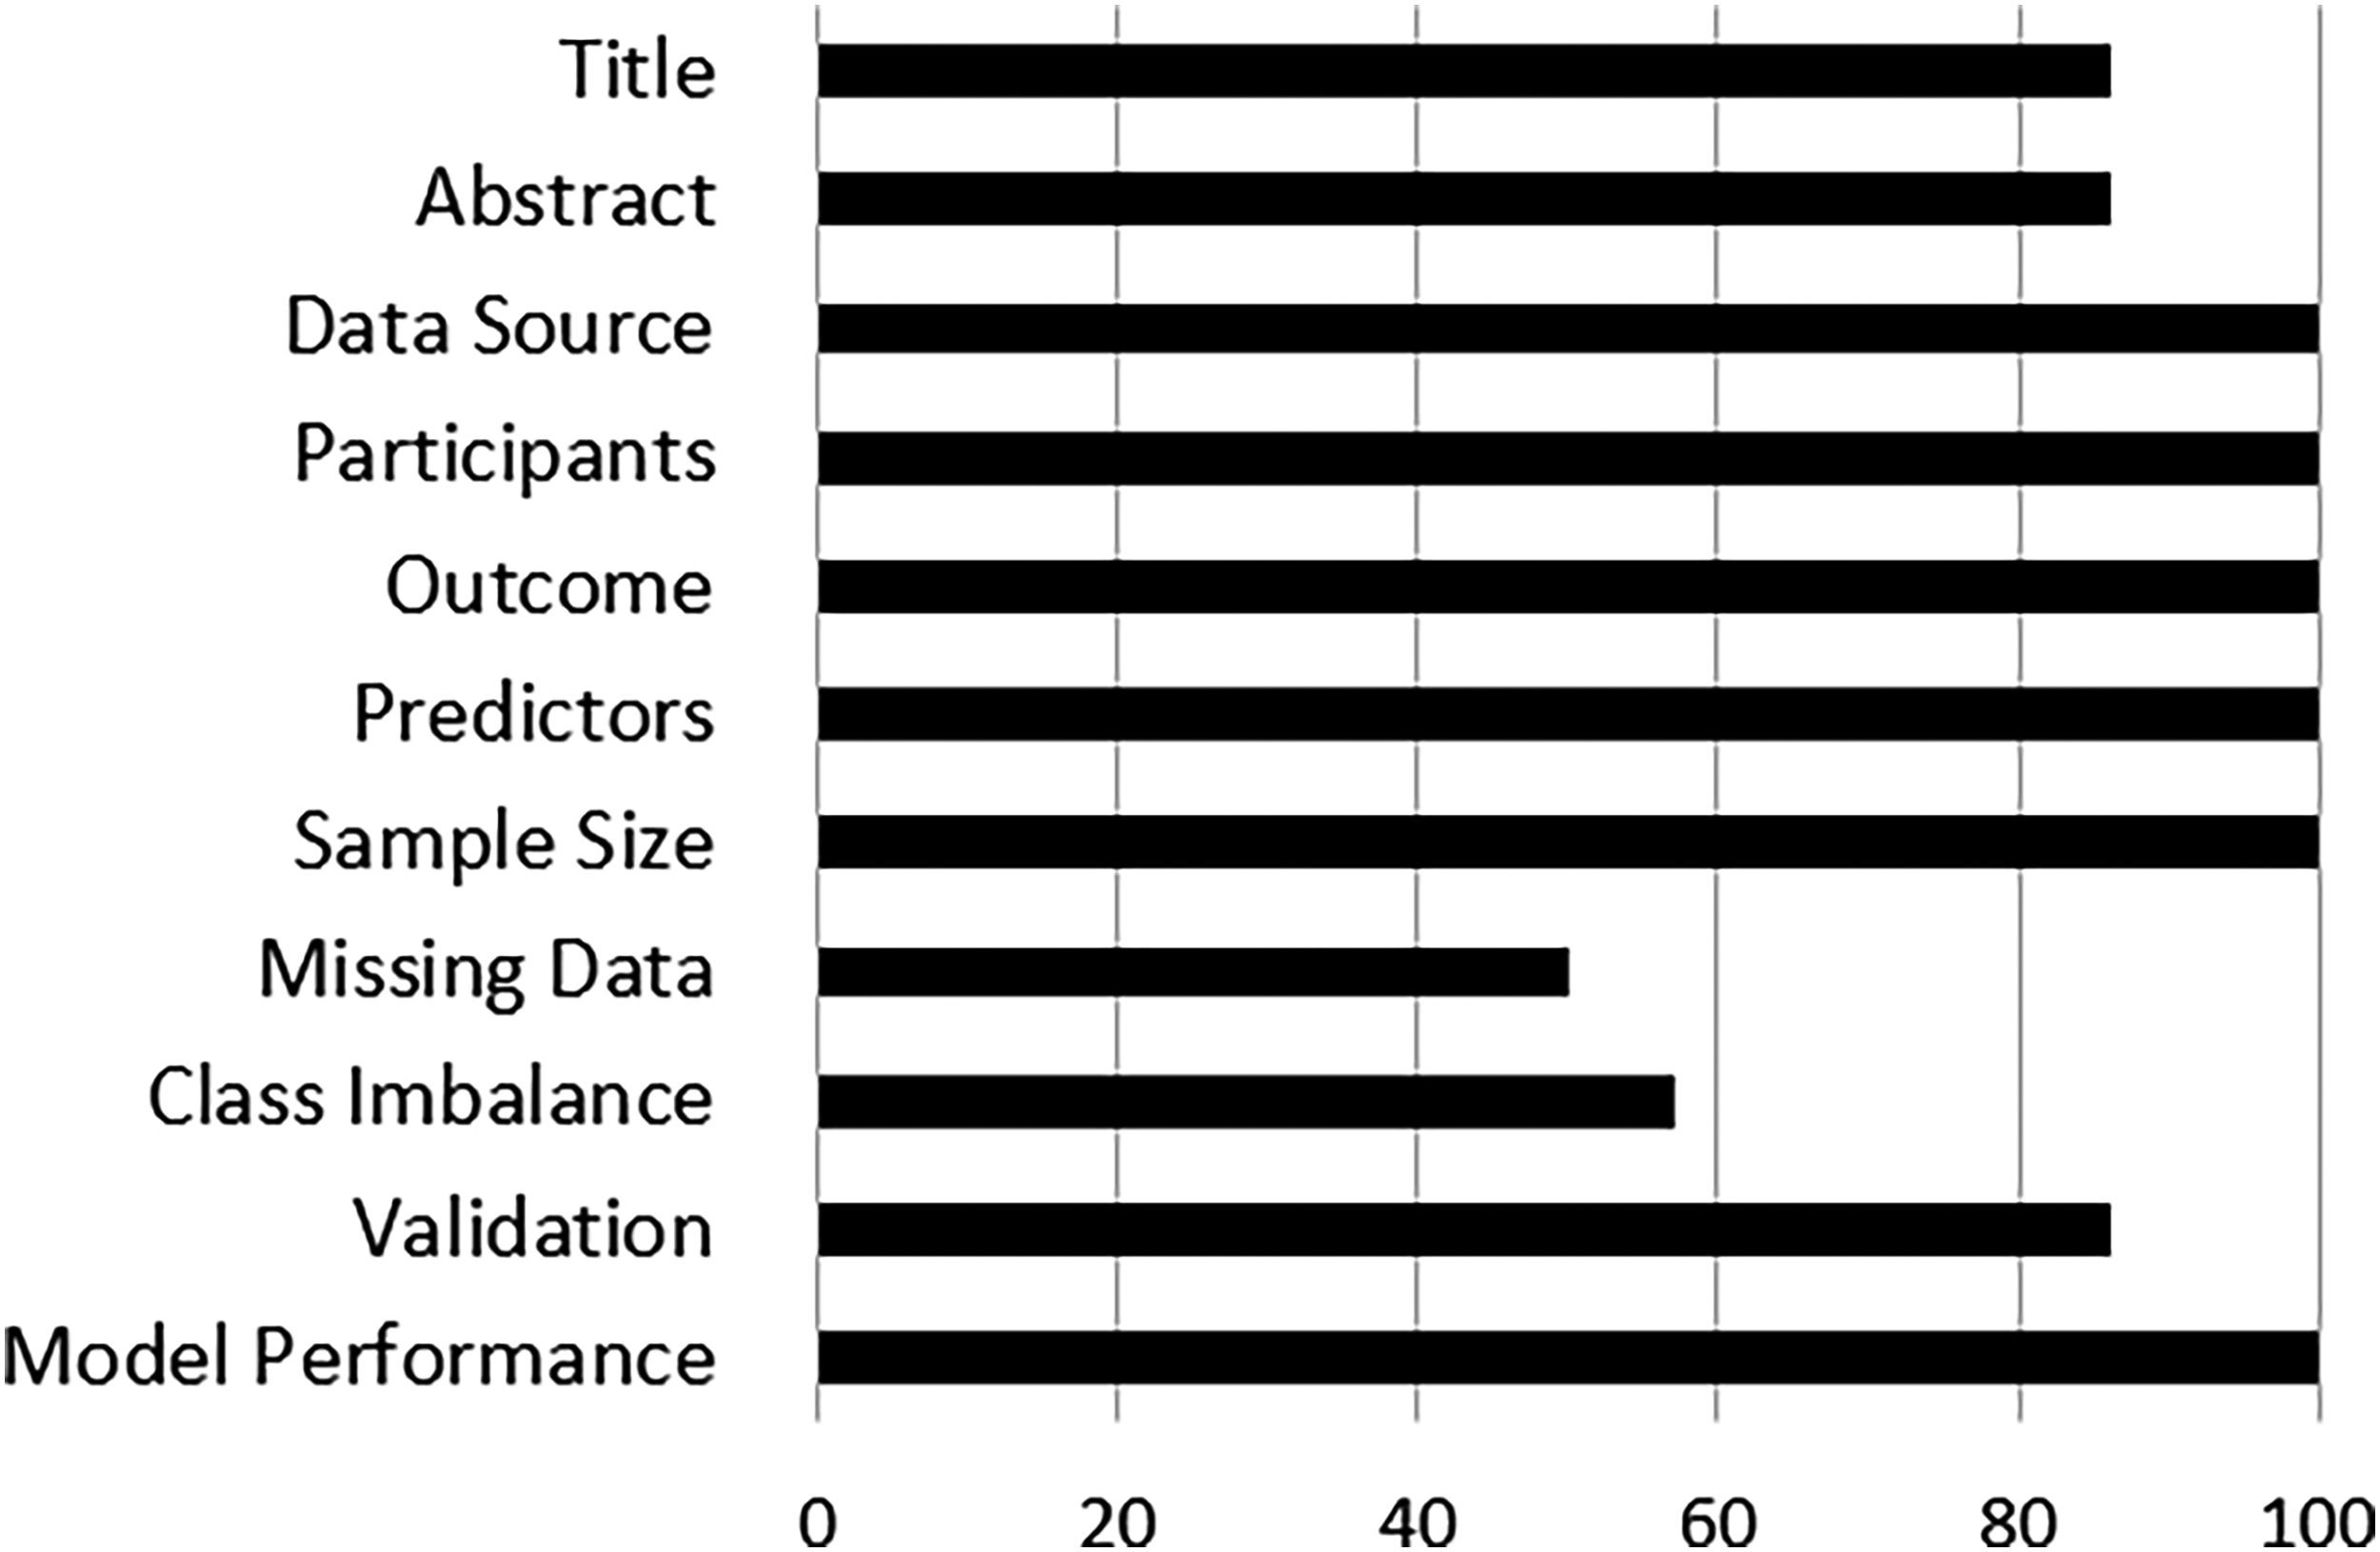
Percent of included studies adhering to the adapted TRIPOD + AI reporting standards (n = 14).
Discussion
While many theoretical models on student attrition have been developed, historical approaches to studying the phenomenon have relied on limited data analysis (Corrigan et al., 2015). The call for advanced methodologies has necessitated the use of ML to predict dropout, retention, and attrition rates (Chien et al., 2020; Matz et al., 2023). This scoping review mapped evidence on the use of ML to predict undergraduate student attrition in U.S. higher education, with studies examining outcomes such as course failure, dropout, degree completion using institutional, behavioral, and demographic data. Authors operationalized attrition in multiple ways—some focused on long-term outcomes such as institutional dropout or degree completion, others relied on proxy indicators such as course failure or early academic performance. Although these proxy measures enable earlier identification of at-risk students, they limit comparability across studies and may not fully reflect the complexities of student persistence pathways.
Attrition prediction using ML across these studies used administrative and institutional data, such as grades (academic records) and demographic characteristics. Although these data sources are key attrition predictors, they provide a limited perspective on the multifaceted nature of student attrition. Theoretical constructs such as student engagement, sense of belonging, motivation, and social integration will provide great relevance to ML-based attrition research.
The reported predictive performance of the ML models showed discrimination metrics (AUC/AUROC/ROC) ranging from 0.82 to 0.90. Discrimination metrics are a more informative metric type for evaluating ML performance because they assess a model's ability to distinguish between students who persist and those who are at risk of attrition.
Across the included studies, RF and LR were the most frequently reported models, and both demonstrated strong predictive performance. While RF can model nonlinear relationships and handle complex predictor interactions, LR and its variants are simpler, computationally efficient, and more interpretable models suitable for attrition prediction. On the other hand, advanced ML models such as neural networks can offer better predictive performance in high-dimensional educational datasets; however, they can be less transparent and more difficult to interpret for educators, policymakers, and institutional decision-makers. Therefore, model selection and suitability depend on the structure and size of the dataset, the nature of the prediction task, and the intended use of the findings.
Because attrition is not an isolated issue, this review suggests that institutions should adopt targeted and differentiated interventions by identifying distinct risk profiles based on academic, behavioral, and sociodemographic factors (Matz et al., 2023). Doing so will extend the utility of ML beyond predictive modeling to informing evidence-based policy and practice (Fahd et al., 2022). Furthermore, ML-based attrition research can support instructional practices and student learning processes. Predictive indicators such as declining LMS engagement, missed assignments, or patterns of inconsistent participation can be used by instructors to initiate timely pedagogical responses. For example, instructors can provide targeted feedback, recommend resources, or implement check-ins with students exhibiting early signs of disengagement, thus enabling just-in-time interventions for students’ evolving learning needs (Hur et al., 2022).
Finally, the implementation of ML-based attrition models raises important considerations related to ethics, equity, and institutional governance. While predictive systems can inform high-stakes decisions related to advising, financial aid, and resource allocation, they also introduce risks related to bias, fairness, and transparency (Gándara & Anahideh, 2025). These concerns could give rise to the potential for predictive models to drive racial inequalities if not carefully designed and evaluated. As such, clear institutional protocols for how predictive models are developed, evaluated, and interpreted are essential (Steidl et al., 2023).
Implications for Practice
The findings of this review provide actionable implications. First, institutions should integrate ML models into early-warning systems to enable proactive student support. Research suggests that ML models can identify at-risk students early enough, such as the third week of a course or by the midpoint of the semester (Bertolini et al., 2021; Stadlman et al., 2022). When connected to institutional platforms, these predictions can help advisors, instructors, and student-success teams initiate timely actions such as tutoring referrals, advising appointments, supplemental instruction, psychosocial support, or targeted outreach (Bertolini et al., 2021; Matz et al., 2023; Pace et al., 2024).
Second, institutions should use interpretable models that can translate predictive performance into actionable insights within student-success workflows that connect risk identification to timely intervention (Matz et al., 2023). For example, predictive risk scores can be integrated into advising systems to flag students whose probability of attrition exceeds a defined threshold, triggering structured responses such as mandatory advising appointments and targeted tutoring referrals (Bird, 2023). Such integration will support a tiered intervention framework where high-risk students receive intensive, personalized support, moderate-risk students receive automated nudges or check-ins, and low-risk students continue with standard institutional services. This approach links predictive analytics to scalable and responsive student-support systems (Matz et al., 2023; Steidl et al., 2023).
Third, in course-level contexts, predictive models can support revised assignment policies and timely academic support, as instructors can use early indicators such as declining learning management system activity, missed assignments, or inconsistent participation to identify students who may be disengaging before failure or withdrawal occurs (Pace et al., 2024; Yang et al., 2020).
Finally, institutions must implement ML-driven decision-support systems within strong ethical and governance frameworks. Algorithmic bias can bolster existing inequities if predictive systems systematically underestimate risk for some student groups or result in unequal access to support. For example, Bird et al. (2025) cautioned that biased models may lead to at-risk Black students receiving less support than similarly situated White students, and that identifying and mitigating such bias is crucial for colleges aiming to promote racial equity in resource allocation and student success interventions. Institutions should therefore conduct regular fairness audits, examine model performance across demographic groups, and establish clear guidelines for how risk scores are interpreted and acted upon. Maintaining human oversight in high-stakes decisions will ensure responsible and equitable application of ML in student retention initiatives.
Gaps, Limitations, and Future Research Directions
Most studies relied on data from single institutions, individual courses, or specialized student populations, limiting generalizability across the broader U.S. higher education system. Future studies should examine ML attrition prediction across more diverse institutional contexts (e.g., minority-serving institutions, institutions serving large numbers of adult, transfer, first-generation, and part-time students).
The predictive strength of ML models for attrition prediction depends on the quality, scope, and availability of data. The included studies relied on administrative, academic performance, or learning management system data, while omitting other important determinants of student persistence, such as financial stress, social integration, cognitive and noncognitive factors, daily student experiences, and engagement with peers and the institution (Delen et al., 2024; Matz et al., 2023). Future research should incorporate multidimensional data sources with academic, behavioral, financial, psychosocial, and institutional engagement factors. This will improve prediction and understanding of why students leave or persist.
In terms of equity and fairness, predictive systems may produce biased results for certain student subgroups if not well-implemented (Bird et al., 2025). Future studies should evaluate model performance across demographic groups, conduct fairness audits, and report whether prediction errors are equitably distributed across race, gender, SES, enrollment status, and other student characteristics.
Most studies prioritized predictive performance over interpretability. This limits the usefulness of ML for practitioners who need to understand not only which students are at risk but also why they are at risk and what forms of support may be most appropriate. Future research should move beyond predictive accuracy toward interpretability and explainability. Integrating explainable AI techniques could help identify influential predictors, clarify subgroup-specific risk patterns, and make model outputs more actionable for advisors, instructors, and institutional leaders.
Conclusion
This scoping review mapped the use of ML for predicting undergraduate student attrition in U.S. higher education. The review showed that RF and LR are the commonly used ML models across the included studies to analyze undergraduate attrition data. Despite the variations in ML models utilized, predictors, and model evaluation, the current evidence suggests that ML models can support early and accurate identification of at-risk students when integrated into early warning systems. Such systems enable institutions to detect emerging academic difficulties, engagement challenges, or financial risks early in a student's academic trajectory, allowing instructors, advisors, and administrators to intervene proactively with targeted advising, timely academic interventions, and efficient allocation of institutional resources.
This review also highlights challenges that must be addressed to ensure responsible and effective deployment of ML in higher education. Many studies relied on attrition proxy indicators, such as course failure or early academic performance, limiting generalizability across other attrition factors. In addition, inconsistent reporting of data preprocessing (missing data and class imbalance) procedures and model validation strategies may hinder reproducibility and transparency. Concerns related to algorithmic bias and equity further suggest that there is a need for intentional model design and evaluation that accounts for students from historically underrepresented groups.
Supplemental Material
sj-docx-1-csr-10.1177_15210251261465416 - Supplemental material for Machine Learning in Predicting Undergraduate Student Attrition in the United States: A Scoping Review
Supplemental material, sj-docx-1-csr-10.1177_15210251261465416 for Machine Learning in Predicting Undergraduate Student Attrition in the United States: A Scoping Review by Oluwaseun Farotimi, Oluwasayo Farotimi, Comfort H. Omonkhodion, Funke A. Dada, Debbie L. Hahs-Vaughn, and Haiyan Bai in Journal of College Student Retention: Research, Theory & Practice
Footnotes
Author Contribution
Conceptualization: Oluwaseun Farotimi; Data curation: Oluwaseun Farotimi and Oluwasayo Farotimi; Formal analysis: Oluwaseun Farotimi, Oluwasayo Farotimi, CO, and FD; Investigation: Oluwaseun Farotimi, Oluwasayo Farotimi, CO, FD, DHV, and HB; Methodology: Oluwaseun Farotimi, DHV, and HB; Project administration: Oluwaseun Farotimi; Supervision: Oluwaseun Farotimi; Validation: Oluwaseun Farotimi, Oluwasayo Farotimi, CO, and FD; Writing—original draft: Oluwaseun Farotimi; Writing—review & editing: Oluwaseun Farotimi, Oluwasayo Farotimi, CO, FD, DHV, and HB.
Funding
The authors received no financial support for the research, authorship, and/or publication of this article.
Declaration of Conflicting Interests
The authors declared no potential conflicts of interest with respect to the research, authorship, and/or publication of this article.
Supplemental Material
Supplemental material for this article is available online.

Author Biographies
References
Supplementary Material
Please find the following supplemental material available below.
For Open Access articles published under a Creative Commons License, all supplemental material carries the same license as the article it is associated with.
For non-Open Access articles published, all supplemental material carries a non-exclusive license, and permission requests for re-use of supplemental material or any part of supplemental material shall be sent directly to the copyright owner as specified in the copyright notice associated with the article.
