
Abstract
Background and Aims:
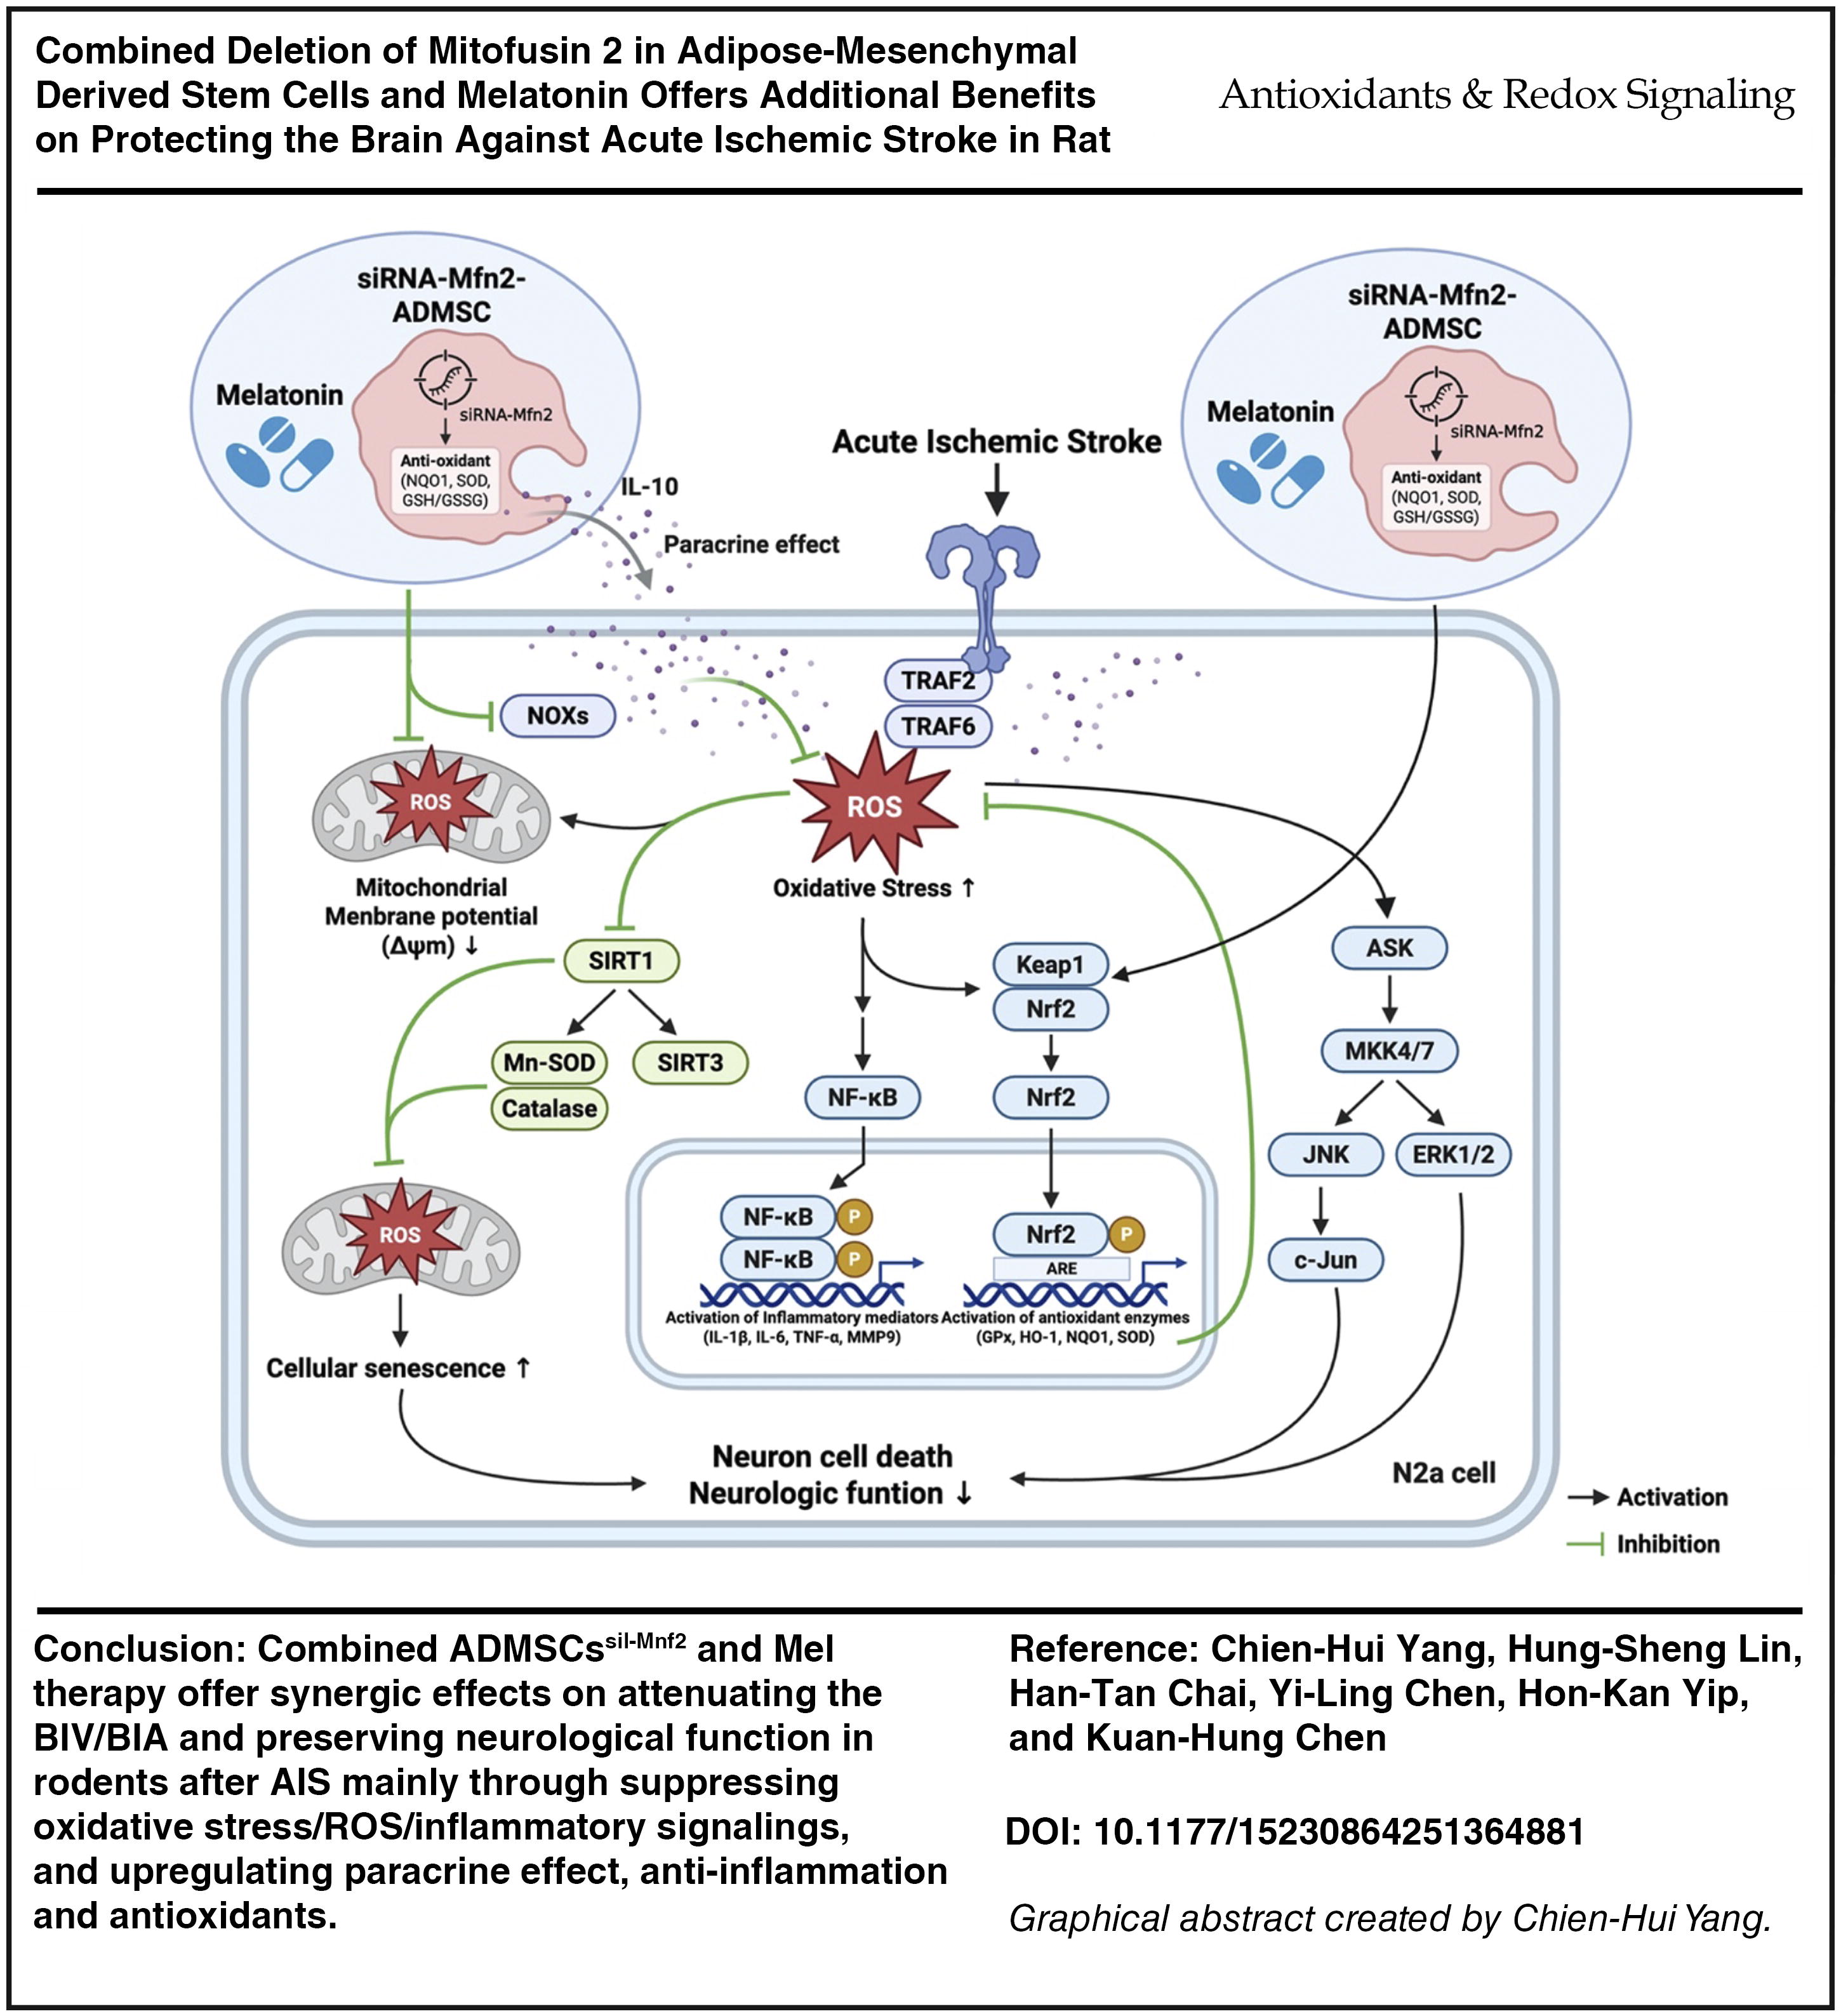
Ischemic stroke (IS) remains the third leading cause of death, and the treatment of acute ischemic stroke (AIS) is still a formidable challenge to clinicians. This study tested the hypothesis that combined silencing Mnf2 gene in adipose-derived mesenchymal stem cells (ADMSCssil-Mnf2) and melatonin (Mel) therapy was superior to monotherapy on attenuating the brain infarct volume (BIV) and improving neurological function in AIS rats.
Results:
In vitro and in vivo studies were conducted. In vitro results showed that as compared with the controls (i.e., ADMSCs/N2a cells), the cellular/protein levels of oxidative stress/reactive oxygen species (ROS)/mitochondrial and DNA damaged/apoptotic/cell stress signaling (tumor necrosis factor [TNF] receptor associated factor 6/ apoptosis signal regulating kinase/MKK4/7/JUN/ERK1/2/c-Jun) biomarkers were significantly increased in these cells treated by H2O2 that were significantly reversed by ADMSCssil-Mnf2 or Mel and further significantly reversed by combined therapy (all p < 0.0001). Animals were categorized into groups 1 (sham-operated control)/2 (AIS)/3 (AIS + Mel)/4 (AIS + ADMSCssil-Mnf2)/5 (AIS + Mel-ADMSCssil-Mnf2) and euthanized by day 28 after AIS. By day 28, the BIV and the brain infarct area (BIA) were lowest in group 1/highest in group 2/significantly lower in group 5 than in groups 3 and 4/significantly increased in group 4 than in group 3, whereas the neurological function displayed an opposite manner of BIV (all p < 0.0001). The protein expressions of oxidative stress/mitochondrial damaged/apoptotic/inflammatory/cell stress signaling biomarkers displayed an identical pattern, whereas the protein expressions of mitochondrial biogenesis/antioxidants and cellular level of neuronal cells exhibited an opposite manner of BIV among the groups (all p < 0.0001).
Innovation and Conclusion:
ADMSCssil-Mnf2 and Mel combined therapy offered synergic effects on attenuating the BIV/BIA and preserving neurological function in rodents after AIS mainly through suppressing oxidative stress/ROS/inflammatory signalings and upregulating antioxidants. Combined ADMSCssil-Mnf2 and Mel therapy offered additional benefits on protecting the brain against AIS in rodents. Antioxid. Redox Signal. 43, 427–447.
Introduction
Stroke is a growing epidemic disease, and >75% of stroke comes up with ischemic stroke (IS). Acute ischemic stroke (AIS) is defined as a sudden onset of a neurological deficit caused by an abrupt focal injury to the brain due to atherosclerotic intracranial arterial occlusion (Aagaard et al., 2016; Ay, 2010; Grotta et al., 2021; Radu et al., 2017; Sacco et al., 2013). The incidence of stroke occurring every year worldwide is about 17 million, and it is the third leading cause of death after coronary artery disease and the second cause of long-term disability and death worldwide (Duncan et al., 2017; Johnson et al., 2016; Kuklina et al., 2012; Lopez et al., 2006; Mozaffarian et al., 2015; O’Donnell et al., 2016).
Plentiful data have reported that thrombolysis with tissue plasminogen activator (tPA) and mechanical thrombectomy for large artery occlusion (i.e., extracranial and intracranial vessels) are two emerging managements for AIS with brilliant outcomes in specific patient subgroups (Herpich and Rincon, 2020; Ospel et al., 2020; Rabinstein, 2020; Silva and Nogueira, 2020; Yang et al., 2020). However, tPA therapy has been identified to be associated with an unacceptably high incidence of intracranial bleeding complications (Adams et al., 2007; Minnerup et al., 2016; Pan et al., 2014; Rangel-Castilla et al., 2016; Stecksen et al., 2012; Wahlgren et al., 2007; Yeo et al., 2013) and low patency rate in large-arterial occlusion; yet, catheter-based intracranial treatment is restricted to AIS patients with large extra- or intracranial vessel occlusion (Minnerup et al., 2016; Rabinstein, 2020; Yang et al., 2020). Accordingly, the majority of AIS patients still lack a valid and safe therapy, implying that rehabilitation is currently still the only standard method for the majority of patients after IS. Therefore, an alternative treatment with safety and efficacy needs to be exploited for patients after AIS, especially for those who are not candidates for tPA therapy or mechanical thrombectomy.
A body of evidence has displayed that cerebral damage following AIS always draws forth complicated pathophysiological events, including upregulations of reactive oxygen species (ROS)/oxidative stress, inflammation, immune responses, and cellular apoptosis/death in ischemic neurons (Chen et al., 2015; Jin et al., 2010; Khoshnam et al., 2017; Yuen et al., 2015; Yuen et al., 2011). These cascades stimulate microglial activation, which in turn emancipate releases of proinflammatory cytokines and, subsequently, further augment inflammatory reaction through recruitment of inflammatory and immune cells into brain lesion zone to adversely participate in tissue damage process and increase autophagic (i.e., fission) activity (Jin et al., 2010; Khoshnam et al., 2017). The ROS/oxidative stress has been even clearly identified to contribute in heightening the mitochondrial damage and cell apoptosis and death (Chen et al., 2015; Khoshnam et al., 2017; Yuen et al., 2011). Consequently, it leads to a vicious cycle of oxidative stress-mitochondrial damage and exhausted ATP, which occurs endlessly after AIS (Yip et al., 2021). Currently, the main goal of therapy in AIS is to preserve brain tissue in the ischemic penumbra rather than in the necrotic area. In this way, ameliorating the effect of reperfusion therapy has been identified; however, it is insufficient to stave off the infarction zone (Yip et al., 2021). Additionally, ischemia-reperfusion injury to the ischemic penumbra, which is mainly caused by free radical, proinflammatory cytokines and inflammatory cell infiltration, frequently occurs, resulting in more ischemic neuron death and augmentation of autophagic activity.
Vast data have shown that adipose-derived mesenchymal stem cell (ADMSC) therapy effectively improved ischemia-related organ dysfunction via anti-inflammation, immunomodulation, and tissue regeneration (Chang et al., 2019; Chen et al., 2019; Ko et al., 2020; Sheu et al., 2019). Additionally, our previous studies have further demonstrated that ADMSC therapy effectively preserved the neurological function and the brain architecture in rodents after AIS (Chen et al., 2016; Chen et al., 2019; Leu et al., 2010; Yip et al., 2021) not only through anti-inflammation, immunomodulation, and tissue regeneration (Alavi and Fuhrmann, 2013; Fang et al., 2004; Lerner et al., 2000; Leu et al., 2010) but also via attenuation of oxidative stress.
Basic research has demonstrated that mitofusin 1 (Mfn1), Mfn2, and optic atrophy 1 (OPA1) (Alavi and Fuhrmann, 2013) play essential roles on regulating the mitochondrial biogenesis (Fang et al., 2004; Lerner et al., 2000) and mitophagy activity. Additionally, basic investigations have further found that mitochondrial fission is facilitated by dynamin-related protein 1 (DRP1), whereas Mfn1 and Mfn2 on the mitochondrial outer membrane and OPA1 on the mitochondrial inner membrane are essential for mitochondrial fusion dynamic homeostasis (Hall et al., 2014; Ong et al., 2015). Interestingly, our recent data further demonstrated that knockdown of Mfn2 gene expression (i.e., small interfering RNA [siRNA]-Mfn2) in cardiomyoblasts (H9C2 cell line) remarkably suppressed the oxidative stress signalings, resulting in preserving the mitochondrial function in H9C2 cells (Yeh et al., 2021). These findings raise the hypothesis that knockdown of Mfn2 gene expression in ADMSCs might be a novel therapeutic potential for those of ischemic neuron in setting of AIS.
Additionally, melatonin (Mel) and its derivatives, which have been identified as the potent-free radical scavengers (Chang et al., 2015; Zhang and Zhang, 2014), have been displayed to play crucial roles in maintaining cell membrane stability and ensuring cell survival in a toxic environment mainly via the reduction of susceptibility to oxidative stress and free radical damage as well as suppression of inflammatory reaction (Chen et al., 2014; Manchester et al., 2015; Sun et al., 2015; Yip et al., 2015). Furthermore, our previous studies have revealed that Mel has capacities of anti-inflammation and downregulation of ROS through regulating the expressions of SIRT1 and SIRT3. Moreover, our studies have previously revealed that Mel therapy effectively protected the organs from ischemic injury via suppressing the oxidative stress and preserving the mitochondrial functional integrity (Lee et al., 2018). Based on the aforementioned issues, it is rationale to believe that combined therapy with Mel and deletion of Mfn2 in ADMSCs would protect the integrities of brain architecture and motor function in rodents after AIS.
Results
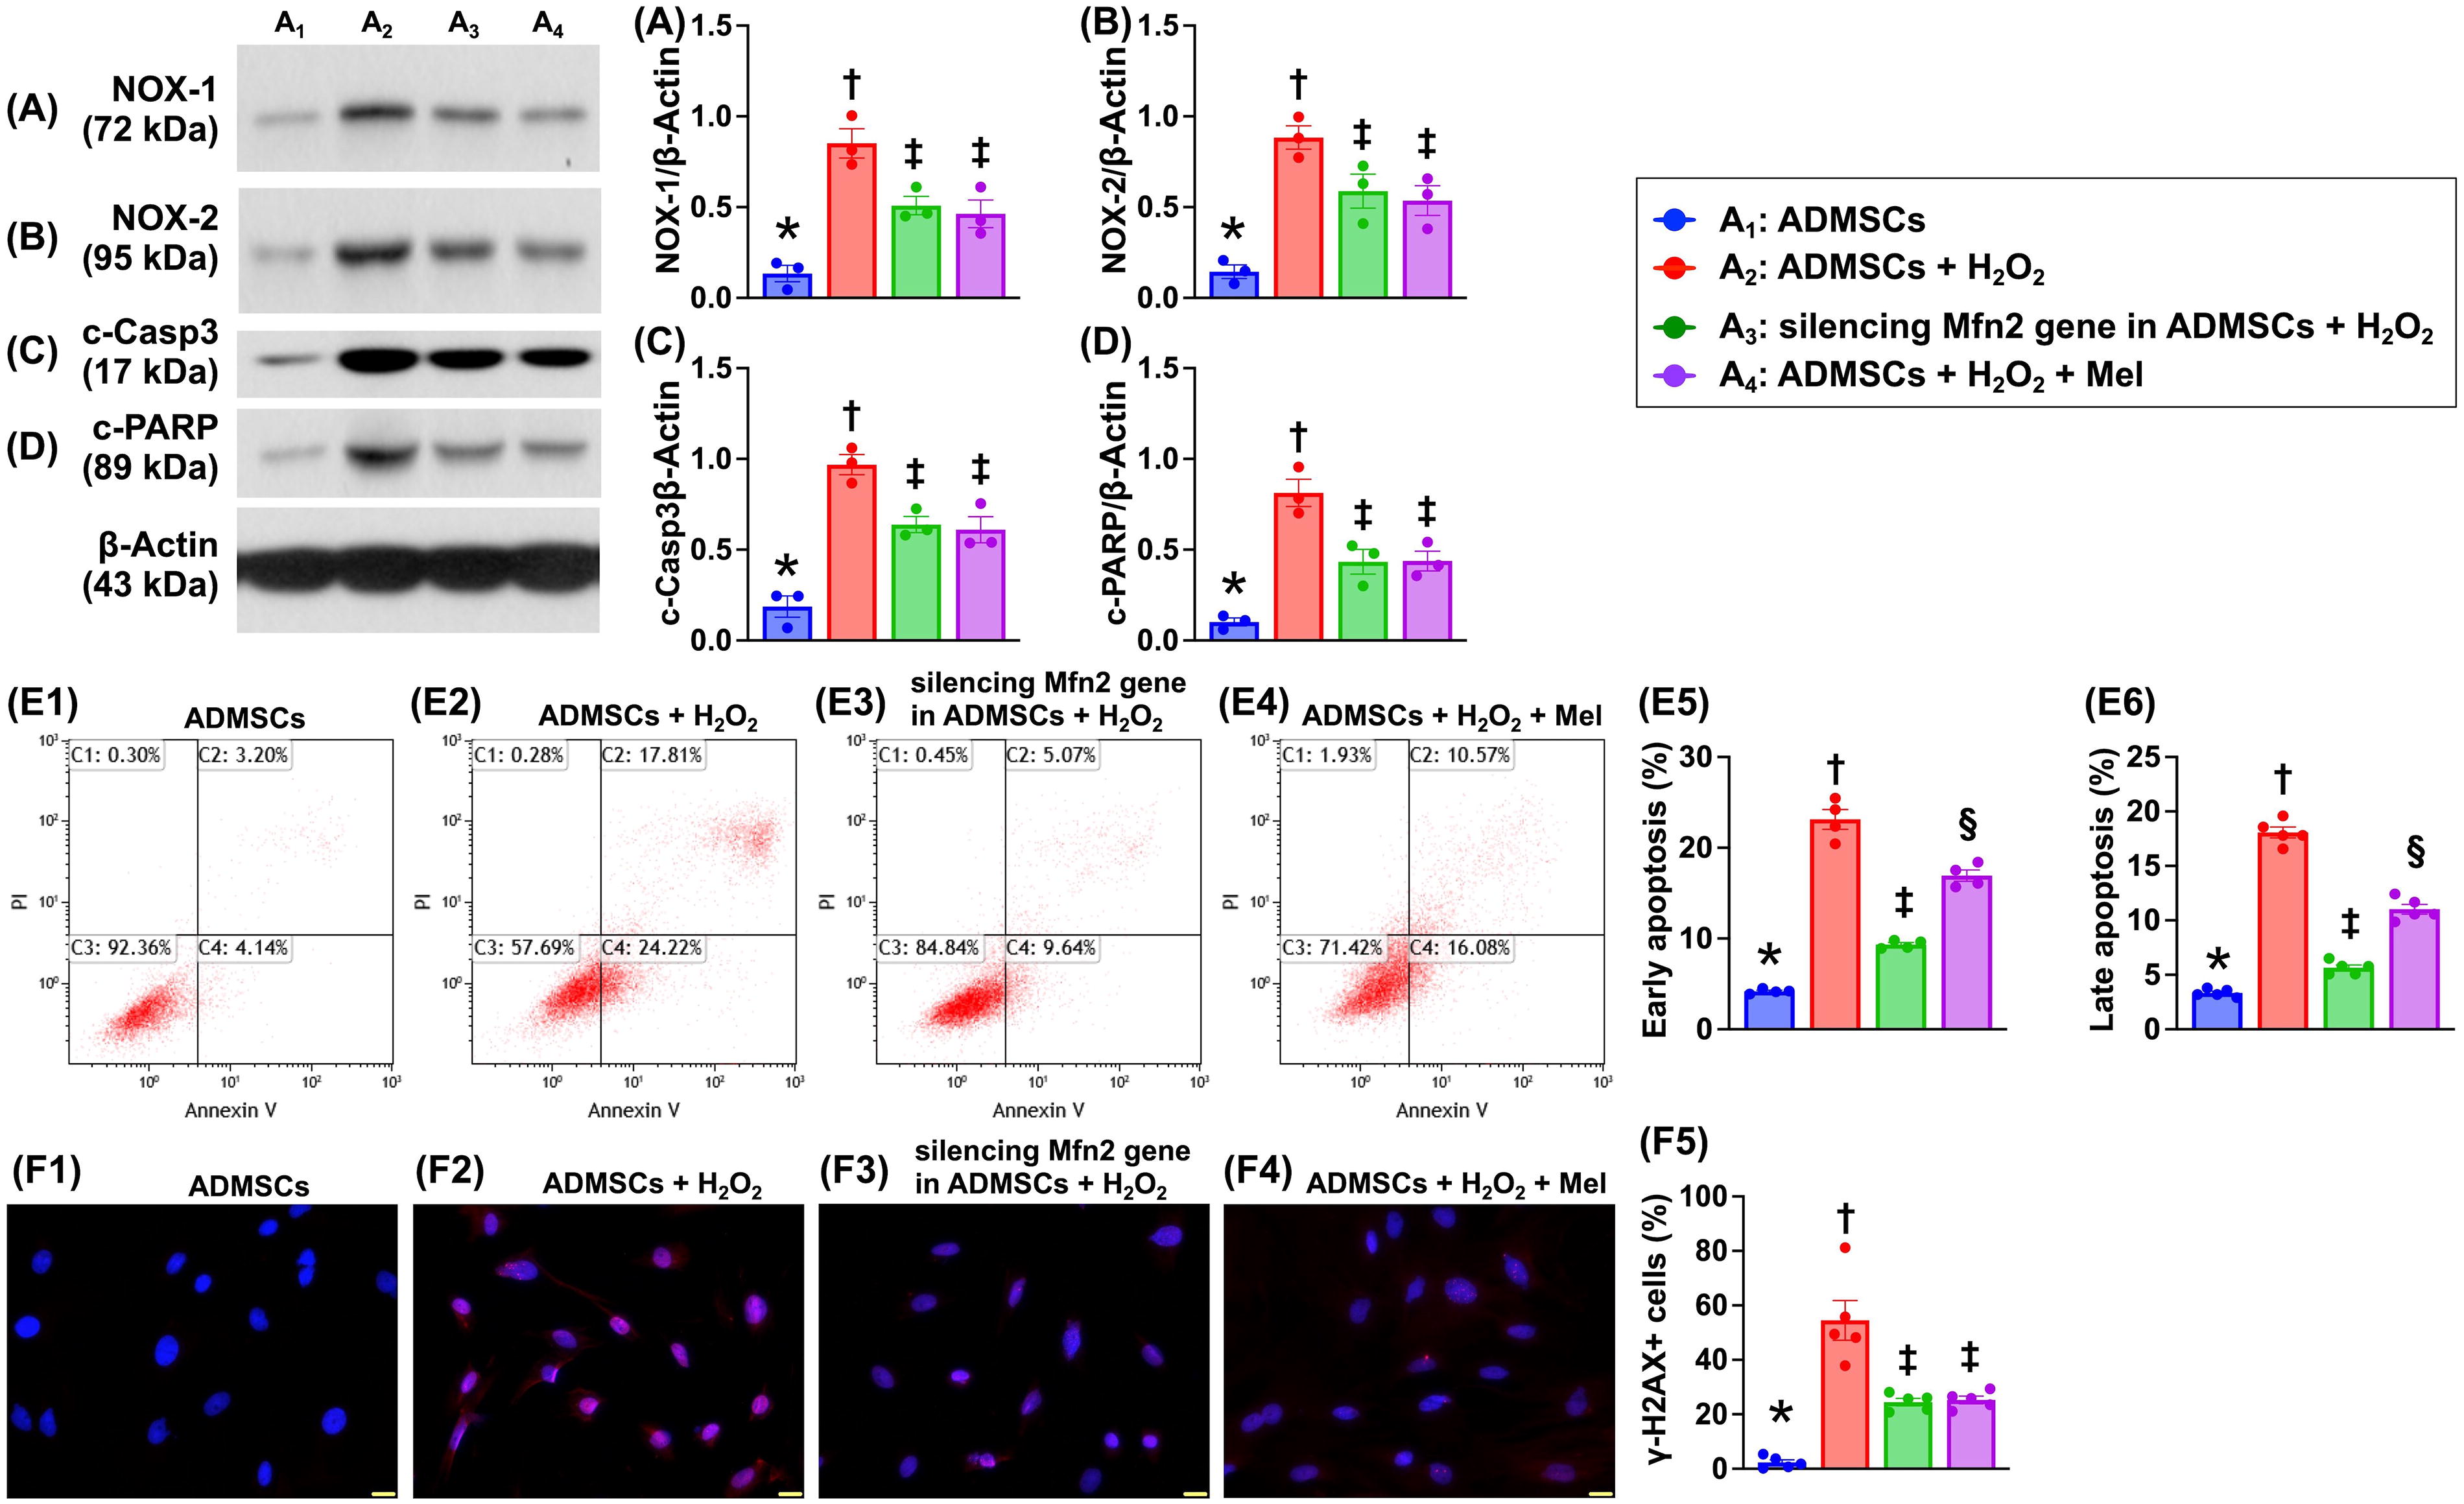
Impact of silencing Mfn2 gene and Mel on protecting the ADMSCs against H2O2 damage
To elucidate whether silencing the Mfn2 gene in ADMSCs and Mel therapy would protect the ADMSCs far away from oxidative stress damage, the Western blot analysis was conducted in the in vitro study (Fig. 1). The results demonstrated that as compared with A1 (i.e., ADMSCs only), the protein expressions of NOX-1 and NOX-2, two indicators of oxidative stress, and protein expressions of cleaved caspase 3 and cleaved PARP, two indices of apoptosis, were significantly increased in A2 (ADMSCs + H2O2) that were significantly reversed in A3 (silencing Mfn2 gene in ADMSCs + H2O2) and A4 (ADMSCs + H2O2 + Mel), but they showed no difference between A3 and A4. Additionally, to elucidate the impact of these two therapeutic regimens on protecting the ADMSCs against H2O2-induced cellular levels of apoptosis, the flow cytometric analysis was conducted in the in vitro study. The result showed that the early (AN-V + /propidium iodide [PI]−) apoptosis and late (AN-V + /PI +) apoptosis were significantly lower in A1 than in other groups, significantly higher in A2 than in A3 and A4, and significantly higher in A4 than in A3. Furthermore, the cellular expression of γ-H2AX, an index of DNA-damaged marker, exhibited an identical pattern of NOX-1 among the groups. Our findings, in addition to proving that silencing the Mfn2 gene in ADMSCs and Mel was comparable with attenuating the above identified molecular–cellular perturbations, encouraged that we should further evaluate the two therapeutic modalities on protecting the neuronal cells against H2O2 damage (referred to Figs 2–5).
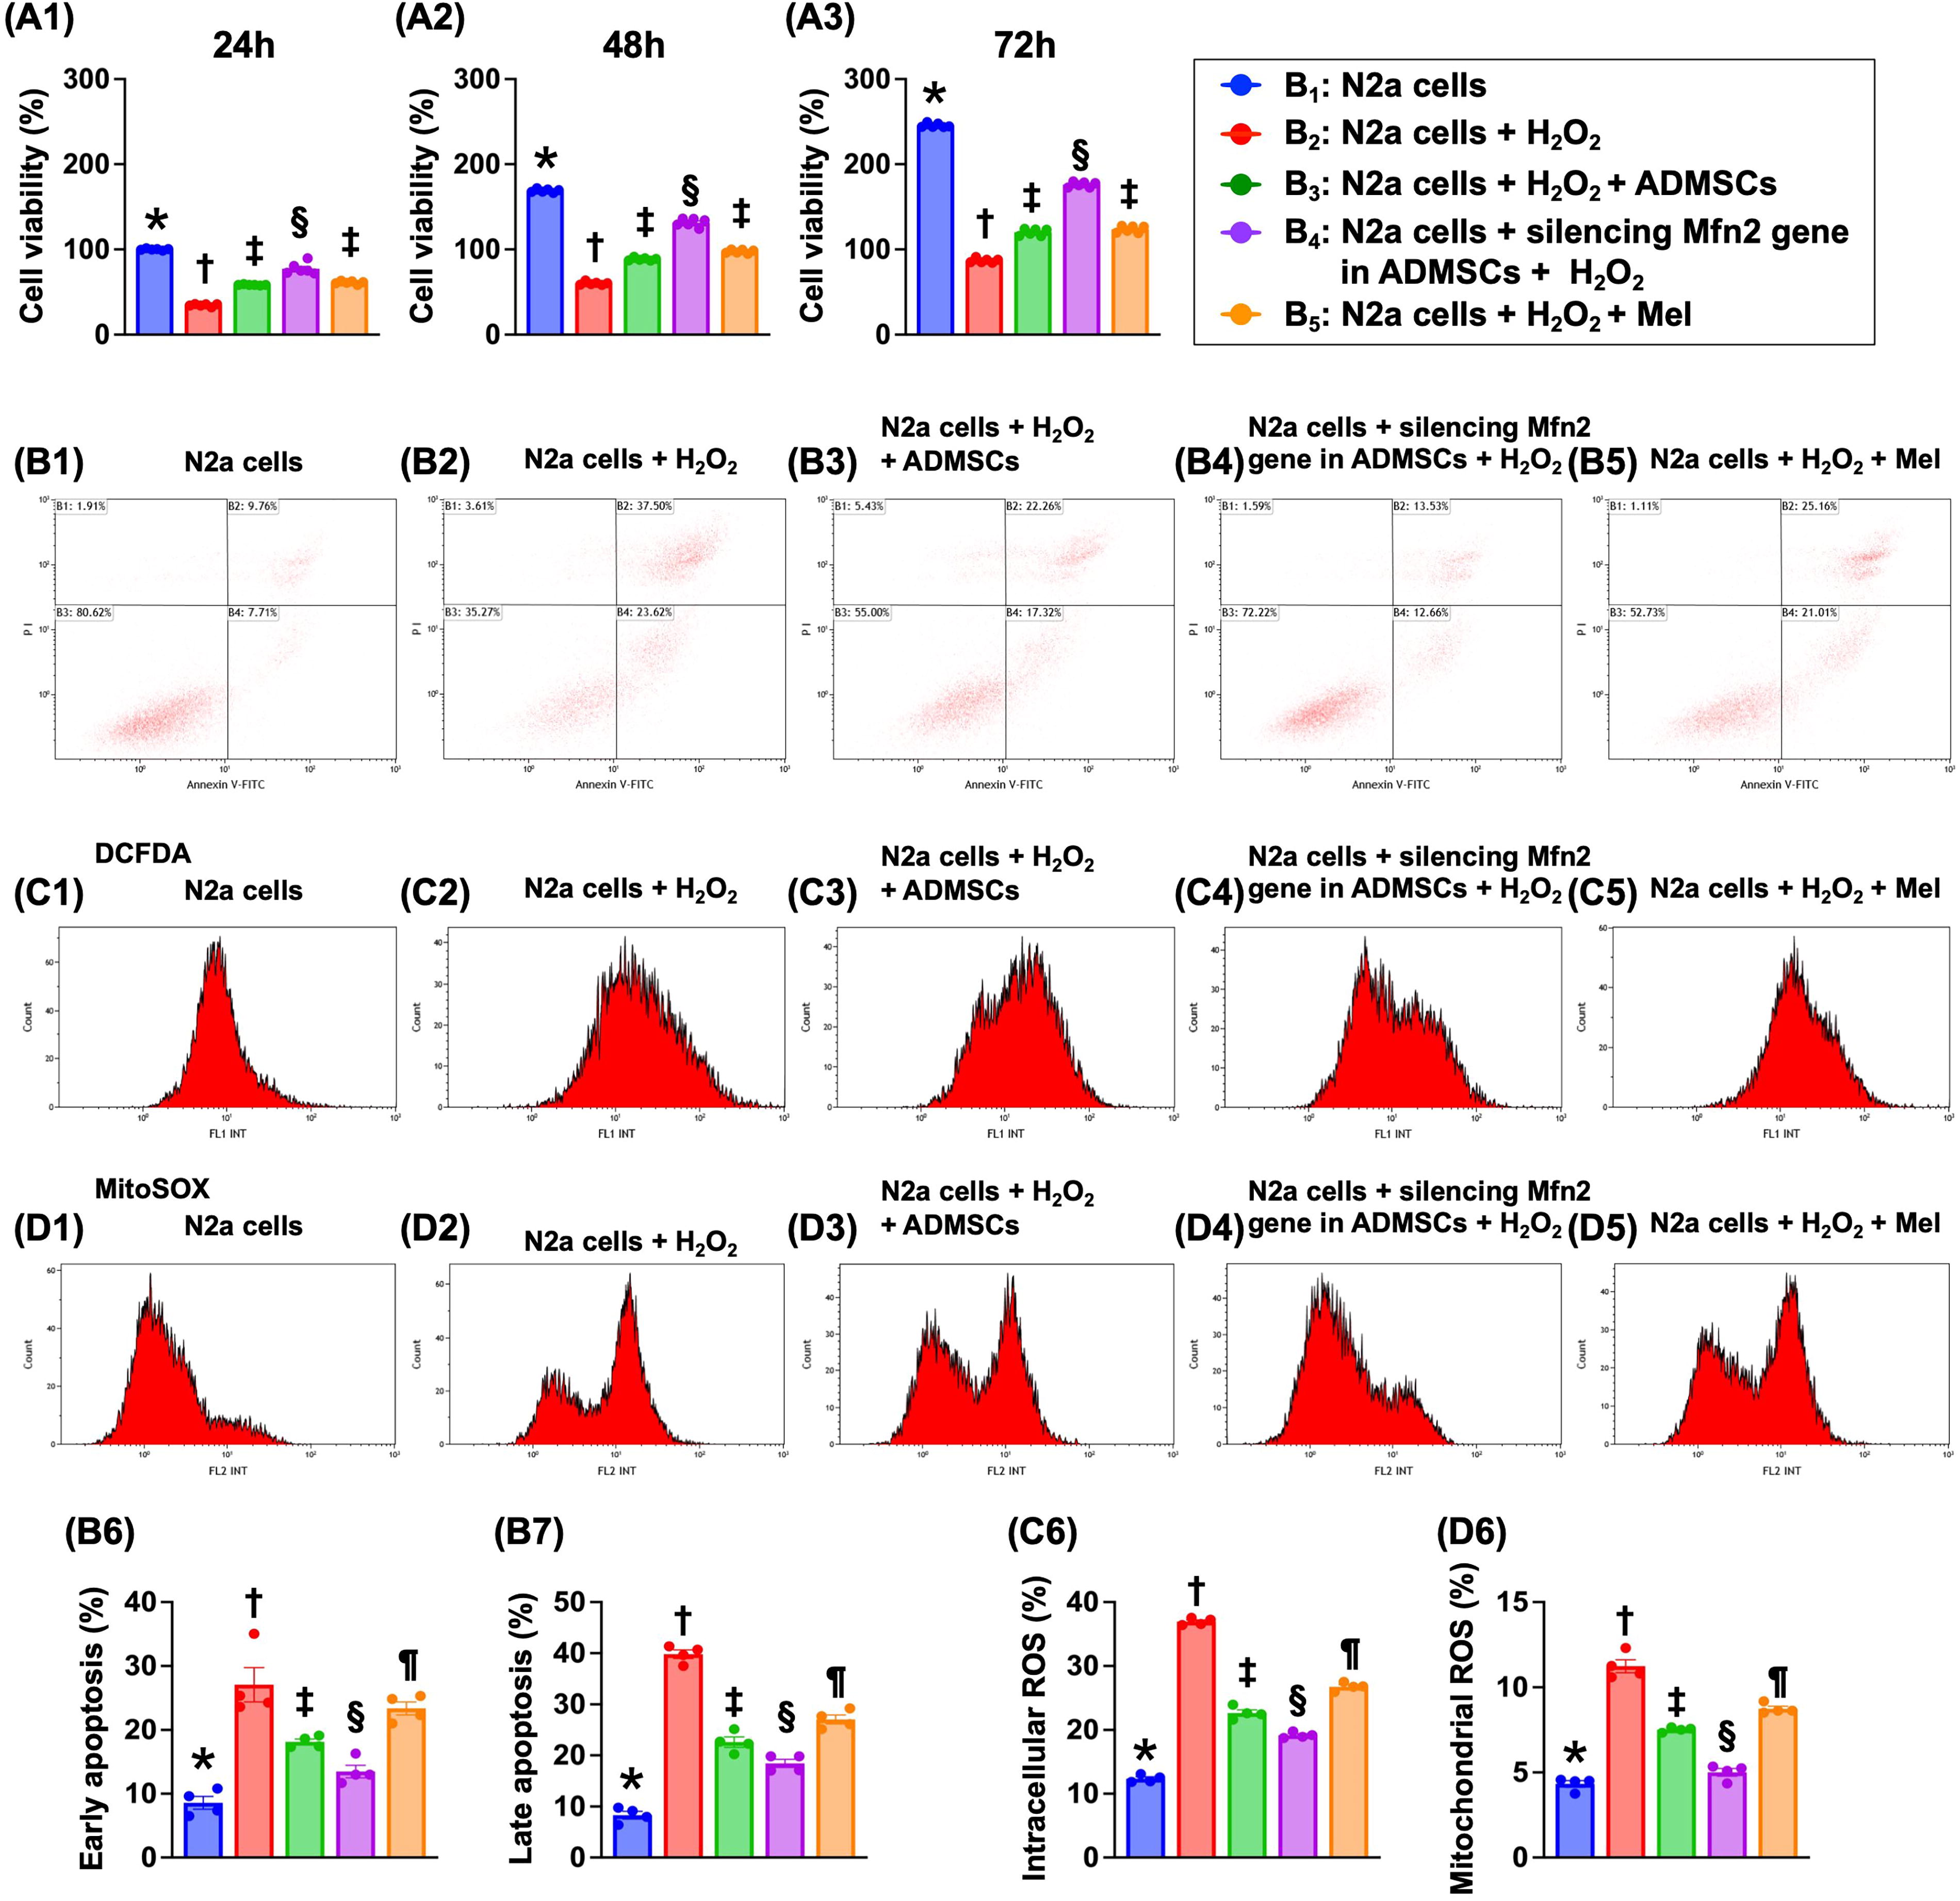
Impact of silencing Mfn2 gene in ADMSCs and Mel therapy on cell viability, cellular apoptosis, and generation of ROS
MTT assay showed that the cell viability at the time points of 24, 48, and 72 h was highest in B1 (N2a cells only), lowest in B2 (N2a cells + H2O2), and significantly higher in B4 (N2a cells + siRNA-Mfn2 in ADMSCs + H2O2) than in B3 (N2a cells + H2O2 + ADMSCs) and B5 (N2a cells + H2O2 + Mel), but it showed no difference between B3 and B5 (Fig. 2).
The flow cytometric analysis demonstrated that the early apoptosis and late apoptosis were lowest in B1, highest in B2, significantly lower in B4 than in B3 and B5, and significantly lower in B3 than in B5. Additionally, the flow cytometric analysis demonstrated that the total intracellular and mitochondrial ROS expressed an identical pattern of apoptosis among the groups.
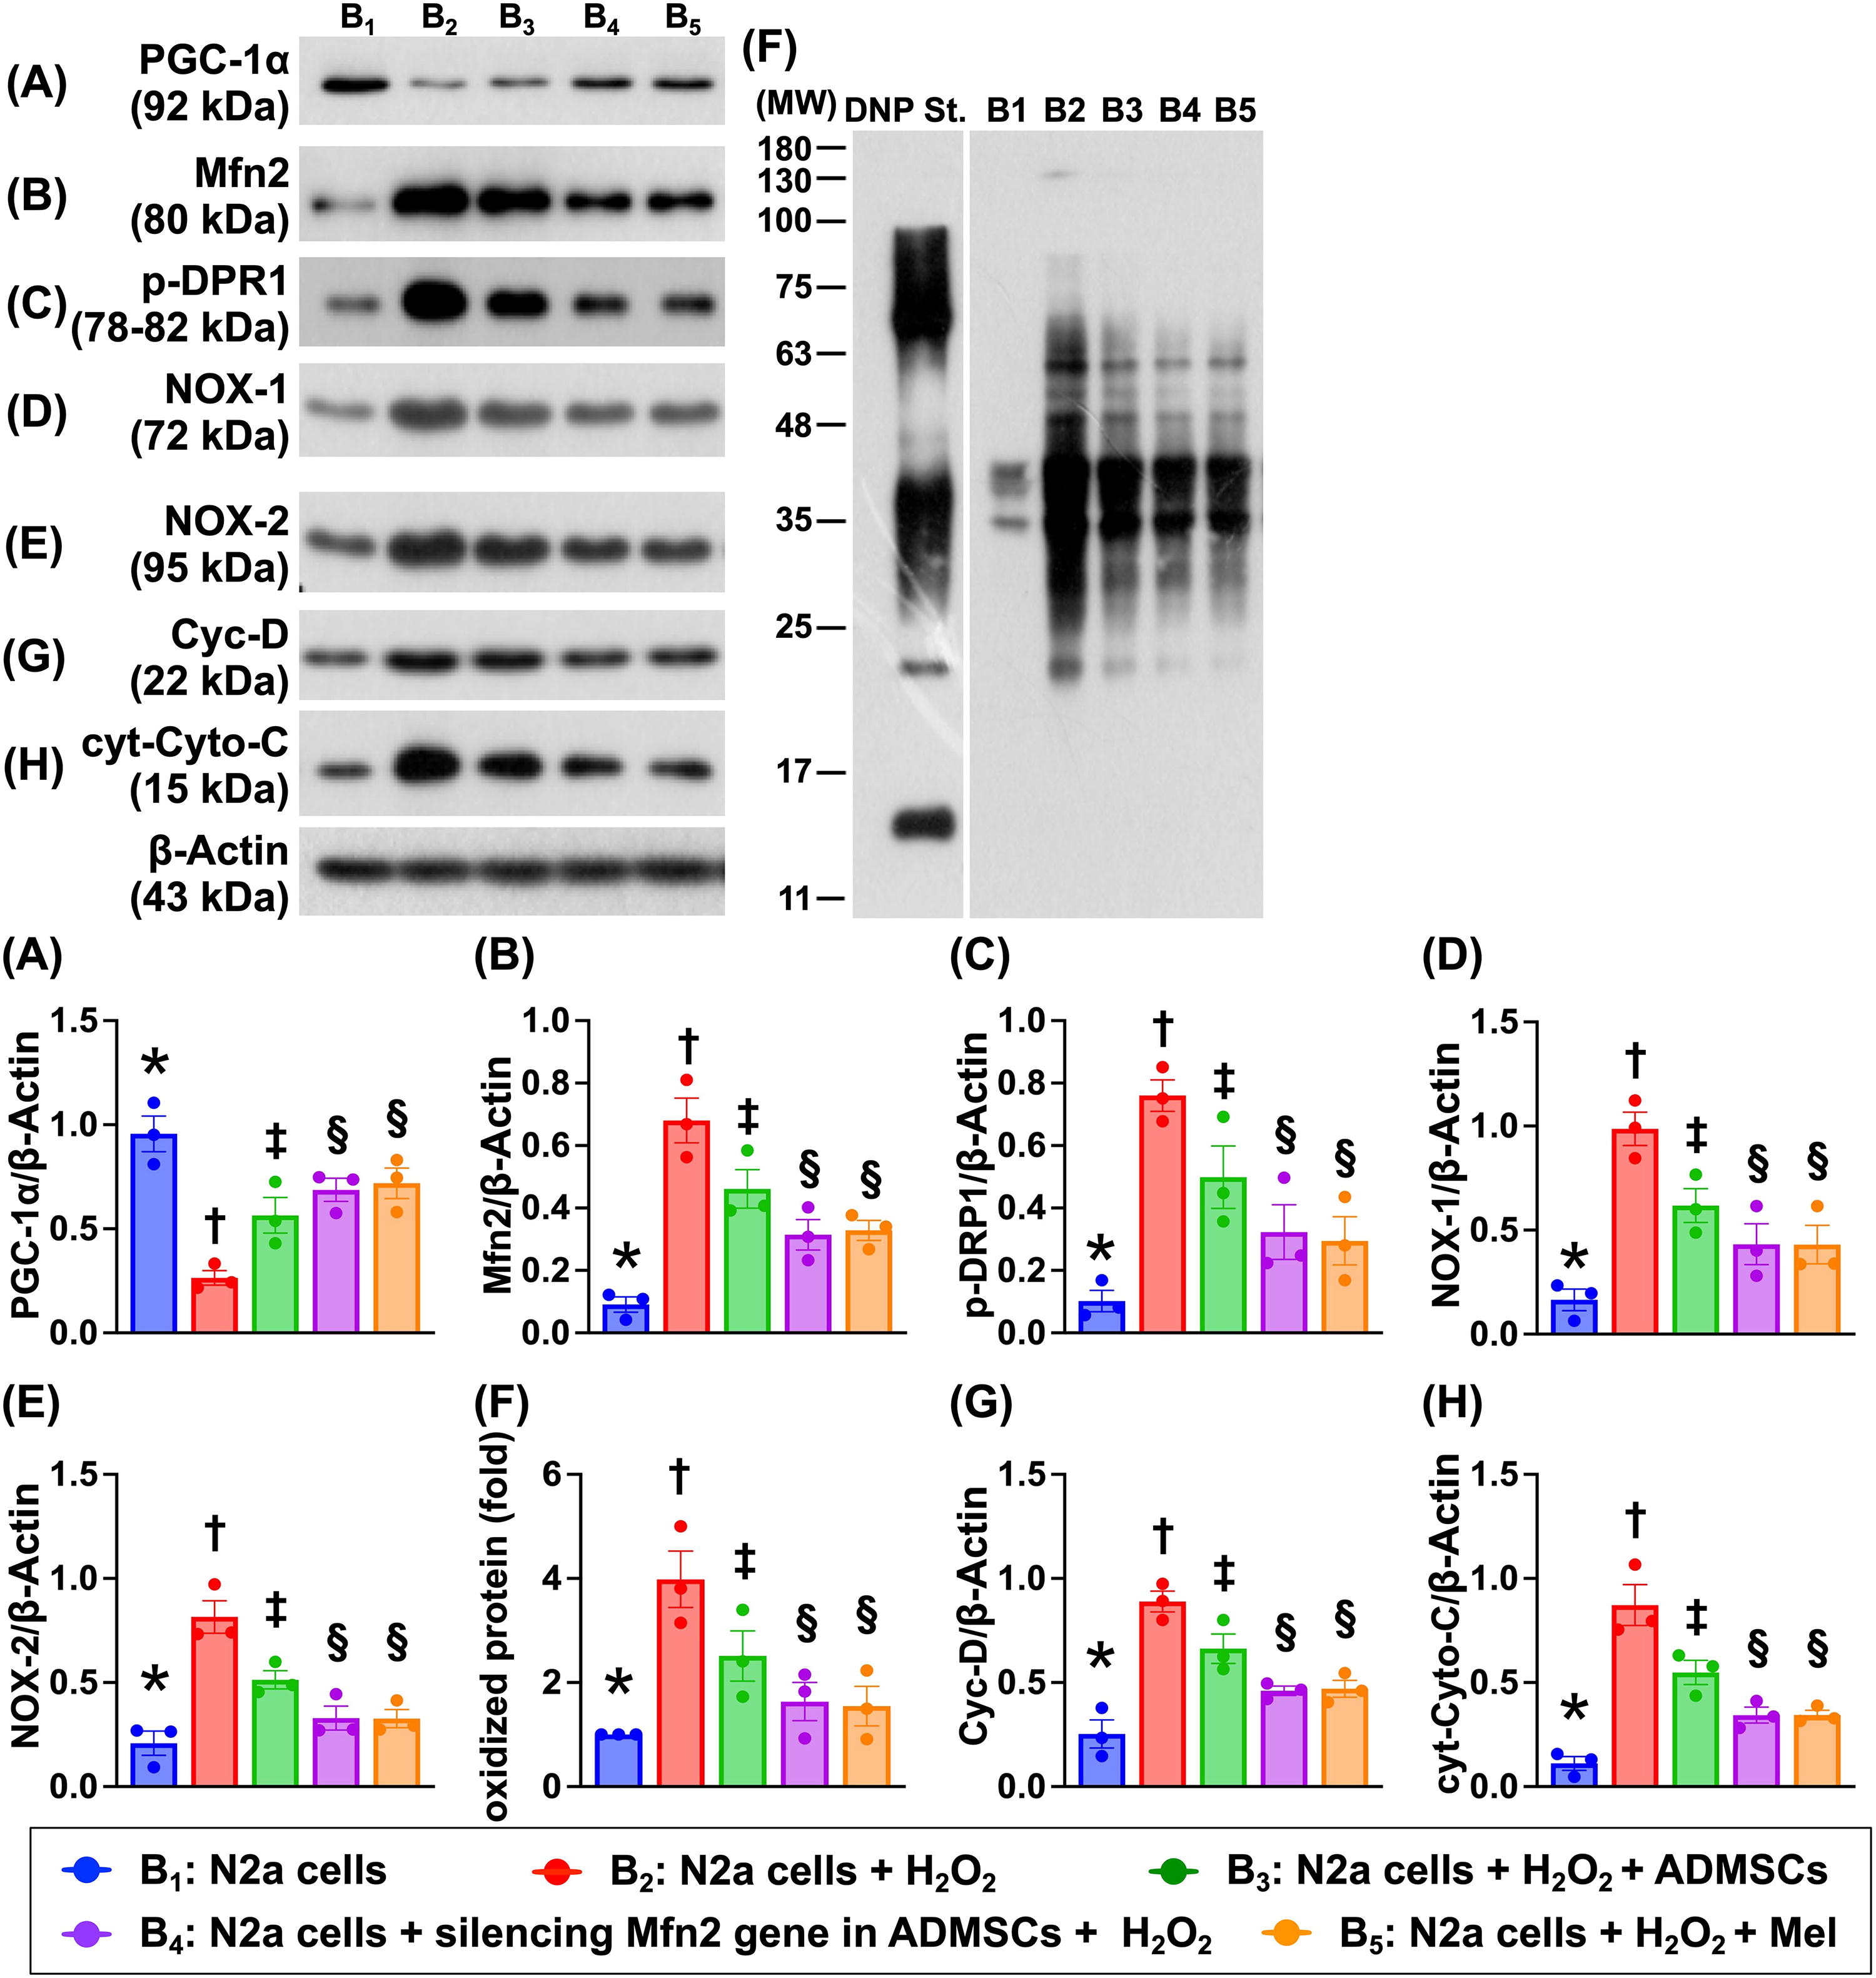
Impact of silencing Mfn2 gene in ADMSCs and Mel therapy on the protein expressions of mitochondrial biogenesis, mitochondrial-damaged, and oxidative stress biomarkers
To verify how silencing the Mfn2 gene in ADMSCs and Mel therapy on protecting the mitochondrial biogenic activity, the N2a cells were categorized into five groups that were identical to Figure 2 (i.e., B1 to B5; Fig. 3). The result demonstrated that the protein level of PGF-1α, an indicator of mitochondrial biogenesis, was highest in B1, lowest in B2, and significantly lower in B3 than in B4 and B5, but this parameter showed no significant difference between the latter two groups. In contrast, the protein level of Mfn2, an indicator of dynamic regulation of mitochondrial fusion, exhibited an opposite pattern of PGF-1α among the groups. Additionally, the protein expression of p-DRP1, an indicator of dynamic regulation of mitochondrial fission, also displayed an opposite pattern of PGF-1α among the groups. Furthermore, the protein expressions of NOX-1, NOX-2, and oxidized protein, three indicators of oxidative stress, and protein expressions of cyclophilin D and cytosolic cytochrome C, two mitochondrial damage biomarkers, also displayed an opposite manner of PGF-1α among the five groups. Our finding suggested that Mel was comparable with silencing the Mfn2 gene in ADMSC therapy on protecting the neuronal cells against oxidative stress damage.
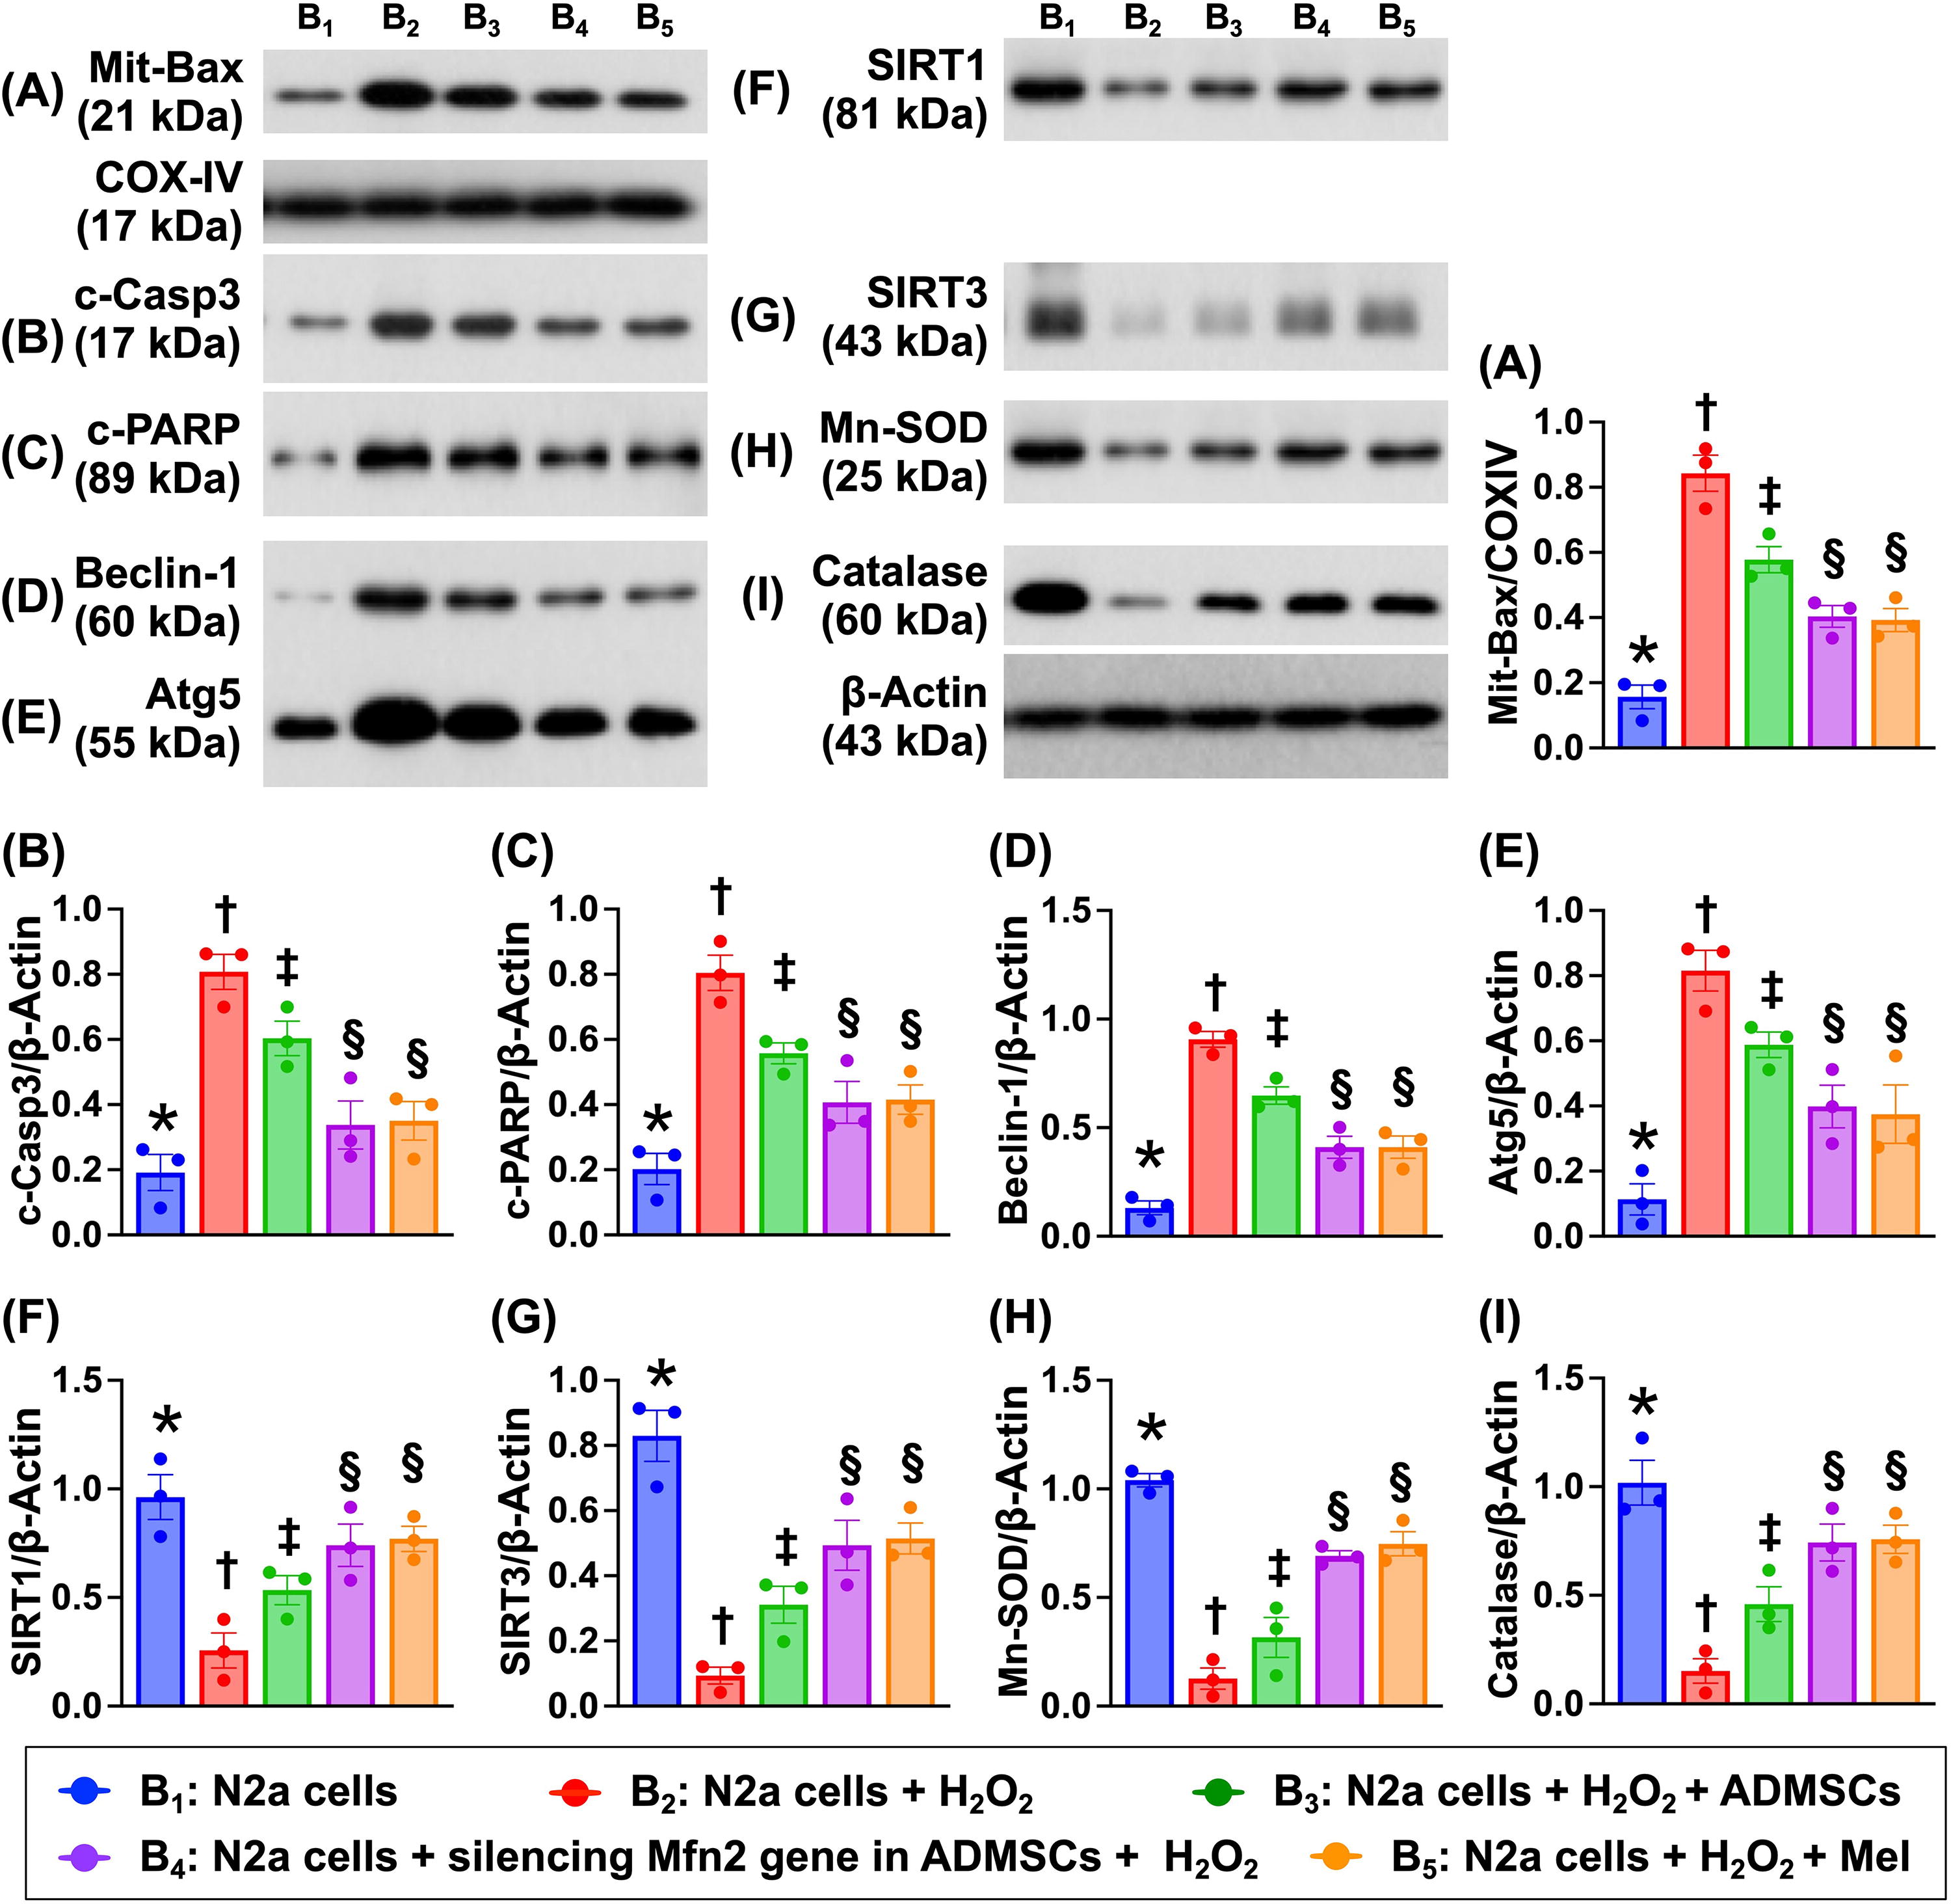
Impact of silencing Mfn2 gene in ADMSCs and Mel therapy on protein levels of apoptosis, autophagy, and antioxidant
To clarify the variables in Figure 4, the Na2 cells were still categorized into B1 to B5, respectively, and the Western blot analysis was conducted in this in vitro study. The result showed that the protein expressions of mitochondrial Bax, cleaved caspase 3 and cleaved PARP, the indices of apoptosis, and the protein expressions of beclin-1 and Atg5, two indicators of autophagy, were lowest in B1, highest in B2, and significantly higher in B3 than in B4 and B5, but they did not differ between B4 and B5. In contrast, the protein expressions of SIRT1, SIRT3, manganese-dependent superoxide dismutase (Mn-SOD), and Catalase, four indicators of antioxidants, exhibited an opposite pattern of apoptosis among the groups. These findings implied that silencing the Mfn2 gene in ADMSCs was similar to Mel with strong antioxidative effect through upregulating the intracellular antioxidant expression.
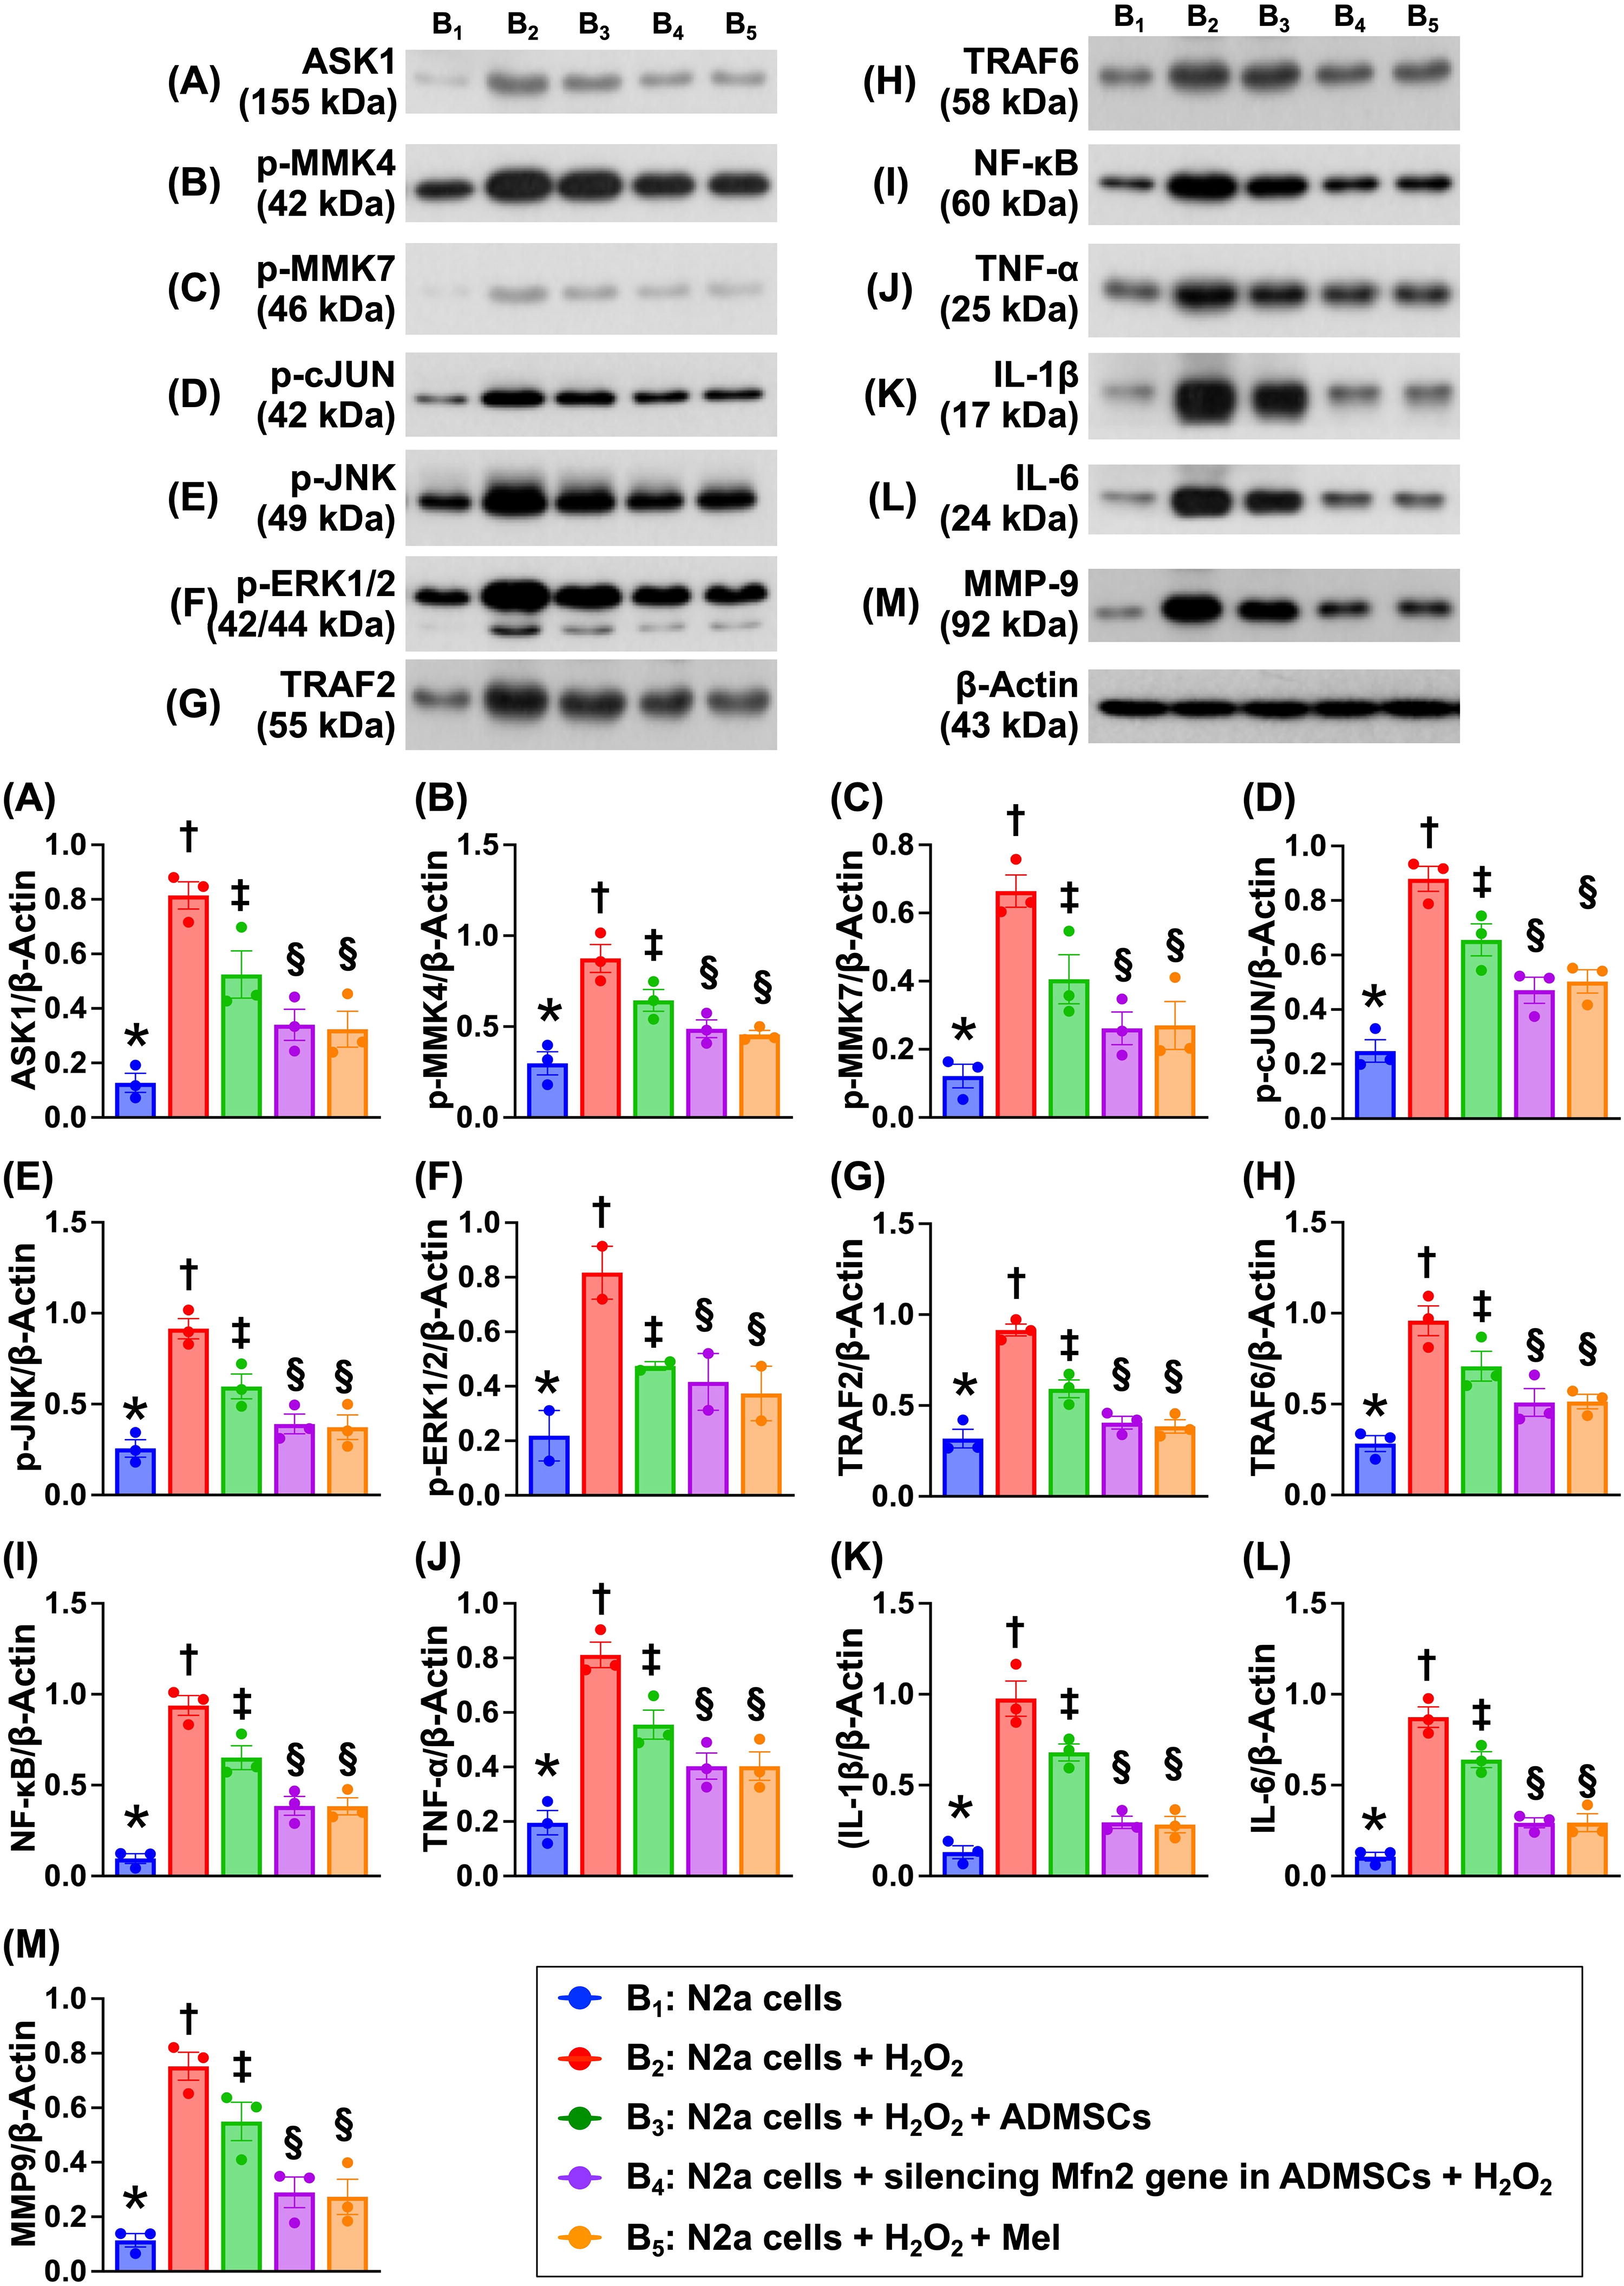
Impact of silencing Mfn2 gene in ADMSCs and Mel therapy on regulating the cell stress and inflammatory signalings
To verify which signaling would participate in brain damage after AIS, the Western blot was utilized again in the in vitro study (Fig. 5). The result demonstrated that the protein expressions of apoptosis signal regulating kinase 1 (ASK1), p-MMK4, p-MMK7, p-c-JUN, p-JNK, and p-ERK1/2, six biomarkers of cell stress signaling, were lowest in B1, highest in B2, and significantly higher in B3 than in B4 and B5, but they showed no difference in B4 and B5. Additionally, the protein expressions of tumor necrosis factor (TNF) receptor associated factor 2 (TRAF2), TRAF6, nuclear factor (NF)-κB, TNF-α, interleukin (IL)-1β, IL-6, and matrix metalloproteinase 9 (MMP-9), seven biomarkers of inflammatory signaling, displayed an identical pattern of cell stress signaling among the groups.
Impact of silencing Mfn2 gene in ADMSCs and Mel therapy on cellular senescence, DNA damage, and mitochondrial cytochrome C
To verify the protective effect of silencing Mfn2 and Mel therapy on neuron cell against oxidative stress damage, the immunofluorescent (IF) microscopic examination was conducted (Supplementary Fig. S1). The result showed that cellular expressions of β-galactosidase and γ-H2AX in N2a cells were lowest in B1, highest in B2, and significantly lower in B3 than in B4 and B5, but they showed no difference between the B4 and B5. In contrast, the number of mitochondrial cytochrome C, an indicator of mitochondrial integrity, exhibited an opposite pattern of β-galactosidase among the groups.
Impact of silencing Mfn2 gene in ADMSCs on protein level of keap-1/Nfr2/ARE signaling in neurons
To clarify the impact of silencing Mfn2 and Mel therapy on upregulating the protein level of antioxidants in ADMSCs, the Western blot analysis was conducted in the in vitro study (Supplementary Fig. S2). The result showed that the protein levels of keap-1, Nrf2, GPx, HO-1, and NQO1, five indices of antioxidants, were significantly and progressively increased from B1 to B2 and then to B4, implicating that undergoing H2O2 stimulation and silencing Mfn2 in ADMSC-treated neurons offered benefit on enhancing the generation of antioxidants against oxidative stress.
Impact of silencing Mfn2 gene in ADMSCs on augmenting the anti-inflammation and antioxidants, and alleviating total intracellular and mitochondrial ROS
To verify the impact of silencing Mfn2 on downregulation of ROS and upregulation of antioxidants and anti-inflammation in ADMSCs, the cells were categorized into C1 (ADMSCs), C2 (siRNA Mfn2 in ADMSCs), C3 (ADMSCs + H2O2), and C4 (siRNA Mfn2 in ADMSCs + H2O2; Supplementary Fig. S3). The result of ELISA showed that the culture medium levels of IL-10, an index of anti-inflammation, was lowest in C3, highest in C2, and significantly higher in C4 than in C1. Additionally, intracellular levels of GSH and ratio of GSH to GSSG, two indicators of antioxidants, displayed a pattern identical to IL-10, whereas the GSSG level, an index of oxidant, expressed an opposite pattern of GSH among the groups.
Additionally, the flow cytometric analysis showed that the total intracellular and mitochondrial ROS were highest in C3, lowest in C2, and significantly higher in C4 than in C1. Furthermore, the protein expressions of NQO1 and SOD, two indices of antioxidants, were significantly and progressively increased from C1 to C4, whereas the protein expression of Mfn2 was significantly higher in C3 than in other groups and significantly lower in C2 than in C1 and C4, but it showed no difference between C1 and C4. These findings implicated that silencing the Mfn2 gene in ADMSCs in situation of H2O2 (i.e., oxidative stress) stimulation offered benefit on attenuating cell damage through upregulation of antioxidants and anti-inflammation and downregulation of intracellular and mitochondrial ROS.
Time courses of neurological function and MRI finding for BIV by day 28 after AIS induction
Based on the promising results of in vitro study, we then carried out an AIS animal study to evaluate whether silencing the Mfn2 gene in ADMSCs and Mel therapy would improve the neurological function; the corner test was performed at the time intervals of day 0 (i.e., prior to AIS induction) and days 3, 7, 14, and 28 after AIS induction (Fig. 6). The result showed that at day 0, the neurological function was similar among the groups. However, at days 3, 7, 14, and 28 after AIS induction, the neurological function was significantly impaired in group 2 (AIS only), group 3 (AIS + Mel), group 4 (AIS + siRNA-Mfn2 in ADMSCs), and group 5 (AIS + Mel + siRNA-Mfn2 in ADMSCs) as compared with that of the group 1 (SC), notably lower in group 2 than in groups 3 to 5. Additionally, by day 3 after AIS induction, the neurological function was notably impaired in group 3 than in groups 4 and 5. In contrast, by days 7 and 14 after AIS induction, this parameter was similar among the groups 3, 4, and 5. However, by day 28 after AIS, this parameter was significantly improved in group 5 than in groups 3 and 4, but it showed no difference between the latter two groups.
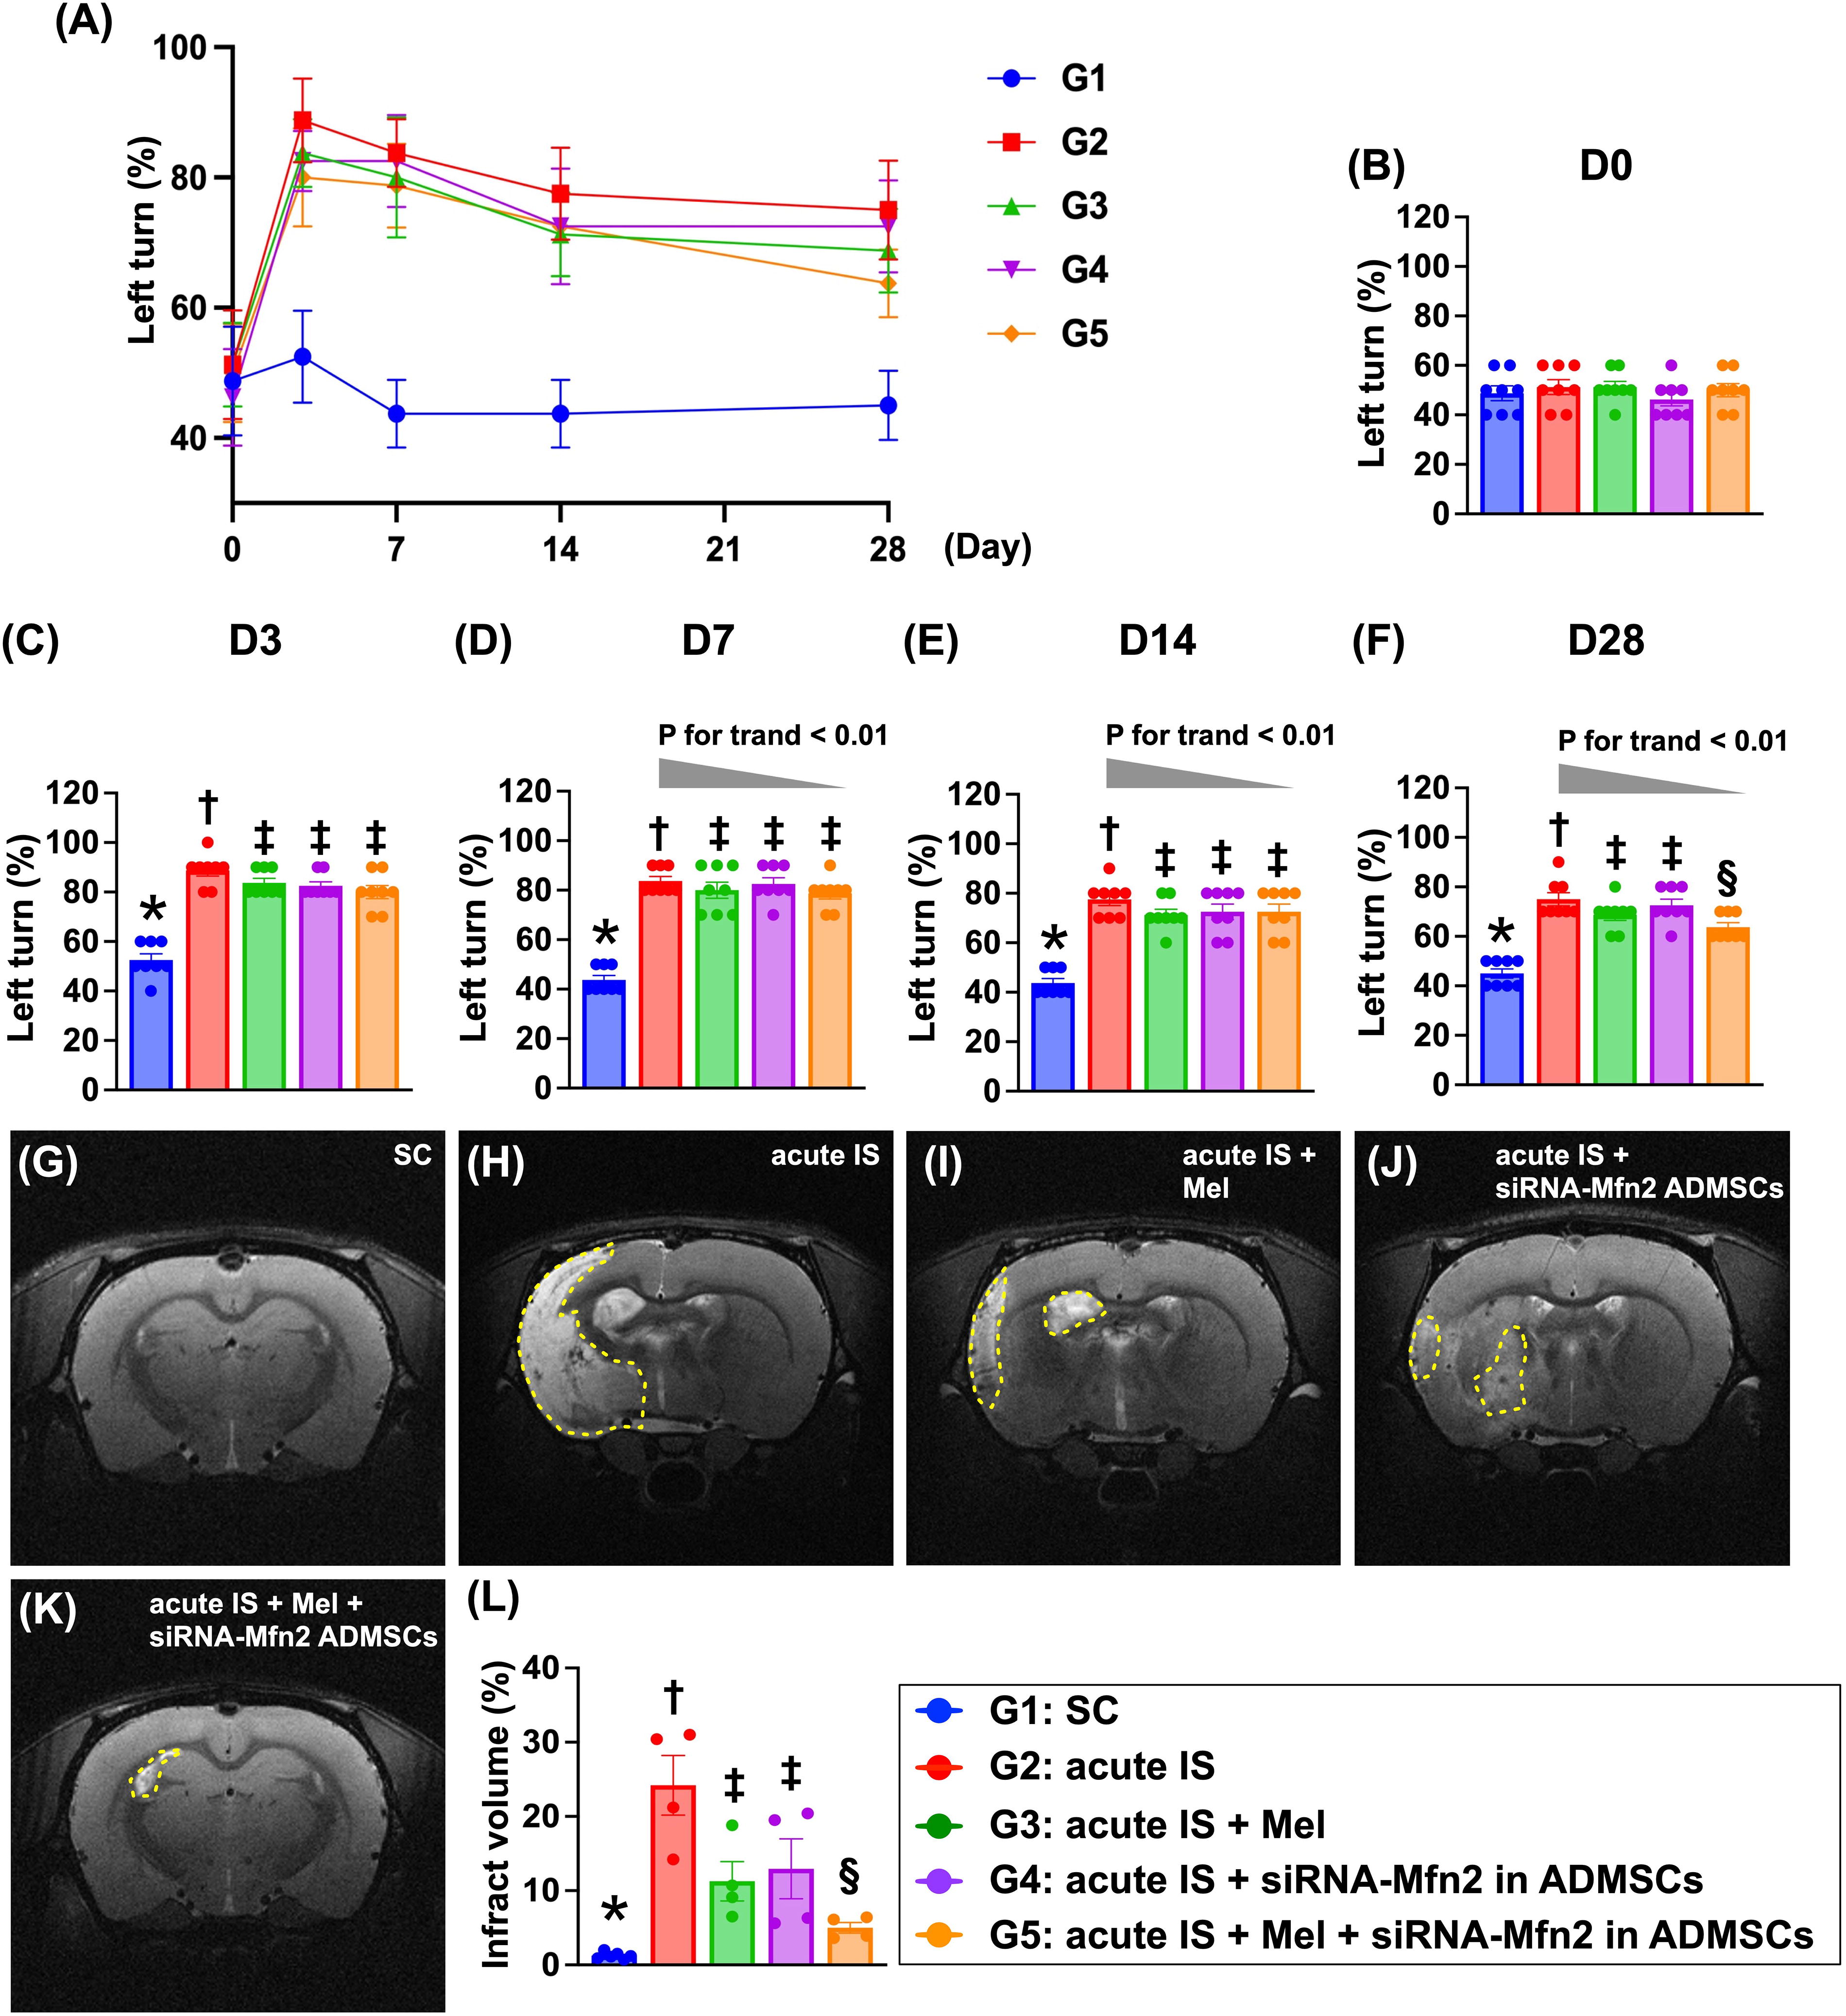
To further assess the brain ischemic zone, the brain magnetic resonance imaging (MRI) study was utilized. As we expected, by day 28 after AIS induction, the brain MRI showed that the brain infarct volume (BIV) was lowest in group 1, highest in group 2, significantly lower in groups 3 and 4, and further significantly lower in group 5 as compared with group 2, but it showed no difference between groups 3 and 4. Our findings, therefore, implicated that combined Mel + silencing Mfn2 gene in ADMSCs was superior to either one alone on improving neurological function and reducing the BIV.
Cellular levels of DNA-damaged biomarker, reactive astrocytes, and BIA by day 28 after AIS induction
The cellular levels of γ-H2AX, an indicator of DNA-damage marker, and positively stained glial fibrillary acidic protein (GFAP), an index of activated astrocytes in IS, were significantly increased in group 2 as compared with group 1 that were significantly revised in groups 3 and 4 and further significantly reversed in group 5 (Fig. 7).
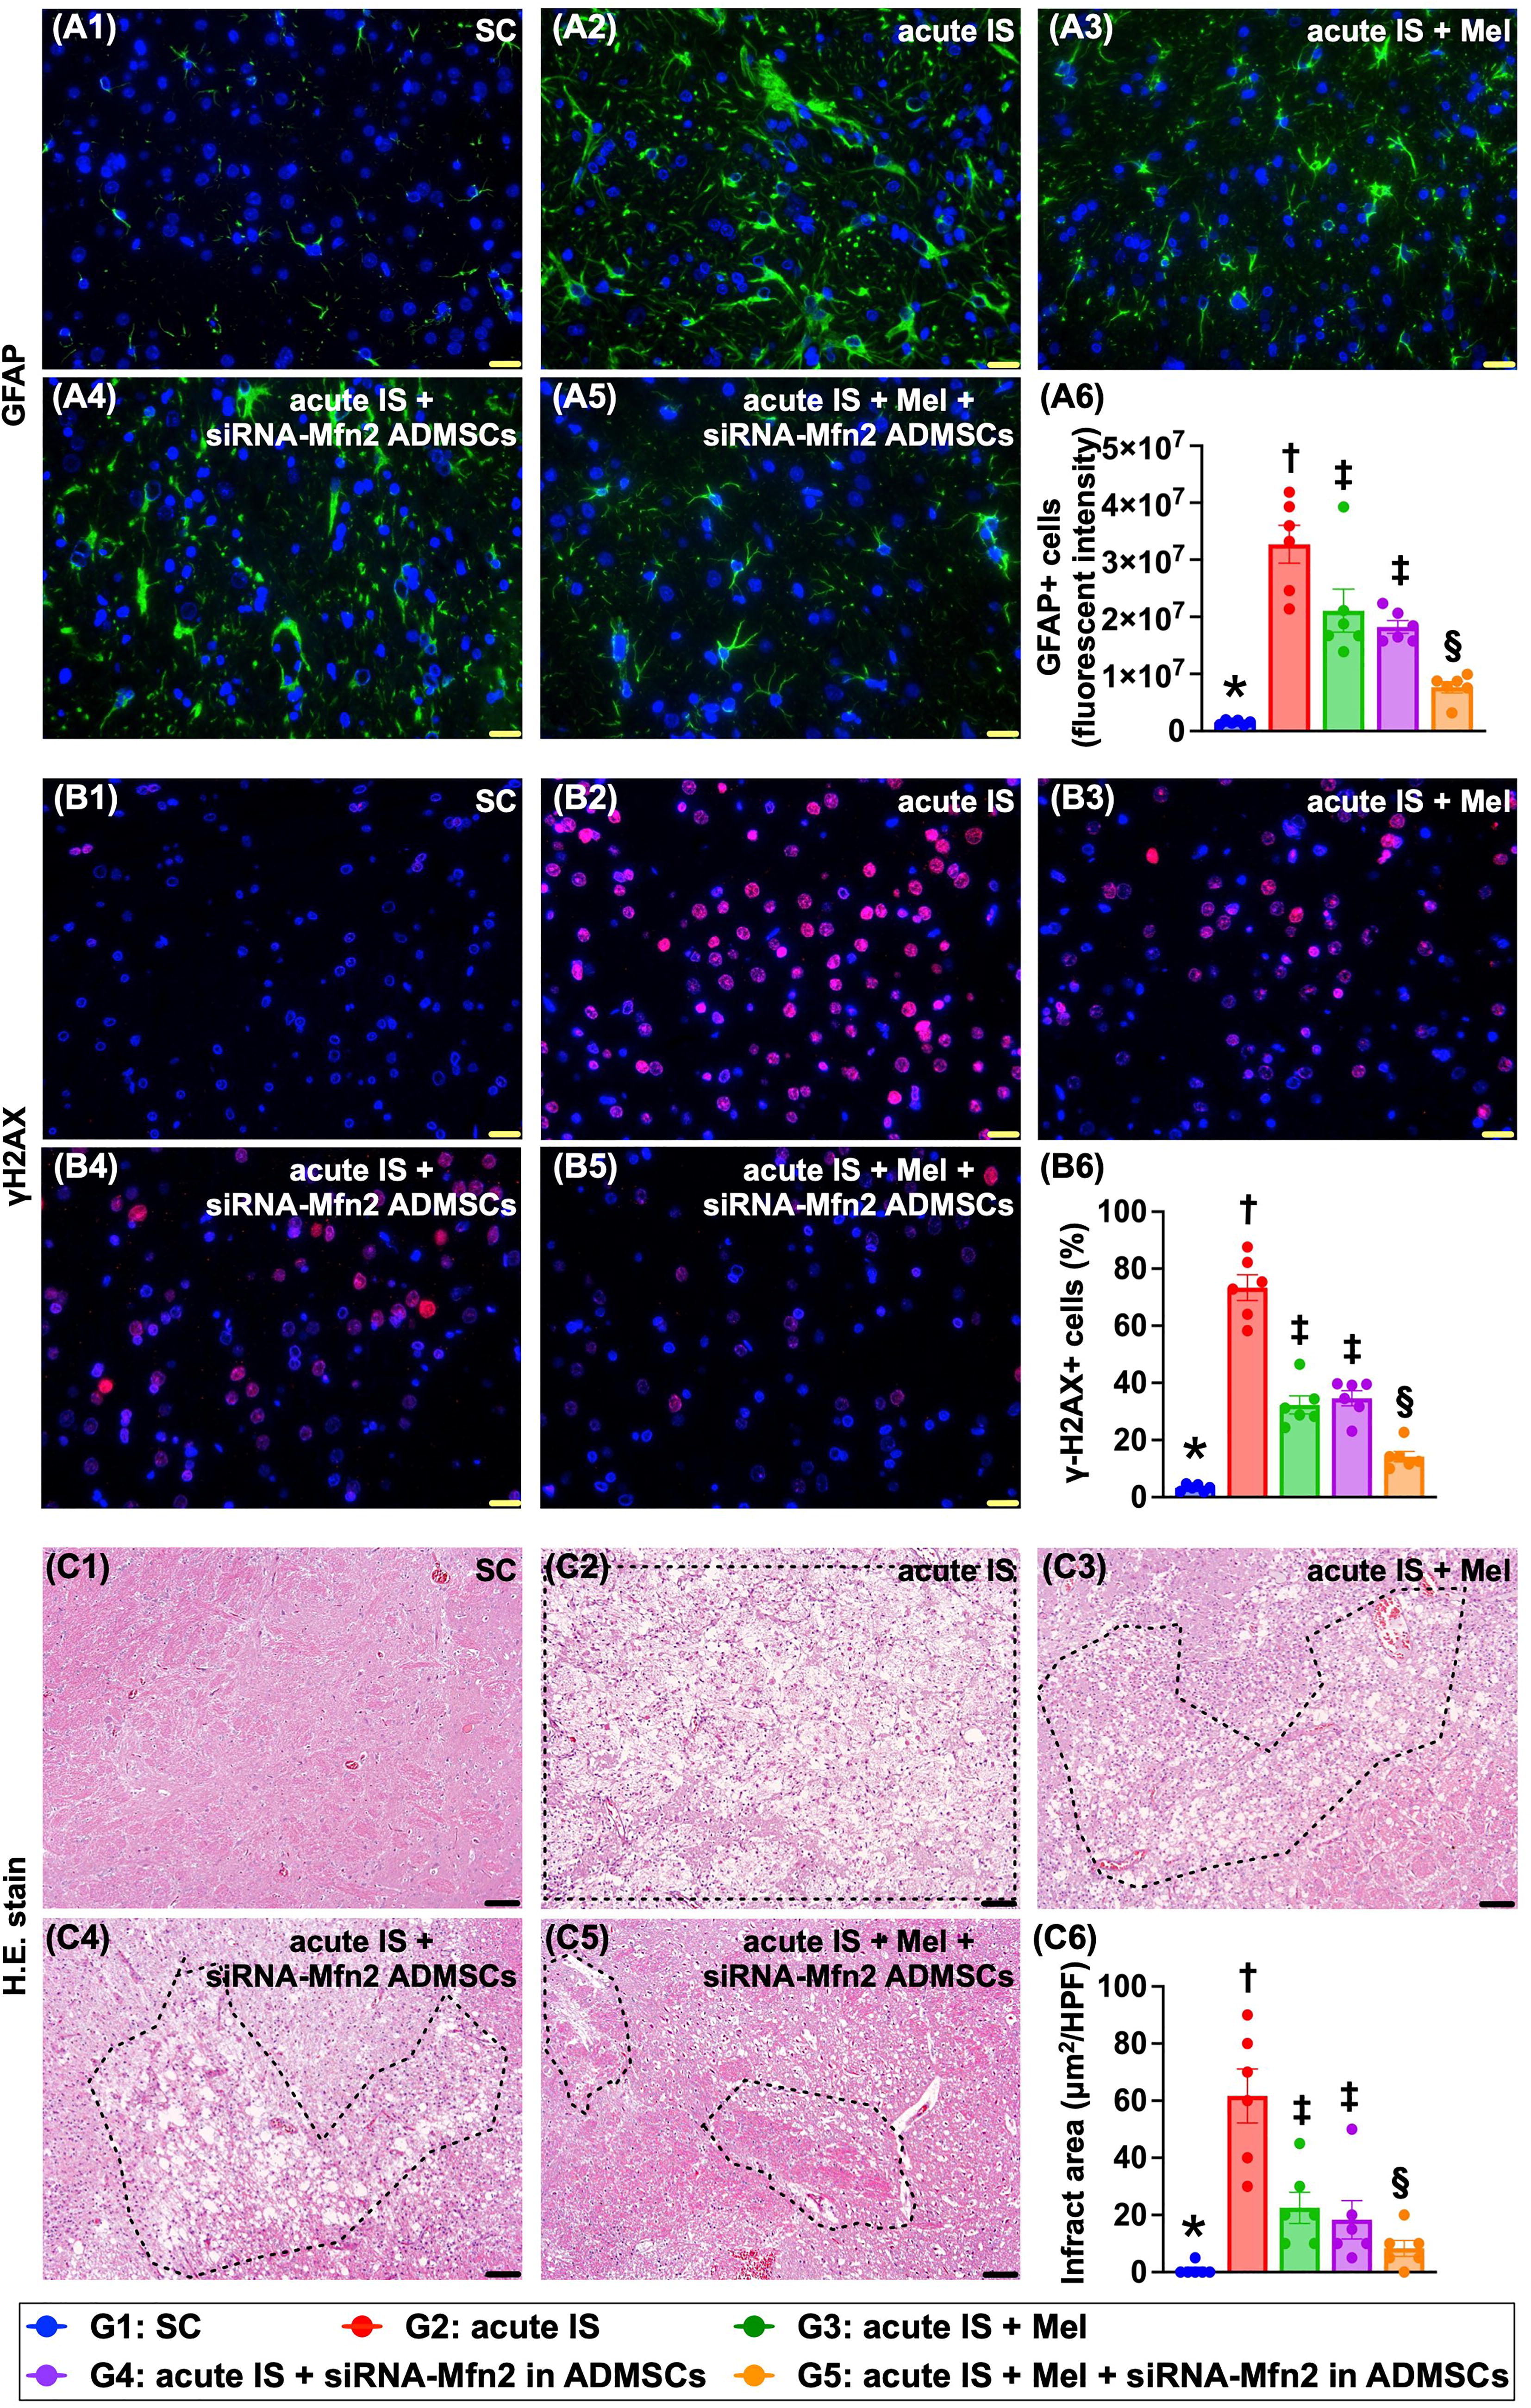
When looked at the microscopic finding of H&E stain, we found that the brain infarct area (BIA) was lowest in group 1, highest in group 2, and significantly and progressively reduced from groups 3 to 5.
Cellular levels of neuronal and oxidative stress to DNA biomarkers by day 28 after AIS induction
The IF microscopic finding demonstrated that the cellular expression of doublecortin, a microtubule-associated kinase found in postmitotic neurons required for normal migration of neurons into the cerebral cortex, was highest in group 1, lowest in group 2, and significantly higher in group 5 than in groups 3 and 4, but it showed no difference between the latter two groups (Fig. 8).
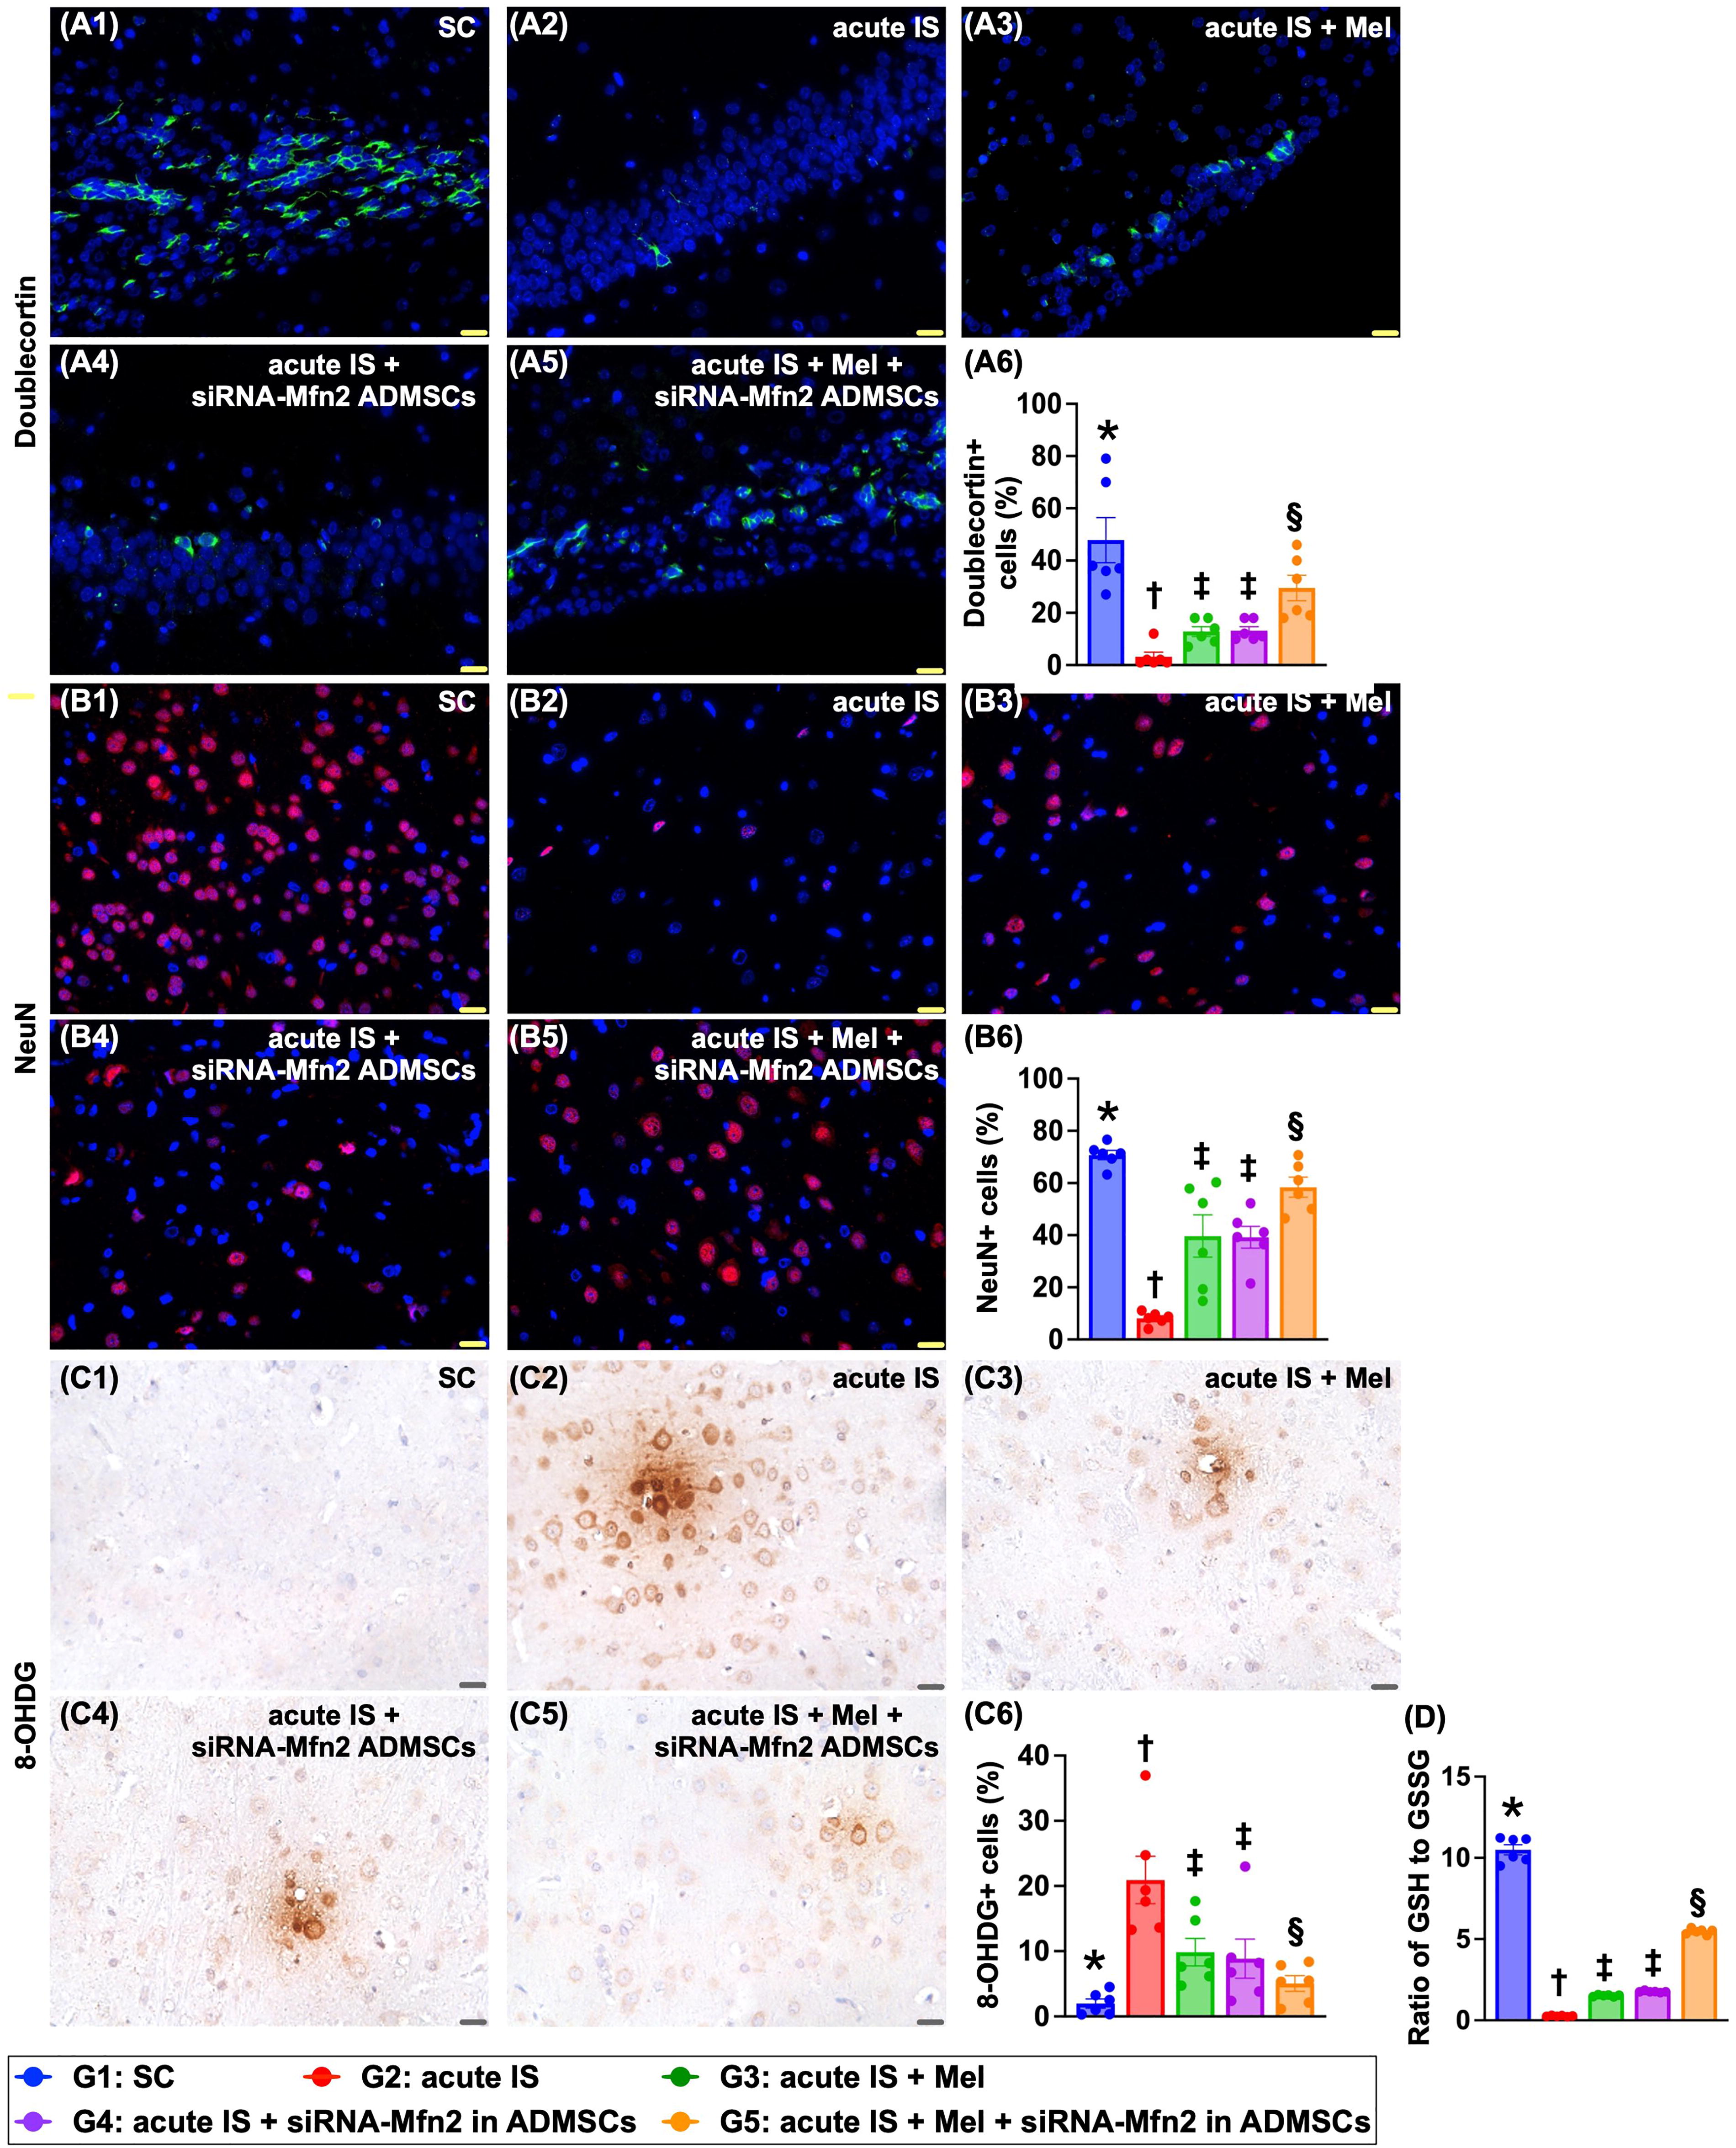
Additionally, the expression of NeuN+ cells, an indicator of neurons in cerebral cortex, exhibited an identical pattern of doublecortin among the groups.
Conversely, the cellular expression of 8-hydroxy-2-deoxyguanosine (8-OHDG), an oxidative stress to DNA biomarker, displayed an opposite pattern of NeuN+ cells among the groups. In contrast to the 8-OHDG, the ratio of GSH to GSSG (i.e., by luminescence-based system), an indicator of antioxidant, displayed an identical pattern of NeuN+ cells among the groups.
Protein levels of mitochondrial biogenesis, oxidative stress, and antioxidants in brain tissue by day 28 after AIS induction
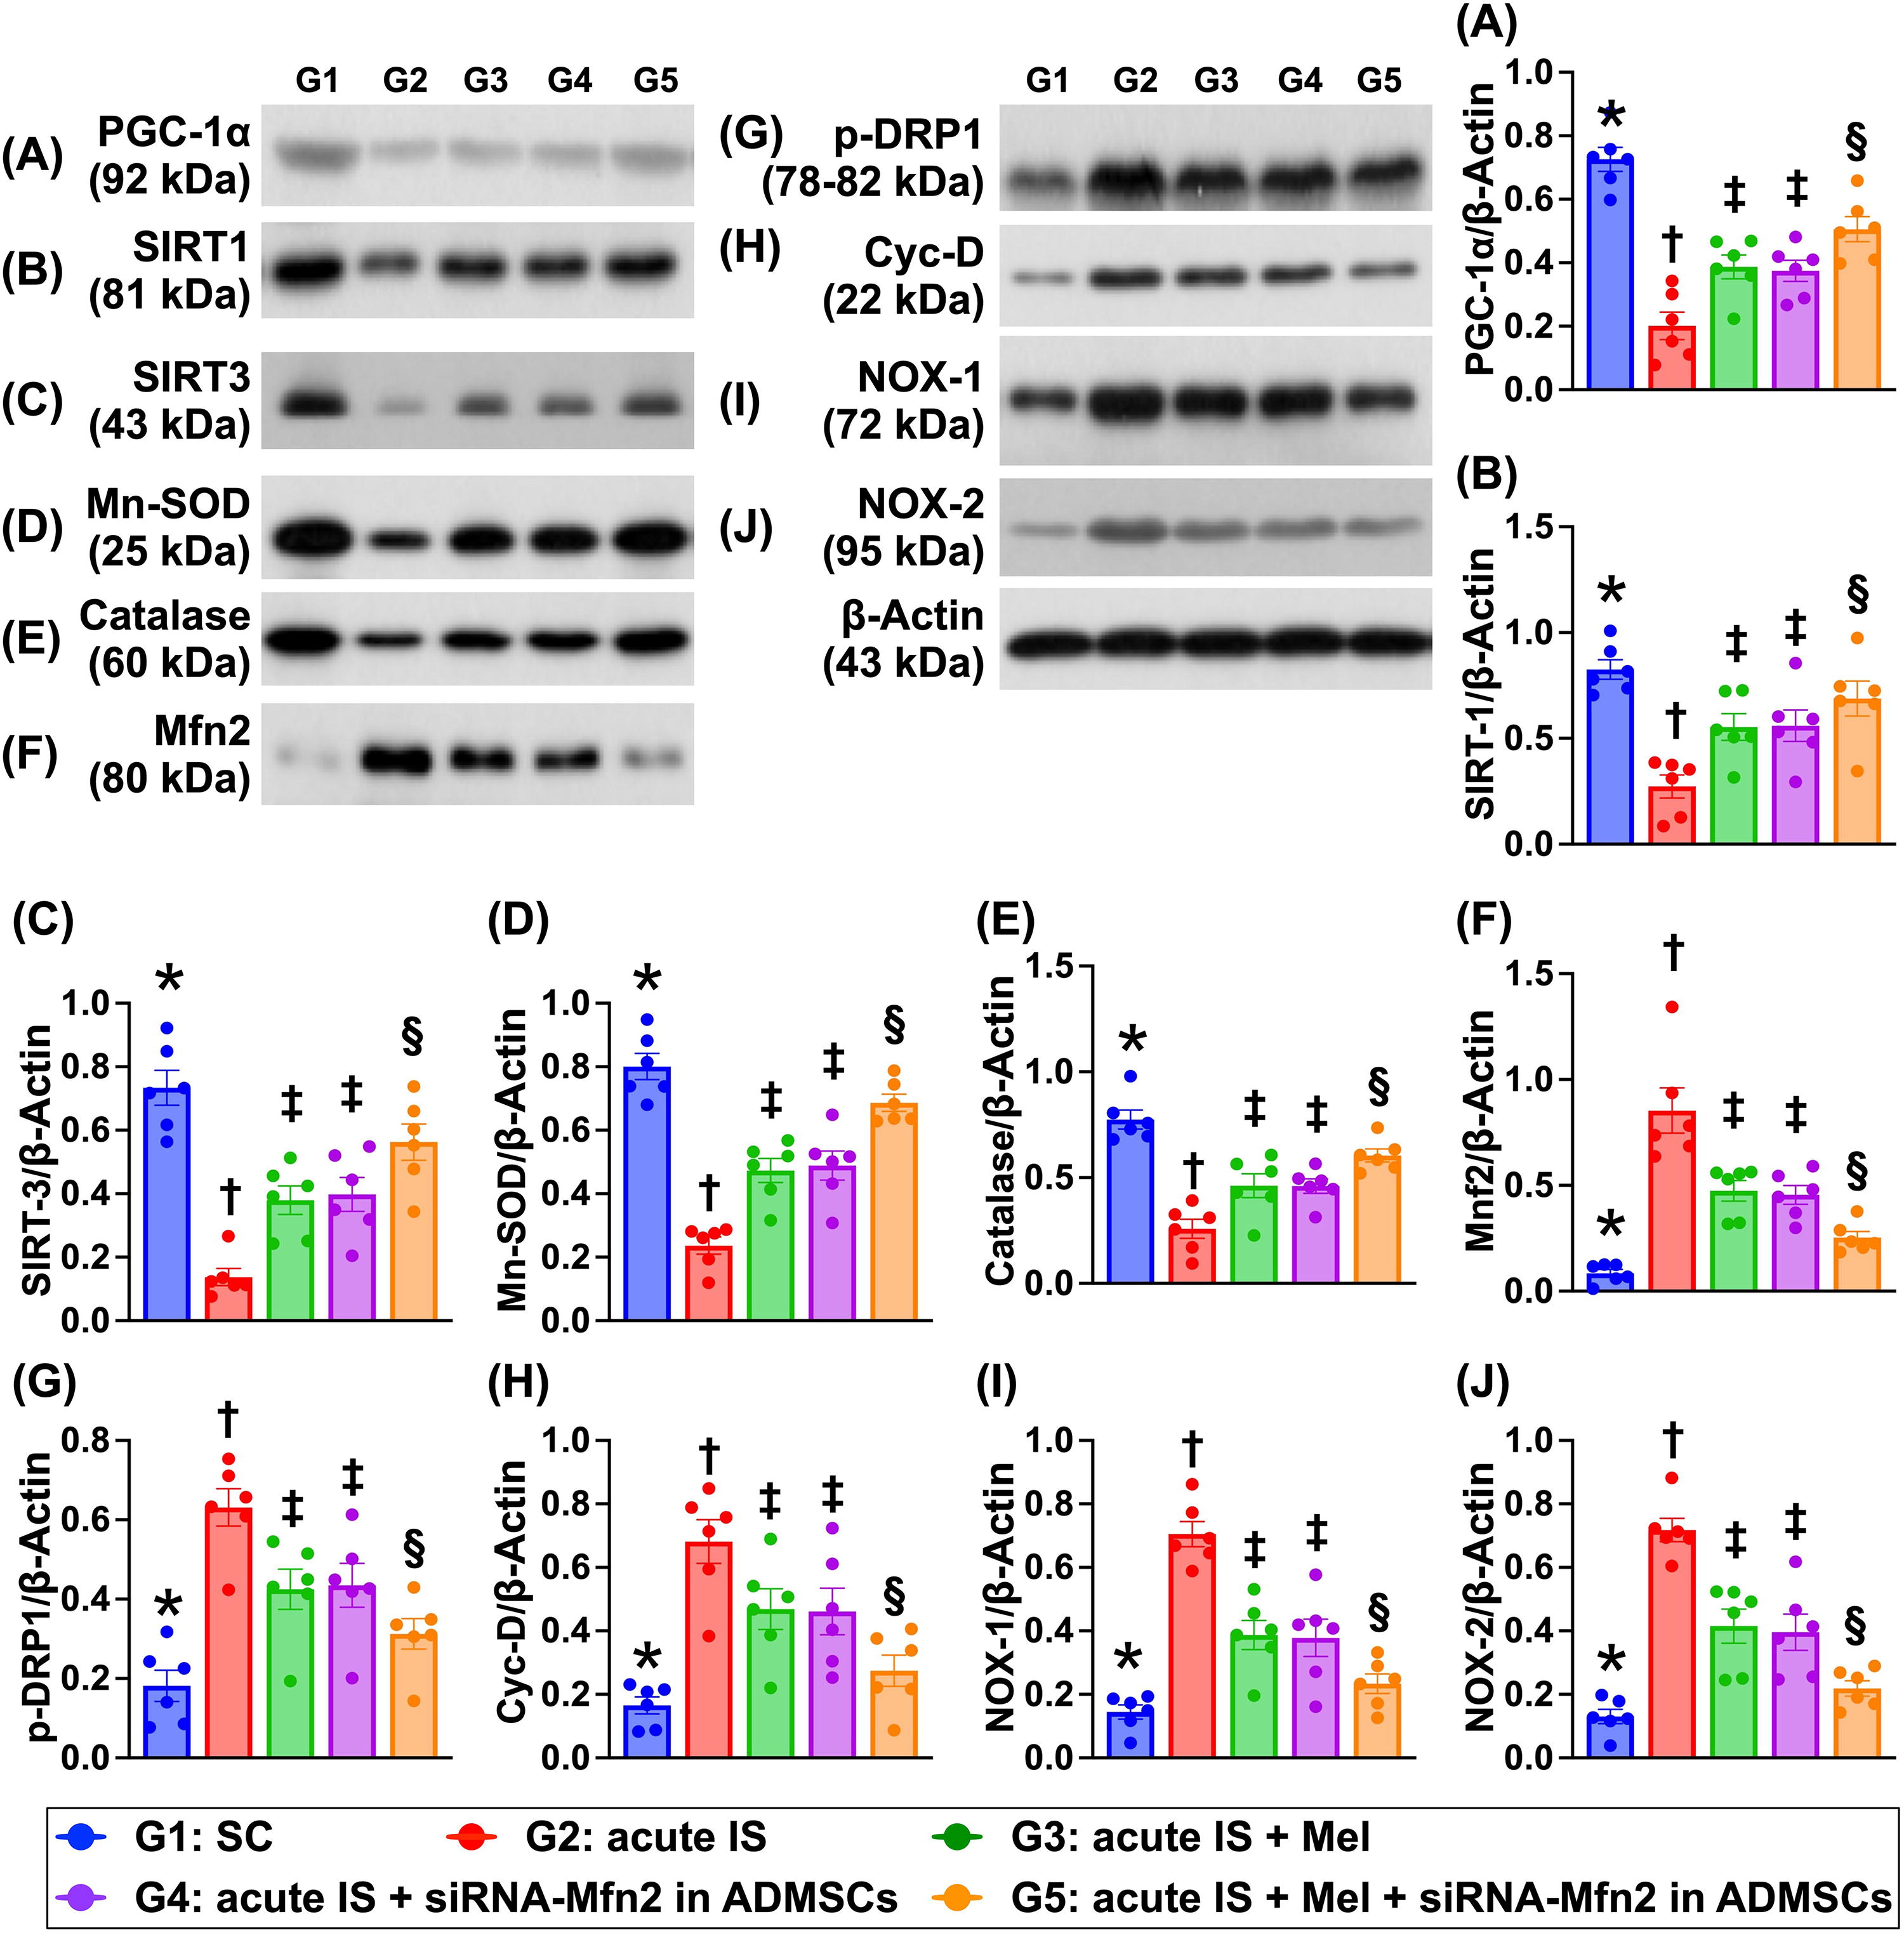
The protein expressions of peroxisome proliferator-activated receptor-gamma coactivator 1 alpha (PGC-1α), an indicator of mitochondrial biogenesis, and protein expressions of IRT-1, SIRT-3, Mn-SOD, and catalase, four indices of antioxidative stress biomarkers, were highest in group 1, lowest in group 2, and significantly higher in group 5 than in groups 3 and 4, but they showed no difference between groups 3 and 4 (Fig. 9). In contrast, protein expressions of Mnf2, p-DRP1, and cyclophilin D exhibited an opposite pattern of PGC-1α among the groups. Additionally, the protein expressions of NOX-1 and NOX-2, two indicators of oxidative stress, also displayed an opposite manner of PGF-1α among the five groups.
Protein expressions of apoptosis, mitochondrial damage, autophagy, and inflammation in brain tissue by day 28 after AIS induction
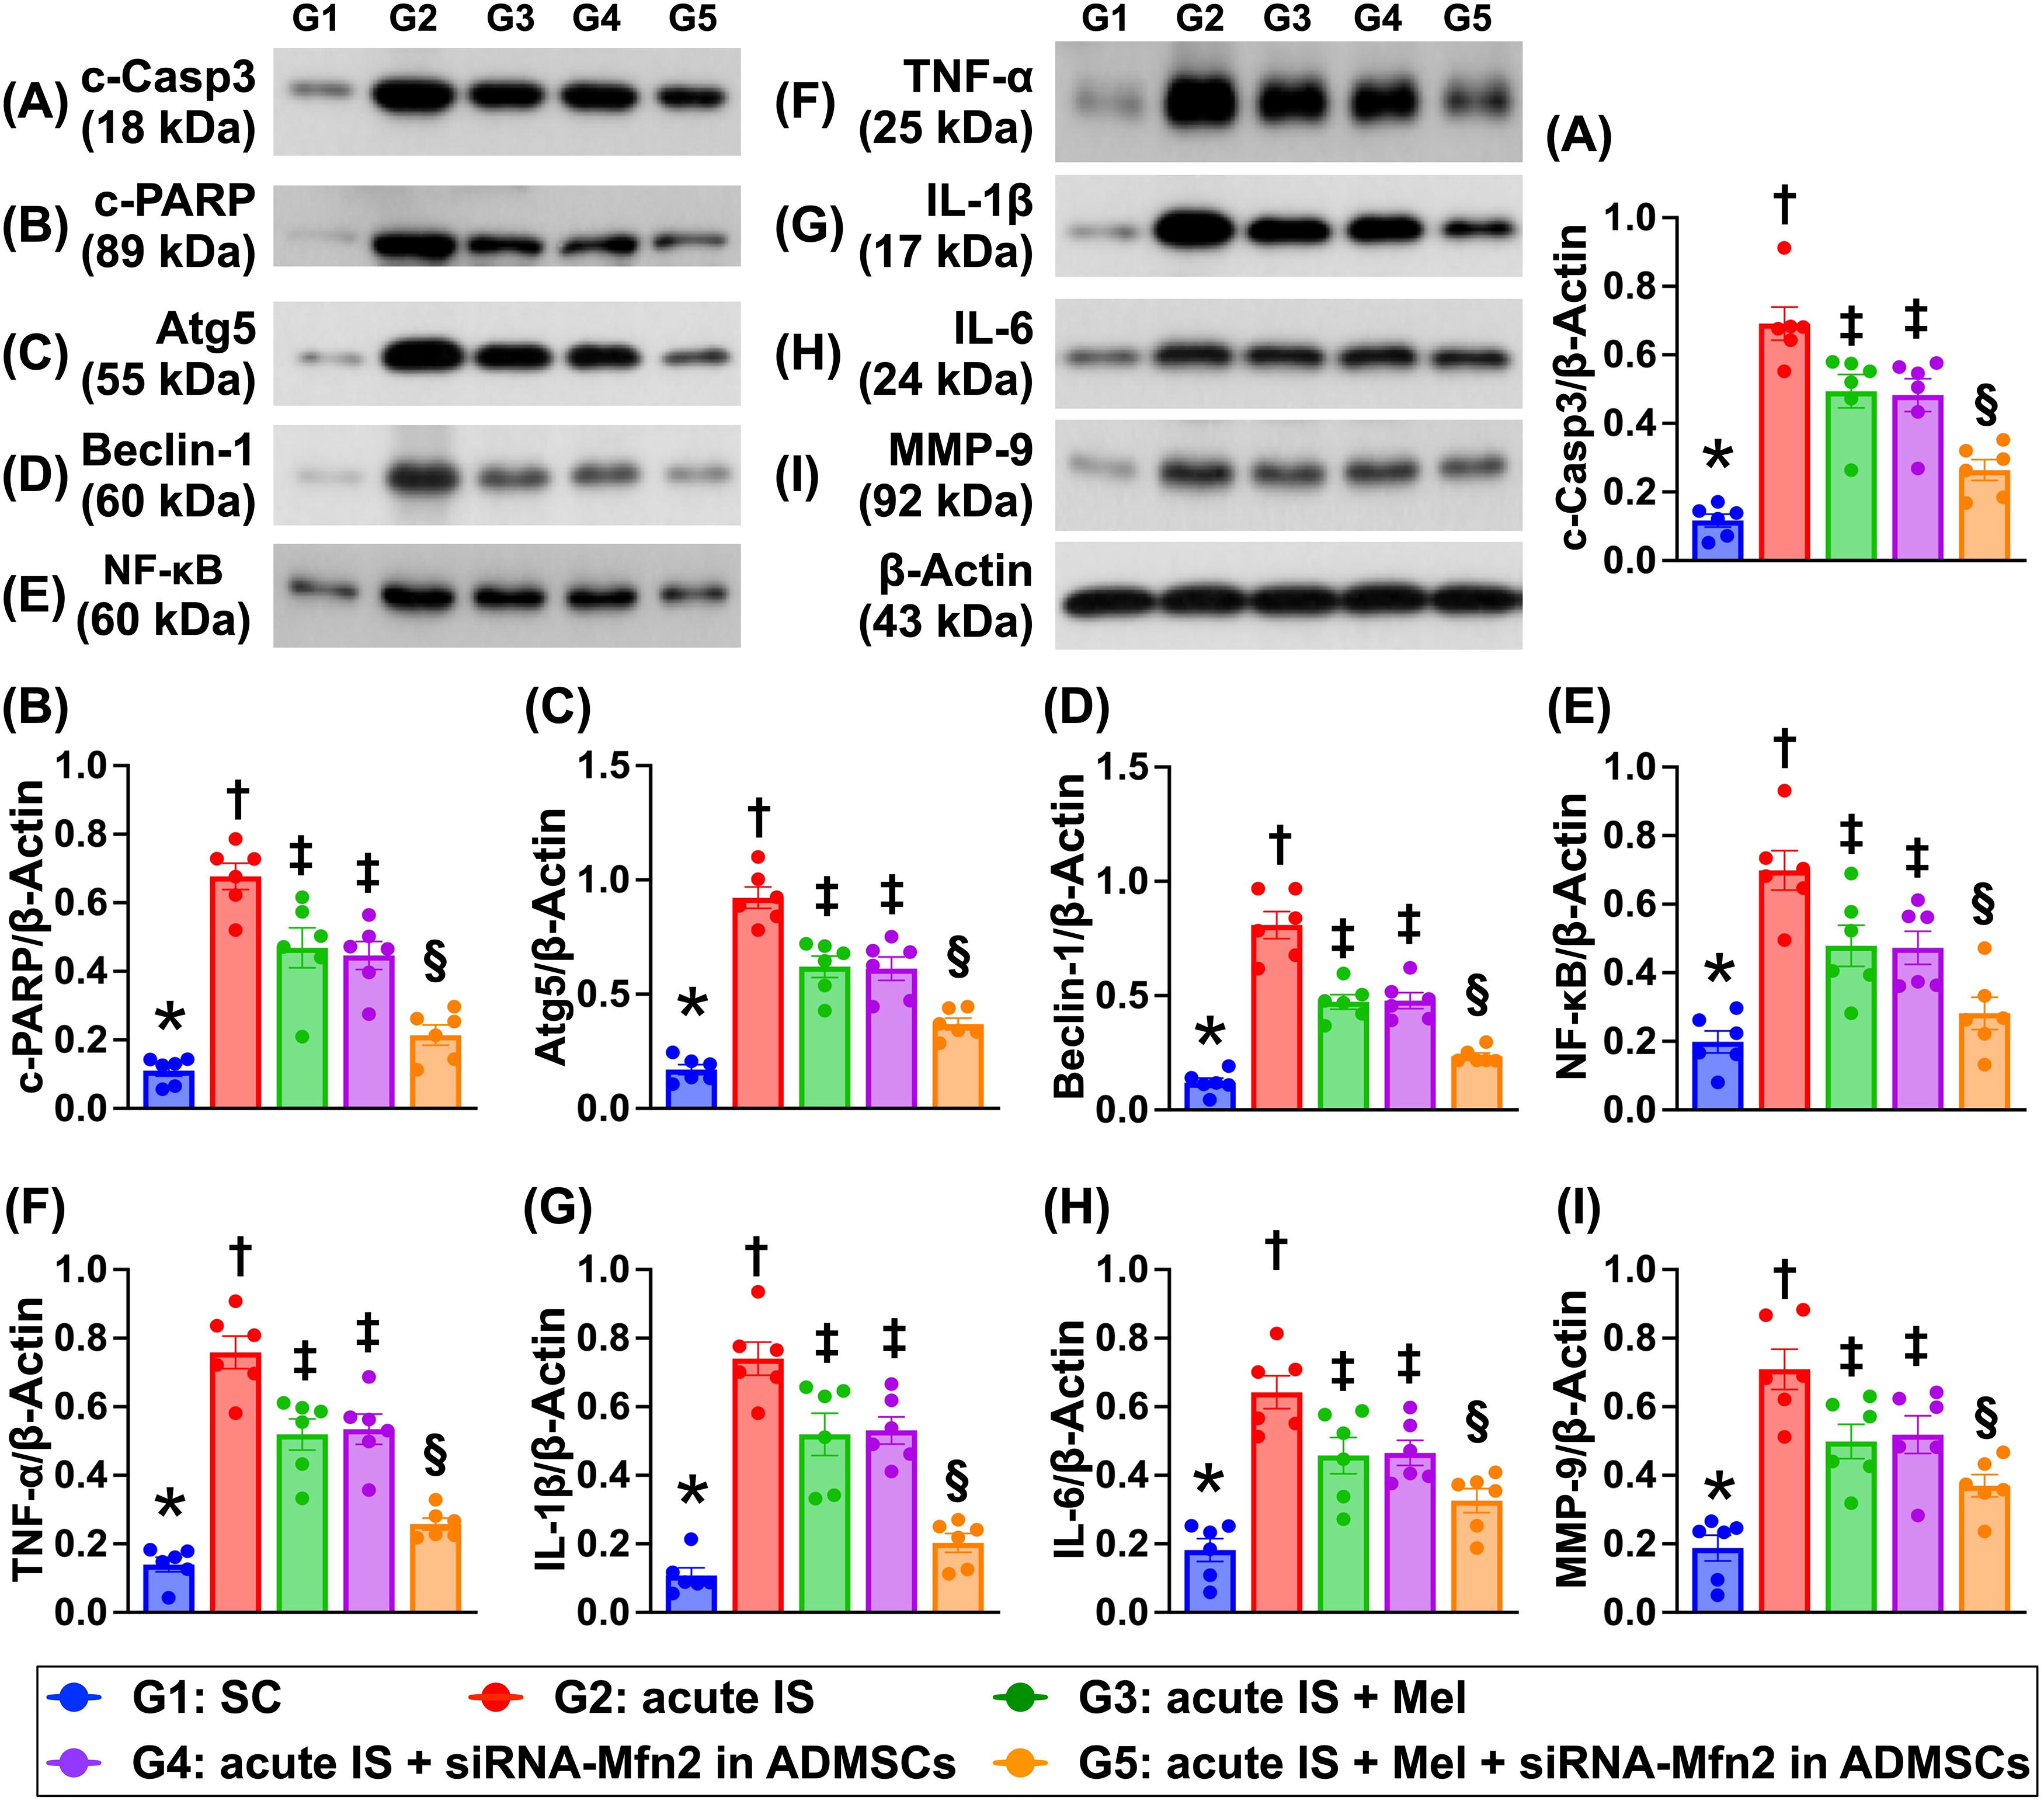
The protein expressions of cleaved caspase 3 and cleaved PARP, two indices of apoptosis, protein expressions of Atg5 and beclin-1, two indices of autophagy, and protein expressions of NF-κB, TNF-α, IL-Iβ, IL-6, and MMP-9, five indicators of inflammation, were lowest in group 1, highest in group 2, and significantly lower in group 5 than in groups 3 and 4, but they were similar between the latter two groups (Fig. 10).
The protein expressions of inflammatory and cell stress signaling in brain tissue by day 28 after AIS induction
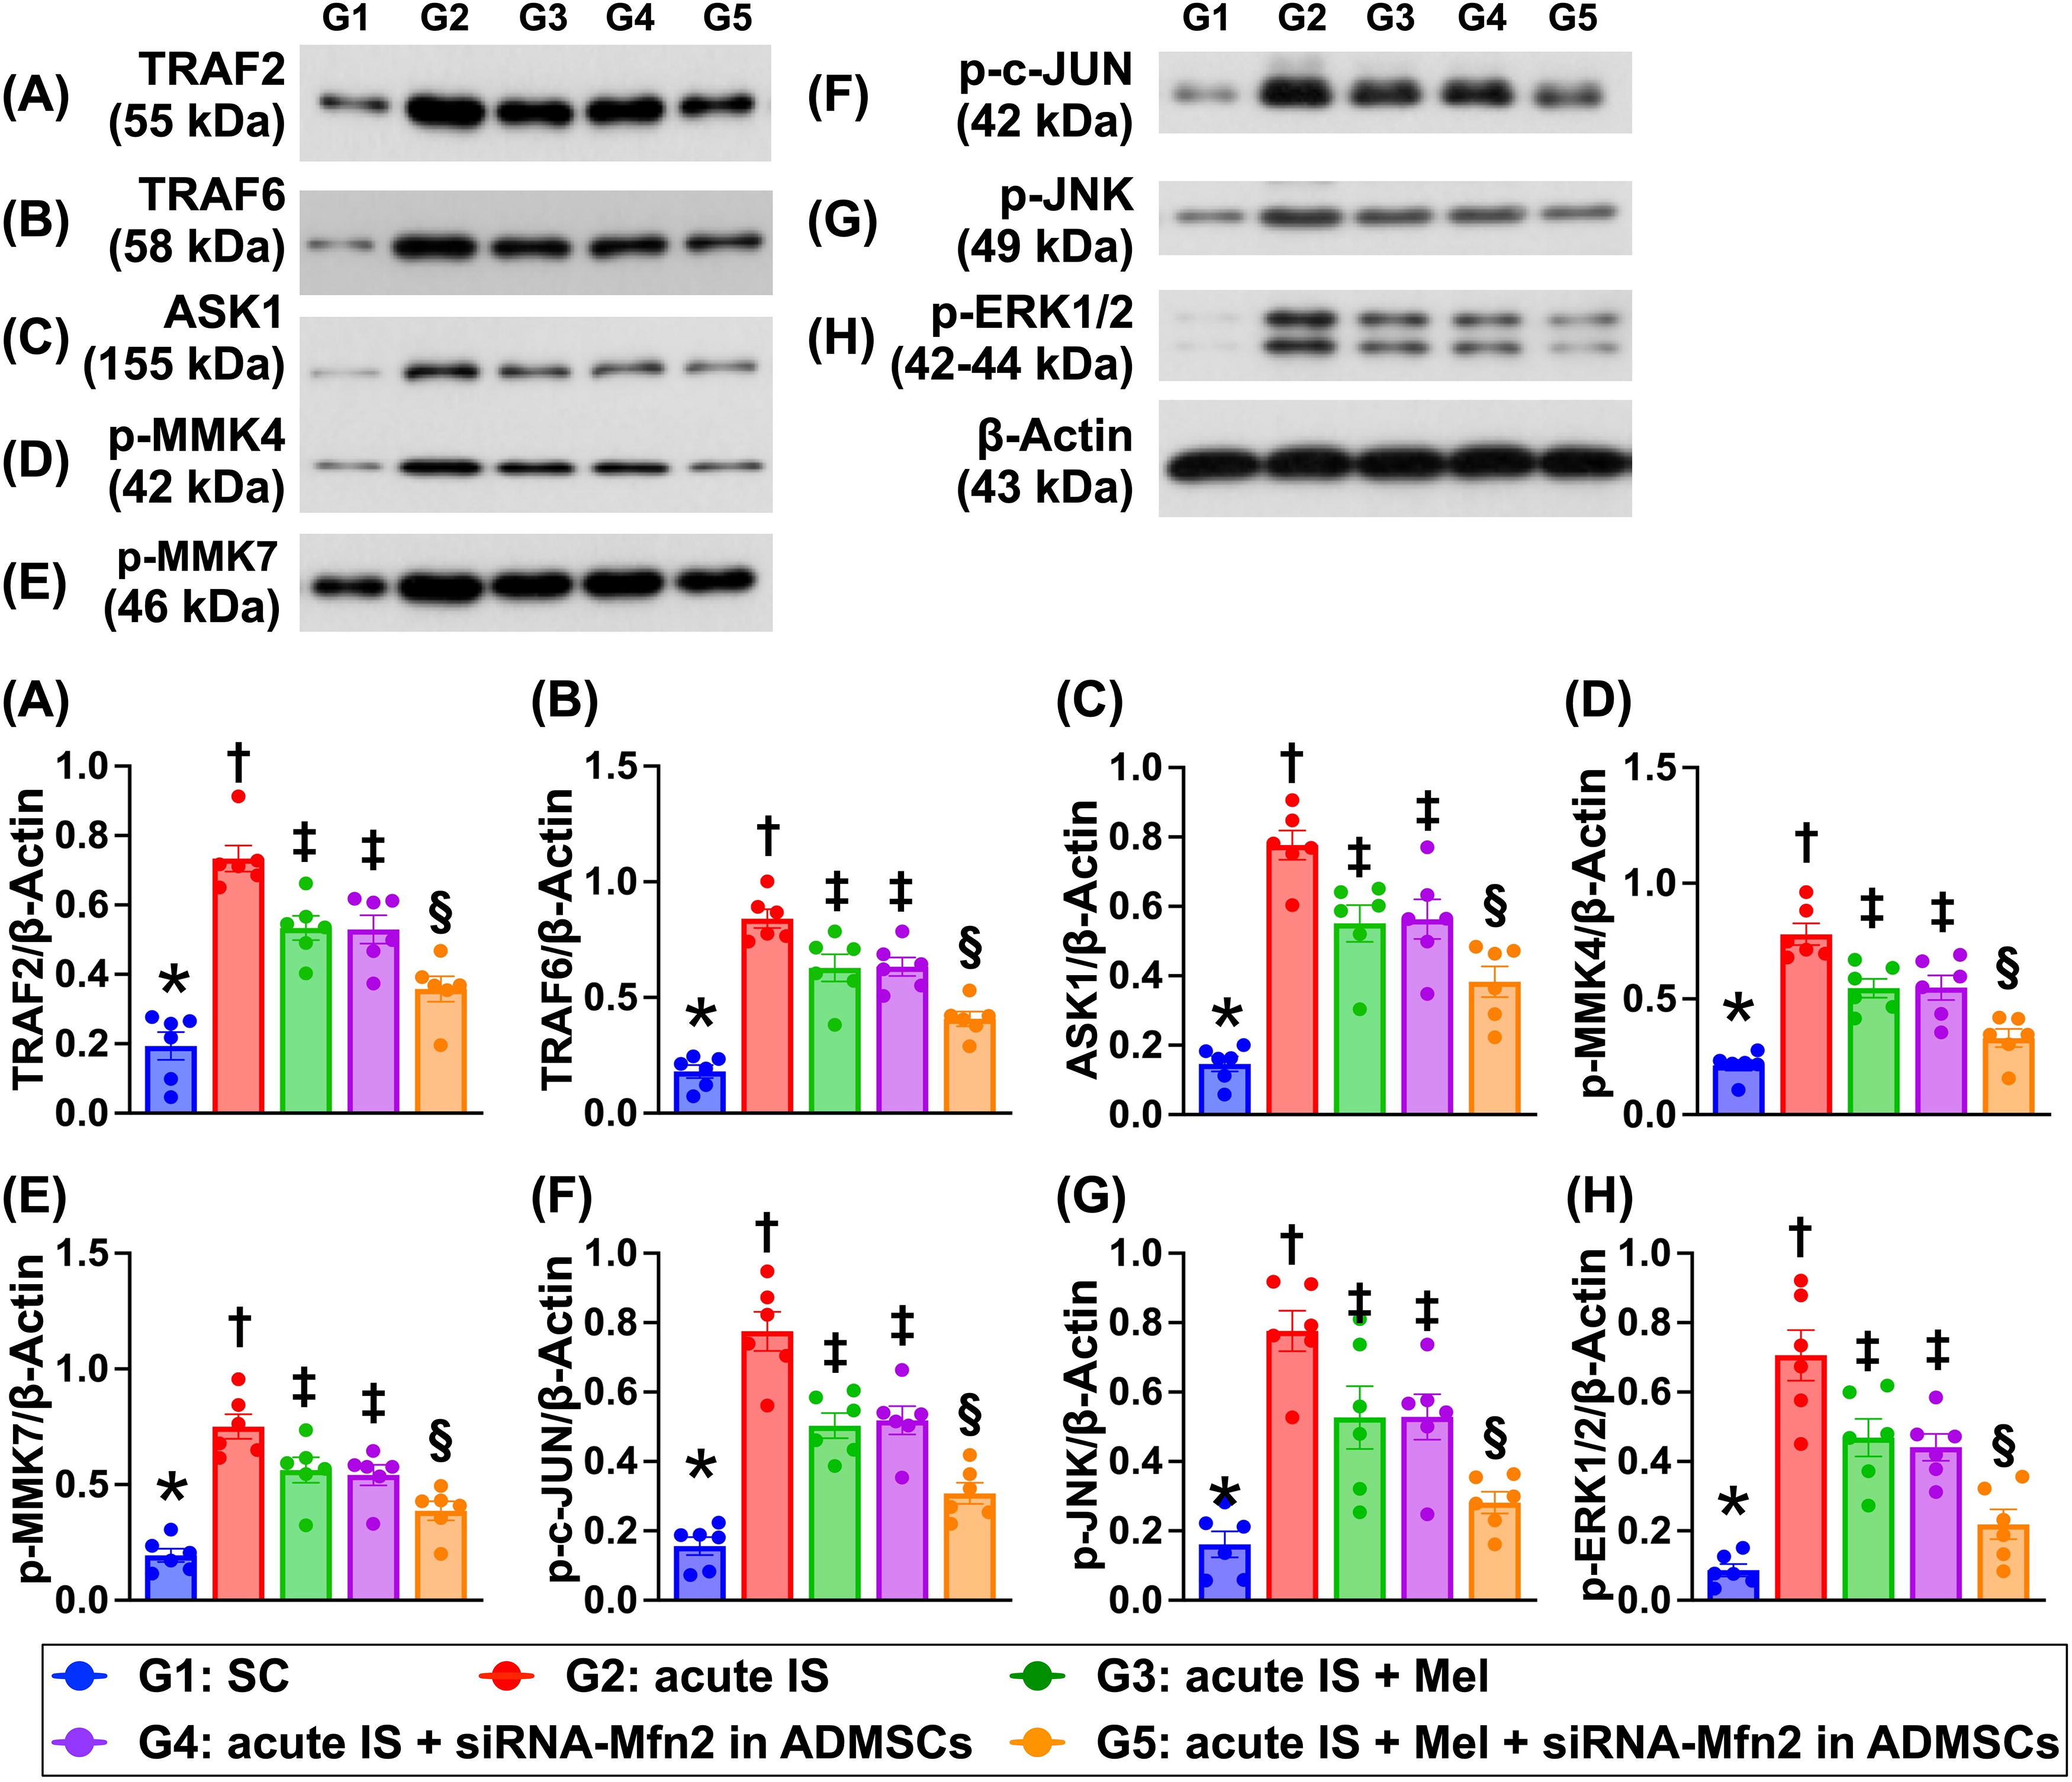
The protein expressions TRAF2 and TRA F6, two biomarkers of inflammatory signaling, and protein expressions of ASK1, p-MMK4, p-MMK7, p-c-JUN, p-JNK, and p-ERK1/2, six biomarkers of cell stress signaling, were lowest in group 1, highest in group 2, and significantly lower in group 5 than in groups 3 and 4, but they showed no difference between groups 3 and 4 (Fig. 11).
Discussion
This study that investigated the impact of silencing the Mfn2 gene in ADMSCs and Mel therapy on protecting the brain parenchyma against AIS stroke-caused damage delivered several striking preclinical implications. First, silencing the Mfn2 gene in ADMSCs and Mel therapy significantly protected the neuronal cells, ADMSCs, and brain parenchyma and preserved the neurological function. Second, these protective effects were mainly through upregulating paracrine effect, anti-inflammation, and antioxidants (referred to Supplementary Fig. S2) and downregulating the oxidative stress and inflammation, resulting in reducing in apoptosis, intracellular and mitochondrial ROS, autophagy, DNA, and mitochondrial damages that subsequently reduced BIA and BIV. Third, both in vitro and in vivo studies identically demonstrated that the cell stress signaling (i.e., ASK1/MKK4/MMK7/JNK/p-c-Jun/ERK1/2) fundamentally participated in brain damage in setting of AIS. However, this cell stress signaling was significantly suppressed by silencing the Mfn2 gene in ADMSCs or Mel therapy and further significantly suppressed by combining these two regimens.
In the present study, for proving the impacts of silencing Mfn2 gene in ADMSCs and Mel therapy on prognostic outcomes in rodents after AIS, we utilized the imaging investigation (i.e., brain MRI), histopathologic examination (i.e., microscopic observation), and neurological function evaluation (i.e., corner test). The most important finding in the present study was that BIV and BIA were remarkably increased in IS animals as compared with the control animals. In contrast, the neurological function was markedly impaired in those of IS animals as compared with that of the control animals. However, these parameters were significantly reversed in IS animals after receiving silencing Mfn2 gene in ADMSCs or Mel therapy and further significantly reversed by combined therapy of these two regimens. Our findings, accordingly, highlight that the combined therapy by Mfn2 gene in ADMSCs and Mel may be an alternative choice in those AIS patients who are refractory to conventional treatments in our future clinical practice.
The impact of Mel therapy on reducing oxidative stress, suppressing the inflammation, and protecting the mitochondria far away from ROS damage has been well recognized (Chang et al., 2015; Chen et al., 2014; Manchester et al., 2015; Sun et al., 2015; Yip et al., 2015; Zhang and Zhang, 2014). In addition, our recent study has shown that using siRNA knockdown the Mfn2 gene expression in induced pluripotent stem cell–MSCs notably suppressed the oxidative stress signaling and protected the mitochondrial function in cardiorenal syndrome rodents (Yeh et al., 2021). Based on these fundamental knowledges, we proposed that combining these two regimens might offer additional benefits on rodent after AIS, and therefore, in vitro and in vivo studies were conducted, respectively. By using the ADMSCs and N2a cell cultures, the in vitro studies showed that silencing Mfn2 gene and Mel therapy offered comparable impacts on reducing oxidative stress, inflammation, cellular apoptosis/senescence, autophagy, and DNA/mitochondrial damage and upregulating the anti-inflammation, antioxidants (referred to Supplementary Fig. S2), and mitochondrial dynamic homeostasis. In this way, our findings were consistent with the findings from the previous and recent studies (Chang et al., 2015; Chen et al., 2014; Manchester et al., 2015; Sun et al., 2015; Yeh et al., 2021; Yip et al., 2015; Zhang and Zhang, 2014).
Followed by obtaining these attractive and promising results from the in vitro studies, we next examined the molecular–cellular levels of aforementioned parameters from the harvested brain tissues. Intriguingly, these aforementioned molecular–cellular perturbations, i.e., including those of inflammation, oxidative stress, cellular apoptosis, autophagy, and DNA-damaged biomarkers, were substantially upregulated in AIS animals as compared with sham-controlled animals. Importantly, the combined therapy with silencing Mnf2 in ADMSCs and Mel therapy was not only superior to merely one therapy but also better than either one therapy on upregulating the antioxidant signalings. In this way, our in vivo results corroborated with the results from our in vitro study.
The mission of this study was not only to elucidate the therapeutic impact of silencing Mnf2 in ADMSCs and Mel on protecting the brain against AIS damage but also to delineate the underlying mechanism for why these therapies could improve the prognostic outcome in setting of AIS in rodents. We summarized the results of our in vitro and in vivo studies and identified that there could be at least four signaling pathways to participate in the underlying brain damage after AIS (referred to graphical abstract). First, we found that activation of ROS/oxidative stress signaling resulting from ischemia initiated in mitochondrial damage played a fundamental role of brain damage after IS. This finding could really reflect why the Mel and knockdown of Mfn2 gene could reduce mitochondria-induced generation of ROS/oxidative stress, which effectively ameliorated brain parenchymal damage in setting of AIS. Second, ROS/oxidative stress initiated the activation of upstream (i.e., TRAF2/TRAF6/ASK/MKK4/7) and downstream (i.e., MAPK pathway: JNK/-c-JUN/ERK1/2) cell stress biomarkers, resulting in eliciting cell death. Third, ROS/oxidative stress not only suppressed the antioxidants but also, at the same time, activated the inflammatory signaling and accelerated the production of proinflammatory cytokines (NF-κB/IL-1β/IL-6/TNF-α/MMP9) signaling, ultimately caused a cascade of cell apoptosis and death. Fourth, ADMSCs would secrete exosomes, anti-inflammatory molecules, RNAs, and proteins that elicited the paracrine effects (referred to graphical abstract). Mel is well-known to be a strong antioxidant agent and have a great capacity for suppressing mitochondrial oxidative stress and anti-inflammation. Additionally, in the present study, we identified that silencing Mfn2 gene in ADMSCs was superior to ADMSCs merely for attenuating ROS and inflammatory reaction. These findings could explain why combined deletion of Mfn2 in ADMSCs and Mel offers synergic benefits on protecting the brain against AIS in rats.
Translational medicine is an utmost important mission to be concerned by scientists and clinicians. In the present preclinical study, we identified that silencing Mnf2 in ADMSCs and Mel offered better outcomes than a monotherapy in animals after AIS, highlighting that this may be a therapeutic potential for those AIS patients, especially those who suffer from severe neurological damage and disability and refractory to standard treatment. In this way, clinical application of these regimens could be applied only to an ethical issue of silencing Mfn2 gene in ADMSCs to be resolved in the near future.
Study Limitations
Our study has limitations. First, although the results were attractive and promising, the study period was relatively short, i.e., only 4 weeks. Accordingly, the long-term outcomes of our study remain uncertain. Second, without utilization of Mnf2 gene knockdown in animal model study, we still could be not sure whether deletion of the Mnf2 gene plays an independent role in ameliorating the brain injury after AIS. Third, we did not harvest the brain tissues within 72 h after AIS. Therefore, we did not provide the changes of protein levels of autophagic biomarkers in the early phase after AIS. Fourth, we might miss an Mfn2 gene overexpression in ADMSC-treated AIS animals. Accordingly, this study could not provide any information regarding the impact of overexpressed Mfn2 gene in ADMSCs therapy on the outcome after AIS in rodent.
In conclusion, the results of the present study demonstrated that ROS and oxidative stress coordinated with inflammatory signaling were the essential pathways on brain damage and unfavorable neurological outcomes that were significantly reversed by silencing Mnf2 gene in ADMSCs and Mel therapy.
Materials and Methods
Ethical statement
All animal procedures were approved by the Institute of Animal Care and Use Committee at
Animals were housed in an Association for Assessment and Accreditation of Laboratory Animal Care International–approved (AAALAC; Frederick, MD, USA) animal facility in our hospital with controlled temperature and light cycles (24°C and 12/12 light cycle).
Isolation of adipose tissue for obtaining allogenic ADMSCs
Adipose tissues around the epididymis and abdomen were cautiously harvested based on our previous reports (Chang et al., 2015; Chen et al., 2014; Leu et al., 2010). Briefly, adipose tissues were isolated from inguinal and lower abdominal areas from additional 12 animals. The harvested adipose tissues were homogenized into pieces, followed by the addition of stock collagenase solution to a final concentration of 0.5–0.8 units/mL. After 40–50 min of incubation, the substance was triturated with a 25 mL pipette for 2–3 min, followed by centrifugation at 600 g for 5 min at room temperature. After removing the fatty layer from the tube, the cell pellet obtained was resuspended in 40 mL saline, followed by centrifugation again at 600 g for 5 min. Finally, an aliquot of cell suspension was removed for cell culture in Dulbecco’s modified Eagle’s medium-low-glucose medium containing 10% FBS for at least 14 days.
The procedure and protocol of siRNA Mfn2 gene-transfected ADMSC cells
The siMfn2 was purchased from Thermo, Inc. (Thermo, MA, USA). The targeted sequence is “GAAUUUCGAGAGGCGAUUUTT.” Transfection of cells with siRNA was conducted with Lipofectamine™ RNAiMAX Transfection Reagent (Invitrogen, Life technologies, Carlsbad, CA, USA) according to the manufacturer’s instructions with minimal modifications. Cells were first seeded 24 h prior to transfection at a density of 1 × 10⁶ cells in 10 mL of fresh culture medium in a 10-cm plastic dish. For transfection, Lipofectamine RNAiMAX Transfection Reagent was incubated with 100 pmol of Mfn2 siRNA at room temperature for 15 min. Cells were incubated with siRNA–lipofectamine complex at 37°C in a humidified atmosphere of 5% CO2 prior to being harvested. Western blotting and qRT-PCR techniques were performed to verify the efficiency of gene silencing.
Cell grouping and culture for in vitro studies
First, to evaluate the impact of silencing Mfn2 and Mel on protecting the ADMSCs against H2O2-indcued (i.e., oxidative stress) damage, the cells were categorized into four groups: A1 (ADMSCs only), A2 [ADMSC + H2O2 (400 µM treated for 6 h), then washing, and followed by additional culture for 18 h], A3 [siRNA Mfn2 in ADMSCs + H2O2 (400 µM treated for 6 h), then washing, and followed by additional culture for 18 h], and A4 [ADMSCs + Mel (60 µM) + H2O2 (400 µM treated for 6 h), then washing, and followed by additional culture for 18 h], respectively.
Second, to assess whether the silencing Mfn2 gene in ADMSCs and Mel would protect the neuronal cells against H2O2-indcued (i.e., oxidative stress) damage, the Neuro-2a (N2a) cells, mouse neuroblasts with neuronal and amoeboid stem cell morphology isolated from brain tissue, were utilized in the present in vitro study and categorized into B1 (N2a cells only), B2 [N2a cells + H2O2 (400 µM treated for 6 h), then washing, and followed by additional culture for 18 h], B3 [N2a cells + ADMSCs (5 × 10⁵) + H2O2 (400 µM treated for 6 h), then washing, and followed by additional culture for 18 h], B4 [N2a cells + siRNA Mfn2 in ADMSCs + H2O2 (400 µM treated for 6 h), then washing, and followed by additional culture for 18 h], and B5 [N2a cells + Mel (60 µM) + H2O2 (400 µM treated for 6 h), then washing, and followed by additional culture for 18 h], respectively.
The dose of H2O2 and Mel to be utilized in the in vitro study was based on our previous reports (Yang et al., 2023; Yip et al., 2021) with some modification.
AIS animal model
The protocol and procedure of using a rodent model of AIS have previously been reported by our studies (Chen et al., 2016; Yip et al., 2021; Yuen et al., 2011). In detail, adult male Sprague–Dawley rats, weighing 325–350 g, were utilized (Charles River Technology, BioLASCO Co. Ltd., Taipei, Taiwan). All animals were anesthetized by 2.0% inhalational isoflurane, supine on a warming pad (37°C). After exposure of the left common carotid artery (LCCA) through a transverse neck incision, a small incision was made on the LCCA through which a nylon filament (0.28 mm in diameter) was carefully advanced into the distal left internal carotid artery (LICA) for occlusion of the left middle cerebral artery to cause brain infarction of its supplied area. The nylon filament was removed 1 h after occlusion, followed by closure of the muscle and skin in layers. The rats were then placed in a portable animal intensive care unit (ThermoCare
Ten rats in group 1 served as sham-operated control (SC) (i.e., incision of the neck skin and dissection of the LCCA only). In contrast, 40 animals, after receiving AIS induction, were equally categorized into group 2 (AIS, i.e., induced by LICA occlusion for 1 h), group 3 [AIS + Mel (50 mg/kg) administration at 1.5 h by intraperitoneal injection, followed by 20 mg/kg/day at days 1 and 2 after IS induction], group 4 [AIS + siRNA Mfn2 in ADMSCs (6.0 × 10⁵)/administration at 3 h by ipsilateral intracarotid arterial administration and followed by intravenous administration of 1.2 × 10⁶ cells at 24 h after IS], and group 5 (AIS + Mel + siRNA Mfn2 in ADMSCs), respectively.
Corner test for assessment of neurological function
The sensorimotor functional test (corner test) was conducted for each rat at baseline and on days 3, 7, 14, and 28 after AIS induction as our previous reports (Chen et al., 2016; Yip et al., 2021; Yuen et al., 2011). Briefly, the rat was allowed to walk through a tunnel and then into a corner, the angle of which was 60°. To exit the corner, the rat could turn either left or right. A technician who was blind to the study design recorded the results. This test was repeated 10–15 times with at least 30 s between each trial. We recorded the number of right and left turns from 10 successful trials for each animal and utilized the results for statistical analysis.
Procedure and protocol of MRI for identification of the BIV
The procedure and protocol for brain MRI investigation were based on our previous report (Chen et al., 2020). The brain MRI was conducted by day 28 after IS induction. Briefly, during MRI examinations, rats were anesthetized by 2% inhalational isoflurane with room air and placed in an MRI‐compatible holder (Biospec 94/20). Custom software, ImageJ (1.43i, NIH), was used to process the region of interest. Planimetric measurements of images from MRI T2 were conducted to measure the stroke volumes of cortex. Collectively, the BIV was calculated by summation of total coronal sections and then divided by the number of coronal sections to obtain the mean of infarct areas. Additionally, the height of the infarct zone was calculated by summation of the thickness of each coronal section. Finally, the BIV was obtained by the mean of infarct area multiplied by height.
IF and immunohistochemical (IHC) staining
The procedures of IF and IHC staining have been depicted in our previous reports (Chen et al., 2016; Yip et al., 2021; Yuen et al., 2011). In detail, serial cryosections (7 μm thick) with an average thickness of 5 μm from the BIA were obtained. After fixation of the sections in acetone for 15 min at −20°C, 200 μL of signal enhancer was used for blocking nonspecific signals at room temperature for 30 min to reduce the background signals. Primary antibodies [doublecortin (1:200, Santa Cruz Biotechnology), GFAP (1:500, Dako), γ-H2AX (1:200, Abcam), 8-OHdG (1:500, Abcam), and NeuN (1:100, Millipore Sigma)] were utilized for specific biomarkers at 4°C overnight. Alexa Fluor488 FITC and Alexa Fluor594 rhodamine-conjugated goat anti-mouse or rabbit IgG (Molecular Probes, 1:200) were adopted to locate the signals. The sections, which were counterstained with 4ʹ,6-diamidino-2-phenylindole (1: 500, Sigma-Aldrich) to identify cellular nuclei for cell counting, were examined with a fluorescent microscope equipped with epifluorescence (Olympus IX-40).
Western blot analysis of brain specimens
The procedures of Western blot staining have been depicted in our previous reports (Chen et al., 2016; Yip et al., 2021; Yuen et al., 2011). In detail, equal amounts (40–60 μg) of protein extracts from BIA were loaded and separated by SDS-PAGE with 12%–13% acrylamide gradients. After electrophoresis, the separated proteins were electrophoretically transferred to a polyvinylidene difluoride membrane (Amersham Biosciences). Nonspecific proteins were blocked by incubating the membrane in blocking buffer (5% nonfat dry milk in T-TBS containing 0.05% Tween 20) overnight. The membranes were incubated with the indicated primary antibodies [peroxisome proliferator-activated receptor γ coactivator-1α (PGC-1α) (1:4000, Abcam), Mn-SOD (1:4000, Abcam), NOX1 (1:4000, Sigma), NOX2 (1:4000, Sigma), Bax (1:4000, Abcam), mito-Bax (1:4000, Abcam), cleaved-Caspase3 (1:1000, Cell signaling), cleaved-PARP (1:1000, Cell signaling), MMP-9 (1:4000, Abcam), TNF-α (1:1000, Cell signaling), phosphorylated (p)-JNK (1:3000, Abcam), p-c-Jun (1:3000, Abcam), cytosolic cytochrome C (1:10000, BD), p-DRP1 (1:1000, Cell signaling), TRAF6 (1:1000, Cell signaling), TRAF2 (1:1000, Cell signaling), ASK-1 (1:4000, Abcam), SIRT1 (1:4000, Abcam), SIRT3 (1:4000, Abcam), IL-1β (1:1000, Cell signaling), IL-6 (1:1000, Abcam), Mfn2 (1:1000, Cell signaling), pERK1/2 (1:4000, Millipore), cyclophilin D (1:4000, Abcam), beclin1 (1:1000, Cell signaling), ATG5 (1:1000, Cell signaling), p-NF-κB (1:1000, Cell signaling), p-MMK4 (1:4000, Abcam), P-MMK7 (1:4000, Abcam), Catalase (1:4000, Abcam), COXIV (1:10000, Abcam), and actin (1:10000, Merck)] for 1 h at room temperature. Horseradish peroxidase-conjugated anti-rabbit or anti-mouse immunoglobulin IgG (1:2000, Cell Signaling) was used as a second antibody for 1 h at room temperature.
Flow cytometric analysis for apoptosis detection
The percentages of viable and apoptotic cells were determined by flow cytometry using double staining of annexin V and PI. The early phase of apoptosis was defined as annexin V+/PI−, whereas the late phase of apoptosis was defined as annexin V+/PI+.
Measuring the levels of ROS in culturing ADMSCs
Gallios (Beckman Coulter) was utilized for flow cytometric analysis, and Kaluza Analysis Software (Beckman Coulter) was utilized for data analysis of ROS level. Total intracellular ROS was measured by 2',7'-dichlorodihydrofluorescein diacetate (H2DCFDA, D399, Invitrogen), and mitochondrial ROS was measured by dihydrorhodamine 123 (DHR-123, D1054, Sigma-Aldrich) oxidation method.
Briefly, the cells were incubated in HEPES buffer supplemented with H2DCFDA or DHR-123 for 30 min. The ROS-sensitive probe H2DCFDA generates the fluorescent 2',7'-dichlorofluorescein (excitation/emission = 485/530 nm) upon enzymatic reduction and subsequent oxidation by ROS. The other ROS probe, that is, DHR-123, was also used in a similar manner as the H2DCFDA probe, which produces rhodamine 123 (excitation/emission = 500 /535 nm) upon reaction with ROS.
Measurement of GSH/GSSG ratio
ADMSC cells and siRNA–Mfn2–ADSMC (5 × 10⁵ cells/well) were seeded into black 96-well multiwall luminometer plates. After treatment with H2O2 (400 µM) for 24 h at 37°C, the GSH/GSSG ratio was detected using a GSH/GSSG Ratio Detection Assay kit (Cat. No. ab205811; Abcam) according to the manufacturer’s protocols. The fluorescence intensity was measured by a fluorescence microplate reader at Ex/Em = 490/520 nm after 30 min of incubation.
Statistical analysis
Data were uniformly shown as mean ± standard error of the mean. Given the low number in each group, normality tests were applied to test whether the dataset was distributed normally. For the nonparametric data, Kruskal–Wallis H test with post hoc Dunn’s test was used for comparison of differences among groups. Conversely, statistical analysis for the parametric data was performed with one-way analysis of variance, followed by Bonferroni multiple-comparisons post hoc analysis. Statistical software SPSS ver.26 was utilized. A probability value of <0.05 was considered statistically significant. Electronic laboratory notebook was not used.
Footnotes
Acknowledgments
This study was supported by a program grant from Chang Gung Memorial Hospital, Chang Gung University (
Authors’ Contributions
C.-H.Y., H.-S.L., H.-K.Y., and K.-H.C. designed the study and investigated the experiments. H.-T.C. and Y.-L.C. did formal analysis. K.-H.C. was responsible for funding acquisition. C.-H.Y., H.-S.L., H.-K.Y., and K.-H.C. wrote the first draft of the article, and all named authors contributed in revising the article.
Ethics Approval and Consent to Participate
All animal procedures were approved by the Institute of Animal Care and Use Committee at
Availability of Data and Materials
The data that support the findings of this study are available from the corresponding authors upon reasonable request.
Author Disclosure Statement
The authors declare that they have no conflicts of interest.
Funding Information
This study was supported by a program grant from Chang Gung Memorial Hospital, Chang Gung University (CMRPG8N0311).
Supplementary Material
Supplementary Figures
Abbreviations Used
References
Supplementary Material
Please find the following supplemental material available below.
For Open Access articles published under a Creative Commons License, all supplemental material carries the same license as the article it is associated with.
For non-Open Access articles published, all supplemental material carries a non-exclusive license, and permission requests for re-use of supplemental material or any part of supplemental material shall be sent directly to the copyright owner as specified in the copyright notice associated with the article.