
Abstract
Aims:
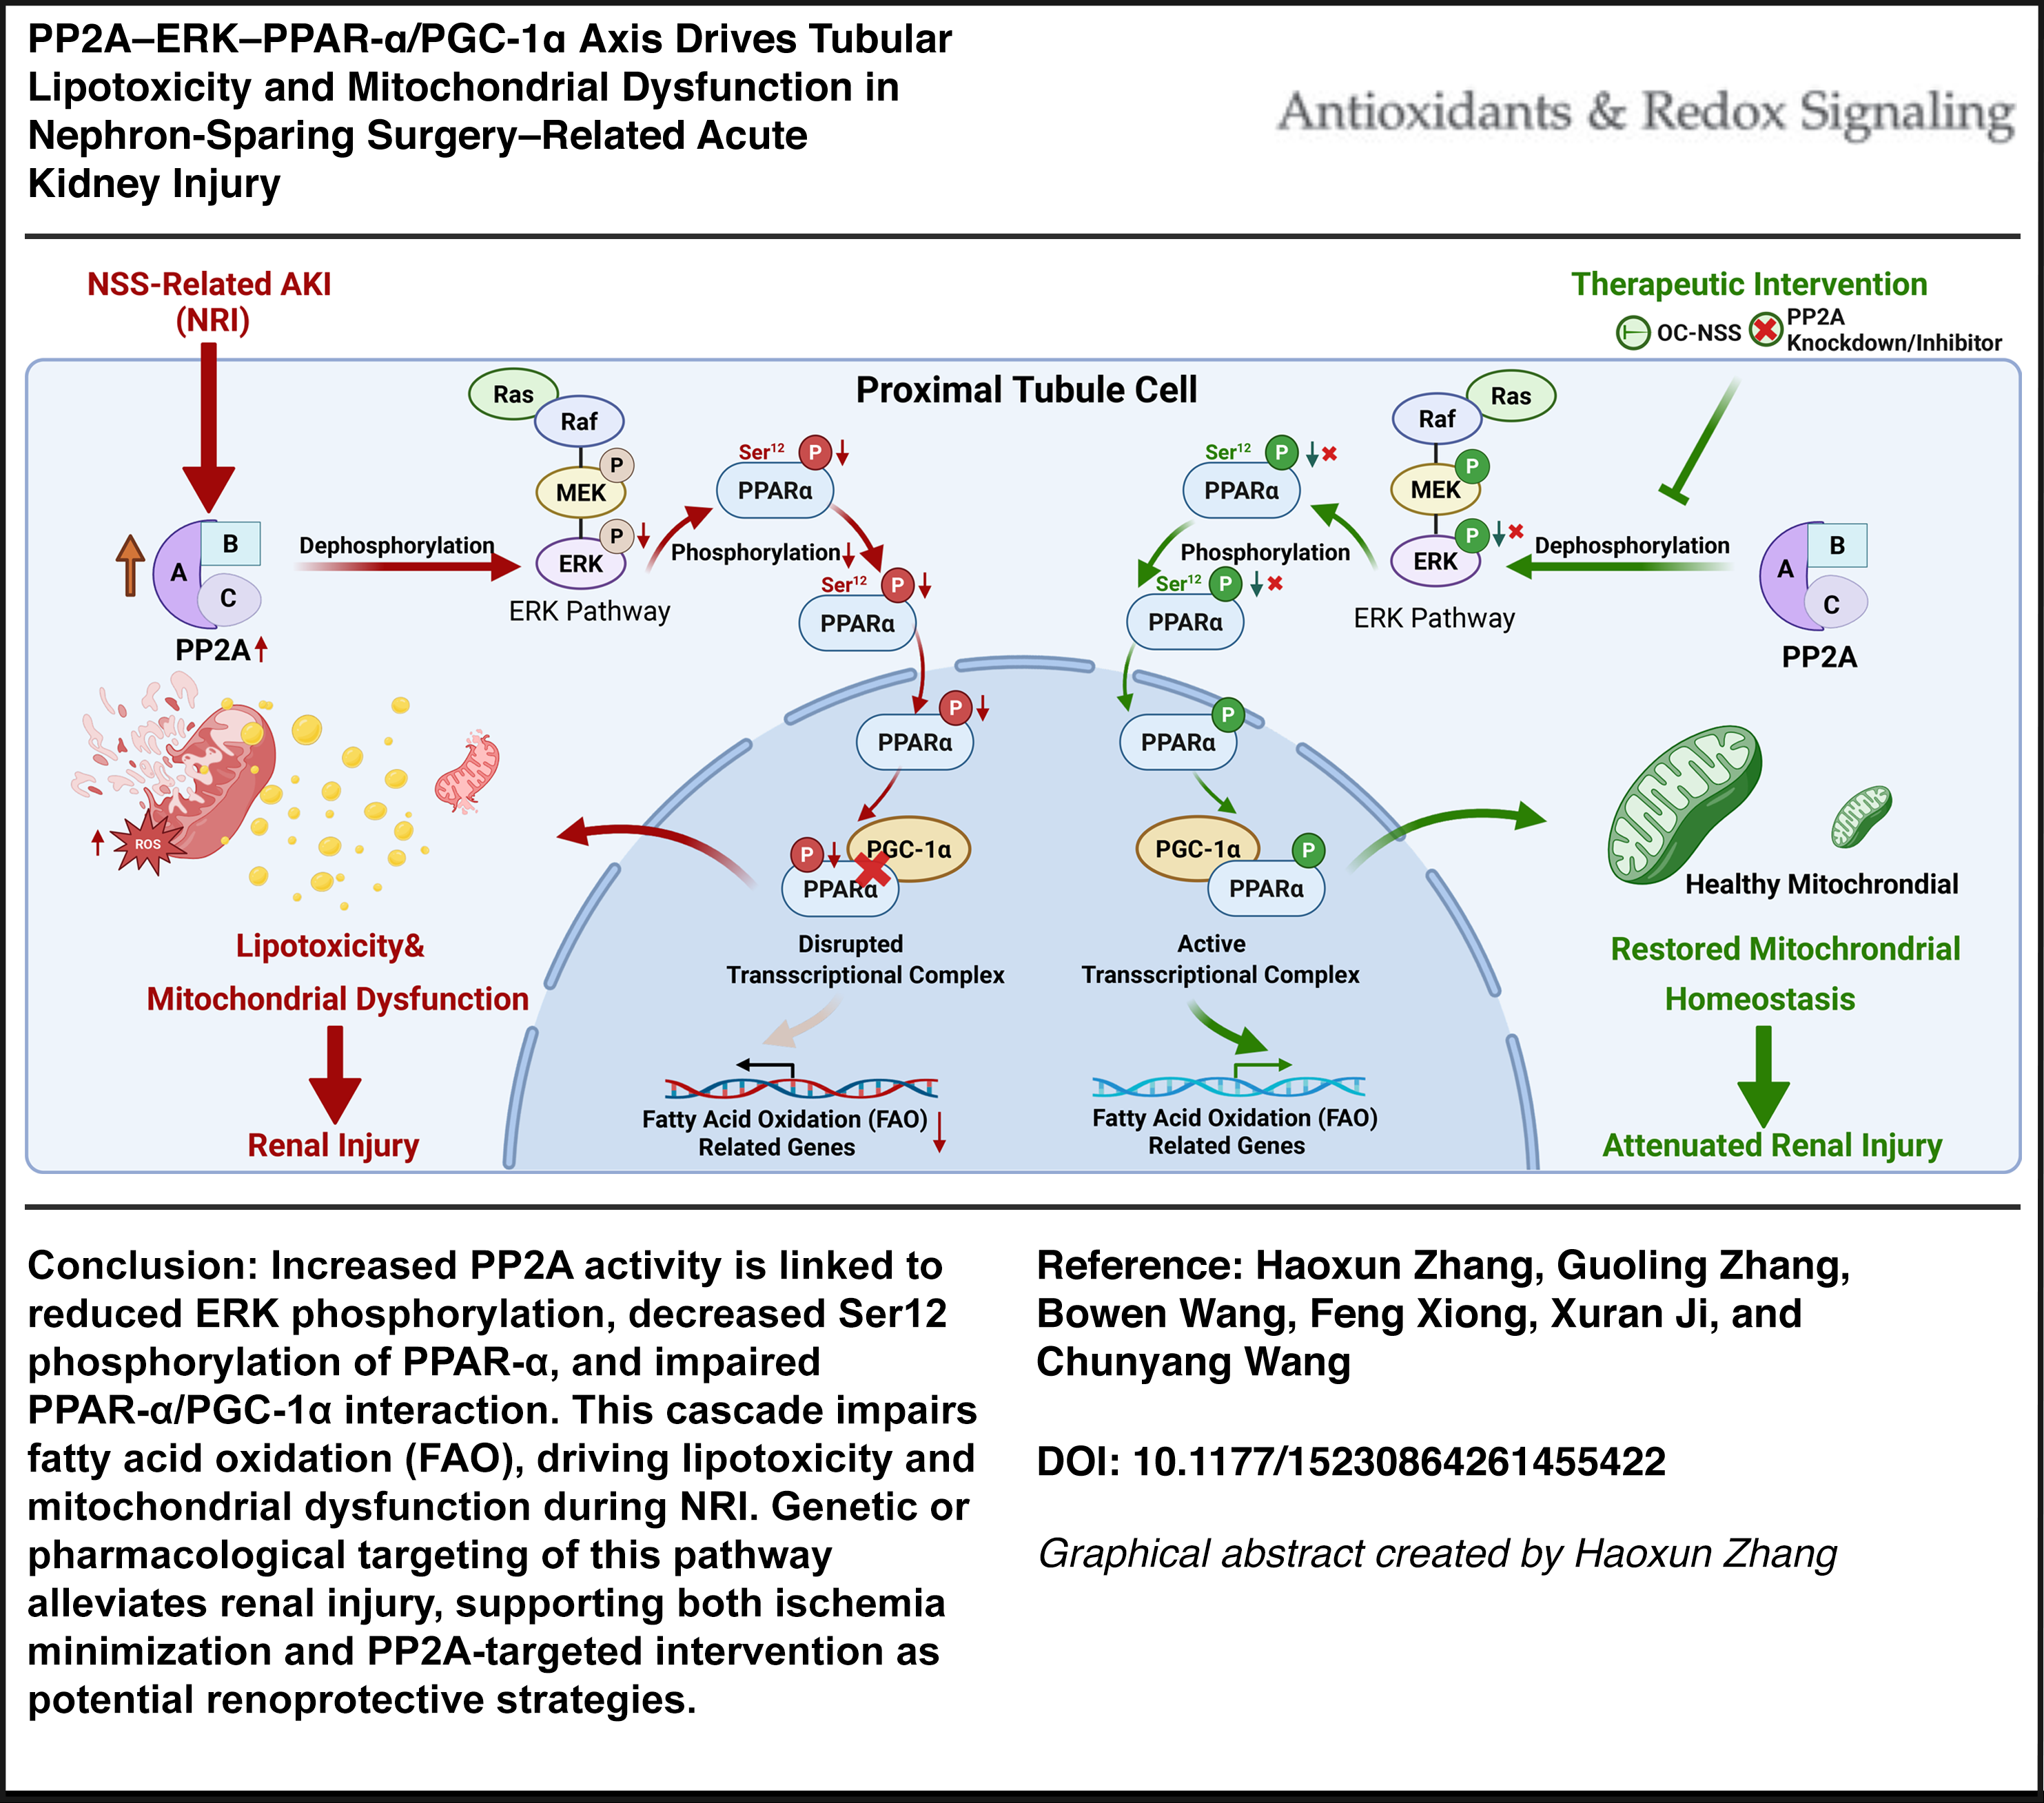
Nephron-sparing surgery (NSS) is associated with acute kidney injury (AKI) that can accelerate chronic kidney disease progression, yet the mechanisms driving NSS-related injury (NRI) remain incompletely understood. In particular, how surgical stress reprograms proximal tubular energy metabolism independent of persistent ischemia remains unresolved. This study aimed to elucidate the mechanisms underlying lipid metabolic dysregulation and mitochondrial dysfunction in NRI.
Results:
Clinical cohort analysis showed that prolonged warm ischemia time was independently associated with postoperative AKI. Across human and experimental NRI, proximal tubular cells exhibited consistent suppression of fatty acid oxidation, increased lipid accumulation, and mitochondrial dysfunction. These metabolic abnormalities were associated with increased protein phosphatase 2A (PP2A) activity, reduced extracellular signal-regulated kinase (ERK) phosphorylation, and diminished transcriptional activity of the peroxisome proliferator-activated receptor-alpha (PPAR–α)/PGC-1α metabolic axis. Experimental modulation of PP2A or restoration of ERK-dependent PPAR-α signaling partially rescued mitochondrial function, reduced lipotoxic stress, and attenuated tubular injury. Single-cell and cell-type-resolved analyses localized these changes predominantly to metabolically active proximal tubular subpopulations, supporting the cell-type specificity of this pathway.
Innovation and Conclusion:
This study identifies PP2A-dependent suppression of ERK–PPAR-α/PGC-1α signaling as a central mechanism underlying proximal tubular metabolic failure in NRI. By linking surgical stress to disordered lipid metabolism, these findings reveal a previously underappreciated regulatory pathway distinct from classical ischemic injury and highlight tubular metabolic resilience as a therapeutic target for mitigating kidney injury following nephron-sparing surgery. Antioxid. Redox Signal. 00, 000–000.
Keywords
Introduction
Nephron-sparing surgery (NSS) is widely used for localized renal tumors as it preserves renal parenchyma while maintaining oncologic control (Campbell et al., 2017; Ljungberg et al., 2015). However, temporary hilar or arterial clamping is often required to reduce bleeding during tumor excision, exposing the remaining kidney to ischemic and surgical stress, thereby increasing the risk of postoperative acute kidney injury (AKI), which can contribute to subsequent renal functional decline. (Lane et al., 2015; Ricciardi et al., 2025; Volpe et al., 2015; Xiong et al., 2022). Therefore, defining the mechanisms of NSS-related injury is important for improving renal protection during partial nephrectomy.
Renal proximal tubular epithelial cells (RPTECs) have high energy demand and depend heavily on mitochondrial fatty acid oxidation (FAO) for adenosine triphosphate (ATP) production (Bhargava and Schnellmann, 2017; Kang et al., 2015). Disruption of lipid metabolism can lead to lipid accumulation, oxidative stress, and tubular injury, a process increasingly recognized across kidney disease settings (Nakamura et al., 2023; Zhao et al., 2019; Zuo et al., 2024). Mitochondrial dysfunction is also a central feature of AKI and includes impaired bioenergetics, abnormal mitochondrial dynamics, swelling, and cristae disruption (Bhargava and Schnellmann, 2017; Pan and Zhu, 2026; Su et al., 2023). NSS imposes both ischemic and surgical stress on the remaining kidney, but how NSS-related injury (NRI) alters lipid metabolism and mitochondrial homeostasis in tubular cells remains incompletely understood.
Innovation
This study identifies a regulatory pathway for NSS-related AKI (NRI), linking proximal tubular lipotoxicity and mitochondrial dysfunction to impaired PPAR-α-dependent metabolic programs and dysregulation of PP2A/ERK/PPAR-α/PGC-1α signaling. Our findings further highlight PPP2CB as a functionally important target of this process. Clinically, these results support two complementary strategies for renal protection during NSS: minimizing ischemic exposure, including through OC approaches when feasible, and targeting PP2A-associated metabolic dysfunction when ischemia cannot be avoided. Together, these findings provide a foundation for understanding postoperative renal injury after NSS and suggest potential avenues for targeted renoprotective intervention.
Peroxisome proliferator-activated receptor-α (PPAR-α) is a major regulator of renal FAO and mitochondrial metabolic homeostasis (Masenga et al., 2025). Reduced PPAR-α activity has been implicated in multiple models of kidney injury and is associated with impaired lipid metabolic capacity (Portilla et al., 2002; Yu et al., 2021). The transcriptional activity of PPAR-α depends on cooperation with metabolic coactivators such as PGC-1α and is also influenced by kinase signaling (Burns and Vanden Heuvel, 2007; Tahri-Joutey et al., 2021). These observations suggest that impaired PPAR-α/PGC-1α signaling may contribute to tubular metabolic dysfunction during NRI.
Protein phosphatase 2A (PP2A) is a major serine/threonine phosphatase that regulates multiple kinase-dependent pathways, including MAPK/extracellular signal-regulated kinase (ERK) signaling (Letourneux et al., 2006; Lu et al., 2022). PP2A has been implicated in renal stress responses and may contribute to kidney injury through modulation of kinase-dependent signaling pathways. ERK activity can influence phosphorylation-dependent regulation of downstream transcription factors and metabolic regulators. Whether PP2A links NSS-related stress to ERK inactivation, impaired PPAR-α/PGC-1α signaling, and tubular metabolic dysfunction remains undefined.
Here, we investigated whether PP2A-dependent modulation of ERK–PPAR-α/PGC-1α signaling contributes to proximal tubular metabolic dysfunction in NRI.
Results
Prolonged warm ischemia time is associated with an increased risk of postoperative AKI
To identify predictors of postoperative AKI after NSS, we analyzed clinical and perioperative factors in this patient cohort. Baseline characteristics are summarized in Supplementary Table S1. A total of 398 patients who underwent NSS were included, of whom 234 (58.79%) underwent standard renal artery clamping and 164 (41.21%) underwent off-clamp (OC) NSS. Tumor complexity was comparable between groups, as reflected by RENAL scores (6.03 vs. 5.87, p = 0.338). The overall incidence of postoperative AKI was 18.59% and was significantly higher in the standard clamping group than in the OC group (23.93% vs. 10.98%, p = 0.001). Although intraoperative blood loss was numerically higher in the OC group (101.78 vs. 76.97 mL), the difference was not significant (p = 0.191). By contrast, the OC group had shorter operative times (131.61 vs. 146.22 min, p = 0.017) and shorter hospital stays (5.52 vs. 6.15 days, p = 0.003).
We then performed univariate and multivariable logistic regression analyses to evaluate the relationship between these variables and postoperative AKI (Supplementary Table S2). In univariate analysis, higher baseline serum creatinine (Scr; odds ratio [OR]: 1.04, 95% confidence interval [CI]: 1.02–1.06; p < 0.001), diabetes (OR: 1.98, 95% CI: 1.13–3.50; p = 0.018), and longer warm ischemia time (WIT) (OR: 1.05, 95% CI: 1.03–1.07; p < 0.001) were associated with increased AKI risk, whereas the OC technique was associated with lower risk (OR: 0.39, 95% CI: 0.22–0.70; p = 0.001). In multivariable analysis, baseline Scr (OR: 1.04, 95% CI: 1.02–1.07; p < 0.001) and WIT (OR: 1.09, 95% CI: 1.04–1.14; p < 0.001) remained independent predictors of postoperative AKI. These findings identify prolonged WIT as an independent risk factor for AKI after NSS.
Construction and evaluation of NRI mouse model
To establish an experimental framework for studying NSS-related injury, we developed five in vivo models: Sham, OC-NSS, I/R, NSS-10 min, and NSS-30 min (Fig. 1A). Resected kidney weights were comparable among the OC-NSS, NSS-10 min, and NSS-30 min groups, and representative intraoperative images are shown in Supplementary Figure S1A, B.

We first assessed postoperative injury severity by monitoring body weight, survival, and renal function. Longitudinal assessment of body weight at postreperfusion days 0, 1, 3, 5, 7, and 30 showed a sustained decline in the NSS-30 min group, indicating more severe systemic impairment (Fig. 1B). Consistently, survival was also significantly reduced in mice subjected to 30 min ischemia (Supplementary Fig. S1C). Serial measurements of Scr and blood urea nitrogen (BUN) at postreperfusion days 0, 1, 3, 5, 7, and 30 showed that mice in the NSS-10 and 30 min group exhibited significantly higher levels than those in the Sham, OC-NSS, and I/R groups (Fig. 1C, D), indicating sustained renal dysfunction in this model.
Histopathological analyses at postoperative day 1 (POD1) further confirmed AKI. Hematoxylin and eosin (H&E) staining revealed marked pathological changes in both NSS groups, including glomerular fibrinoid necrosis with mesangial matrix expansion, tubular necrosis with cast formation and tubular disorganization, interstitial hemorrhage, and inflammatory cell infiltration (Fig. 1E, Supplementary Fig. S1D). Dihydroethidium (DHE) staining showed increased reactive oxygen species (ROS) levels in both NSS groups compared with controls (Fig. 1E; Supplementary Fig. S1E). Immunohistochemistry showed increased neutrophil gelatinase-associated lipocalin (NGAL) expression, and cleaved caspase-3 staining and TUNEL assays showed increased tubular apoptosis in the NSS groups (Fig. 1E; Supplementary Fig. S1F–H). Serum TNF-α, IL-1β, and IL-6 levels were also elevated in NSS mice at POD1 (Fig. 1F). Kidney morphology further showed a congestive and hemorrhagic border zone surrounding the necrotic area in this model (Fig. 1G). At the molecular level, western blotting and quantitative polymerase chain reaction (PCR) of kidney tissues collected at POD1 showed increased expression of tubular injury markers, including cleaved caspase-3, kidney injury molecule-1 (KIM-1), and NGAL, together with corresponding increases in their mRNA levels in NRI kidneys compared with controls (Fig. 1H; Supplementary Fig. S1I–L).
We then evaluated whether this model was accompanied by longer-term pathological changes. Ultrasonographic measurements at POD30 showed that kidney volume was significantly reduced in the NSS groups compared with the Sham, OC-NSS, and I/R groups, indicating renal atrophy (Supplementary Fig. S1M, N). Masson staining and alpha-smooth muscle actin (α-SMA) immunohistochemistry performed in the NSS-10 min group at postoperative days 0, 3, 7, and 30 demonstrated progressive renal fibrosis, which was already detectable at day 7 and became most pronounced by day 30 (Supplementary Fig. S1O–Q). Given its significant acute injury and favorable survival rate, the NSS-10 min protocol was used for subsequent mechanistic studies of NRI.
Multiomics analyses reveal proximal tubular metabolic reprogramming in NRI
To identify molecular programs altered during NRI, we integrated bulk transcriptomic, metabolomic, and single-cell RNA sequencing analyses of kidneys collected at POD1. Principal component analysis showed separable transcriptional profiles among the Sham, OC-NSS, I/R, and NRI groups (Supplementary Fig. S2A). Differential expression analysis, using thresholds of |log2FC| > 1 and false discovery rate-adjusted p < 0.05, revealed substantial transcriptional alterations across groups. Compared with the Sham group, the OC-NSS group showed 585 differentially expressed genes (DEGs; 256 upregulated and 329 downregulated), the I/R group showed 1282 DEGs (1204 upregulated and 78 downregulated), and the NRI group showed 2328 DEGs (1389 upregulated and 939 downregulated; Supplementary Fig. S2B–D).
Kyoto Encyclopedia of Genes and Genomes (KEGG) pathway analysis was then used to define the major biological programs affected in each injury model. In the OC-NSS group, DEGs were mainly enriched in PPAR signaling and complement and coagulation cascades, whereas DEGs in the I/R group were primarily enriched in cytokine–cytokine receptor interaction and TNF signaling (Supplementary Fig. S2E, F). For the NRI group, DEGs identified relative to Sham were enriched in metabolic pathways, viral protein–cytokine receptor interaction, PPAR signaling, and TNF signaling (Supplementary Fig. S2G). To complement the transcriptomic data, we performed metabolomic profiling of NRI kidney tissues. Compared with the Sham group, 308 metabolites were significantly altered, including 162 increased and 146 decreased metabolites (Supplementary Fig. S3A–C). KEGG-based integrative analysis indicated disturbances involving lipid, amino acid, carbohydrate, cofactor, and vitamin metabolism (Supplementary Fig. S3D), consistent with substantial metabolic alterations in NRI.
We then used single-cell RNA sequencing to resolve cell-type-specific changes. Analysis of 85,084 quality-controlled cells, including 27,170 cells from Sham kidneys, 28,651 from I/R kidneys, and 29,263 from NRI kidneys (Supplementary Fig. S4A–D), identified 13 transcriptionally distinct cell clusters based on established marker genes (Fig. 2A–C; Supplementary Fig. S4E). Subsequent analysis focused on proximal tubule cells (PTCs; Fig. 2D). In PTCs from NRI kidneys, compared with both Sham and I/R kidneys, upregulated genes were enriched in MAPK signaling, TNF signaling, and mitophagy-related pathways, whereas downregulated genes were enriched in fatty acid metabolism, PPAR signaling, and the peroxisome pathway (Fig. 2E, F). In I/R versus Sham, upregulated genes were enriched in protein digestion and absorption, insulin resistance, and extracellular matrix–receptor interaction, while downregulated genes were associated with ribosome biogenesis, proteasome function, and cofactor biosynthesis (Fig. 2G).
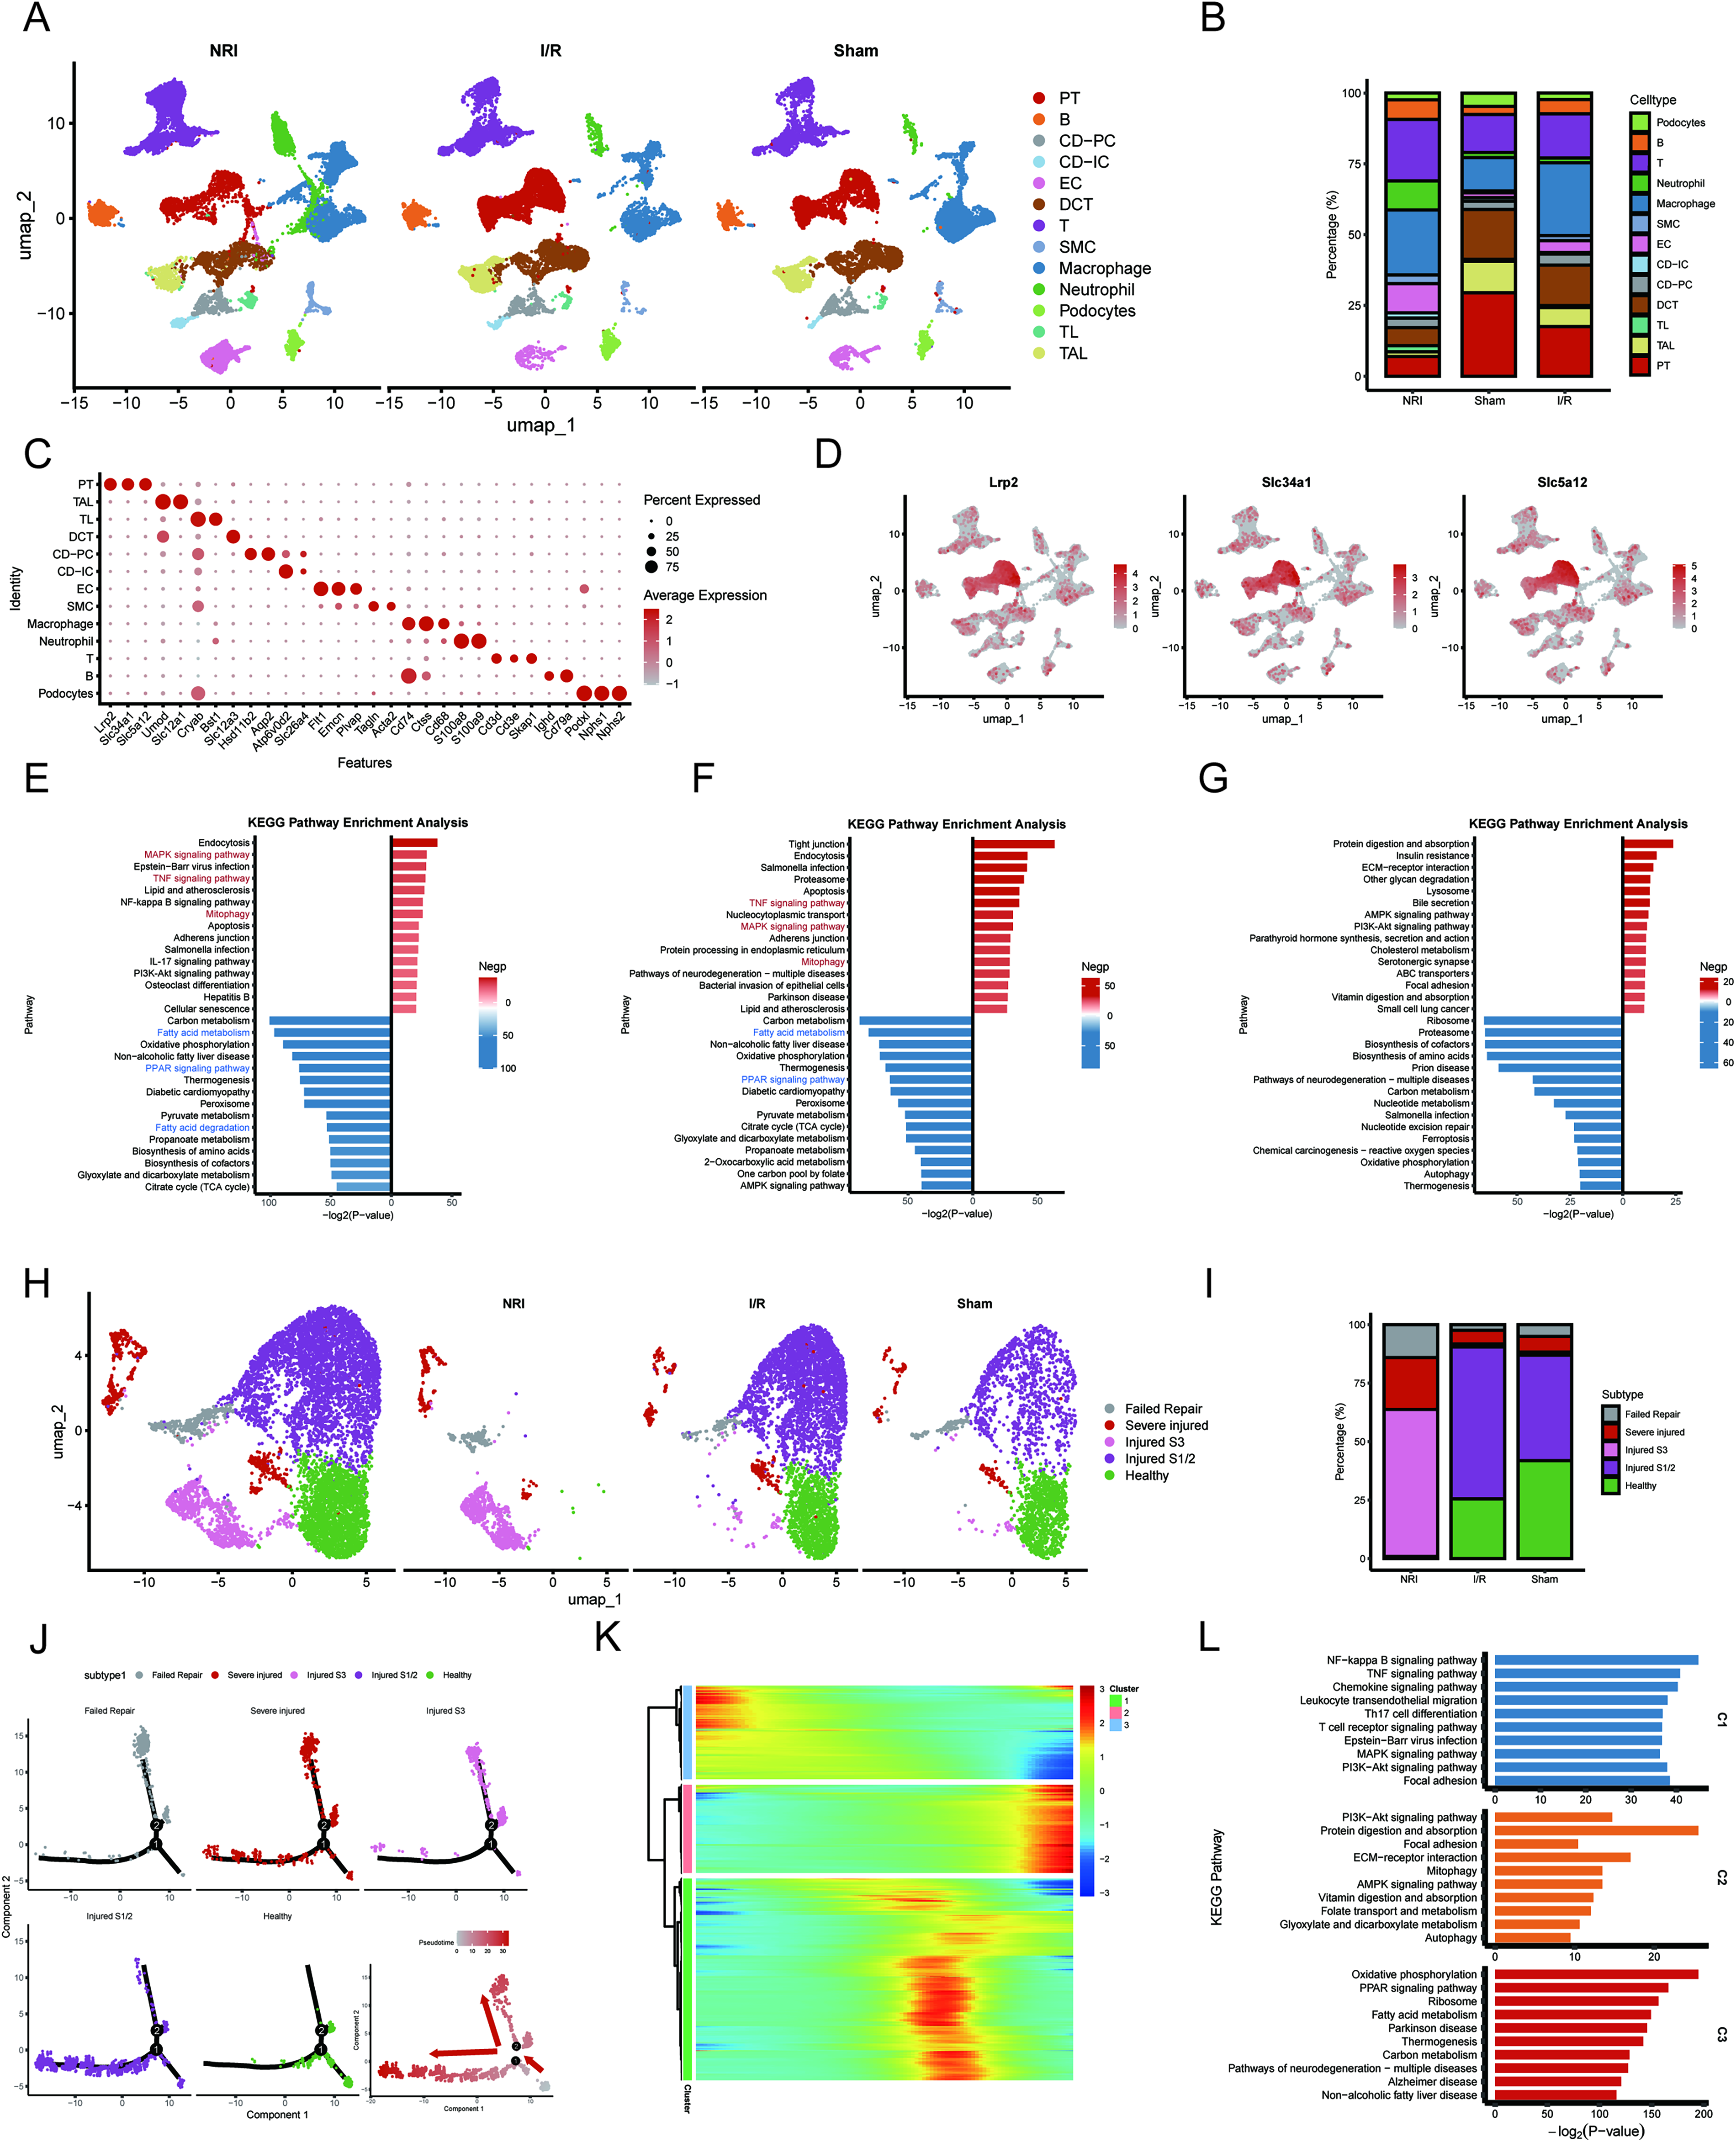
To further characterize proximal tubular injury, we reclustered PTCs and identified five cell states, including healthy, injured S1/2, injured S3, severely injured, and failed-repair populations (Fig. 2H, I). Pseudotime trajectory analysis showed a progressive transition from healthy cells to increasingly injured states (Fig. 2J). Dynamic gene analysis grouped altered genes into three modules. Modules 1 and 2 were enriched in inflammatory and stress-related pathways, including NF-κB, TNF, chemokine, PI3K-Akt, mitophagy, and AMP-activated protein kinase signaling, whereas Module 3 was enriched for downregulated metabolic pathways, including PPAR signaling, fatty acid metabolism, thermogenesis, and carbon metabolism (Fig. 2K, L). Collectively, these multiomics data support prominent metabolic remodeling in NRI, with suppression of fatty acid metabolic programs in PTCs emerging as a notable feature.
Suppressed fatty acid metabolism is accompanied by lipid accumulation and mitochondrial injury in NRI
To further characterize fatty acid metabolic alterations at single-cell resolution, we calculated AUCell activity scores for the PPAR signaling and fatty acid metabolism gene sets (MSigDB). Among all renal cell populations, PTCs exhibited the highest enrichment scores for both pathways (Fig. 3A, B). Comparative analysis among the Sham, I/R, and NRI groups showed that both pathway activities were significantly reduced in PTCs from NRI kidneys, with a more pronounced decrease than that observed in the I/R group (Fig. 3C).

We next examined whether these transcriptional changes were accompanied by systemic alterations in fatty acid metabolism in vivo. Oil Red O staining showed increased lipid accumulation in NSS-treated kidneys compared with the Sham group (Fig. 3D, E). In addition, serum-free fatty acid levels were significantly elevated in mice subjected to ≥10 min ischemia (Fig. 3F). Pearson correlation analysis further demonstrated strong positive correlations between serum-free fatty acid levels and Scr (R = 0.94, p < 0.001) as well as BUN (R = 0.93, p < 0.001) at POD1 (Fig. 3G, H), suggesting an association between altered fatty acid metabolism and the severity of renal injury.
We then evaluated mitochondrial morphology and function in the injured kidney. Transmission electron microscopy (TEM) revealed marked mitochondrial abnormalities in renal tubular cells from the NRI group, including fragmentation, swelling, vacuolation, and cristae disruption (Fig. 3I). Quantitative analysis further showed reduced mitochondrial length and significantly decreased ATP production in NRI kidneys (Fig. 3J, K), consistent with mitochondrial dysfunction.
We further examined molecular changes related to FAO. Both mRNA and protein levels of CPT1A, CPT2, ACOX1, and ACOX2 were significantly decreased in NRI kidneys compared with controls (Fig. 3L–N). In addition, immunofluorescence staining of renal tubular epithelial cells isolated from Sham, OC-NSS, I/R, and NRI kidneys showed reduced ACOX1 and CPT1A intensity in both the I/R and NRI groups, with a more marked reduction in NRI (Supplementary Fig. S5A, B). Moreover, consistent with mitochondrial structural injury, proteins associated with mitochondrial fusion were decreased, whereas fission-related proteins were increased in NRI kidneys (Fig. 3O, P). Collectively, these findings identify impaired fatty acid metabolic homeostasis and mitochondrial dysfunction as prominent features of NRI.
Hypoxia-scratch/reoxygenation injury recapitulates metabolic dysfunction observed in NRI in vitro
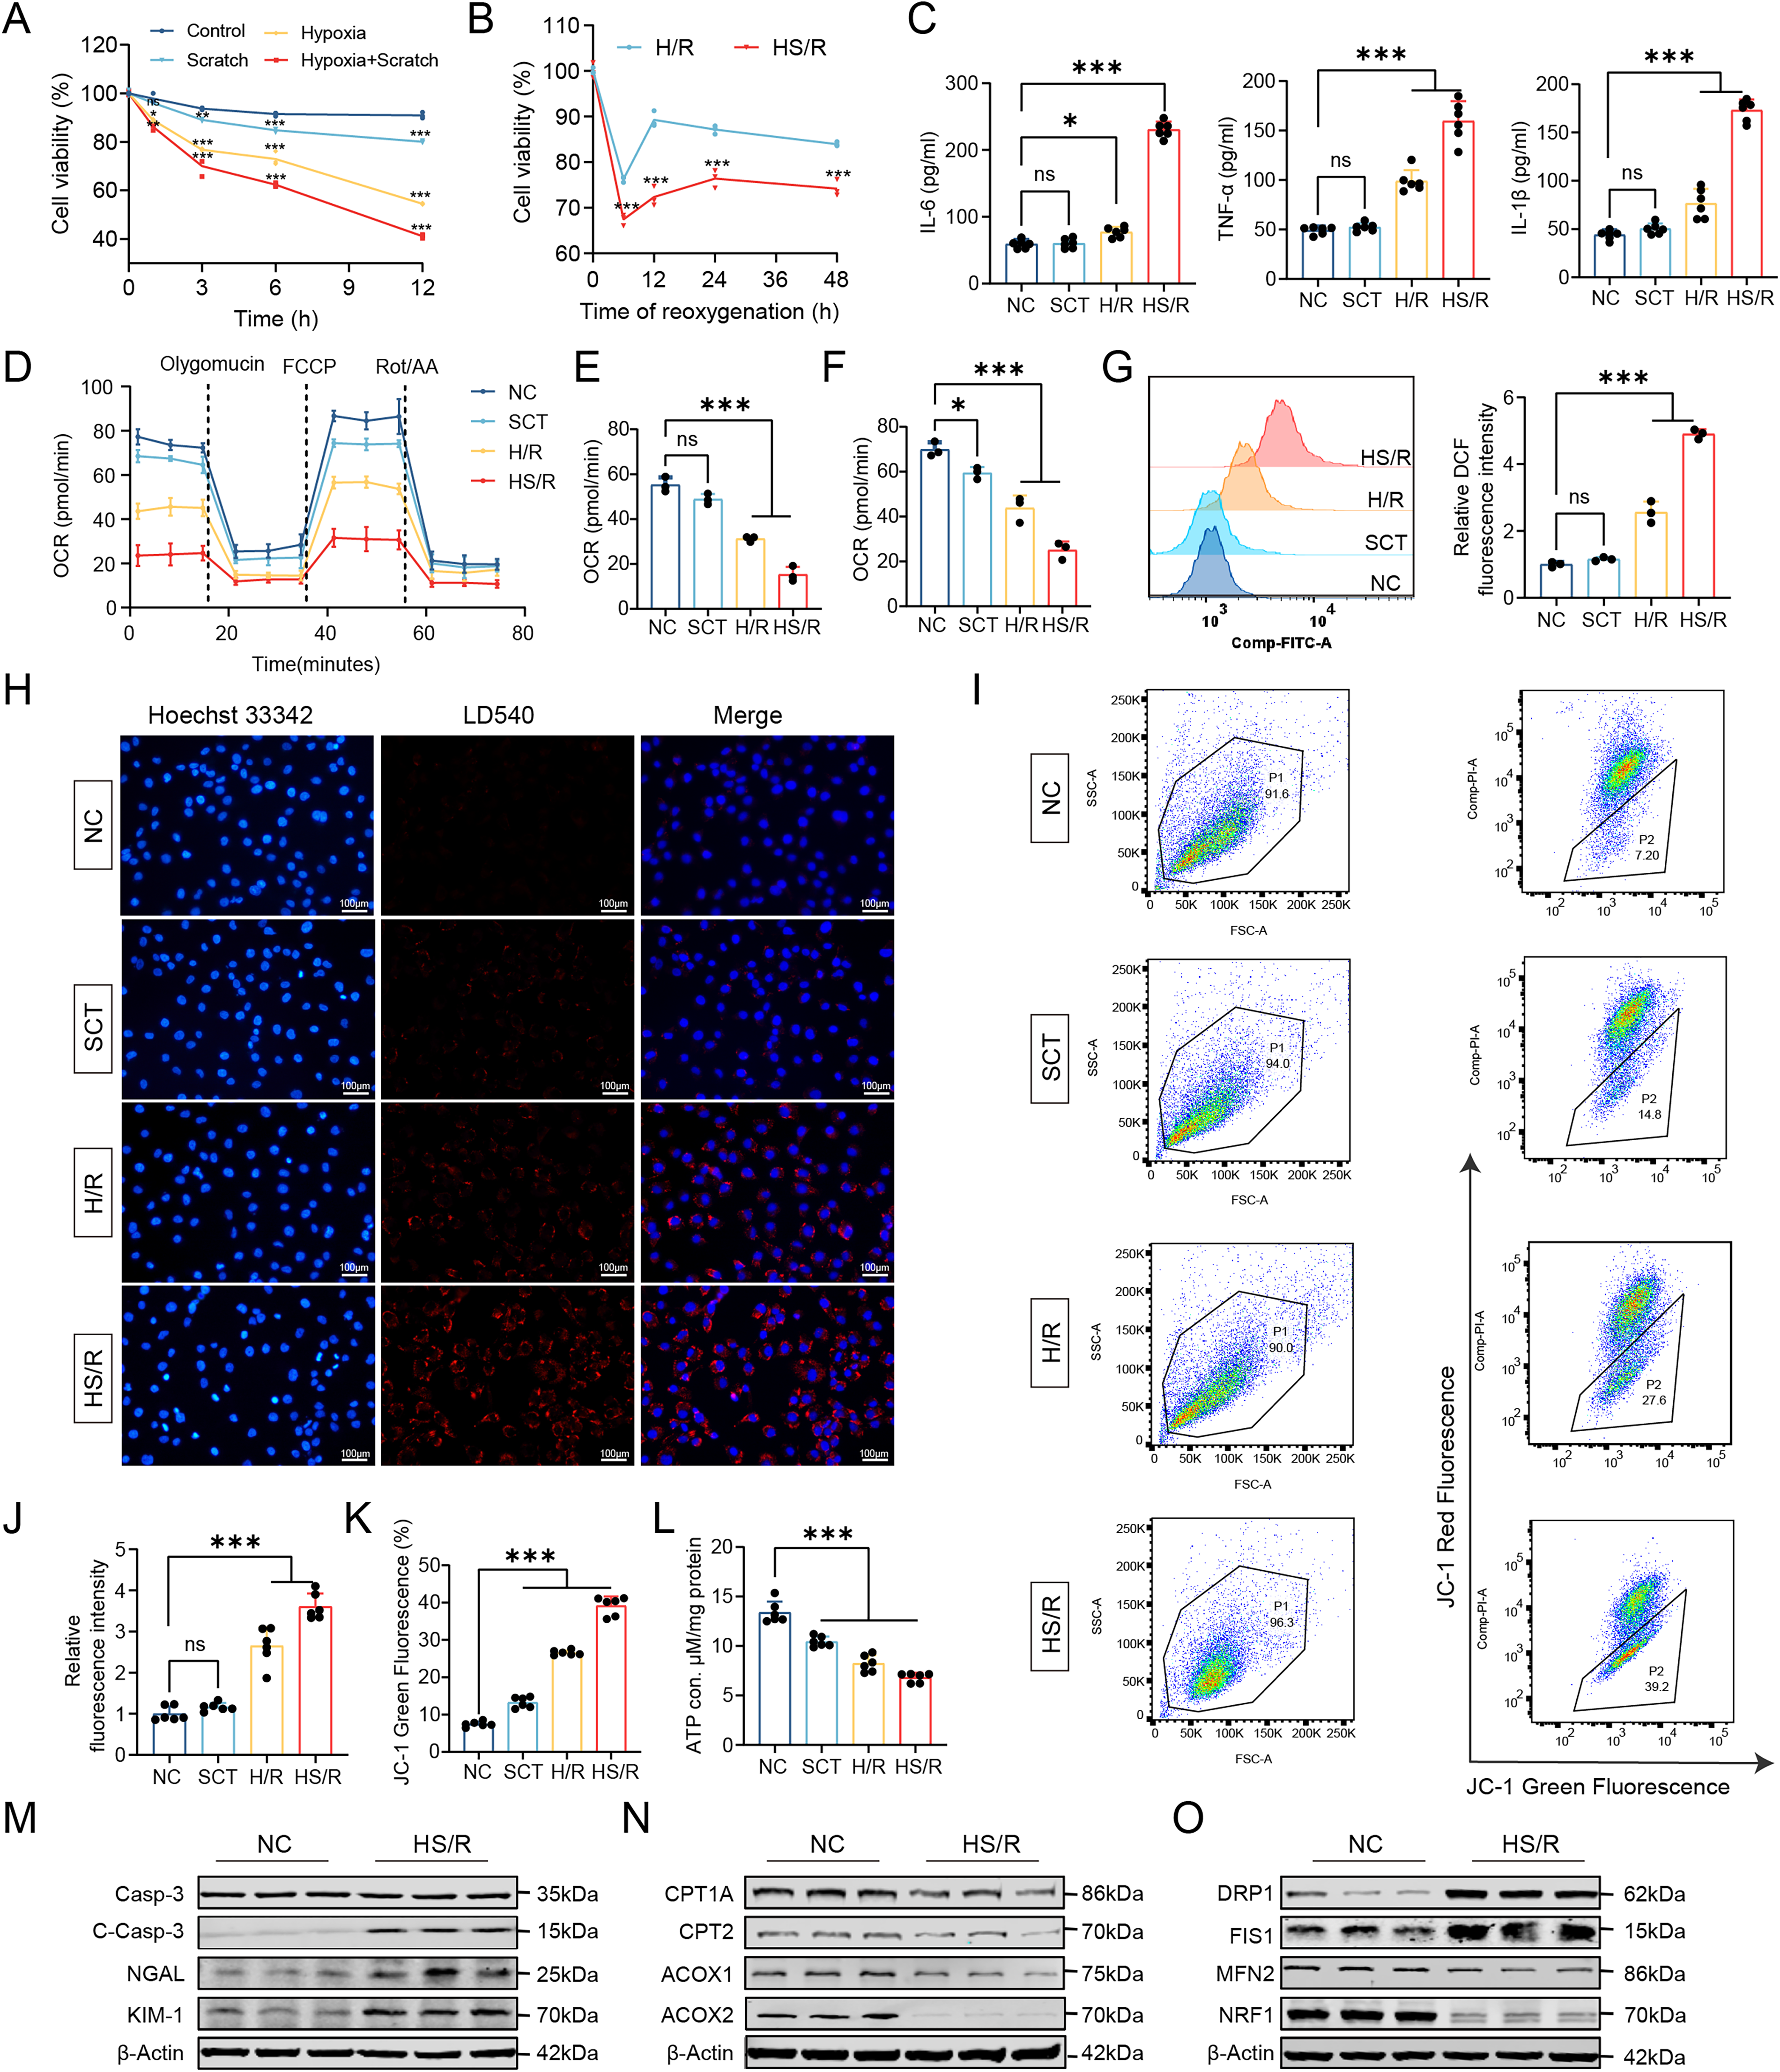
To better model the combined ischemic and mechanical stress associated with NSS, we established a combined hypoxia-scratch/reoxygenation (HS/R) model in HK2 cells (Supplementary Fig. S6A). Cell viability was assessed under scratch alone (SCT), hypoxia/reoxygenation (H/R), and combined HS/R conditions. Combined HS/R caused more severe reductions in viability than H/R alone. Based on viability profiling, 6 h hypoxia followed by 12 h reoxygenation was selected for subsequent experiments, as this condition induced substantial cellular injury while preserving sufficient viability for mechanistic analyses (Fig. 4A, B).
To compare the transcriptional features of HS/R with in vivo NRI, we performed transcriptomic sequencing in normoxia, H/R, and HS/R-treated HK2 cells. Differential expression analysis identified 954 DEGs in H/R versus control cells and 1769 DEGs in HS/R versus control cells (Supplementary Fig. S6B, C). Comparative analysis with the in vivo NRI dataset showed that H/R and NRI shared 309 DEGs (32%), whereas HS/R shared 1117 DEGs (63%) with NRI, substantially exceeding the overlap observed between H/R and NRI (Supplementary Fig. S6D, E). KEGG enrichment analysis showed overlapping changes in metabolic pathways, MAPK/TNF signaling, and fatty acid metabolism (Supplementary Fig. S6F, G).
We next examined whether HS/R reproduced key metabolic and mitochondrial injury phenotypes observed in NRI. Enzyme-linked immunosorbent assay (ELISA) showed that the levels of pro-inflammatory cytokines, including TNF-α, IL-1β, and IL-6, were significantly higher in HS/R-treated cells than in H/R- or SCT-treated cells (Fig. 4C). Real-time measurements of oxygen consumption rate (OCR) showed significant reductions in both basal and maximal respiration after HS/R compared with SCT or H/R treatment (Fig. 4D, F). Flow cytometric analysis showed increased intracellular ROS after HS/R treatment (Fig. 4G). Fluorescence staining showed increased intracellular lipid droplet accumulation in HS/R-treated cells (Fig. 4H, J). JC-1 staining showed a reduced red/green fluorescence ratio, indicating mitochondrial membrane potential depolarization, and ATP production was also decreased after HS/R (Fig. 4I, K, L).
We further examined molecular markers of tubular injury, FAO, and mitochondrial dynamics in this model. Western blotting showed increased expression of tubular injury markers, including cleaved caspase-3, KIM-1, and NGAL, together with reduced expression of the FAO-related proteins CPT1A, CPT2, ACOX1, and ACOX2 in HS/R-treated cells (Fig. 4M, N; Supplementary Fig. S7A–G). Immunofluorescence staining showed that ACOX1 and CPT1A signals were reduced after both H/R and HS/R treatment, with a more pronounced decrease in the HS/R group (Supplementary Fig. S7H, I). Changes in mitochondrial dynamics-related proteins were also observed, including decreased expression of the fusion-related proteins MFN2 and NRF1 and increased expression of the fission-related proteins FIS1 and DRP1 (Fig. 4O; Supplementary Fig. S7J–M). Taken together, these results establish HS/R as an in vitro model that recapitulates key transcriptional and metabolic features of NRI and provides a platform for mechanistic studies.
ERK inactivation is associated with reduced PPAR-α phosphorylation in NRI
To investigate early signaling events associated with PPAR-α regulation, we measured phosphorylated Ser12-PPAR-α (pSer12-PPAR-α) levels in NRI kidneys and HS/R-treated HK2 cells. In kidney tissues collected at 0, 1, 3, 6, 12, and 24 h after surgery, and in HS/R-treated HK2 cells collected at 0, 5, 15, 30, 60, and 120 min after reoxygenation, pSer12-PPAR-α levels were significantly reduced at 1 h and 3 h in vivo and showed a rapid decrease beginning at 15 min in vitro (Fig. 5A–F). The mRNA levels of CPT1A and ACOX1 were also decreased after HS/R treatment, and peroxisome-proliferator-responsive element (PPRE) reporter assays showed reduced PPAR-α-dependent transcriptional activity (Fig. 5G, H).
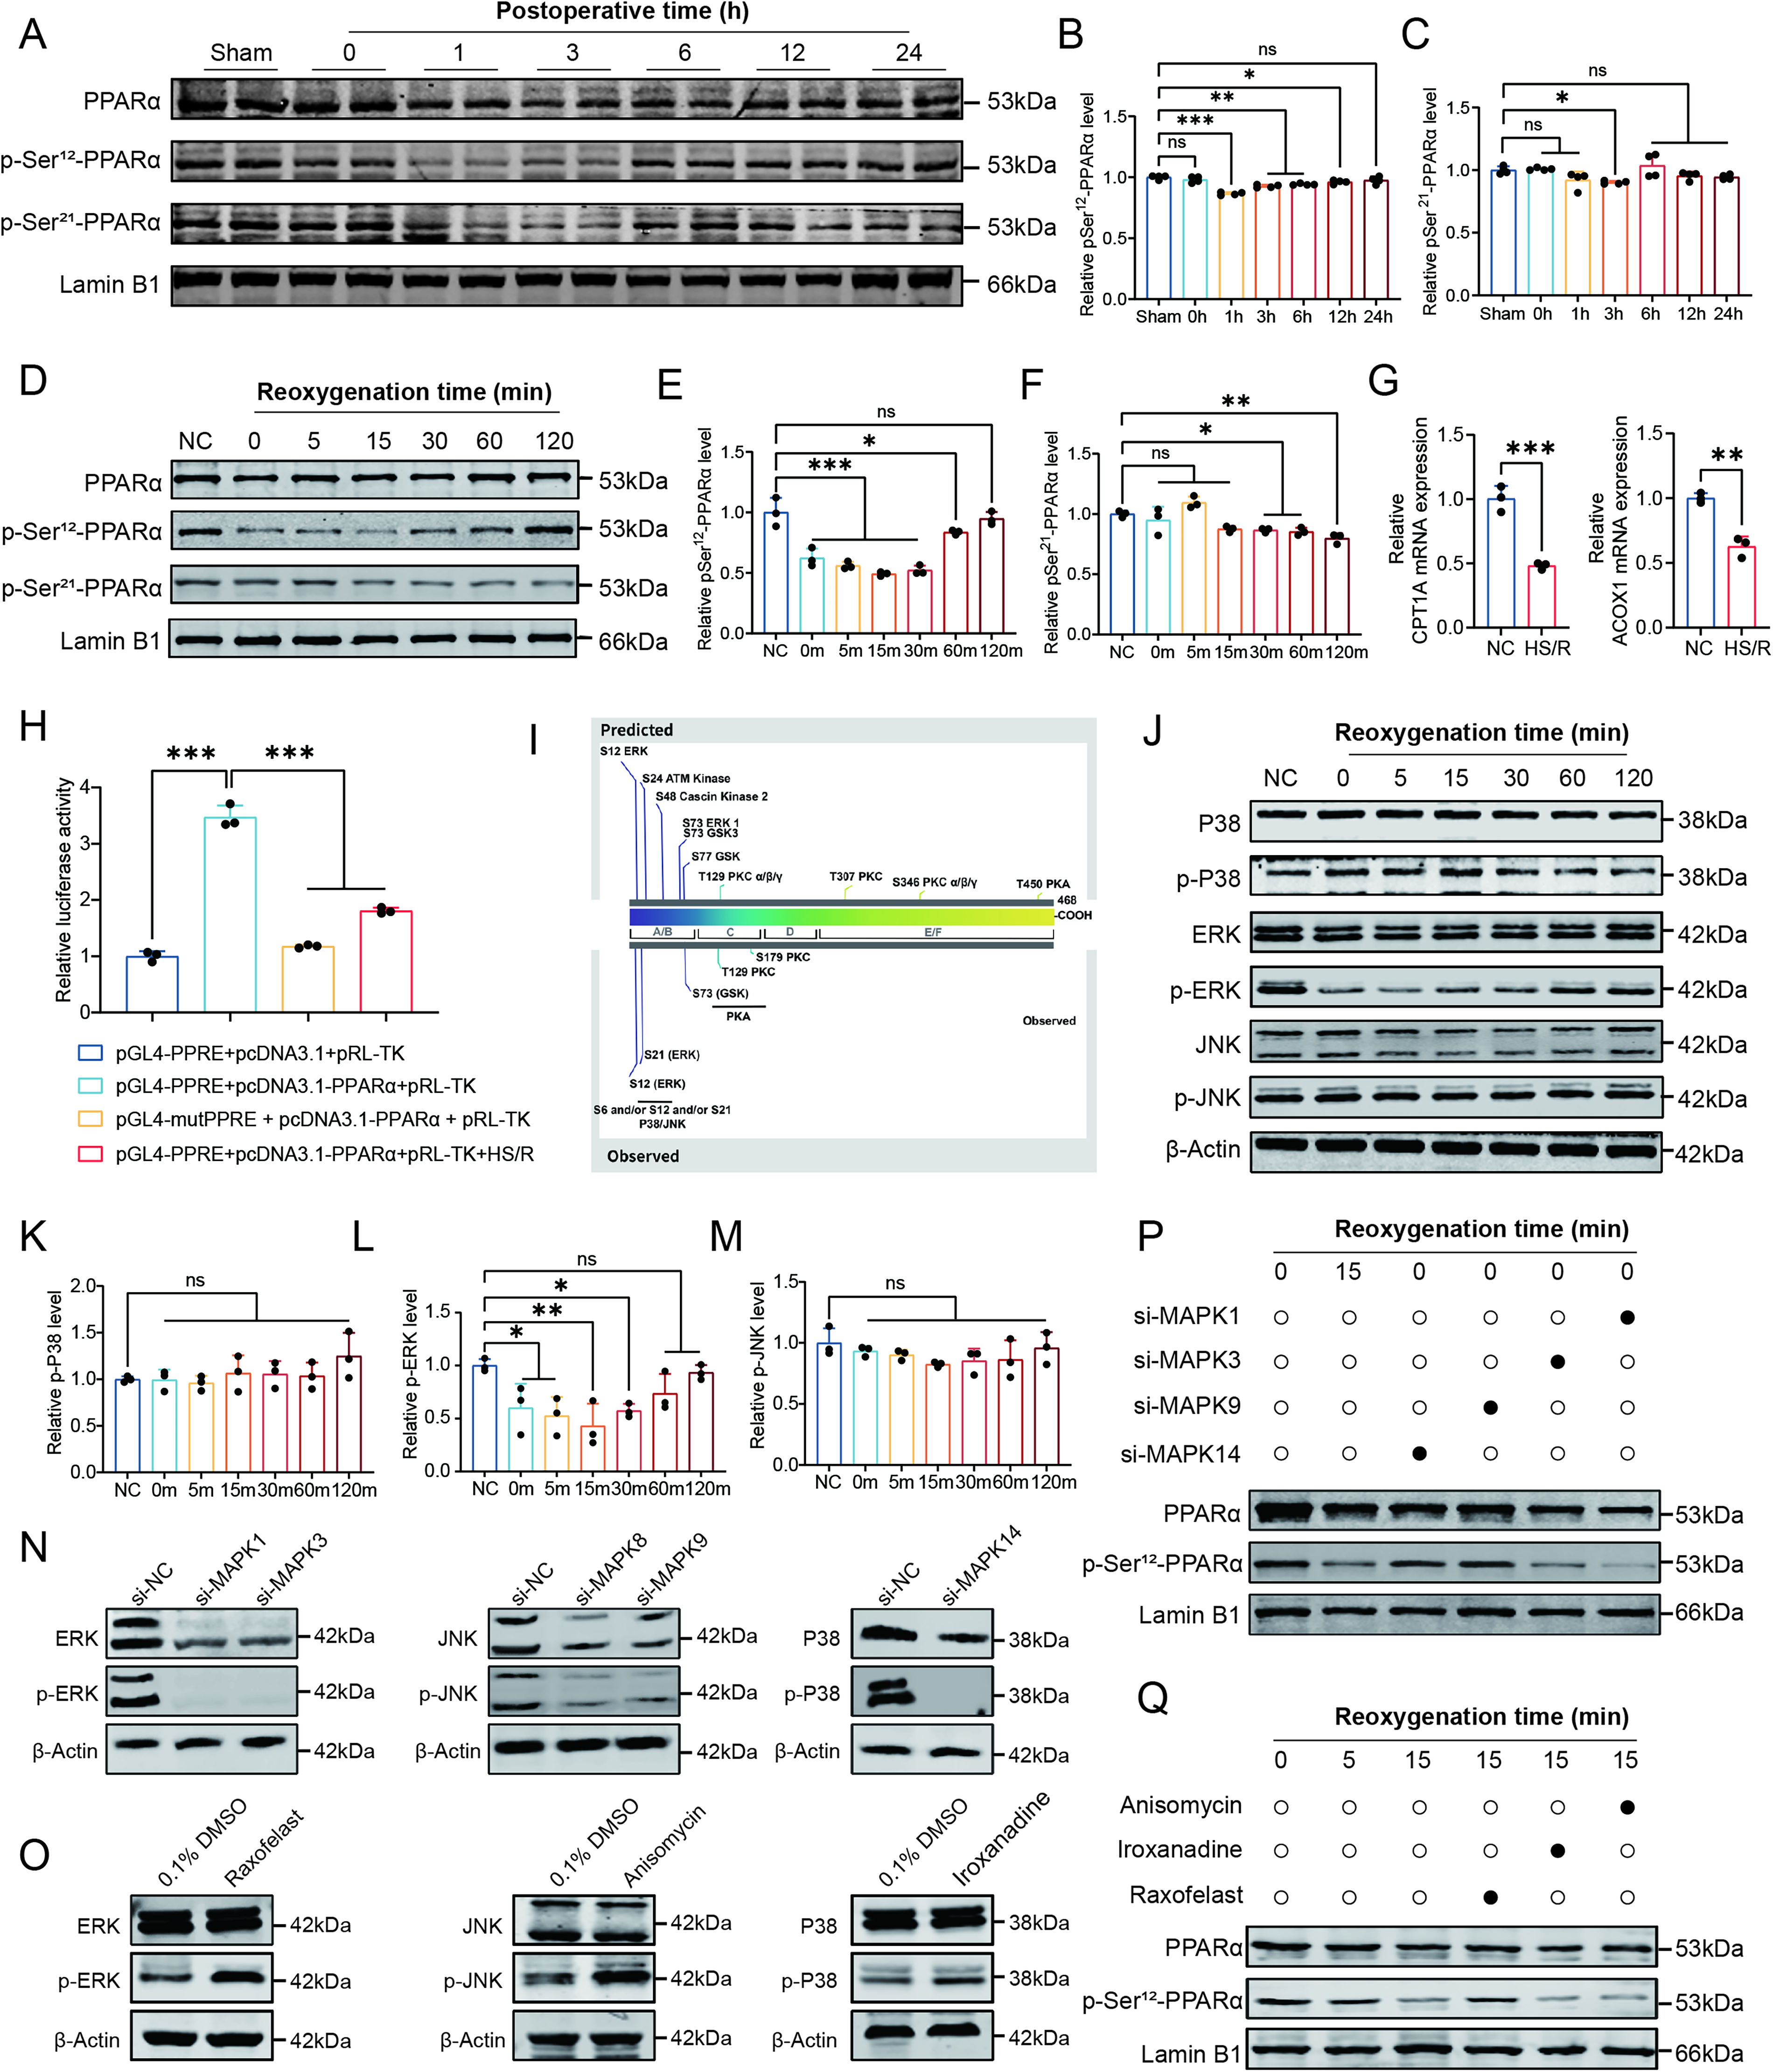
Bioinformatic analysis identified serine residues 12 and 21 within the A/B domain of PPAR-α as candidate MAPK-regulated phosphorylation sites (Fig. 5I). We therefore examined MAPK signaling in HS/R-treated HK2 cells. Western blot analysis showed that phosphorylation of ERK was significantly reduced, whereas phosphorylation of p38 and JNK was not significantly altered (Fig. 5J–M). To further assess the contribution of these pathways, we performed siRNA-mediated knockdown of ERK (MAPK1/3), JNK (MAPK8/9), and p38 (MAPK14), together with pharmacological activation of the corresponding pathways (Fig. 5N, O). Knockdown of ERK, but not of JNK or p38, reduced pSer12-PPAR-α levels, implicating ERK signaling in PPAR-α phosphorylation (Fig. 5P). Pharmacological activation of ERK signaling using Raxofelast (10 μM) increased pSer12-PPAR-α levels, whereas activation of p38 or JNK signaling with Iroxanadine (1 μM) or Anisomycin (10 μM) showed no comparable effect (Fig. 5Q).
To further assess whether restoration of ERK signaling could rescue HS/R-induced metabolic dysfunction, we introduced a constitutively active MEK1 construct (CA-MEK1) into HK2 cells. Western blotting showed that HS/R reduced p-ERK and p-PPAR-α, whereas CA-MEK1 increased both phosphorylation signals; this effect was attenuated by PPARA knockdown, and the Ser12-mutant PPARA (PPARA-Mut) failed to restore PPAR-α phosphorylation (Supplementary Fig. S8A). Consistently, immunofluorescence showed that CA-MEK1 increased CPT1A and ACOX1 expression, reduced lipid droplet accumulation, and improved mitochondrial membrane potential under HS/R conditions, whereas these effects were diminished by PPARA knockdown and were not restored by the Ser12-mutant construct (Supplementary Fig. S8B–F). These findings suggest that ERK-dependent PPAR-α Ser12 phosphorylation contributes to the maintenance of fatty acid metabolic homeostasis under HS/R conditions.
Increased PP2A activity contributes to ERK–PPAR-α suppression in NRI
The observed reduction in ERK and PPAR-α phosphorylation in NRI prompted further investigation into the underlying mechanisms. Transcriptome sequencing analyses showed increased PP2A catalytic subunit β isoform (PPP2CB) expression in mouse kidney tissues following NSS (Fig. 6A). Single-cell RNA sequencing showed higher expression of both Ppp2ca and Ppp2cb in PTCs from NRI kidneys than in Sham or I/R kidneys (Fig. 6B, C). Consistently, western blotting and qRT-PCR showed increased PPP2CB expression in mouse kidneys after NSS (Fig. 6D; Supplementary Fig. S9A, B). A similar early increase in PPP2CB expression was also observed in HS/R-treated HK2 cells, beginning at 5 min after reoxygenation (Fig. 6E; Supplementary Fig. S9C, D). Serine/threonine phosphatase assays showed that PP2A activity was significantly elevated in kidney tissues at 3 h after NSS and in HK2 cells at 15 min after HS/R (Fig. 6F). In paired kidney tissues from patients undergoing NSS, collected before ischemia and after reperfusion, immunohistochemical staining showed increased PPP2CB expression after reperfusion, and PP2A activity was also elevated (Fig. 6G; Supplementary Fig. S9E, F). Notably, PP2A activity was positively correlated with postoperative day 1 Scr (R = 0.69, p = 0.0014) and BUN levels (R = 0.6, p = 0.0087; Supplementary Fig. S9G, H), supporting a potential association between activation of this pathway and the severity of postoperative renal dysfunction.

We next performed shRNA-mediated PPP2CB knockdown in HK2 cells to assess its functional role, which resulted in reduced PP2A activity (Supplementary Fig. S10A–D). Under HS/R conditions, PPP2CB knockdown increased p-ERK and pSer12-PPAR-α levels and partially restored the expression of FAO-related genes (Supplementary Fig. S10E–M), indicating that PPP2CB contributes to suppression of ERK–PPAR-α signaling during injury. We then examined the interaction between PPP2CB and MAPK1. Immunofluorescence staining showed enhanced colocalization of PPP2CB and MAPK1 in injured renal tubules (Fig. 6H). Surface plasmon resonance analysis further supported binding between the two proteins (Fig. 6I). AlphaFold3 modeling predicted 11 potential interface residues (Fig. 6J; Supplementary Table S3). Coimmunoprecipitation showed that a Y218F point mutation in PPP2CB (PPP2CB-Mut) reduced interaction with MAPK1 (Fig. 6K). To assess the functional relevance of this interaction, we performed rescue experiments in HS/R-treated PPP2CB-knockdown HK2 cells. Reexpression of wild-type PPP2CB (PPP2CB-WT) reversed the increases in p-ERK and pSer12-PPAR-α induced by PPP2CB knockdown (Fig. 6L). In addition, ERK knockdown (si-MAPK1) abolished the restoration of pSer12-PPAR-α observed after PPP2CB knockdown (Supplementary Fig. S10N). Together, these findings reveal that PPP2CB is upregulated during NRI, directly interacts with ERK, and is associated with reduced ERK phosphorylation and downstream suppression of PPAR-α signaling.
PPP2CB knockdown restores PPAR-α/PGC-1α signaling and metabolic function
PPAR-α transcriptional activity is dynamically influenced by coactivators and corepressors (Fig. 7A). To investigate this regulation during NRI, we measured the nucleoprotein levels of the coactivator PGC-1α and the corepressor nuclear receptor corepressor 1 (NCoR1). In mouse kidney tissues, nuclear PGC-1α protein levels decreased significantly at 6 h after NSS, whereas NCoR1 remained unchanged (Fig. 7B–D). A similar rapid decrease in nuclear PGC-1α was observed in HS/R-treated HK2 cells as early as 15 min postreoxygenation (Fig. 7E, F).
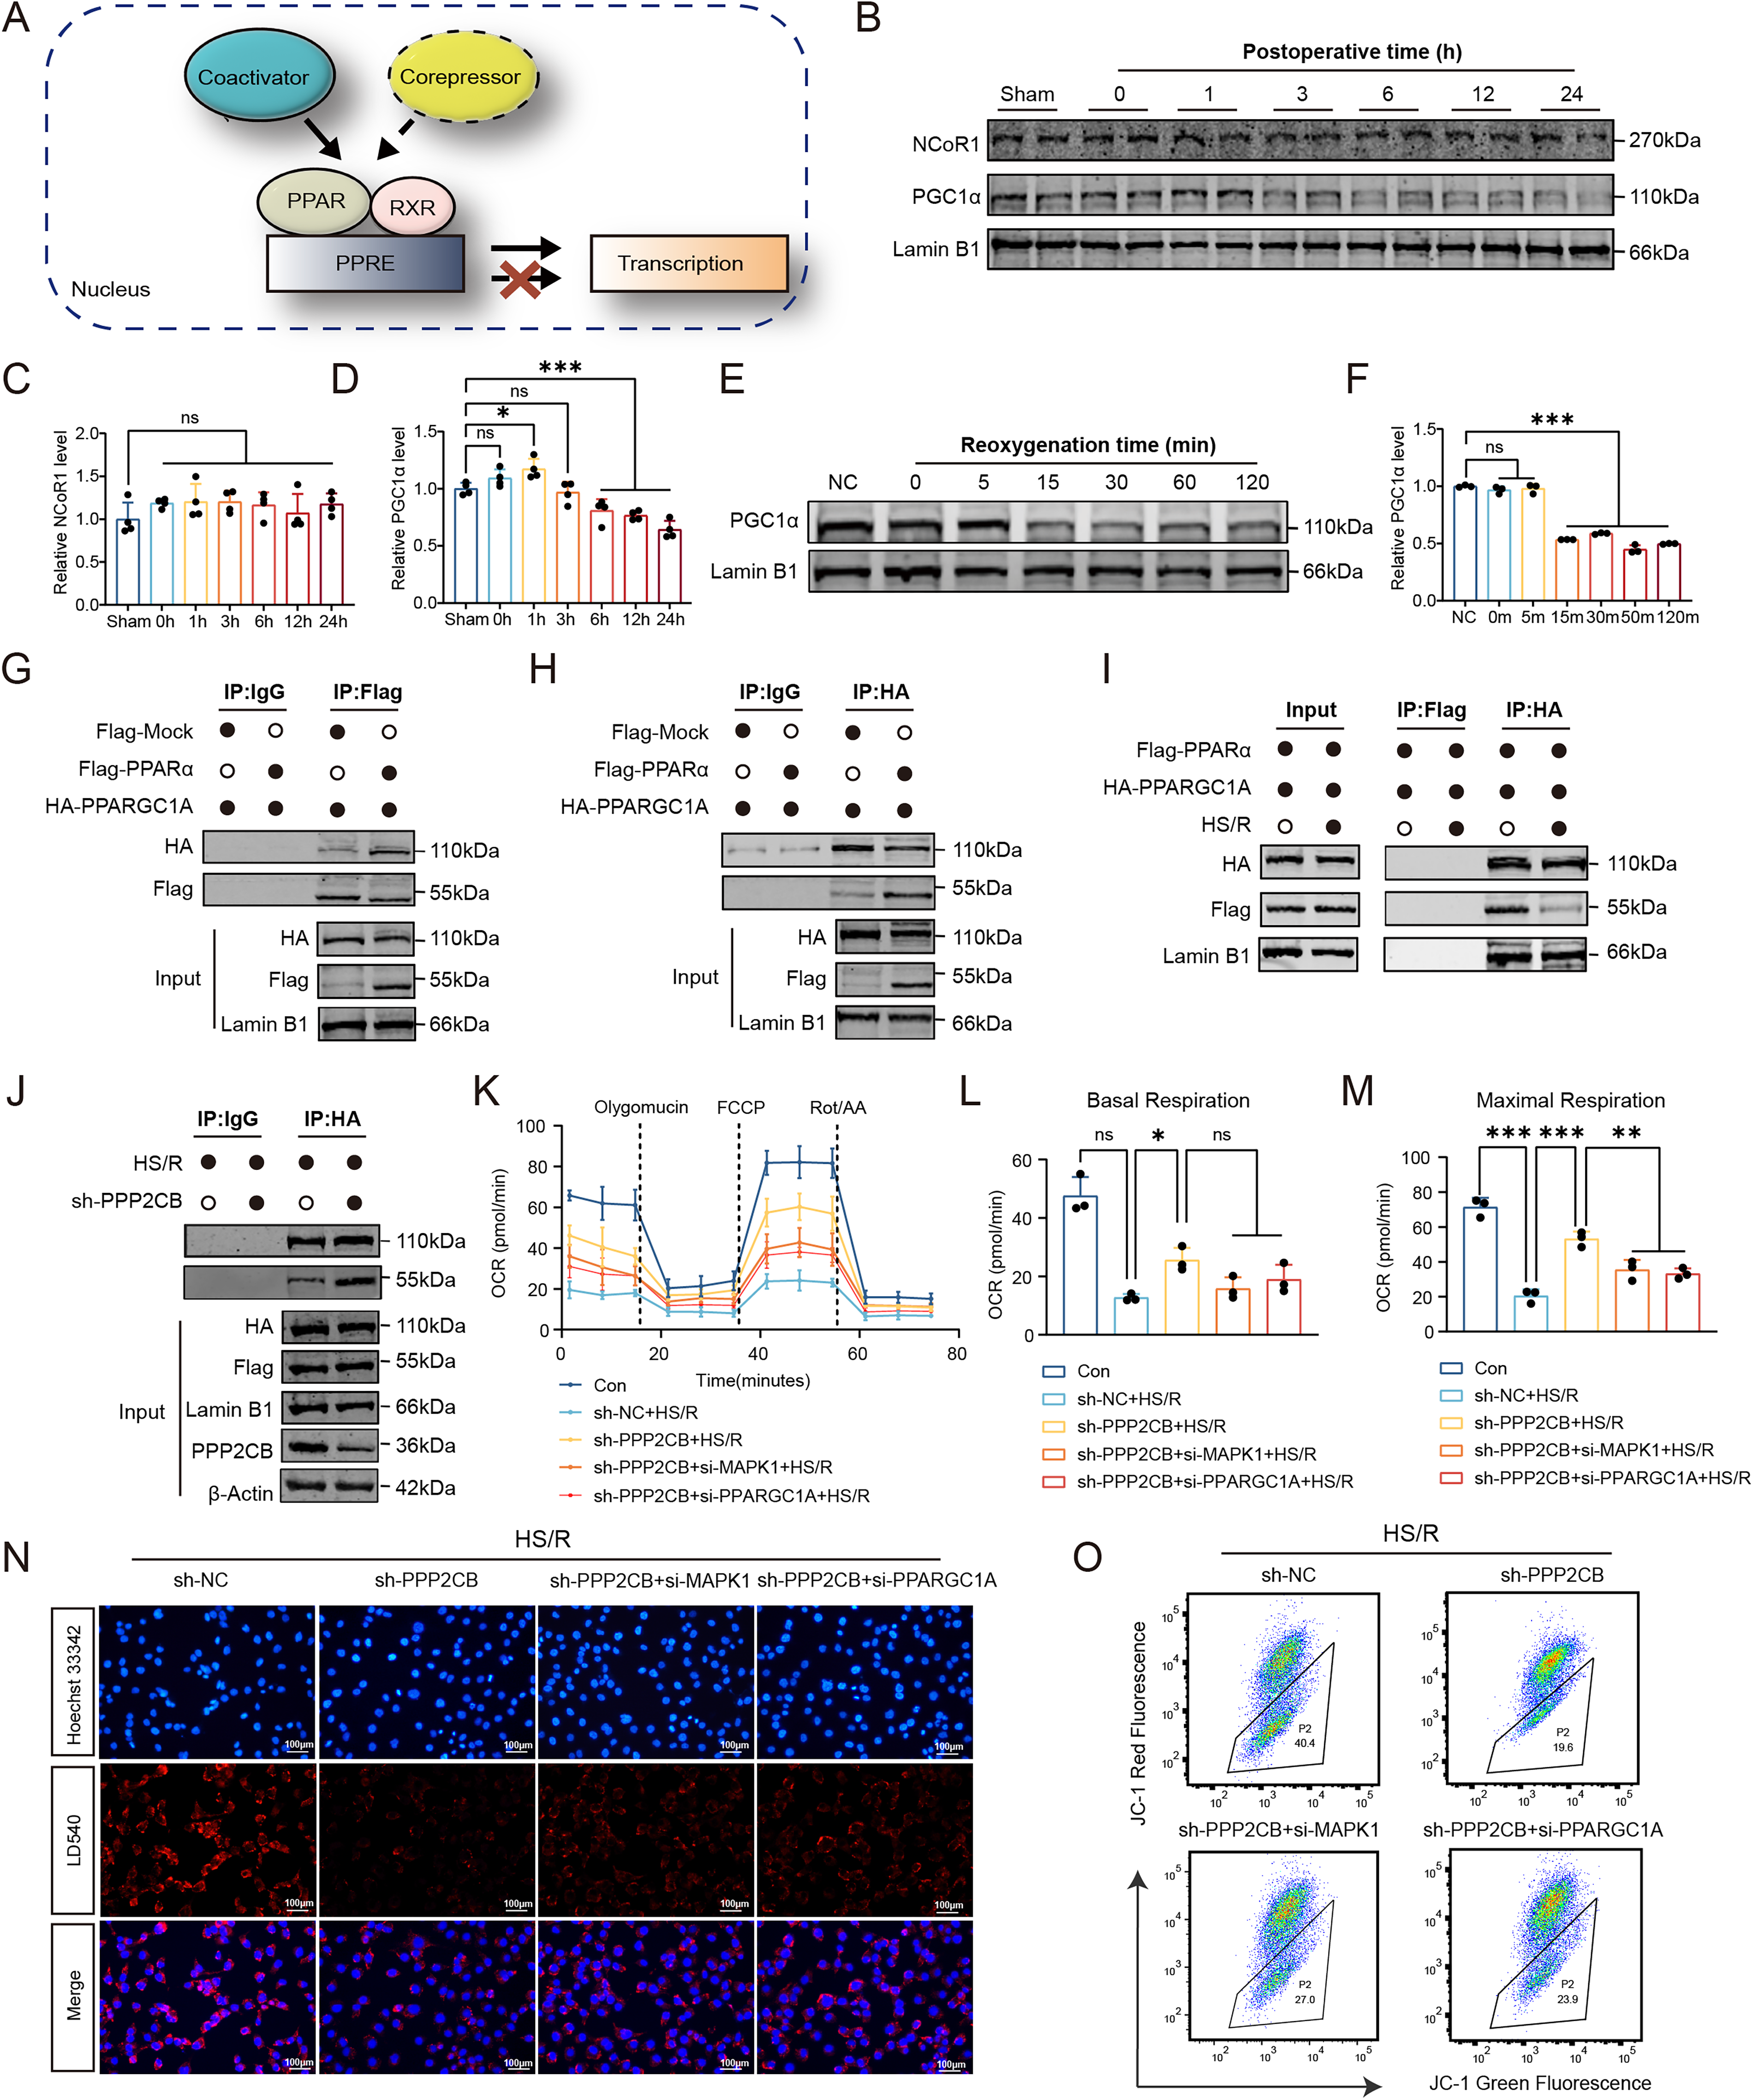
We next examined the interaction between PPAR-α and PGC-1α by coimmunoprecipitation. In HK2 cells cotransfected with Flag-PPARA and HA-PPARGC1A, immunoprecipitation with anti-Flag pulled down PGC-1α, and reciprocal immunoprecipitation with anti-HA pulled down PPAR-α, confirming interaction of the two proteins (Fig. 7G, H). Under HS/R conditions, the PPAR-α/PGC-1α interaction was significantly reduced (Fig. 7I). Notably, PPP2CB knockdown partially restored this impaired interaction (Fig. 7J). To further assess the functional relevance of this mechanism, we knocked down PGC-1α expression using si-PPARGC1A and evaluated PPAR-α transcriptional activity (Supplementary Fig. S11A). Dual-luciferase reporter assays showed that HS/R significantly reduced PPRE reporter activity. This reduction was partially rescued by PPP2CB knockdown, whereas the rescue effect was attenuated by cotransfection with either si-PPARGC1A or si-MAPK1 (Supplementary Fig. S11B).
We next examined whether these signaling changes were accompanied by metabolic improvement. Seahorse analysis showed that PPP2CB knockdown attenuated HS/R-induced mitochondrial respiratory impairment, as reflected by improved basal and maximal OCRs (Fig. 7K–M). Consistent with this, PPP2CB knockdown also reduced intracellular lipid droplet accumulation under HS/R conditions, and this protective effect was attenuated by concurrent knockdown of either MAPK1 or PPARGC1A (Fig. 7N; Supplementary Fig. S11C). In addition, PPP2CB knockdown alleviated the HS/R-induced loss of mitochondrial membrane potential and reduced intracellular ROS levels, whereas these protective effects were weakened by MAPK1 or PPARGC1A silencing (Fig. 7O; Supplementary Fig. S11D, E).
To further assess the relevance of this pathway in a more physiologically relevant cell system, we performed validation experiments in primary human RPTEC. Following HS/R injury, RPTEC exhibited molecular changes similar to those observed in HK2 cells, including increased PPP2CB expression, reduced p-ERK and pSer12-PPAR-α levels, and decreased nuclear PGC-1α abundance (Supplementary Fig. S11F–J). Collectively, these findings support a role for PPP2CB in regulating PPAR-α/PGC-1α-dependent metabolic homeostasis during NRI.
Tubular PPP2CB knockdown improves metabolic and mitochondrial homeostasis
To further assess the functional role of PPP2CB in vivo, we performed tubular-specific knockdown using an AAV9 vector (AAV9-shPPP2CB) delivered by subcapsular injection, with AAV9-shScramble (AAV9-shScr) as the control. Three weeks after vector administration, mice were subjected to NSS. AAV9-shPPP2CB effectively reduced PPP2CB protein expression in the renal cortex and was accompanied by decreased PP2A enzymatic activity (Fig. 8A–F).

We next evaluated the effect of PPP2CB knockdown on renal injury severity. Kidney morphological section assessment showed that the necrotic area was significantly reduced in kidneys from the PPP2CB knockdown group after NSS (Fig. 8G, I). Oil Red O staining demonstrated reduced lipid accumulation in AAV9-shPPP2CB-treated kidneys compared with controls (Fig. 8H, J). We then examined mitochondrial structural and functional changes. TEM showed that the severe mitochondrial abnormalities observed after NSS in control kidneys, including fragmentation and structural disruption, were partially alleviated by PPP2CB knockdown (Fig. 8H, K). Consistent with this, DHE staining demonstrated reduced ROS levels in the knockdown group (Fig. 8H, L). Colocalization analysis of TOMM20 and LC3 further showed that the increase in mitophagy observed after NSS was attenuated in PPP2CB-deficient kidneys (Fig. 8H, M). In addition, PPP2CB knockdown mitigated the NSS-induced reduction in mitochondrial DNA copy number and partially restored ATP production (Fig. 8N, O). We also measured circulating inflammatory cytokines after NSS. Serum levels of TNF-α, IL-1β, and IL-6 were all significantly lower in PPP2CB knockdown mice than in control mice after NSS (Fig. 8P–R). Together, these findings indicate that tubular PPP2CB knockdown alleviates NRI in vivo by improving mitochondrial and metabolic homeostasis and reducing oxidative and inflammatory injury.
Comparative evaluation of PP2A–ERK–PPAR-α Axis-Targeted interventions in NRI
We next compared the effects of four interventions on NRI, including AAV9-shPPP2CB, the PP2A inhibitor LB-100 (10 mg/kg), the PPAR-α agonist fenofibrate (10 mg/kg), and the ERK agonist raxofelast (5 mg/kg). Pharmacological agents were administered via tail vein injection at day −1, 0 h, and 12 h relative to surgery (Fig. 9A).

Among them, AAV9-shPPP2CB showed the strongest overall protective trend in renal function, as reflected by Scr and BUN levels (Fig. 9B, C). All intervention groups showed significantly less body weight loss than the control group (Fig. 9E). Histopathological examination by H&E staining showed that these functional improvements were accompanied by attenuation of renal tissue injury (Fig. 9D, F). Immunohistochemical staining further demonstrated that AAV9-shPPP2CB was associated with a more marked reduction in tubular injury and NGAL expression than the pharmacological treatment groups (Fig. 9D, G). Consistent with this, AAV9-shPPP2CB treatment also reduced the number of TUNEL-positive apoptotic cells (Fig. 9D, H). Measurement of renal ATP levels further showed that AAV9-shPPP2CB led to the most evident recovery of tissue bioenergetic status among the tested interventions (Fig. 9I). To assess long-term protection, we performed Masson staining at POD30 to evaluate renal fibrosis. Compared with the control group, AAV9-shPPP2CB as well as the three pharmacological interventions all reduced collagen deposition and attenuated renal fibrosis after NRI (Fig. 9D, J). Taken together, these findings support therapeutic targeting of the PP2A–ERK–PPAR-α/PGC-1α axis as a strategy for attenuating acute injury and subsequent fibrotic remodeling after NRI.
Discussion
Our data indicate that proximal tubular metabolic dysfunction is a central feature of NRI. In both clinical and experimental settings, prolonged ischemic stress during NSS was associated with more severe renal injury, oxidative stress, lipid accumulation, and mitochondrial damage. These findings support the concept that NRI arises from the combined effects of ischemic, mechanical, and inflammatory stress during surgery, with metabolically vulnerable proximal tubular cells representing a major target of injury.
Our model comparisons suggest that the NSS-10 min protocol provides a useful experimental model for studying early injury and later remodeling after NSS. This model induced significant acute renal injury while maintaining a favorable survival rate, and it was accompanied by progressive renal fibrosis after injury. For in vitro studies, the HS/R model was used to combine hypoxic stress with scratch-induced epithelial disruption. Scratch injury is not intended to reproduce surgical resection itself; rather, it adds an acute epithelial injury component to H/R. This approach is consistent with scratch-based injury systems used in other fields to model acute mechanical cell damage and stress responses (Liu et al., 2023; Wang et al., 2024; Zhang et al., 2024). The stronger transcriptional overlap between HS/R and in vivo NRI supports its use as a practical model for mechanistic studies, although it cannot fully reproduce the vascular, immune, and hemodynamic features of surgery.
Our multiomics and single-cell analyses point to suppression of proximal tubular lipid metabolic programs during NRI. Single-cell analyses identified distinct proximal tubular cell states along a trajectory from healthy to failed-repair phenotypes (Kirita et al., 2020; Lu et al., 2021; Shan et al., 2023). Injured PTCs exhibited marked suppression of lipid metabolism pathways, including PPAR signaling and fatty acid β-oxidation, as well as mitochondrial homeostasis pathways, alongside upregulation of inflammatory mediators, consistent with a metabolic-inflammatory vicious cycle in AKI (Melo Ferreira et al., 2021). Further analysis showed that the HS/R model mirrored these findings in vitro, including lipid droplet accumulation and PPAR-α inactivation. These findings align with clinical studies linking lipotoxicity to tubular injury and highlight the utility of scRNA-seq in dissecting injury-specific cellular heterogeneity (Mitrofanova et al., 2023; Polonsky et al., 2024). By integrating multiomics data, our study provides a strategy for targeting metabolic recovery in PTCs to mitigate NRI and further underscores the value of scRNA-seq in resolving injury-associated cellular heterogeneity.
Our findings suggest that reduced PPAR-α activity is associated with early metabolic dysfunction in NRI. PPAR-α, a nuclear receptor central to lipid metabolism and mitochondrial function, emerged as an important mediator in NRI (Montaigne et al., 2021). Rather than implying a single linear mechanism, these findings suggest that impaired PPAR-α activity is closely associated with the metabolic phenotype observed in injured tubular cells. This suppression of PPAR-α activity was accompanied by lipotoxicity and mitochondrial dysfunction, consistent with clinical observations of metabolic failure in patients undergoing complex renal surgeries. Mechanistically, the link between surgical stress and PPAR-α dysfunction involved the PP2A–ERK signaling axis. In our models, PPP2CB upregulation was associated with ERK dephosphorylation and subsequent impairment of PPAR-α phosphorylation at Ser12. This posttranslational modification appears to be important for PPAR-α interaction with the coactivator PGC-1α, which is required for maintaining FAO and mitochondrial homeostasis (Haemmerle et al., 2011). Previous studies on partial nephrectomy reported increased ERK phosphorylation associated with compensatory hypertrophy and tissue repair, a response consistent with subacute stress that permits adaptive cellular reprogramming (Verkaik et al., 2018; Zhou et al., 2012). In our study, NRI was associated with reduced ERK phosphorylation and increased PP2A activity, a combination that was linked to impaired metabolic signaling. This difference from reports of ERK activation after partial nephrectomy may reflect differences in injury pattern and timing: Adaptive ERK activation may occur during reparative or compensatory responses, whereas the acute combined stress of NRI may favor PP2A-associated suppression of ERK–PPAR-α signaling.
Our findings support the PP2A–ERK–PPAR-α/PGC-1α axis as an important metabolic signaling pathway in NRI, but this axis likely functions within a broader stress-response network. Transcriptomic and scRNA-seq analyses suggested that injured PTCs undergo widespread metabolic remodeling, including pathways related to AMPK, mTOR, and SIRT1 signaling. AMPK activation can promote FAO and mitochondrial biogenesis in coordination with PPAR-α and PGC-1α, suggesting that the metabolic suppression observed in NRI may involve parallel or interacting defects in AMPK signaling (Wu et al., 2021; Zhang et al., 2025). mTOR, a key regulator of cell growth, autophagy, and energy balance, may also participate in tubular stress responses after ischemic and mechanical injury (Wang et al., 2021). In addition, NAD+ depletion during oxidative stress may impair SIRT1 activity and thereby reduce PGC-1α/PPAR-α function independently of ERK-mediated phosphorylation (Liao et al., 2024). Future studies should determine how these pathways interact with PP2A–ERK–PPAR-α/PGC-1α signaling during NRI.
As noted earlier, WIT remains an important determinant of NRI, prompting efforts to develop ischemia-avoidance techniques such as OC-NSS (Anceschi et al., 2021; Simone et al., 2015). OC-NSS eliminates WIT because resection is performed without renal artery clamping, thereby minimizing ischemia, vascular injury, and operative duration (Guillonneau et al., 2003). With expansion from cT1a to more complex cT1b–T2 tumors, OC-NSS has shown clinical benefit in reducing AKI incidence and delaying chronic kidney disease (CKD) progression, particularly in high-risk cohorts such as those with a solitary kidney and preexisting renal insufficiency (Anderson et al., 2019; Libertino, 2012). Our data are consistent with these findings: OC-NSS significantly attenuated lipotoxicity, tubular injury, and functional decline in murine models without increasing mortality, underscoring its translational relevance for patients with comorbidities such as obesity, diabetes, and hypertension. However, for cases requiring clamped procedures, therapeutic targeting of molecular drivers of NRI becomes especially important. In our study, PPP2CB emerged as an important mediator of PPAR-α dephosphorylation and metabolic dysfunction in NRI. Pharmacologic PP2A inhibition (LB-100) or genetic PPP2CB knockdown restored PPAR-α activity and lipid metabolism, with AAV9-shPPP2CB showing the early efficacy in improving renal function and histopathology within POD1, suggesting that PPP2CB may influence acute injury cascades beyond PPAR-α regulation alone. These findings support PPP2CB as a potential therapeutic target and also provide mechanistic rationale for considering PPAR-α agonists in clamped NSS. By linking surgical innovation with molecular intervention, this dual strategy addresses both ischemia-dependent and ischemia-independent components of injury and provides a framework for improving renal protection.
Although our findings support a role for the PP2A–ERK–PPAR-α/PGC-1α axis in NRI, several limitations remain. First, mouse NSS and HS/R models cannot fully reproduce the anatomical, vascular, immune, and perioperative complexity of human surgery; validation in larger animal models and independent clinical cohorts will be needed. Second, PP2A has multiple substrates and regulatory subunits, and future studies should define which PP2A holoenzyme complexes are most relevant in injured tubular cells. Third, the therapeutic studies focused mainly on early intervention, and the optimal timing, dose, delivery route, and safety of PP2A-targeted approaches remain to be established. Fourth, although renal fibrosis was assessed after injury, longer follow-up is needed to determine whether targeting this pathway provides sustained protection against chronic decline in kidney function.
Materials and Methods
Clinical information
Clinical data were retrospectively collected from patients who underwent NSS at our center between January 2022 and December 2023. Baseline characteristics included age, sex, body mass index, and tumor size. Tumor complexity and selection bias were assessed using the RENAL nephrometry score. Preoperative laboratory variables included Scr, estimated glomerular filtration rate calculated using the CKD-EPI equation, and hemoglobin. Perioperative parameters included operative time, estimated blood loss, WIT, and length of hospital stay.
AKI was defined according to KDIGO criteria within 7 postoperative days: an increase in Scr ≥ 26.5 μmol/L within 48 h, an increase in Scr to ≥1.5 times baseline within 7 days, or urine output < 0.5 mL/kg/h for ≥ 6 h. Scr and urine output were recorded daily, and AKI onset was defined as the first day on which any criterion was met. All surgeries were performed by the same surgeon.
Paired renal tissues were obtained from patients undergoing NSS at two time points: before ischemia and after tumor resection with 30–60 min ischemia followed by 1–2 h reperfusion. Samples were snap-frozen in liquid nitrogen or fixed in paraformaldehyde. Written informed consent was obtained from all participants and their family members. Clinical data are summarized in Supplementary Table S4.
Animals and NSS-related injury model
C57BL/6J male mice (6–8 weeks old, 23–25 g) were purchased from Changsheng Biotechnology Co., Ltd. (Liaoning, China). Mice were maintained under specific pathogen-free conditions with a 12-h light/dark cycle, 45%–65% humidity, and an ambient temperature of 20°C–24°C, with 10 animals per ventilated cage on wood-shaving bedding. All procedures were performed in the Laboratory Animal Facility of the First Affiliated Hospital of Harbin Medical University.
Five groups were established (n = 10 per group): Sham, OC-NSS, I/R, NSS-10 min, and NSS-30 min. Anesthesia was induced by intraperitoneal avertin (2.5% tribromoethanol, 0.2 mL/10 g body weight; Aibei Biotechnology, Nanjing, China) and verified by loss of pedal and corneal reflexes. Body temperature was maintained at 37°C ± 0.5°C using a warming pad and monitored rectally. Meloxicam (5 mg/kg) was administered every 24 h for 48 h postoperatively. Mice were euthanized by CO2 inhalation at the experimental endpoint.
For NSS, a 0.5-cm dorsal incision was made below the rib margin to expose both kidneys. Renal pedicles were isolated and clamped with 16-mm microvascular clamps (RWD Life Science). One kidney was removed after pedicle ligation with absorbable sutures and clamp release. After confirming hemostasis, the upper one-third of the contralateral kidney was resected in an arc-shaped manner, and bleeding was controlled with absorbable hemostatic gauze and electrosurgical unit. Clamps were released after 10 or 30 min of ischemia in the NSS-10 min and NSS-30 min groups, respectively. As 10 min ischemia was sufficient to induce significant AKI, all subsequent NRI models were generated using the 10-min protocol. In the OC-NSS group, unilateral nephrectomy was followed by resection of the upper one-third of the contralateral kidney without pedicle clamping. In the I/R group, unilateral nephrectomy was followed by 10 min clamping of the contralateral renal pedicle without resection. In the Sham group, kidneys and pedicles were exposed only.
Renal function and histopathology
Blood samples were collected from the fundus venous plexus and centrifuged at room temperature to isolate serum. Scr and BUN were measured using commercial kits (Jiancheng Bioengineering Institute, Nanjing, China) according to the manufacturer’s instructions.
For histopathological analysis, kidney tissues were fixed in paraformaldehyde, paraffin-embedded, sectioned at 4 μm, and stained with H&E or Masson’s trichrome. H&E staining was used to assess tubular injury and interstitial inflammation. Renal injury was scored semi-quantitatively based on the percentage of affected area as follows: 0, normal; 1, <25%; 2, 25%–50%; 3, 50%–75%; and 4, >75%. Masson’s trichrome staining was used to evaluate renal fibrosis, which was quantified using ImageJ as the percentage of collagen-positive area relative to total tissue area, expressed as collagen volume fraction.
Immunohistochemical staining
Paraffin-embedded kidney sections were deparaffinized, followed by antigen retrieval in 0.1 mM Tris-EDTA buffer (pH 9.0) at 100°C for 15 min. After cooling to room temperature, sections were treated with 0.3% hydrogen peroxide for 10 min to block endogenous peroxidase activity and then incubated with 5% bovine serum albumin (BSA) and 0.1% Triton X-100 to reduce nonspecific binding. The slides were sequentially incubated with primary antibody for 1 h and HRP-conjugated secondary antibody for 1 h at room temperature. Staining was developed using 3,3′-diaminobenzidine reaction buffer (Service Bio, China) according to the manufacturer’s instructions, and nuclei were counterstained with hematoxylin.
Renal ultrasonography
Anesthesia was induced by intraperitoneal injection of avertin (0.2 mL per 10 g body weight). Each animal was placed supine, and abdominal fur was gently removed for clear transducer contact. Ultrasound transmission gel was applied for optimal acoustic coupling. Images were acquired using a commercial ultrasound system (VINNOD860LAB, Suzhou, China) with a compact linear-array intraoperative probe operating at 20–25 MHz. All scans used a consistent imaging depth of 1.5 cm and uniform gain settings to ensure comparability and enable quantitative analysis. Kidney dimensions (length, width, and height) were measured, and renal volume was calculated using the prolate ellipsoid formula: volume = (length × width × height) × π/6.
TUNEL assay
TUNEL assay was performed using an in situ cell death detection kit following the manufacturer’s protocol. Slides were deparaffinized, incubated with proteinase K (20 mg/mL) for 15 min at room temperature, and then with TUNEL reaction mixture for 1 h at room temperature in a humidified dark chamber. Nuclei were counterstained with Hoechst.
Oil Red O staining
Oil Red O was dissolved in isopropanol (stock solution, 50 mg/mL). The working solution was prepared by mixing 30 mL of stock stain with 20 mL of distilled water. Frozen kidney sections (8 μm) were stained with the working solution for 20 min at room temperature, rinsed in running water for 5 min, counterstained with hematoxylin, rinsed again, and mounted with water-based mounting medium.
Transmission electron microscopy
Kidney tissues were fixed in paraformaldehyde and glutaraldehyde (Sigma-Aldrich, 340855), postfixed in osmium tetroxide, dehydrated in ethanol, and embedded in Pon 812R (SPI, 90529-77-4). After polymerization, blocks were sectioned at 60–80 nm using a microtome. Sections were sequentially stained with uranyl acetate and lead citrate and then examined for proximal tubules under a transmission electron microscope (HITACHI, HT7800). Digital images with scale bars were acquired, and individual mitochondrial lengths were measured using NIH ImageJ software.
Immunofluorescence
Immunofluorescence was performed on 4-μm paraffin-embedded kidney sections or cultured cells. For sections: deparaffinization, rehydration, and antigen retrieval (sodium citrate buffer, pH 6.0, or Tris-EDTA buffer, pH 9.0, 95°C–100°C for 20 min). For cells: fixation in 4% paraformaldehyde and permeabilization with 0.1% Triton X-100. Nonspecific binding was blocked (2% BSA, 0.2% non-fat milk, 2% normal donkey serum, 0.8% Triton X-100, 1 h at room temperature). Samples were incubated with primary antibodies overnight at 4°C, followed by species-matched Alexa Fluor-conjugated secondary antibodies (1 h at room temperature). Nuclei were counterstained with DAPI, and slides were mounted with ProLong™ Diamond Antifade Mountant. Images were acquired using a fluorescence microscope (LSM800; Carl Zeiss AG) and analyzed with ImageJ.
Multiomic sequencing
Total RNA was extracted from mouse kidney cortex and sequenced on Illumina NovaSeq 6000 (Genedenovo, China). Libraries were prepared per manufacturer’s protocol. DEGs were identified using DESeq2 (|log2 FC|≥1, adjusted p < 0.05), and KEGG enrichment was performed with clusterProfiler.
For metabolomics, tissue samples were analyzed by UHPLC-MS/MS (Vanquish UHPLC & Orbitrap Q Exactive™ HF-X, Thermo Fisher). Metabolites were extracted with methanol:acetonitrile:water. QC samples were run regularly. Metabolites were identified by matching m/z and MS/MS spectra against human metabolome database (HMDB) and mzCloud (mass tolerance 10 ppm). Raw data were processed using R (v4.5.2) and Python (v3.12) for peak picking, alignment, and integration. Data were normalized by total ion intensity and QC-based drift correction, followed by Pareto scaling. Relative quantification used normalized peak areas.
Single-cell RNA sequencing and cell annotation
scRNA-seq libraries were constructed with SeekOne® MM Single Cell 3′ Library Kit (SeekGene). Raw data were processed with CellRanger (v3.0) aligned to mm10. Low-quality cells (<200 genes or >30% mitochondrial content) were removed. Data integration and batch correction used scVI. Top 2000 highly variable genes were selected for low-dimensional latent space, followed by Leiden clustering and UMAP visualization via Scanpy. Subclustering and manual annotation were based on marker genes.
Pseudotime and pathway activity analyses
Pseudotime trajectory analysis was performed using Monocle2, ordering cells with principal components from PTC time-course data. Branch-dependent genes were identified by branched expression analysis modeling and annotated via KEGG. Single-cell pathway activity scores were calculated with AUCell and visualized on UMAP using ggplot2 (v3.5.0).
Cell culture and combined HS/R model
HK2 and RPTEC (CP-H193; Procell, China) were cultured at 37°C in 5% CO2. HK2 cells were maintained in DMEM (Gibco) supplemented with 10% FBS (VivaCell, C04001-500) and penicillin/streptomycin. RPTEC cells were cultured in specialized medium (Procell, CM-H193). Medium was changed every other day, and cells were passaged using 0.25% trypsin-EDTA upon reaching ∼90% confluence.
Mouse renal tubular epithelial cells were isolated as follows: mice were euthanized by cervical dislocation, disinfected in 75% ethanol for 5–10 min, and the kidneys were aseptically removed. After decapsulation and removal of hilar tissue, the cortex was separated from medulla, minced, and mixed with low-glucose DMEM (DF-12) and then centrifuged at 300 g for 5 min. The pellet was digested in 8 mL of 1 mg/mL collagenase II (Worthington) in DF-12 at 37°C for 20 min on a rotator. The suspension was filtered through 70 and 40 μm sieves, and digestion was terminated by adding an equal volume of prewarmed complete medium (DF-12 + 10% FBS). After centrifugation at 150g for 10 min, cells were resuspended in prewarmed DMEM/F-12, seeded into 25 cm2 flasks, and incubated at 37°C, 5% CO2 without disturbance for the first 12 h. The medium was first changed at 48 h, then every other day.
For the scratch-only (SCT) model, cells in 6-well plates (3.5 cm diameter) were placed in a laminar flow hood. Two vertical and two horizontal scratches were made per well using a sterile 1000 μL pipette tip, with 1 cm spacing between scratches. For the H/R model, cells were exposed to hypoxia (94% N2, 5% CO2, 1%O2) in serum-free medium for 6 h, followed by 12 h reoxygenation in normal culture conditions. The combined HS/R injury model consisted of SCT followed immediately by the same H/R regimen. Serum-free medium was used only during the hypoxic phase in both H/R and HS/R models.
Cell growth assay
HK2 cells were seeded into 96-well plates at 3 × 10³ cells/well in 100 μL DMEM with 10% FBS and cultured overnight at 37°C in 5% CO2. Cell proliferation was assessed starting 24 h postseeding using the CCK-8 Assay Kit (C6005, New Cell & Molecular Biotech). Briefly, 10 μL of CCK-8 reagent was added per well, followed by incubation at 37°C for 2 h, and absorbance at 450 nm was measured with a microplate reader (ELx800, BioTek).
Mitochondrial respiratory OCR detection
The mitochondrial OCR of HK2 cells was assessed using the Seahorse XF Cell Mito Stress Test Kit (Agilent). Briefly, cells were seeded into Seahorse XFe 24-well plates at a density of 2.0 × 10⁴ cells per well and cultured under normal conditions for 24 h to adhere. Following the injury treatments, the cell culture medium was replaced with the prewarmed Seahorse XF DMEM assay medium (supplemented with 10 mM glucose, 2 mM glutamine, and 1 mM sodium pyruvate) to commence the assay. The sensor cartridge, which had been hydrated overnight and loaded with mitochondrial modulators (port A, 1.5 μM oligomycin; port B, 2 μM FCCP; port C, 0.5 μM rotenone/antimycin A), was then calibrated. Real-time OCR measurements were conducted using a Seahorse XFe 24 Analyzer, and data were exported to GraphPad Prism and Excel for further statistical analysis and graphing.
Determination of ROS
For cellular ROS, HK2 cells were collected after the indicated treatments and incubated with 10 μM DCFH-DA (Beyotime) at 37°C for 20 min. The fluorescence intensity of DCF was measured using a flow cytometer.
For histological detection of ROS, unfixed frozen kidney sections (10 μm thickness) were incubated with 10 μM DHE (MCE) in a dark, humidified chamber at 37°C for 30 min. Nuclei were counterstained with Hoechst 33342. After mounting with an antifade reagent, fluorescence images were captured using a PerkinElmer imaging system.
Western blotting and immunoprecipitation analysis
Kidney tissues or cells were lysed in RIPA buffer (Beyotime) supplemented with PMSF. Lysates were centrifuged at 12,000g for 15 min, and supernatants were separated by SDS-PAGE, transferred to PVDF membranes (Millipore), and blocked with 5% skim milk. The primary antibodies used in this study are listed in Supplementary Table S5. After primary antibody incubation, membranes were washed with TBST (0.1% Tween-20) and incubated with IRDye 800CW-conjugated secondary antibodies (LI-COR, 1:10,000) for 1.5 h at room temperature. Signals were visualized using an Odyssey® Imaging System and analyzed with Image Studio software (LI-COR).
For immunoprecipitation (IP), cells were lysed with IP lysis buffer. Primary antibodies were coupled with protein A/G beads (Beyotime, P2108), and the immune complex was added to the cell lysates and incubated at 4°C overnight. The beads were washed, and the immune complexes were suspended in loading buffer and denatured at 100°C. The immunoprecipitated proteins were resolved via SDS-PAGE and analyzed using Western blotting as described above. An isotype-specific immunoglobulin G was applied as a negative control.
Real-time qPCR
Total RNA was extracted from kidney tissues or cells using TRIzol reagent (Invitrogen; Thermo Fisher Scientific, Inc.), following the manufacturer’s instructions. Complementary DNA synthesized from the total RNA was amplified using the PrimeScript RT Reagent Kit (Takara Bio, Inc.). For qRT-PCR, FastStart Universal SYBR Green Master Mix (Roche Applied Science) was utilized along with gene-specific primers, with β-Actin serving as an internal control. Relative gene expression was quantified using the comparative CT method. The sequences of the qPCR primers used are provided in Supplementary Table S6.
Protein and protein interaction
Protein sequences for PPP2CB (UniProt accession: P62714) and MAPK1 (UniProt accession: P28482) were acquired from the UniProt repository. AlphaFold3 was employed for protein–protein docking simulations, and interaction interfaces were subsequently examined and depicted using PyMOL software (version 2.5.2).
Mitochondrial membrane potential determination and adenosine triphosphate content analysis
To assess mitochondrial quality in HK2 cells post-HS/R treatment, mitochondrial membrane potential was measured using the membrane potential-sensitive dye JC-1. Following HS/R treatment, HK2 cells were incubated with 1× JC-1 (Beyotime, C2003S) for 30 min at 37°C. The cells were directly examined using a flow cytometer (BD Biosciences, LSRFortessa, Franklin Lakes, NJ, USA). ATP content was measured based on luciferin-luciferase bioluminescence to assess mitochondrial quality (Beyotime, S0027). After treatment, tissues and cells were lysed with lysis buffer. Following centrifugation, the supernatant was used to determine ATP content as described by the manufacturer. For each measurement, a standard curve was constructed using ATP standard solutions and normalized to protein concentration (μM ATP/mg protein).
Lipid droplet fluorescence assay
The Lipid Droplet Red Fluorescence Assay Kit with LD540 (Beyotime, C2050M) was utilized to assess lipid accumulation in cells post-HS/R treatment. Cells designated for detection were washed 1–2 times with phosphate-buffered saline (PBS). After aspirating the PBS, LD540 staining solution was added to each well. The cells were incubated in the dark at room temperature for 10–20 min. Following the incubation period, the cells were washed twice with PBS and examined using a fluorescence microscope.
Cell transfection and dual-luciferase reporter assays
shRNAs targeting PPP2CB (sense: 5′-UUGACCUGAACUUCAUAGTT-3′) were designed and synthesized by GenePharma. Lentiviral particles were produced using a packaging kit (Yeasen), and stable cell lines were selected with puromycin (2 μg/mL) for 7 days starting 48 h posttransfection.
siRNAs targeting ERK (MAPK1/3), JNK (MAPK8/9), p38 (MAPK14), PGC-1α (PPARGC1A), and PPARA, along with scrambled controls, were obtained from Hycyte. Sense strand sequences: MAPK1, 5′-TGGAATTGGATGACTTGCCTA-3′; MAPK3, 5′-GCAGCTGAGCAATGACCATAT-3′; MAPK8, 5′-CGTCTGTCAATGACATGTCTT-3′; MAPK9, 5′-GATGTGTATTTGGTTATGGAA-3′; MAPK14, 5′-CCATGTTCAGTTCCTTATCTA-3′; PPARGC1A, 5′-CGACTTGGATACAGACAGCTT-3′; PPARA, 5′-GAACAGAAACAAATGCCAGTA-3′.
Overexpression plasmids (pcDNA3.1 backbone) included: wild-type PPP2CB-3 × Flag, mutant PPP2CB(Y218F)−3 × Flag, PPARGC1A-3 × HA, wild-type PPARA-3 × Flag, and mutant PPARA(S21A)−3 × Flag. Luciferase reporter plasmids (PPRE × 3-Luc, mutPPRE × 3-Luc) and normalization control pRL-TK were constructed and purchased from GenePharma.
Transfection of siRNAs or plasmids was performed using Lipofectamine 3000 (Thermo Fisher) per the manufacturer’s protocol. For luciferase assays, HK2 cells were seeded in 12-well plates (2 × 10⁵ cells/well) and cotransfected with PPRE × 3-Luc or mutPPRE × 3-Luc, pRL-TK, and other siRNAs or overexpression plasmids as required. After 24 h, cells were subjected to HS/R or control conditions. Luciferase activity was measured using the Dual-Luciferase® Reporter Assay System (Promega) on a luminescence plate reader (Molecular Devices). Firefly luciferase activity was normalized to Renilla luciferase activity.
Enzyme-linked immunosorbent assay
Concentrations of inflammatory cytokines were measured using commercial ELISA kits according to the manufacturers’ protocols. Mouse serum was obtained from whole blood by centrifugation for in vivo analyses. The following mouse cytokines were assayed: IL-6 (kit #BYHS500759), IL-1β (kit #BYHS500007), and TNF-α (kit #BYHS500006). Cell culture supernatants served as samples for in vitro assays. Human IL-6 (kit #BYGR500038), IL-1β (kit #BY-EH110351), and TNF-α (kit #BYHS500169) were quantified from these media. A microplate reader (Varioskan Flash, Thermo Fisher Scientific) recorded absorbance at 450 nm. Standard curves generated with the provided standards allowed calculation of cytokine concentrations for each kit.
PP2A activity assay
PP2A activity was measured in renal tissues and cultured cells using the Serine/Threonine Phosphatase Assay System (Promega, V2460, Madison, WI, USA) according to the manufacturer’s instructions. Briefly, tissue homogenates and cell lysates were processed using the provided Sephadex G-25 Spin Columns to eliminate endogenous free phosphate. The flow-through was collected, and the total protein concentration was determined using a BCA protein assay kit for normalization.
For the phosphatase reaction, equal amounts of protein from each sample were incubated with the provided phosphopeptide substrate (RRA(pT)VA). A standard curve of free phosphate was included for quantification. To confirm the specificity for PP2A, parallel reactions for control samples were performed in the presence of the PP2A-specific inhibitor, okadaic acid (50 nM). After a 30-min incubation at 30°C, the reaction was terminated by adding the molybdate dye/additive mixture. The released phosphate was quantified by detecting the absorbance of the molybdate–malachite green-phosphate complex at 630 nm using a microplate reader (ELx800, BioTek, USA). PP2A activity was calculated as the phosphate released per μg of protein per minute (pmol/μg/min).
Renal tubule-specific PPP2CB knockout mouse model
GenePharma generated AAV9-Ksp-shPpp2cb (hereafter “AAV-shPPP2CB”). The corresponding “empty” virus was created as a negative control (AAV9-Ksp-shScramble, hereafter “AAV9-shScr”). The viruses were injected using a 26G, 1 mL subcutaneous syringe to slowly administer the viral solution directly into the renal parenchyma through the renal subcapsular region. The injection was performed at 3–5 sites, delivered at each point (10–15 μL), resulting in a total injection dose of 0.5–1 × 10¹¹ viral genomes.
Statistical analysis
Statistical analyses were performed using R software (v4.5.2; R Foundation for Statistical Computing, Vienna, Austria), GraphPad Prism (v8.0.2; GraphPad Software Inc., San Diego, CA, USA), and SPSS (v25.0; SPSS Inc., Chicago, IL, USA). Continuous variables were presented as mean ± standard deviation, and categorical variables as number (percentage). Uni- and multivariable regression analyses were used to assess associations with AKI. Pearson correlation analysis was used to evaluate linear correlations between two variables. Differences between two groups were analyzed using Student’s t-test, and differences among multiple groups were analyzed by one-way analysis of variance followed by Tukey’s post hoc test. Histopathological scoring was performed in a blinded manner. Statistical significance was set at p < 0.05. Summary graphic illustration was created in BioRender.com (Academic License Terms, www.biorender.com). Electronic laboratory notebook was not used.
Authors’ Contributions
H.Z. and G.Z. conceptualized the study. H.Z., G.Z., and B.W. curated data. H.Z. and B.W. performed formal analysis. C.W. acquired funding. H.Z. and F.X. conducted investigation. H.Z., F.X., and X.J. developed methodology. H.Z. administered the project. H.Z., G.Z., and C.W. provided resources. H.Z. and G.Z. developed software. C.W. supervised the research. H.Z. and G.Z. performed validation. C.W. and G.Z. created visualizations. H.Z. wrote the original draft. C.W. reviewed and edited the article. All authors approved the final version.
Ethics Approval
The study comprised a retrospective clinical analysis and a prospective collection of human kidney specimens. The retrospective clinical component was approved by the Ethics Committee of the First Affiliated Hospital of Harbin Medical University (Approval No. 2024328), and the requirement for written informed consent was waived because of the retrospective study design. The prospective specimen collection component was approved by the same committee (Approval No. 202638), and written informed consent was obtained from all patients before sample collection. All human studies were conducted in accordance with the Declaration of Helsinki. Animal experiments were approved by the Animal Ethics Review Board of the First Affiliated Hospital of Harbin Medical University (Approval No. 2024034).
Data Availability
The RNA sequencing (RNA-seq) data from this study have been deposited in the National Center for Biotechnology Information Sequence Read Archive (NCBI SRA) under BioProject accession number PRJNA1234395 and the single-cell RNA sequencing (scRNA-seq) data are available under accession number PRJNA1235439. Metabolomic datasets are publicly accessible via Figshare (https://figshare.com/s/285b24109a0df0a319b1). Additional materials and analytical datasets can be obtained from the corresponding author upon reasonable request.
Footnotes
Acknowledgments
The authors sincerely thank all individuals and institutions whose contributions made this research possible.
Author Disclosure Statement
All the authors declared no competing interests.
Funding Information
This work was supported by the
Supplemental Material
Supplemental Material
Supplemental Material
Supplemental Material
Supplemental Material
Supplemental Material
Supplemental Material
Abbreviations Used
References
Supplementary Material
Please find the following supplemental material available below.
For Open Access articles published under a Creative Commons License, all supplemental material carries the same license as the article it is associated with.
For non-Open Access articles published, all supplemental material carries a non-exclusive license, and permission requests for re-use of supplemental material or any part of supplemental material shall be sent directly to the copyright owner as specified in the copyright notice associated with the article.