
Abstract
Background. Little is known about vaccine intention behavior among patients recovering from a medically attended acute respiratory infection. Methods. Adults ≥ 18 years old with an acute respiratory infection in the 2014-2015, 2015-2016, and 2016-2017 influenza seasons were tested for influenza and completed surveys. Across seasons, unvaccinated participants were grouped into those who intended to receive the influenza vaccine in the following season (vaccine intention) and those who did not (no vaccine intention). In 2016-2017, participants were asked the reasons for their vaccination behavior. Results. Of the 837 unvaccinated participants, 308 (37%) intended to be vaccinated the next season. The groups did not differ in demographic or overall health factors. In logistic regression, non-Whites, those reporting wheezing or nasal congestion, and those receiving an antiviral prescription were more likely to be in the vaccine intention group. That group was significantly more likely to cite perceived behavioral control reasons for not being vaccinated (forgot), while the no vaccine intention group was significantly (p < .001) more likely to report knowledge/attitudinal reasons (side effects). Conclusion. Because influenza vaccine is given annually, adults must make a conscious decision to receive the vaccine each year. Understanding the factors related to vaccination behavior and intent can help shape interventions to improve influenza vaccination rates. A medical visit at the time of an acute respiratory illness, especially one in which the provider suspects influenza, as evidenced by an antiviral prescription, is an ideal opportunity to recommend influenza vaccine in the next season, to prevent a similar experience.
Introduction
A significant proportion of the U.S. adult population does not receive the seasonal influenza vaccine each year despite millions of outpatient medical office visits due to influenza. It has been estimated that vaccination of 80% to 90% of persons would be sufficient to ensure herd immunity and prevent the spread of influenza (Plans-Rubió, 2012). The Centers for Disease Control and Prevention (CDC, 2017) reports that the proportion of unvaccinated adults ranges from 34.7% among those ≥65 years to 66.4% among those 18 to 49 years of age. The factors related to influenza vaccination behavior have been well documented and explained using behavioral theory. Among the most important factors related to current influenza vaccine uptake by community-dwelling adults are higher perceived susceptibility to influenza infection, perceived benefits of vaccination, and cues to action such as doctor recommendation (Malosh et al., 2014; Nowalk, Zimmerman, Shen, Jewell, & Raymund, 2004), and habit (Nowalk et al., 2010), that is, previous influenza vaccination is strongly related to future vaccine receipt.
The theory of reasoned action and its expansion, the theory of planned behavior, postulate that behavior largely depends on behavioral intent, which itself, is predicated on an individual’s knowledge and attitudes, perceived social norms, motivation, and perceived behavioral control (Montano & Kasprzyk, 2002). Intention to receive influenza vaccine has been associated with increased positive attitudes toward the vaccine; perceived control, susceptibility, benefits, and severity of disease; social support; subjective norm of family intention to receive the influenza vaccine (Ratnapradipa, Norrenberns, Turner, & Kunerth, 2017); past receipt of the vaccine (Flood et al., 2010; Gallagher & Povey, 2006; Nowalk et al., 2010; Thompson et al., 2012); and anticipated regret if one is not vaccinated (Gallagher & Povey, 2006; Myers & Goodwin, 2011).
Few studies have examined vaccination behavioral intent among those who are sick with an acute respiratory illness (ARI). In a previous study of adults seeking medical care for an ARI, among those who intended to receive influenza vaccine in the next season, the currently unvaccinated were significantly more likely to have laboratory-confirmed influenza compared with vaccinated adults; whereas unvaccinated adults who reported no intention to be vaccinated in the following season were not more likely to have influenza (Nowalk et al., 2015).
The purpose of this study was to examine factors that may explain why some unvaccinated adults seeking medical care for ARI across three influenza seasons changed their intent to be vaccinated in the following season, while others did not. We hypothesized that the differences in the predominant circulating strain, the timing of the disease peak, and the composition of the influenza vaccine that together characterized the three influenza seasons would result in differences by year in the intent to receive the next year’s influenza vaccine. In one season, 2016-2017, participants were also asked their reasons for not being vaccinated and not intending to be vaccinated the next year to evaluate the behavioral constructs influencing vaccination behavior and intent. We further hypothesized that having a respiratory illness severe enough to warrant medical care might encourage unvaccinated persons to overcome their vaccine hesitancy. We explored a priori, demographics, factors related to illness severity, and/or behavioral factors as influencers of vaccination behavior and intent. The need for an annual influenza vaccine means that providers must address vaccine hesitancy every year, and understanding the factors related to vaccination intention may inform better approaches to overcoming influenza vaccine hesitancy.
Method
This study was approved by the University of Pittsburgh Institutional Review Board.
Participants
Participants provided informed consent and were enrolled in the University of Pittsburgh’s center for the U.S. Influenza Vaccine Effectiveness Network study described previously (CDC, 2013), one of five sites from across the United States. Eligibility criteria included age 18 years or older, presentation at one of the participating primary care or urgent care centers for treatment of an upper respiratory illness with cough of ≤7 days duration, and having no history of taking an influenza antiviral medication (oseltamivir or zanamivir) for this illness. Participating care centers were located within a 25-mile radius of the city of Pittsburgh, Pennsylvania, a medium-sized city in the northeastern United States. They included urban, suburban, and suburban/rural settings. Racial distribution of the study group approximated that of the Pittsburgh metropolitan area.
Study Procedures
After informed consent, the participants completed a survey and provided nasal and throat swabs for influenza testing. Influenza infection was detected using the CDC’s real-time reverse transcription polymerase chain reaction method described previously (Ohmit et al., 2014) on combined nasal and throat specimens. Participants were informed that they would be asked to complete a follow-up survey by email or phone 7 to 14 days following enrollment. On Day 7 following enrollment, participants who had provided an email address received an email reminder to complete the survey online. If they had not done so by Day 8, or had not provided an email address, they were telephoned to complete the survey by phone (up to 5 attempts). From the entire study group, 73% to 85% of all enrollees completed the follow-up survey. Of the unvaccinated responders, approximately 60% returned their surveys by email and 40% responded by phone (p = .524). It should be noted that the participants were unlikely to have been aware of their influenza status at the time of the follow-up survey because of the considerable time lag between specimen collection and analysis and the time at which the influenza positive results were reported back to the physician’s office. Moreover, physicians were given the option of informing their patients of the test results.
Demographic and Other Variables
From the enrollment survey, the following variables were derived: age, race, health insurance type, personal smoking status and household smoking (someone in the household smokes), asthma diagnosis, subjective social status (measured using a 9-point scale comparing one’s overall life situation with others, 1 = low, 9 = high), symptoms of ARI, overall health rating before ARI (fair/poor, good, very good, and excellent), and illness severity on day of enrollment (measured using a 100-point visual analog scale), quality of sleep the night before enrollment and ability to perform usual or normal activities (both measured using a 10-point scale). Body mass index was calculated from self-reported height and weight. Influenza vaccination status was assessed using data from the electronic medical record and if unavailable, self-report. Presence of high-risk conditions such as cardiovascular disease was also derived from the electronic medical record. Using the same instruments as at enrollment, the follow-up survey assessed sleep quality, ability to perform usual activities, illness severity, as well as intention to receive influenza vaccine in the next season, and employment status. During the 2016-2017 season, unvaccinated participants were also asked why they did not receive the influenza vaccine using a list of possible reasons drawn from the literature and clinical experience, from which they could select all that were applicable. A similar question was also asked of the no vaccine intention group about the reasons why they did not plan to receive next year’s vaccine. The follow-up questionnaire used branching logic, such that participants were asked to complete questions based on their previous answers. For example, vaccinated patients were not asked why they did not receive the vaccine.
Statistical Analyses
Data were collected during the 2014-2015, 2015-2016, and 2016-2017 influenza seasons; the same individuals were not followed each year. This analysis included only unvaccinated individuals who were classified into two groups based on their influenza vaccination intention for the following year—those who reported that they planned to receive the influenza vaccine (vaccine intention) and those who did not plan to receive the influenza vaccine (no vaccine intention).
Summary statistics of baseline demographics, social and health measures, symptoms, and severity are presented as means and standard deviations for continuous variables (e.g., baseline severity) and percentages for discrete variables (e.g., race). Student’s t tests and Mann–Whitney U tests were used to compare continuous baseline clinical and demographic features across the vaccination intention groups. Chi-square tests compared the discrete variables between vaccination intention groups. Logistic regression models were used to determine factors associated with intention to receive influenza vaccine after adjusting for the effect of baseline characteristics that were not equally distributed. Factors were included in the model if they were significantly different between vaccine intention and no vaccine intention groups at p < .2. The final model included sex, race, smoking status, fever, wheezing, nasal congestion, antiviral prescription, baseline health severity, and year. Year (influenza season) was included a priori because the three seasons differed by predominant circulating virus strain, timing of the peak season, and vaccine components. Unadjusted and adjusted odds ratios (ORs) and 95% confidence intervals (CIs) were reported. Data were collected using REDCap electronic data capture tools (Harris et al., 2009) and were managed and analyzed with SAS v9.2 (SAS Institute, Inc., Cary, NC). Overall, an alpha level of .05 was used to indicate statistical significance.
Results
During the 2014-2015, 2015-2016, and 2016-2017 influenza seasons, 3,188 eligible adults seen in outpatient settings for an ARI were approached, and 3,065 (96.1%) were enrolled in the influenza vaccine effectiveness study. Of these enrollees, 2,501 (81.4%) responded to the follow-up questionnaire; they were more likely to be White, 18 to 49 years of age, and privately insured compared with nonresponders (p < .02). Table 1 shows the demographic and other characteristics of the 837 unvaccinated respondents, who represented one third of the follow-up questionnaire respondents. Among unvaccinated enrollees, the majority (66%) was 18 to 49 years old, female (60%), non-Hispanic White (88%), and in very good or excellent self-reported health before the current illness (65.5%). Just over one half was employed (54%) and privately insured (58%), few were smokers (20%), lived with a smoker (26%), or had asthma (20%); approximately one third (31%) had a high-risk medical condition.
Demographic Characteristics of Unvaccinated Participants ≥18 Years With a Medically Attended Acute Respiratory Illness for the 2014-2015, 2015-2016, and 2016-2017 Influenza Seasons Combined
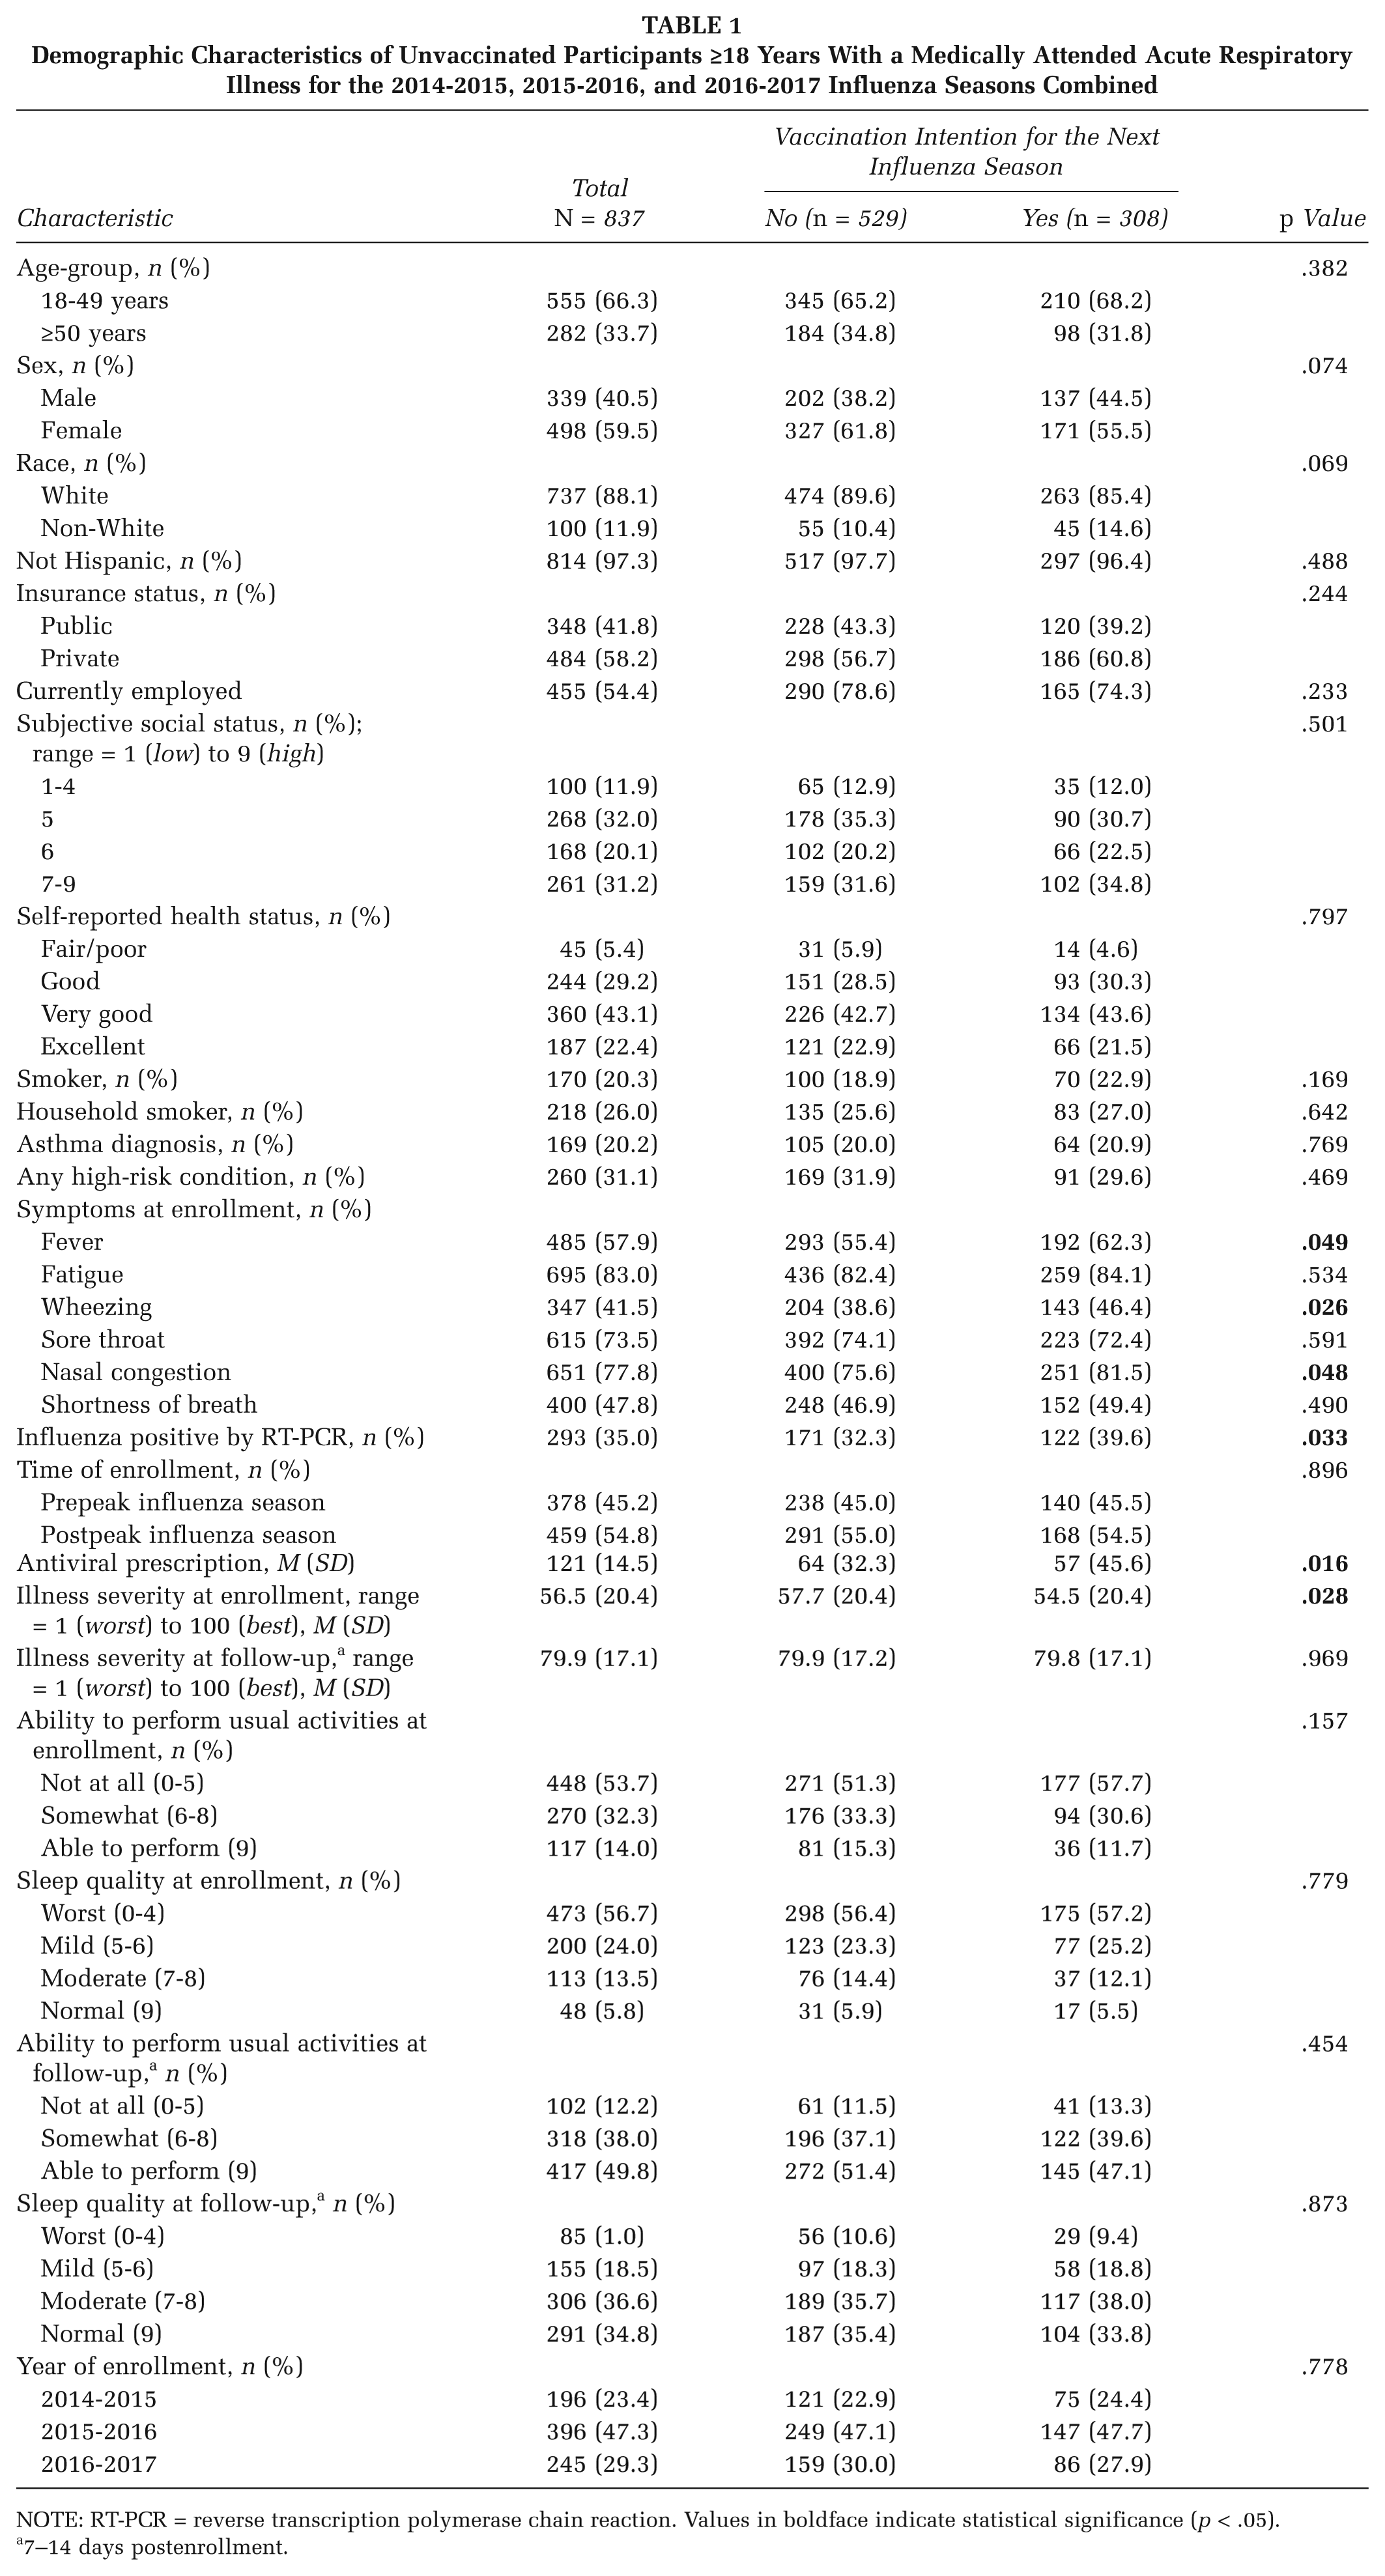
NOTE: RT-PCR = reverse transcription polymerase chain reaction. Values in boldface indicate statistical significance (p < .05).
7–14 days postenrollment.
Of these unvaccinated participants, 308 (36.8%) planned to be vaccinated during the next influenza season. They included 75 (38%) in 2014-2015, 147 (37%) in 2015-2016, and 86 (35%) in 2016-2017. No significant difference was found in the proportion in each vaccine intention group by year (Table 1). Although the factors that differed between vaccine intention and no vaccine intention groups were dissimilar across the three influenza seasons (see Tables A1-A3 in the appendix), there was insufficient evidence for separate yearly analyses, thus data were combined for all three seasons. Overall, no demographic differences existed between the vaccine intention group and the no vaccine intention group (Table 1). However, at enrollment, compared with the no vaccine intention group, the vaccine intention group was significantly more likely to report fever (62% vs. 55%; p = .049), wheezing (46% vs. 39%; p = .026), nasal congestion (83% vs. 76%; p = .048), and a worse illness severity score (54.5 ± 20.4 vs. 57.7 ± 20.4; p = .028). The vaccine intention group was significantly more likely to have received an antiviral prescription (46% vs. 32%; p = .016) and to have laboratory-confirmed influenza (40% vs. 32%; p = .033), compared with the no vaccine intention group (Table 1).
In unadjusted logistic regression modeling, having laboratory-confirmed influenza was significantly associated with a higher likelihood of vaccine intention for the next season (OR = 1.37; 95% CI = [1.03, 1.84]; p = .033; Table 2). In the adjusted model, laboratory-confirmed influenza was no longer significantly associated with vaccine intention. However, non-White race (OR = 1.61; 95% CI = [1.05, 2.48]; p = .029), presence of wheezing (OR = 1.34; 95% CI = [1.01, 1.79]; p = .047), nasal congestion (OR = 1.52; 95% CI = [1.06, 2.18]; p = .022), and being prescribed an antiviral medication (OR = 1.55; 95% CI = 1.04, 2.33; p = .033) significantly increased the likelihood that unvaccinated adults would report an intention to be vaccinated in the following season. Influenza season was not a significant factor.
Factors Associated With Vaccine Intention Compared With No Vaccine Intention in the Next Season Among Those Not Vaccinated in the Current Season
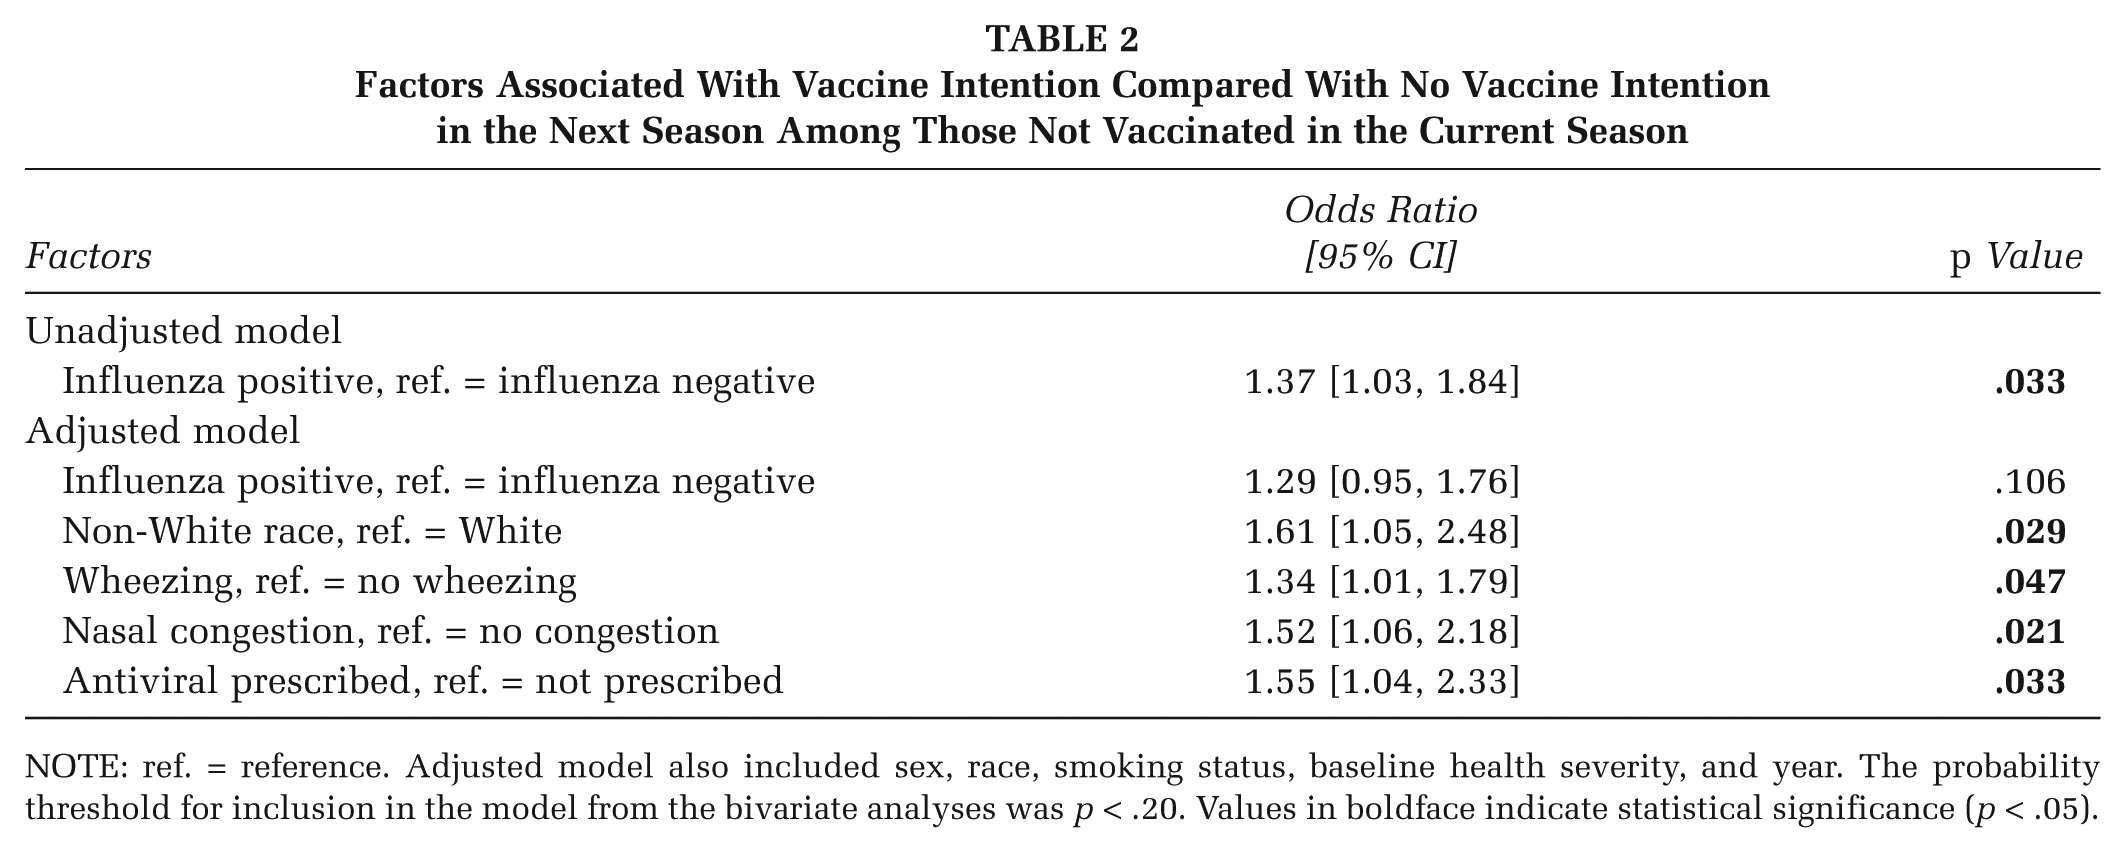
NOTE: ref. = reference. Adjusted model also included sex, race, smoking status, baseline health severity, and year. The probability threshold for inclusion in the model from the bivariate analyses was p < .20. Values in boldface indicate statistical significance (p < .05).
To maximize the response rate and minimize participant burden, the reasons for not receiving influenza vaccine were limited to items that measured perceived behavioral control, knowledge, and attitudes from the theory of planned behavior. Striking differences were observed between the vaccine intention and no vaccine intention groups in the reasons given for not receiving influenza vaccine during their enrollment year (Table 3). For example, more than 40% of the vaccine intention group said they forgot to get vaccinated or that it was inconvenient (33%), compared with 3% who forgot and 6% who said it was inconvenient in the no vaccine intention group (p < .001). These reasons are classified as expressing perceived behavioral control. Conversely, approximately one third of the no vaccine intention group did not receive the vaccine because they were worried about side effects (32.1%), got the vaccine in the past and still got influenza (34.0%), or believed that the vaccine was not necessary/natural treatment of disease is preferable (35.9%). Less than 11% of the vaccine intention group reported each of these reasons (p < .001). These reasons were classified as expressing knowledge or attitudes about influenza vaccine. The latter three were the primary reasons given by the no vaccine intention group regarding the next season’s vaccine (Table 3). Few individuals reported mistrust of the vaccine, but significantly more of the no vaccine intention group (12.6%) than the vaccine intention group (4.7%; p = .046) reported this reason for not being vaccinated.
Reasons for Not Receiving Influenza Vaccine in 2016-2017 and for Not Intending to Receive Influenza Vaccine in 2017-2018
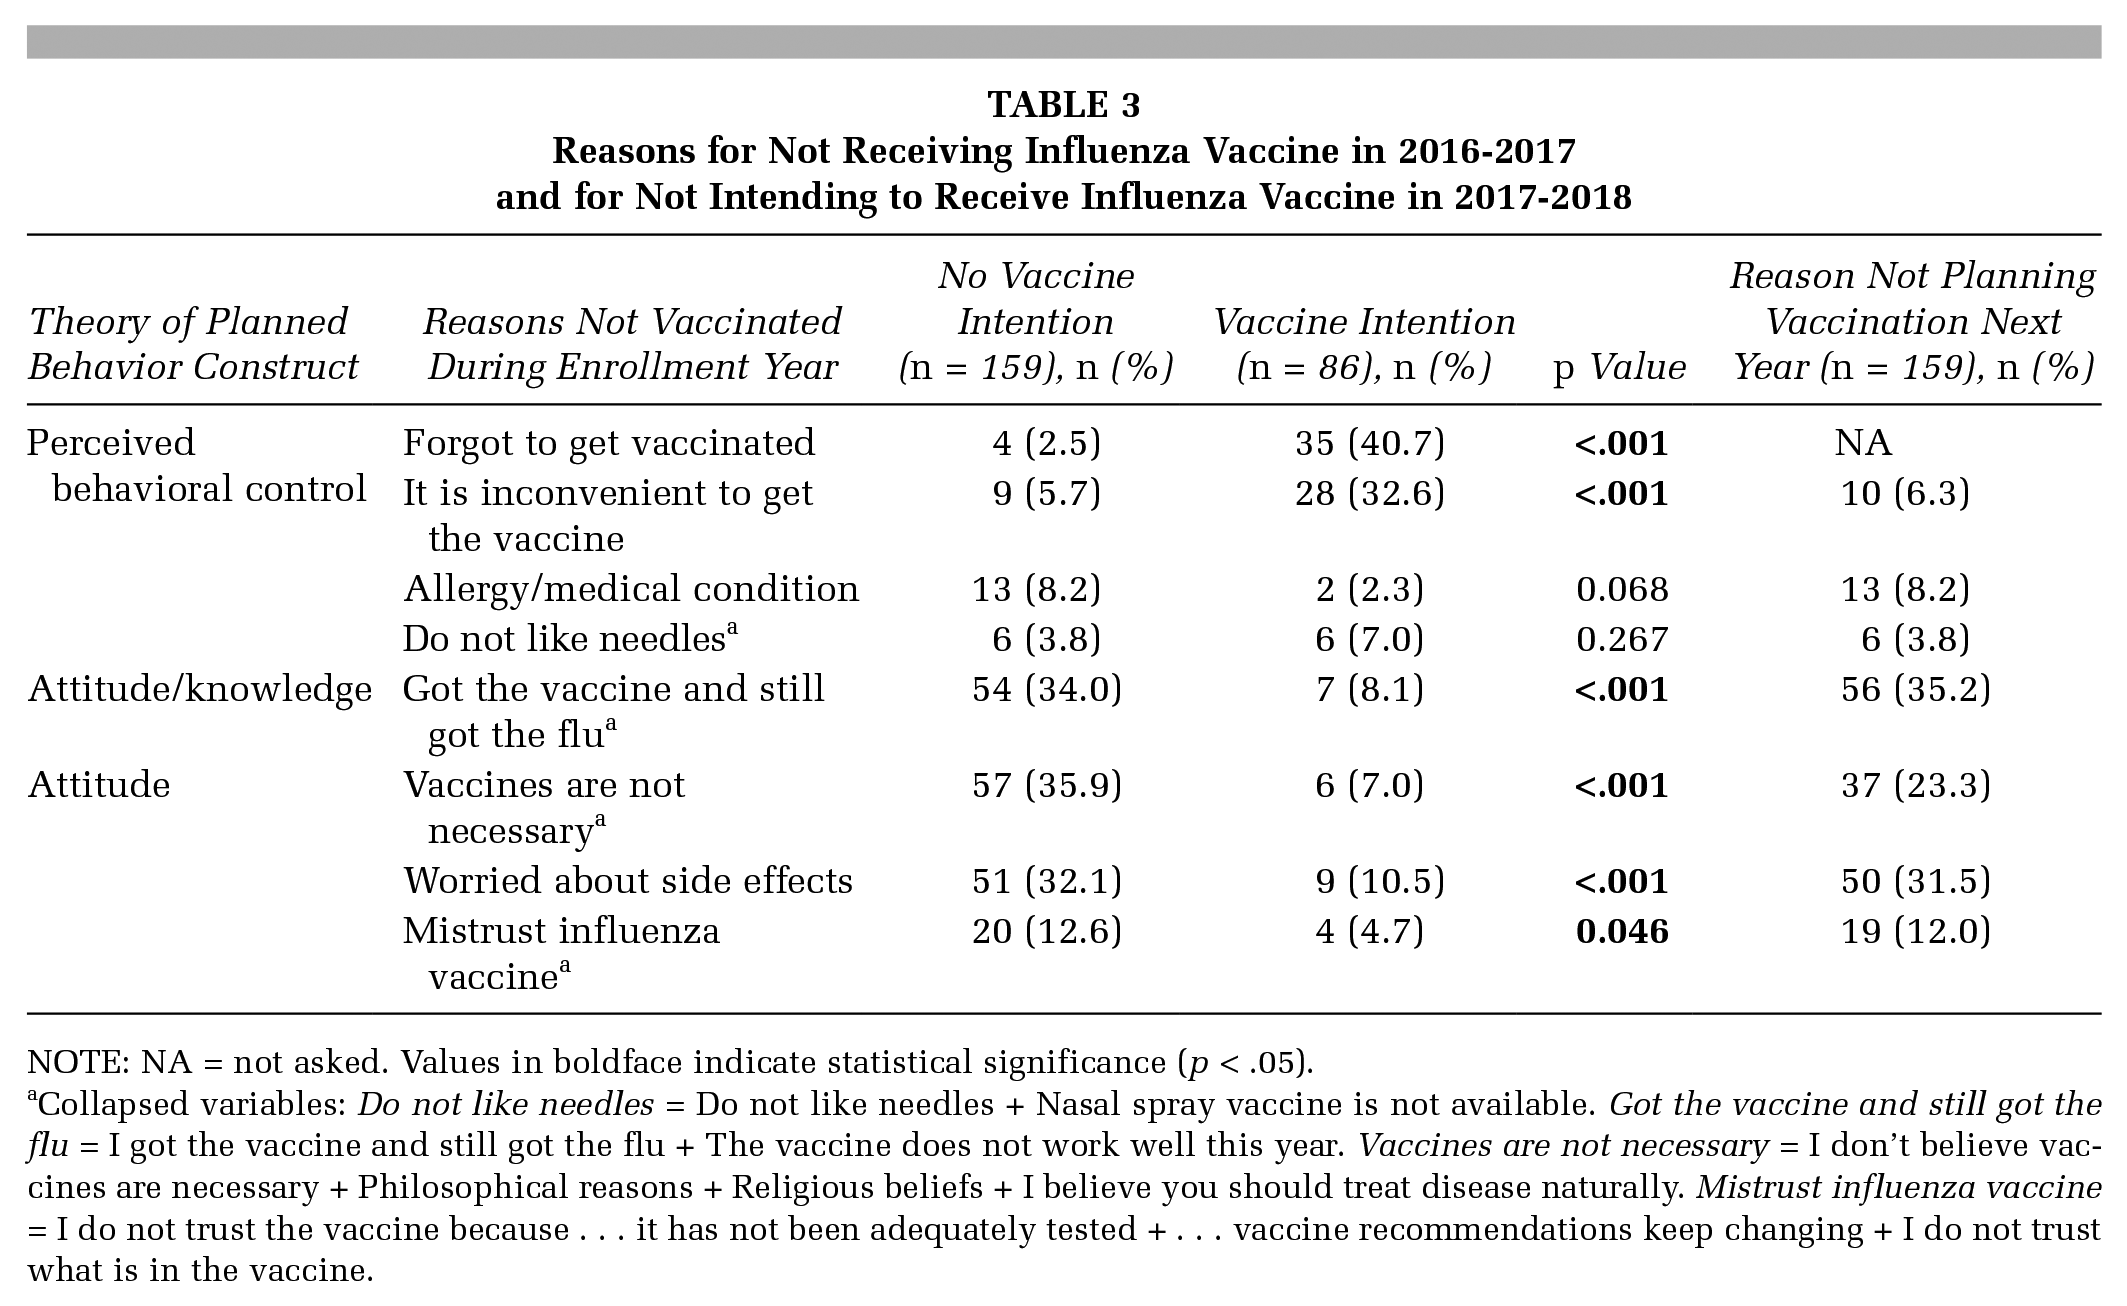
NOTE: NA = not asked. Values in boldface indicate statistical significance (p < .05).
Collapsed variables: Do not like needles = Do not like needles + Nasal spray vaccine is not available. Got the vaccine and still got the flu = I got the vaccine and still got the flu + The vaccine does not work well this year. Vaccines are not necessary = I don’t believe vaccines are necessary + Philosophical reasons + Religious beliefs + I believe you should treat disease naturally. Mistrust influenza vaccine = I do not trust the vaccine because . . . it has not been adequately tested + . . . vaccine recommendations keep changing + I do not trust what is in the vaccine.
Discussion
We hypothesized that the differences in the predominant circulating strain, the timing of the disease peak, and the composition of the influenza vaccine that together characterized the three influenza seasons would result in differences by year in the motivations for changing one’s mind about receiving the influenza vaccine. A similar proportion (approximately one third) of unvaccinated participants planned to receive the influenza vaccine following each season, but we observed few significant differences between the vaccine intention and no vaccine intention groups by year. Hence, all three years were combined in this analysis.
In contrast to reports citing demographic differences among those who receive influenza vaccine (Schmid, Rauber, Betsch, Lidolt, & Denker, 2017), those who reported vaccine intention did not differ on demographic characteristics in bivariate analyses, but rather on symptoms (wheezing, nasal congestion, fever, severity of disease at enrollment, and confirmed influenza). When all significant variables were accounted for in regression analyses, non-White race, presence of wheezing and nasal congestion, and receiving an antiviral prescription increased the likelihood that the participant would intend to be vaccinated in the next season. In a previous study of unvaccinated patients seeking medical care for an ARI, having influenza and having more severe illness were significantly related to planning to receive influenza vaccine (Nowalk et al., 2015). In the current study, receiving an antiviral prescription may have been a proxy for influenza disease as antivirals are only prescribed for suspected or confirmed influenza. Physician recommendation to be vaccinated is a well-documented predictor of vaccine acceptance (CDC, 2017; Nowak, Sheedy, Bursey, Smith, & Basket, 2015; Nowalk et al., 2004; Tabbarah et al., 2005; Zimmerman et al., 2003). It is possible that providers who prescribed antivirals because they suspected influenza, recommended future influenza vaccine and in so doing, influenced some unvaccinated enrollees to receive the influenza vaccine in the next season.
The reasons for not being vaccinated in the season of enrollment were distinctly different between the vaccine intention and no vaccine intention groups. In this group of adults of all ages, the most important factors for the vaccine intention group were the perceived behavioral control factors of forgetting to be vaccinated or inconvenience of getting vaccinated; whereas, few reported attitudinal factors such as worry about side effects or belief that vaccines are not necessary. Habit has been shown to be an important factor for predicting influenza vaccine receipt (Nowalk et al., 2010; Schmid et al., 2017). At least some of the vaccine intention group may be habitual vaccine recipients who simply missed being vaccinated that season and are not changing their attitudes toward influenza vaccine because they were sick enough to seek medical care.
Among the no vaccine intention group, knowledge and attitudes toward influenza vaccine—got the vaccine and still got the flu (includes I got the vaccine and still got the flu, and the vaccine does not work well this year), vaccines are not necessary (includes I don’t believe vaccines are necessary, philosophical reasons, religious belief, and I believe you should treat disease naturally), mistrust about the vaccine (includes I do not trust the vaccine because it has not been adequately tested, the vaccine recommendations keep changing, or I do not trust what is in the vaccine) and worry about side effects—were the primary reasons for not being vaccinated. By comparison, in a study of unvaccinated health care workers, low risk perception (50%) and time constraints (12%) were most frequently given as reasons for not being vaccinated against seasonal influenza (Lehmann, Ruiter, Chapman, & Kok, 2014).
The reasons given by the no vaccine intention group for why they did not intend to receive the next season’s influenza vaccine were the same knowledge/attitudinal factors they had reported for not receiving the current year’s vaccine. Similarly, among low income adults who did not intend to receive the influenza vaccine, 39% did not want the vaccine, 32% believed that the vaccine causes illness, and 11% believed that the vaccine is unnecessary (Suryadevara, Bonville, Rosenbaum, & Domachowske, 2014).
A recent review of the vaccine hesitancy literature from 2005 to 2016 (Schmid et al., 2017) concluded that a negative attitude toward the vaccine and lack of trust in health authorities were the most frequently reported barriers to influenza vaccine uptake. The review did not discriminate between uptake and intent. In the present study, mistrust of the vaccine was reported by significantly more participants in the no vaccine intention group than the vaccine intention group.
It is essential to know and understand the knowledge and attitudinal factors related to vaccine refusal. While physician recommendation is highly related to adult vaccine acceptance, current adult influenza vaccination rates suggest that it may be insufficient to overcome all vaccine hesitancy. Therefore, recommendations of health care providers may need to address the concerns about influenza vaccine such as mistrust, which are inhibiting vaccine acceptance, as an integral part of their recommendation conversation.
Using data from three distinctly different influenza seasons, this study found that 41% of adults seeking medical care for an ARI were unvaccinated against influenza, and of those, nearly two thirds had no intention of receiving the influenza vaccine the next year. The reasons given by the no vaccine intention group, despite having a respiratory illness severe enough to warrant medical care, were attitudinal and may be more intractable to change. However, physician recommendation has been shown to be a powerful predictor of vaccination behavior (Tabbarah et al., 2005; Zimmerman et al., 2003). While influenza vaccination recommendations are likely to be given during chronic care or prevention visits that occur shortly before and/or during influenza vaccination season, a visit for an acute respiratory illness offers an additional opportunity to encourage influenza vaccination.
Strengths and Limitations
Much of the previous research on vaccine intention behavior has been conducted on health care workers, children, adults outside the United States, or has focused on intention to receive the 2009 pandemic influenza vaccine. These studies generally found that previous experience of influenza is positively related to vaccine intent (Schmid et al., 2017). This study examined seasonal vaccine intention behavior among a cross-section of adults who were seeking medical care for an ARI, in three influenza seasons. Our hypotheses were that having a respiratory illness severe enough to warrant medical care might encourage unvaccinated persons to overcome their vaccine hesitancy and that seasonal epidemiology might affect vaccination decision making. There was no difference in intent to vaccinate the following influenza season by year, although each season differed by timing of the onset and severity of the epidemic, and degree of concordance between the vaccine viruses and circulating viruses. The sample size of this study may have obscured the effects on vaccination intention behavior potentially attributable to characteristics of the influenza season. Data on receipt of influenza vaccine in the next season were not collected in this study. A logical follow-up study would include those data. The reasons for not being vaccinated or not intending to be vaccinated were asked only in the 2016-2017 season. The reasons may have differed in the prior two seasons. Finally, participants were unaware of their influenza status at the time of the follow up survey, which may have influenced their intention to be vaccinated next season. However, this limitation may have been mitigated by the fact that the vaccine intention group felt sicker and were prescribed antivirals that are only used for influenza.
Conclusions
Because seasonal influenza vaccine is given annually, each adult must make a conscious decision to receive the vaccine each year. Understanding the factors related to vaccine behavior intent can help shape interventions to address those factors, with the goal of improving influenza vaccination rates. Primary care offices can help prevent missed influenza vaccinations due to lack of time or forgetting by reminding patients at every visit prior to and during influenza vaccination season and offering easy access and express vaccination services that do not require a scheduled visit. For intentional nonvaccinators whose reasons are based on misinformation or negative attitudes about influenza vaccine, a different approach may be more effective. A medical visit at the time of an acute respiratory illness, especially one in which the provider suspects influenza, as evidenced by an antiviral prescription, is an ideal opportunity to recommend influenza vaccine in the next season, to prevent a similar experience.
Footnotes
Appendix
Demographic and Other Characteristics of Participants ≥18 Years at Enrollment by Intent to Vaccinate in the Next Year (2016-2017 Season)
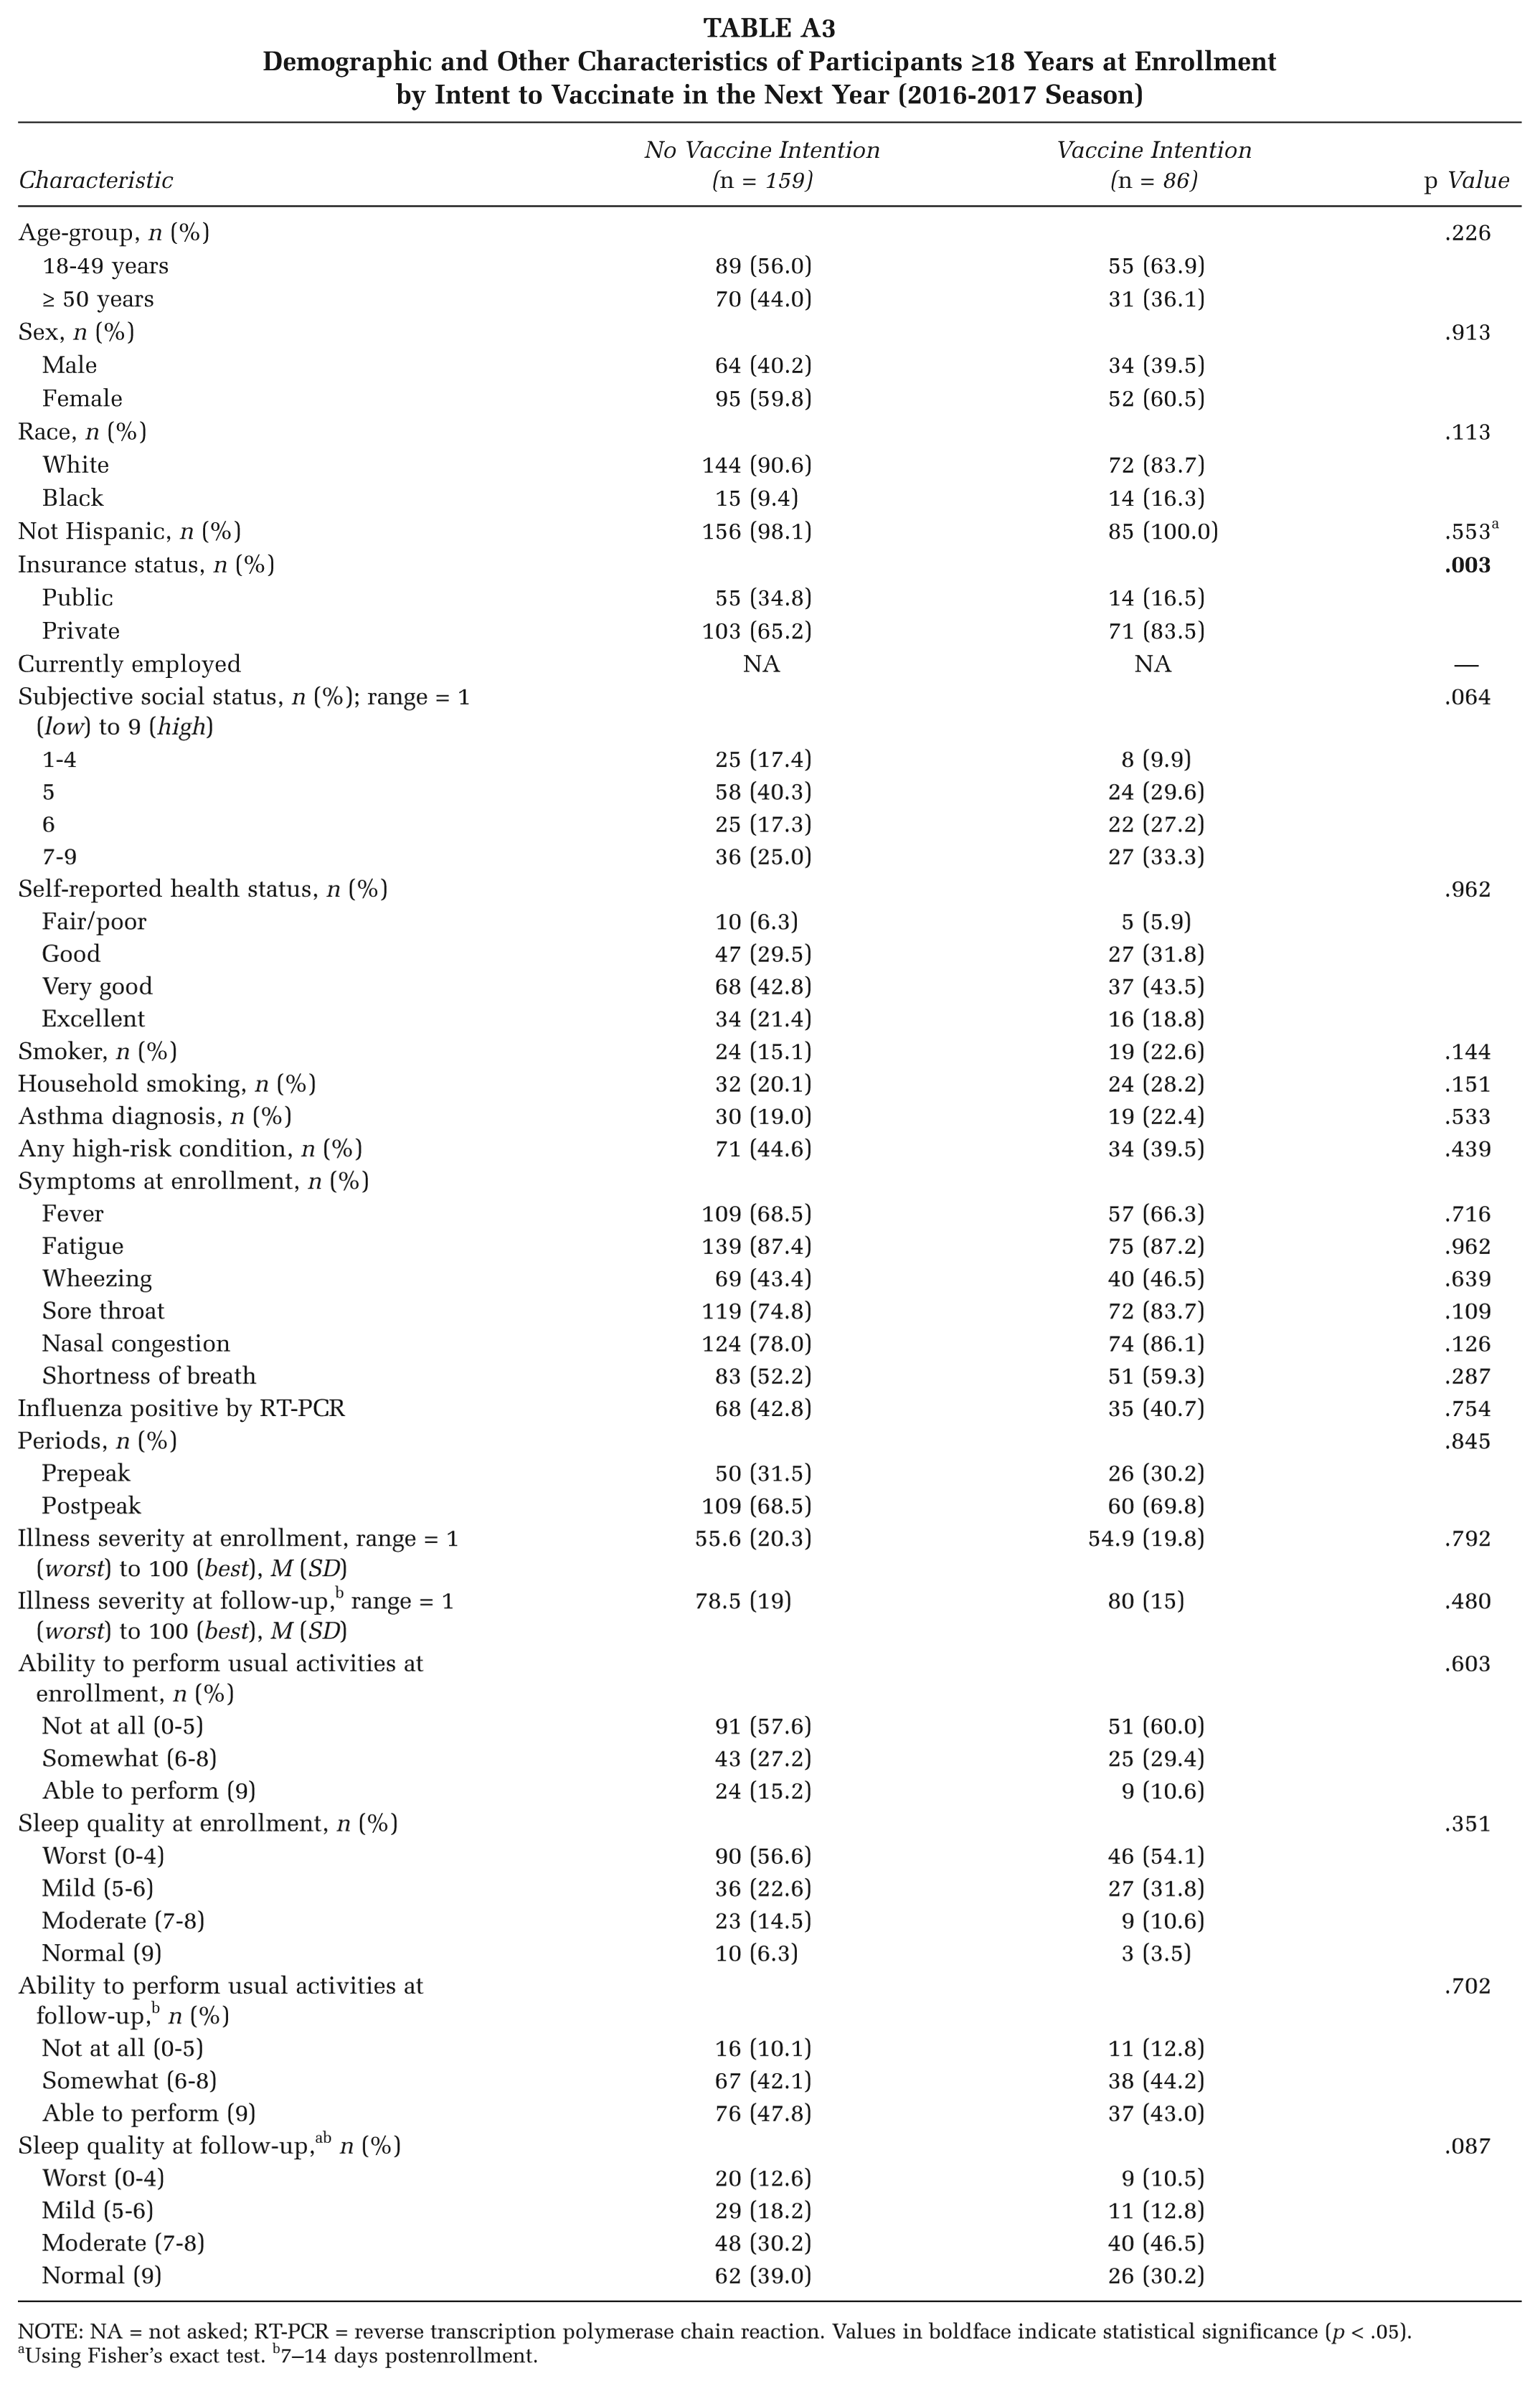
| Characteristic | No Vaccine Intention (n = 159) | Vaccine Intention (n = 86) | p Value |
|---|---|---|---|
| Age-group, n (%) | .226 | ||
| 18-49 years | 89 (56.0) | 55 (63.9) | |
| ≥ 50 years | 70 (44.0) | 31 (36.1) | |
| Sex, n (%) | .913 | ||
| Male | 64 (40.2) | 34 (39.5) | |
| Female | 95 (59.8) | 52 (60.5) | |
| Race, n (%) | .113 | ||
| White | 144 (90.6) | 72 (83.7) | |
| Black | 15 (9.4) | 14 (16.3) | |
| Not Hispanic, n (%) | 156 (98.1) | 85 (100.0) | .553 a |
| Insurance status, n (%) |
|
||
| Public | 55 (34.8) | 14 (16.5) | |
| Private | 103 (65.2) | 71 (83.5) | |
| Currently employed | NA | NA | — |
| Subjective social status, n (%); range = 1 (low) to 9 (high) | .064 | ||
| 1-4 | 25 (17.4) | 8 (9.9) | |
| 5 | 58 (40.3) | 24 (29.6) | |
| 6 | 25 (17.3) | 22 (27.2) | |
| 7-9 | 36 (25.0) | 27 (33.3) | |
| Self-reported health status, n (%) | .962 | ||
| Fair/poor | 10 (6.3) | 5 (5.9) | |
| Good | 47 (29.5) | 27 (31.8) | |
| Very good | 68 (42.8) | 37 (43.5) | |
| Excellent | 34 (21.4) | 16 (18.8) | |
| Smoker, n (%) | 24 (15.1) | 19 (22.6) | .144 |
| Household smoking, n (%) | 32 (20.1) | 24 (28.2) | .151 |
| Asthma diagnosis, n (%) | 30 (19.0) | 19 (22.4) | .533 |
| Any high-risk condition, n (%) | 71 (44.6) | 34 (39.5) | .439 |
| Symptoms at enrollment, n (%) | |||
| Fever | 109 (68.5) | 57 (66.3) | .716 |
| Fatigue | 139 (87.4) | 75 (87.2) | .962 |
| Wheezing | 69 (43.4) | 40 (46.5) | .639 |
| Sore throat | 119 (74.8) | 72 (83.7) | .109 |
| Nasal congestion | 124 (78.0) | 74 (86.1) | .126 |
| Shortness of breath | 83 (52.2) | 51 (59.3) | .287 |
| Influenza positive by RT-PCR | 68 (42.8) | 35 (40.7) | .754 |
| Periods, n (%) | .845 | ||
| Prepeak | 50 (31.5) | 26 (30.2) | |
| Postpeak | 109 (68.5) | 60 (69.8) | |
| Illness severity at enrollment, range = 1 (worst) to 100 (best), M (SD) | 55.6 (20.3) | 54.9 (19.8) | .792 |
| Illness severity at follow-up, b range = 1 (worst) to 100 (best), M (SD) | 78.5 (19) | 80 (15) | .480 |
| Ability to perform usual activities at enrollment, n (%) | .603 | ||
| Not at all (0-5) | 91 (57.6) | 51 (60.0) | |
| Somewhat (6-8) | 43 (27.2) | 25 (29.4) | |
| Able to perform (9) | 24 (15.2) | 9 (10.6) | |
| Sleep quality at enrollment, n (%) | .351 | ||
| Worst (0-4) | 90 (56.6) | 46 (54.1) | |
| Mild (5-6) | 36 (22.6) | 27 (31.8) | |
| Moderate (7-8) | 23 (14.5) | 9 (10.6) | |
| Normal (9) | 10 (6.3) | 3 (3.5) | |
| Ability to perform usual activities at follow-up, b n (%) | .702 | ||
| Not at all (0-5) | 16 (10.1) | 11 (12.8) | |
| Somewhat (6-8) | 67 (42.1) | 38 (44.2) | |
| Able to perform (9) | 76 (47.8) | 37 (43.0) | |
| Sleep quality at follow-up, a b n (%) | .087 | ||
| Worst (0-4) | 20 (12.6) | 9 (10.5) | |
| Mild (5-6) | 29 (18.2) | 11 (12.8) | |
| Moderate (7-8) | 48 (30.2) | 40 (46.5) | |
| Normal (9) | 62 (39.0) | 26 (30.2) | |
NOTE: NA = not asked; RT-PCR = reverse transcription polymerase chain reaction. Values in boldface indicate statistical significance (p < .05).
Using Fisher’s exact test. b7–14 days postenrollment.
*
U.S. Influenza Vaccine Effectiveness Network, Pittsburgh Site authors include Joe Suyama, MD, Department of Emergency Medicine, University of Pittsburgh School of Medicine; Jose Aracena; Jonathan Steele; and Donald B. Middleton, MD, Department of Family Medicine, University of Pittsburgh School of Medicine
Dr. Zimmerman has research funding from Sanofi Pasteur, Inc., and Merck & Co., Inc. and has had funding from Pfizer, Inc. Dr. Nowalk has research funding from Merck & Co., Inc. and has had funding from Pfizer, Inc. Dr. Middleton serves on advisory boards for Pfizer, Inc., Merck & Co, Inc., GlaxoSmithKlein, plc and Sanofi Pasteur, and has research funding from Pfizer, Inc.
The other authors have no conflicts to report.
This work was supported by the Centers for Disease Control and Prevention, through cooperative agreements with the University of Pittsburgh (U01 IP000467 and U01IP001035-02), and by the National Institutes of Health (grants UL1 RR024153, UL1TR000005, and UL1TR001857).
The findings and conclusions in this article are those of the authors and do not necessarily represent the views of the Centers for Disease Control and Prevention or of the the National Institutes of Health.