
Abstract
Given the widespread use of out-of-home child care in the United States, early care and education (ECE) providers offer ideal settings to promote health behaviors among Hispanic/Latino children whose obesity prevalence remains high. This study details the process evaluation of ECE intervention strategies of a childhood obesity research demonstration study (California Childhood Obesity Research Demonstration [CA-CORD]) to prevent and control obesity among Hispanic/Latino children aged 2 to 12 years. Participating ECE providers received the Nutrition and Physical Activity Self-Assessment for Child Care (NAP SACC) materials and action planning sessions with a trained interventionist; Sports, Play, and Active Recreation for Kids (SPARK) physical activity (PA), health behavior, and body mass index assessment trainings; and health behavior toolkit, cooking kit, water dispensers, and posters to promote healthy eating, PA, water consumption, and quality sleep. Intervention logs and director/lead teacher interviews evaluated how well 14 center-based and 9 private ECE providers implemented policy, system, and environmental changes. NAP SACC was implemented with higher fidelity than other strategies, and participation in SPARK trainings was lower than health behavior trainings. ECE directors/lead teachers reported that the intervention activities and materials helped them promote the targeted behaviors, especially PA. Results demonstrated that the use of NAP SACC, trainings, and toolkit had high fidelity and were potentially replicable for implementation in ECE settings among Hispanic/Latino communities.
Introduction
Obesity and severe obesity among U.S. children aged 2 to 5 years continue to increase (Skinner, Ravanbakht, Skelton, Perrin, & Armstrong, 2018), and Hispanic/Latino children are disproportionally affected (Ogden et al., 2016) As childhood obesity is associated with increased risk of obesity in adulthood (Daniels, 2009), the prevention and control of childhood obesity is a public health priority. In 2011, about one quarter of all U.S. children under 5 years of age received care from early care and education (ECE) providers (Laughlin, 2013). Some studies in ECE settings have shown positive intervention effects on health behaviors (e.g., diet, PA) and adiposity (e.g., body mass index [BMI]) among children 0 to 5 years old (Fitzgibbon et al., 2005, 2006; Jouret et al., 2009; Roberts-Gray et al., 2016). Nonetheless, a review of center-based ECE interventions has shown limited evidence for combined physical activity (PA) and diet interventions (Wang et al., 2015). Furthermore, few intervention studies have reported results of their process evaluations. For example, a recent review of obesity prevention studies among young children identified eight studies; while all reported the intervention resources needed (e.g., costs and number of staff), only four provided just brief process evaluation results (e.g., participant attendance, dose delivered; Waters et al., 2011).
Process Evaluation
Process evaluation involves assessing the reach, dose, and fidelity of intervention implementation (Steckler & Linnan, 2002). When implementation fidelity (the extent to which an intervention is delivered as planned) and the opinions of program implementers are assessed, implementation barriers and facilitators can be more precisely identified and dissemination efforts can also be improved.
Background
In 2011, the Centers for Disease Control and Prevention funded three sites and an evaluation center to assess site-specific, multisector, and multilevel approaches to the prevention and control of childhood obesity among low-income and racially/ethnically diverse children 2 to 12 years old. Our California site implemented evidence-based strategies to modify policies, systems, and environments to promote four health behaviors (healthy eating, PA, water consumption, and quality sleep) in homes, ECE providers, schools, health care settings, and the community. This article describes the implementation and its evaluation among ECE providers. A description and justification for intervention strategies related to the targeted behaviors are in the Method section under “Intervention Strategies.”
Method
Study Design
The intervention protocol and 2 × 2 factorial research design (public health [PH], health care [HC], PH+HC, and control) have been described previously (Ayala et al., 2015). Intervention activities with ECE providers were part of the PH intervention.
ECE Provider Recruitment
The PH intervention took place in two rural cities: Brawley and El Centro, California. Seventy-seven licensed ECE providers were identified, but 47 were excluded because they (a) were located outside the study area, (b) served special children or those outside the study age range, or (c) were participating in another health behavior intervention. Of the remaining 30 providers, one was closed, one was combined with another participating provider, and five declined participation. Among the participating 23 providers (14 center-based, 9 private), 13 participated in the first intervention year (Year 2 of the study) and 10 were enrolled in the second year (Year 3). The center-based providers were affiliated with four different agencies (e.g., Head Start) in Imperial County while the private providers included private, faith-based, and providers without agency affiliations. The overall intervention was delivered in two waves: (a) Wave 1 (13 center-based providers and affiliated agencies) in Years 2 and 3, and (b) Wave 2 (1 center-based provider and its affiliated agency and 9 private providers) in Year 3. To compare the intervention strategies implemented during both years, we present the results by provider type (i.e., center-based vs. private).
Intervention Strategies
The intervention strategies were guided by social cognitive theory (Bandura, 1986) and organizational change theory (Weiner, Lewis, & Linnan, 2009) and we used theory-informed recommendations to modify the policies, systems, and environments to promote the targeted behaviors. For example, to promote active play throughout the day, ECE providers were trained to implement Sports, Play, and Active Recreation for Kids (SPARK; McKenzie, Sallis, Rosengard, & Ballard, 2016), an evidence-based program to promote PA throughout the day in both structured and unstructured formats. A trained health education specialist (HES) from an intervention partner agency, the Imperial County Public Health Department, implemented the intervention strategies described in Table 1.
CA-CORD Intervention Strategies Provided to Agencies and ECE Providers
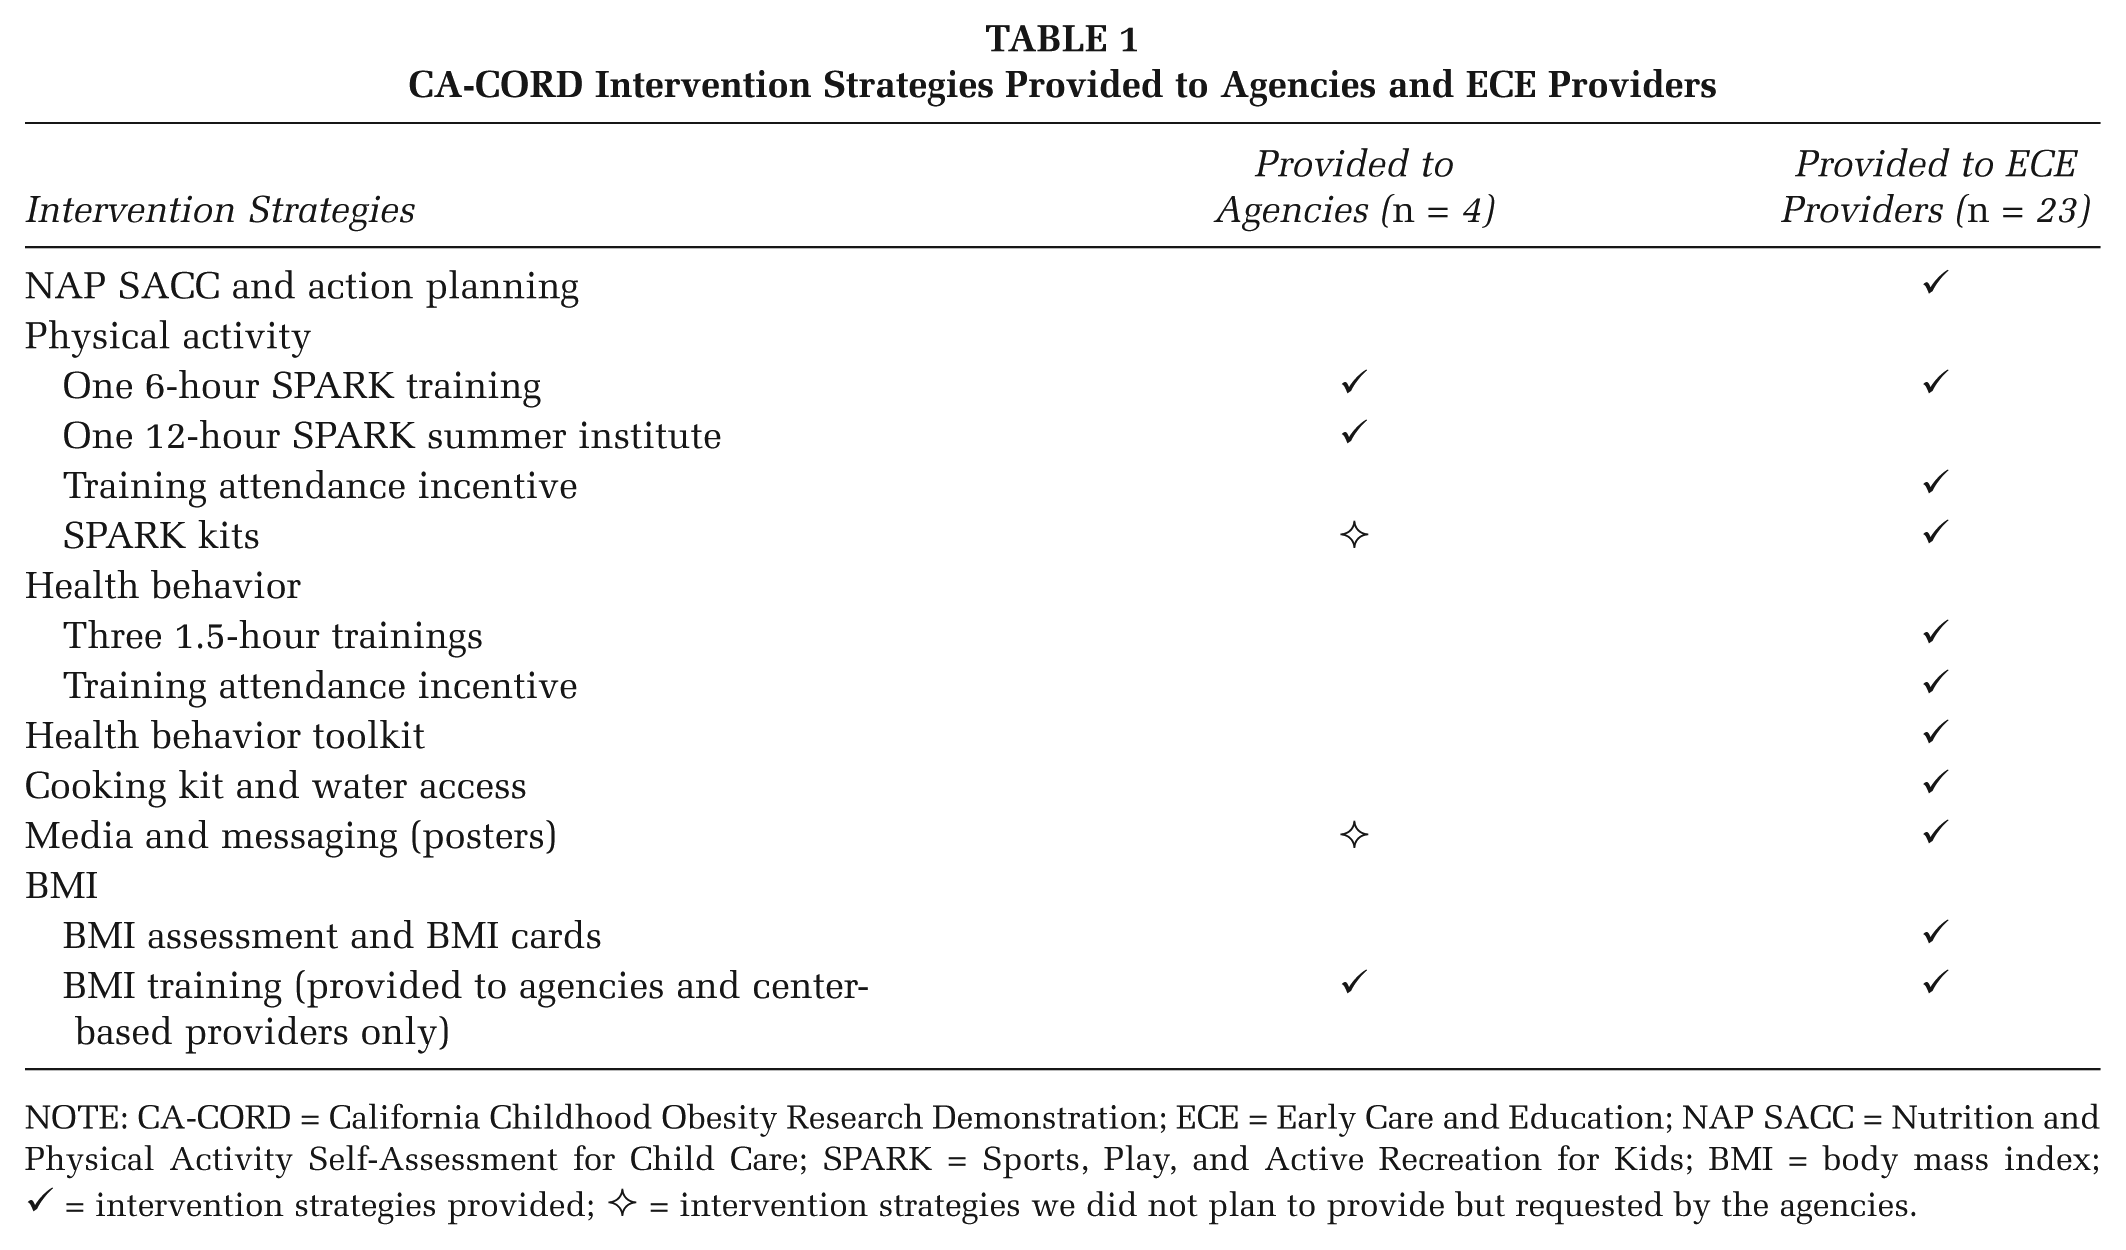
NOTE: CA-CORD = California Childhood Obesity Research Demonstration; ECE = Early Care and Education; NAP SACC = Nutrition and Physical Activity Self-Assessment for Child Care; SPARK = Sports, Play, and Active Recreation for Kids; BMI = body mass index; ✓ = intervention strategies provided; ✧ = intervention strategies we did not plan to provide but requested by the agencies.
Nutrition and Physical Activity Self-Assessment for Child Care (NAP SACC) and Action Planning
NAP SACC (Ward et al., 2014) is an evidence-based strategy that engages ECE providers in promoting healthy lifestyle behaviors to prevent and control childhood obesity through policy, system, and environmental changes (Ammerman et al., 2007). We included the following NAP SACC components: (a) initial and final assessments, (b) four collaborative action planning meetings held over 9 months, and (c) technical assistance by the HES. The initial assessment was conducted by the HES at the beginning of Year 2 for Wave 1 and Year 3 for Wave 2. We conducted the first action planning meetings 2 weeks after the initial assessment, and 3 months later we held a follow-up meeting to review plans, determine progress, and update action plans for the next 3 months. The same pattern occurred once more with a final follow-up meeting. Final assessments for both waves were conducted near the end of Year 3. While the meetings addressed general issues related to intervention strategies, they were tailored to meet the needs of individual ECE providers. During the intervention, ECE providers could also request in-person technical assistance to support the implementation at their setting.
Physical Activity
SPARK is an evidence-based program that provides teachers/recreation leaders with a PA curriculum and accompanying trainings and resources (McKenzie et al., 2016). A 6-hour SPARK training was offered to all ECE providers and agencies. We recommended that one agency staff and all ECE staff (i.e., teachers and site coordinator/director) attend the 6-hour SPARK training in order to learn strategies to increase the quantity and quality of developmentally appropriate PA among children. The providers received a $25 gift card in Year 3 if at least one staff member attended the training. Additionally, each agency selected a champion to participate in a 12-hour SPARK summer institute in Year 2. Finally, we provided two SPARK kits (i.e., SPARK manual, activity cards, CD, and 3-year online Web access) plus PA equipment valued at $400 to each provider to support changes.
Health Behavior Trainings
We offered three 1.5-hour trainings on healthy lifestyles, body mass index (BMI), mindful eating, and PA to ECE providers during Years 2 and 3. These aimed to equip staff to promote health behaviors and integrate the health behavior toolkit materials (see Health Behavior Toolkit section) into lesson plans. We recommended at least one staff member from each ECE provider to attend all three trainings and provided a $25 gift card if at least one staff member participated all trainings. Subsequently, providers could receive up to $100 in gift cards to purchase equipment or materials to support intervention goals if they participated in the 6-hour SPARK training and all three health behavior trainings.
Health Behavior Toolkit
To help staff promote targeted behaviors, each provider received a toolkit including three different sets of educational materials.
Cooking Kit and Water Access
We provided a cooking kit and a water dispenser to each ECE provider. The kit included child-friendly cooking and serving items that promoted child engagement in cooking and serving meals, an evidence-based approach to promote children’s healthy eating (van der Horst, Ferrage, & Rytz, 2014).
Media and Messaging
We developed posters displaying community children engaging in the targeted health behaviors. Our initial plan was to provide 10 copies of eight unique posters (2 per health behavior) to ECE providers; however, the number delivered varied because some providers had limited wall space.
BMI
Trained team members and health department staff assessed the height and weight of enrolled children at each ECE provider. Caregivers provided consent for these measures, and internal audits were completed to ensure standardization and accuracy. The results were plotted on BMI-for-age percentile growth charts, and we provided the information on cards to caregivers. Also, we offered a 2-hour BMI training to all center-based providers and affiliated agencies in Year 3. The goal was to enable staff to measure height and weight accurately, and all staff from center-based providers and at least one agency staff member were recommended to attend the training.
Process Evaluation Data and Measures
Data Sources
Data were obtained from intervention logs and ECE director/lead teacher interviews.
Planned dose/dose received. Planned doses are described in the Intervention Strategies section. Dose received includes the number of (a) NAP SACC action planning and follow-up meetings received, (b) staff attending the 6-hour SPARK training, (c) SPARK kits received, (d) staff attending all three health behavior trainings, (e) gift cards received for attending the SPARK and health behavior trainings, (f) cooking kit and water dispensers received, (g) posters received, (h) children assessed for BMI, (i) BMI information cards personally handed to caregivers, and (j) staff attending BMI trainings.
Fidelity
This was operationalized as the percentage of dose received divided by the planned dose.
Contact Hours
Contacts between research staff and ECE provider staff were recorded as hours of in-person visits, other contact types (telephone, mail, and e-mails), and total hours.
ECE Director/Lead Teacher Interviews
We conducted interviews with the director or lead teacher of each ECE provider at baseline and at 24 months postbaseline. Baseline interviews focused on ECE provider characteristics and operations while the postbaseline interviews focused on reports of how well trainings and materials enabled activities to achieve project goals. Respondents rated (a) how well the SPARK and health behavior trainings prepared them to implement activities (0 = not at all well to 3 = very well), (b) how easy it was to use the health behavior toolkit (0 = hard to use to 3 = very easy to use), and (c) how well intervention-related activities and materials helped them promote the four health behaviors (0 = not very well to 3 = very well). In addition to these quantitative assessments, we collected qualitative information regarding factors affecting intervention implementation and reported elsewhere (Chuang et al., 2015).
Data Analyses
Descriptive statistics were obtained to report ECE provider characteristics by provider type, fidelity, and contact hours as well as directors’/lead teachers’ assessments of activities and materials. To compare differences between provider types, both Fisher’s exact test (categorical items) and two sample t tests (continuous items) were used. Medians and ranges for planned dose, dose received, and fidelity by provider type are presented because ranges for the variables were wide.
Results
ECE Provider Characteristics
Table 2 describes the characteristics of the center-based and private ECE providers. Only one characteristic differed significantly between provider types: Private providers were more likely to offer both full- and half-day child care.
Early Care and Education Provider Characteristics by Provider Type at Baseline (N = 23)
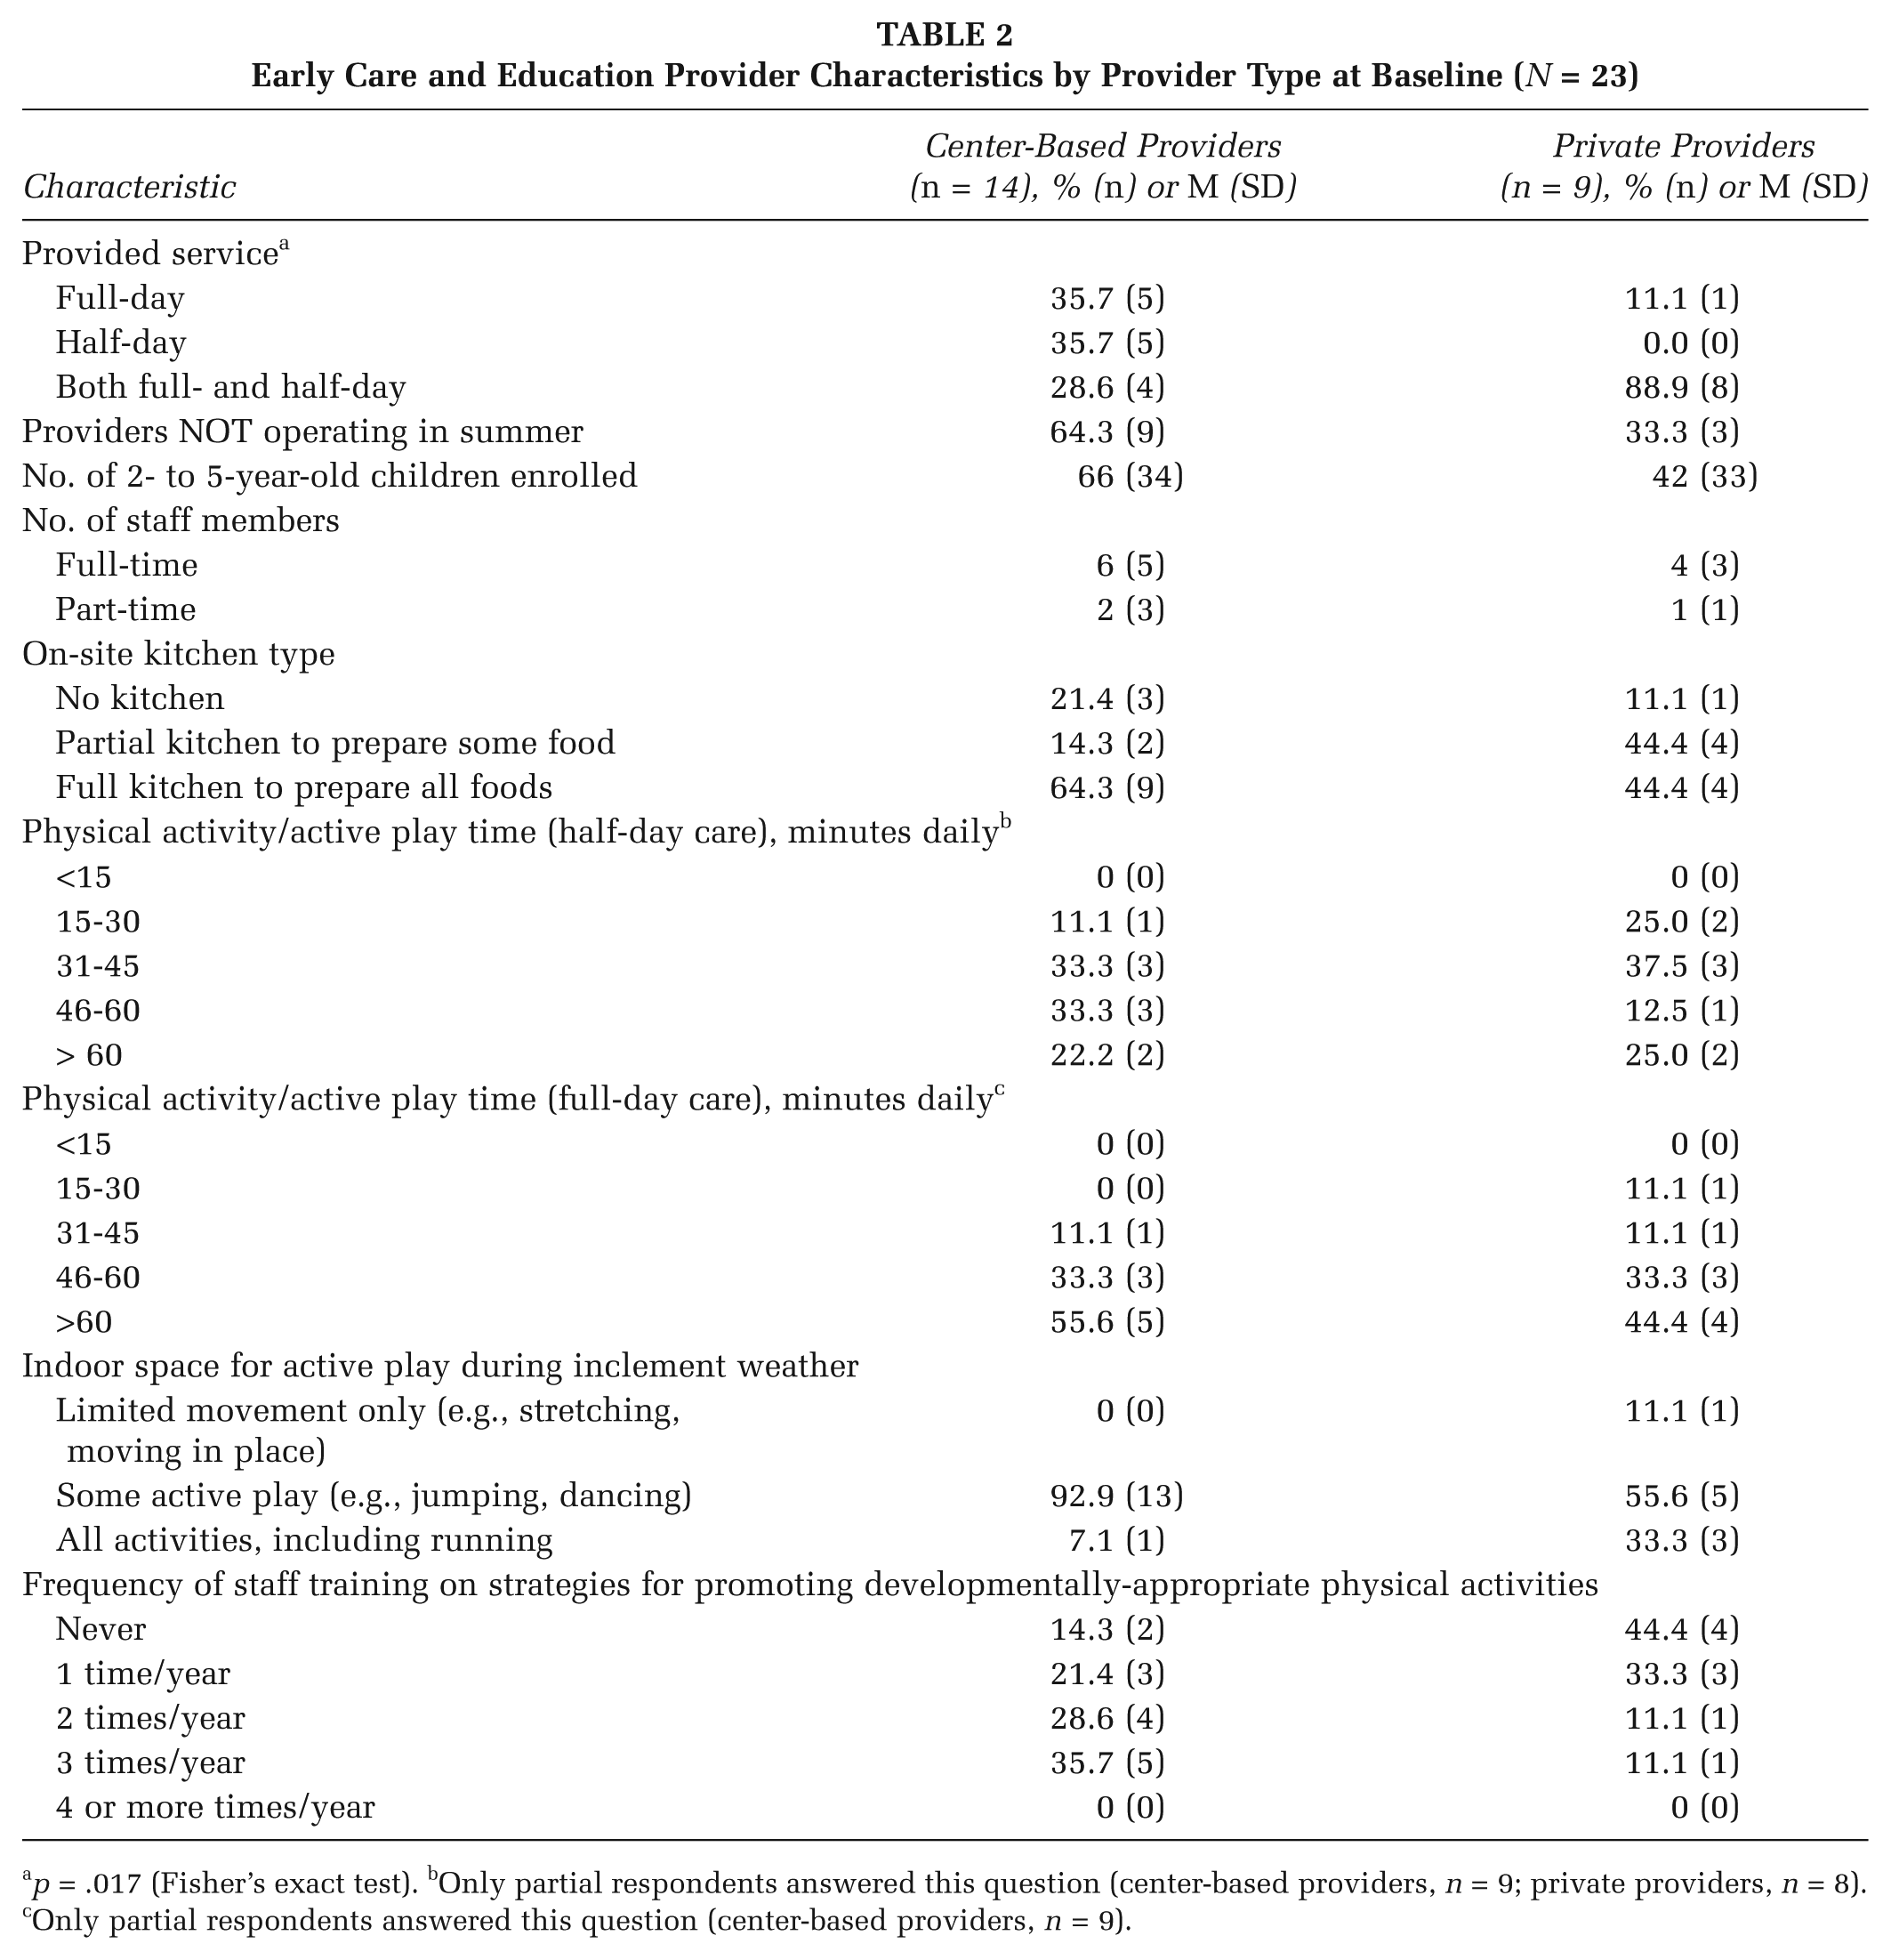
p = .017 (Fisher’s exact test). bOnly partial respondents answered this question (center-based providers, n = 9; private providers, n = 8). cOnly partial respondents answered this question (center-based providers, n = 9).
Intervention Fidelity and ECE Director/Lead Teacher Evaluation of Intervention Strategies
Table 3 displays medians and ranges for planned dose, dose received, and the fidelity of intervention strategies by provider type and agencies. Because more staff were exposed to certain intervention strategies than originally planned, a fidelity exceeding 100% was possible. Thus, a median of 100% fidelity does not always mean all providers received the full dose.
Median and Range of Planned Dose, Dose Received, and the Fidelity of Implementation of Intervention Strategies by Agencies and Provider Types
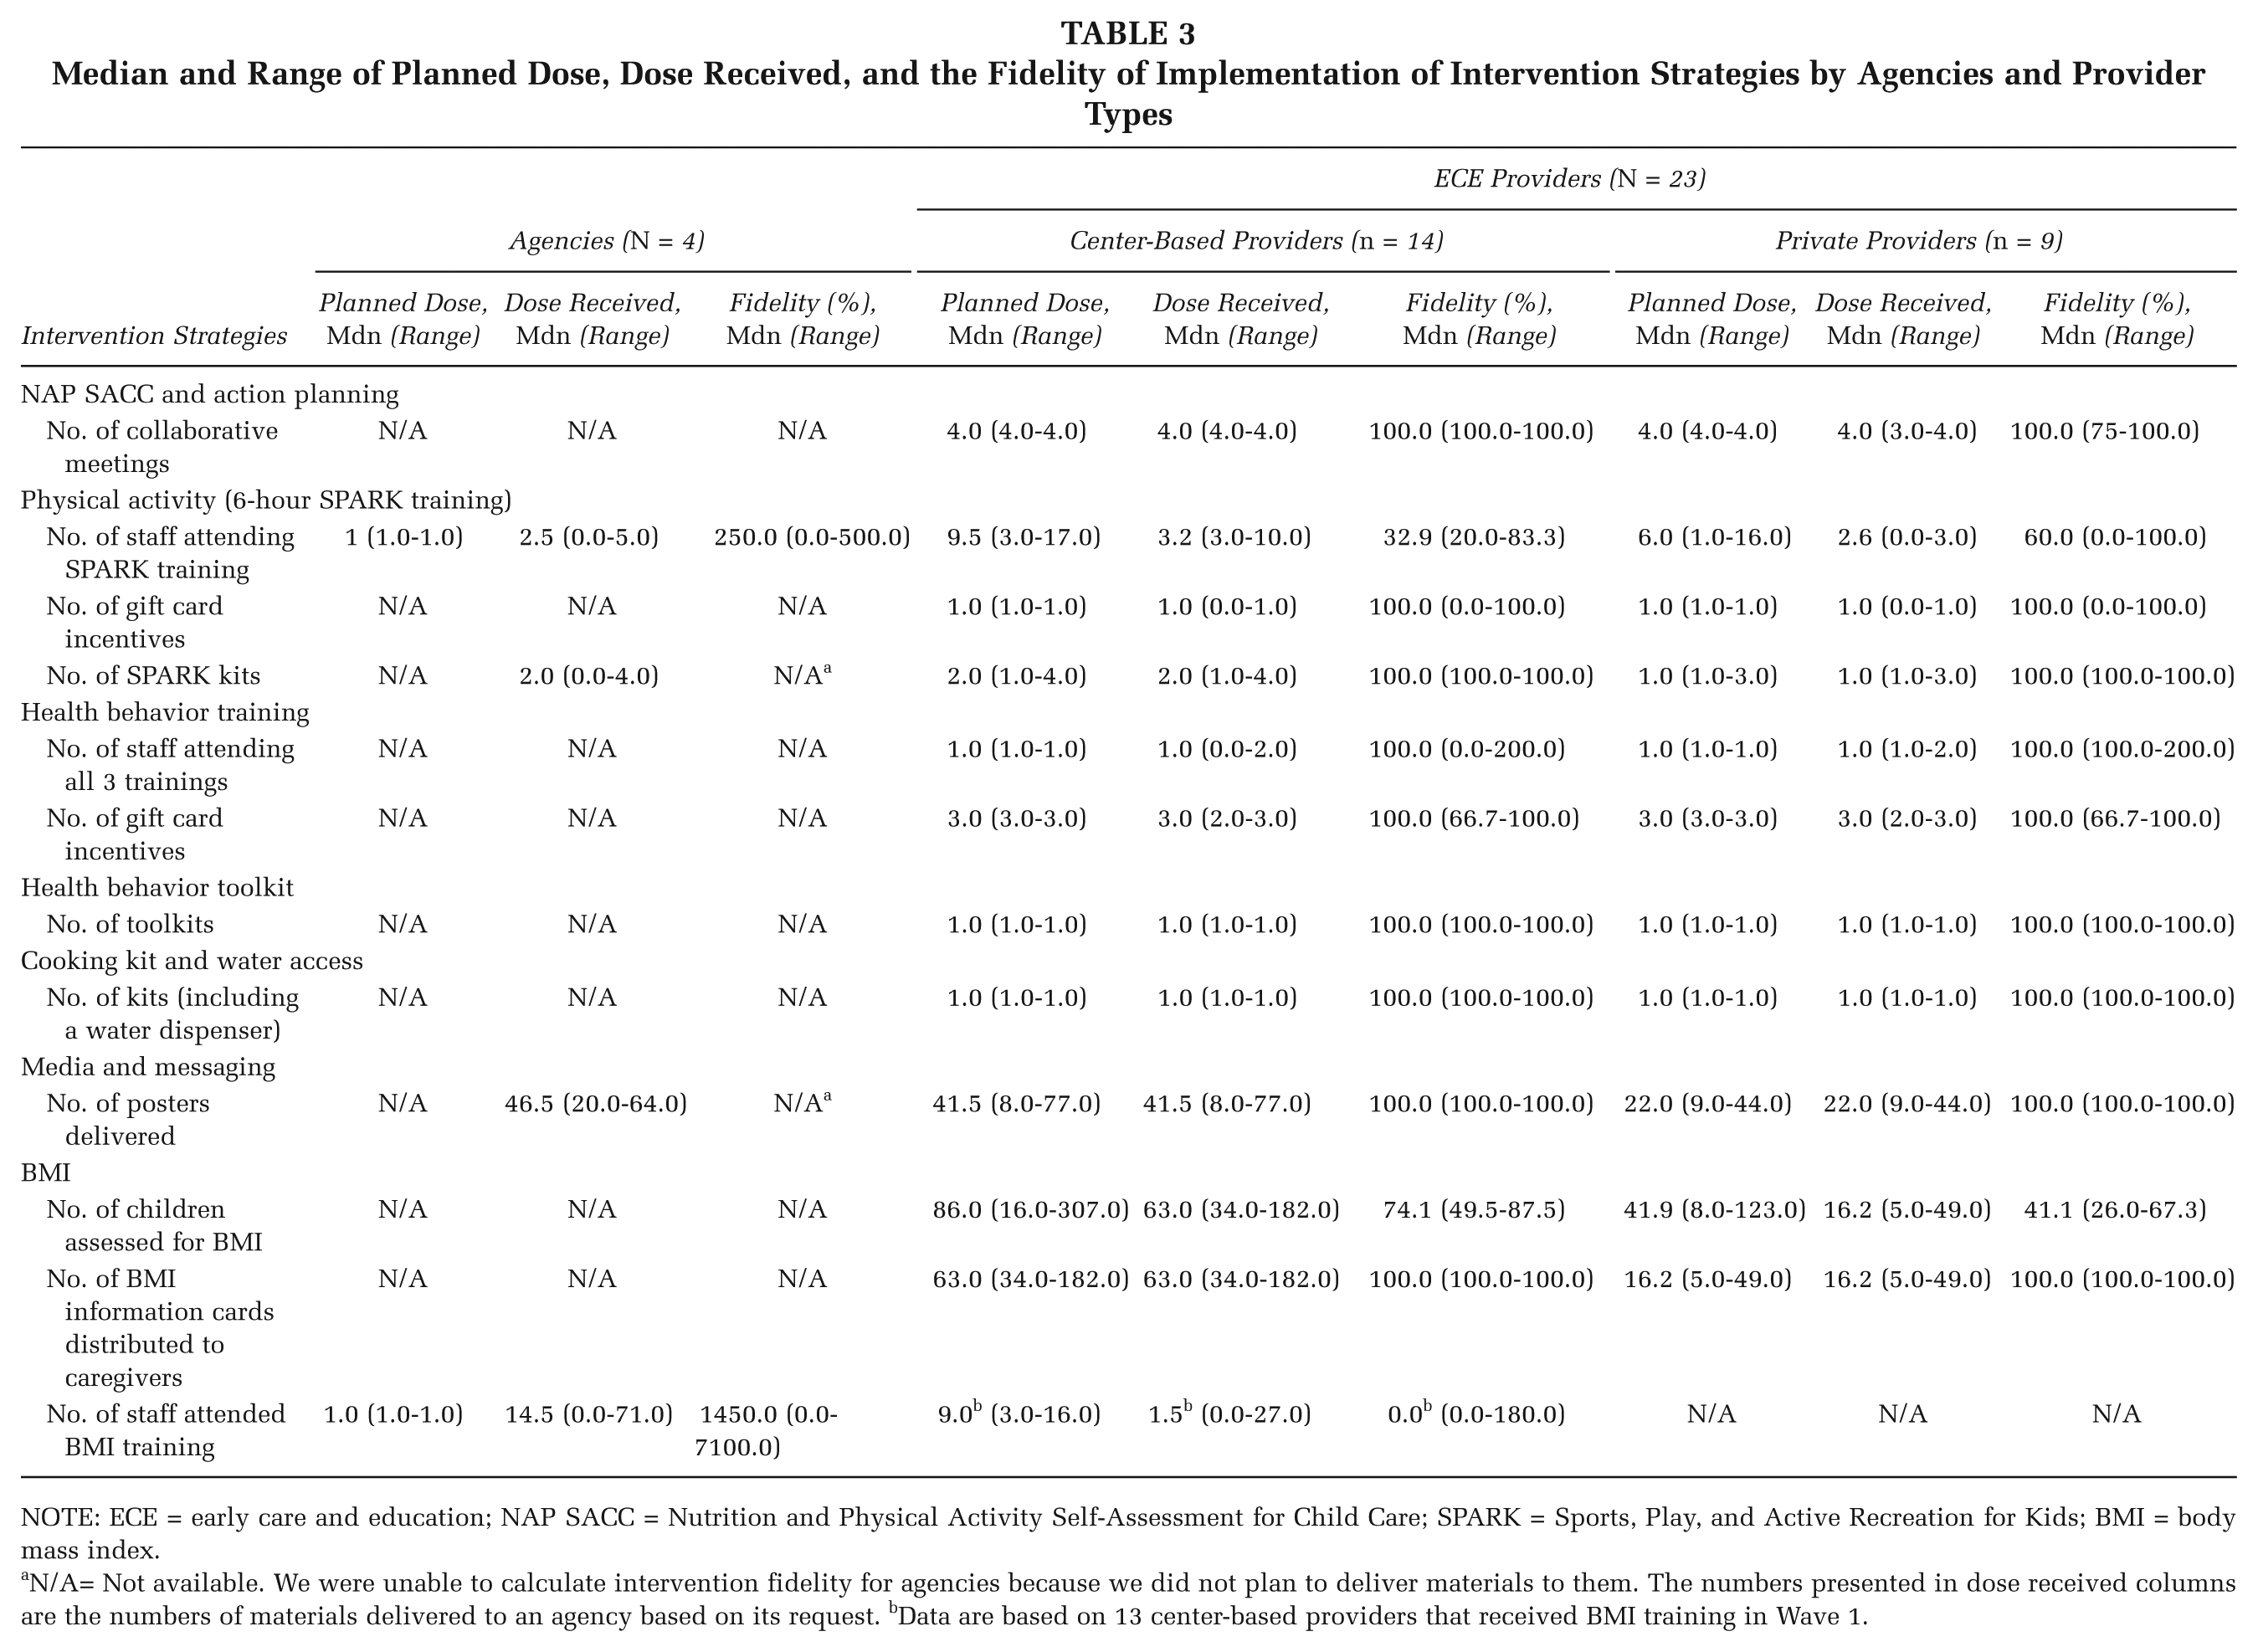
NOTE: ECE = early care and education; NAP SACC = Nutrition and Physical Activity Self-Assessment for Child Care; SPARK = Sports, Play, and Active Recreation for Kids; BMI = body mass index.
N/A= Not available. We were unable to calculate intervention fidelity for agencies because we did not plan to deliver materials to them. The numbers presented in dose received columns are the numbers of materials delivered to an agency based on its request. bData are based on 13 center-based providers that received BMI training in Wave 1.
NAP SACC and Action Planning
With the exception of two private ECE providers that were closed for the summer during final follow-up meetings, all providers received initial and final NAP SACC assessments and all four collaborative meetings.
Physical Activity
Although two private ECE providers had low fidelity (0% to 6%), the median fidelity for SPARK training was greater among private providers (60%) than center-based providers (32.9%). Regarding four agencies, two participated in both the 6-hour SPARK training and the SPARK summer institute, one participated just the summer institute, and one received no training (data not shown). Although the median fidelity for the 6-hour SPARK training incentive was 100% for both provider types, three center-based providers and one private provider did not receive an incentive because their trainings were not completed on time. All providers received their PA equipment (data not shown) and SPARK kits. Although we did not plan to provide agencies with SPARK kits, three agencies received them during the SPARK trainings or SPARK summer institute. Table 4 shows that both center-based and private providers felt the SPARK trainings prepared them well or very well to implement the activities.
ECE Directors’/Lead Teachers’ Evaluations of Intervention Strategies 24 Months Postbaseline (N = 23)
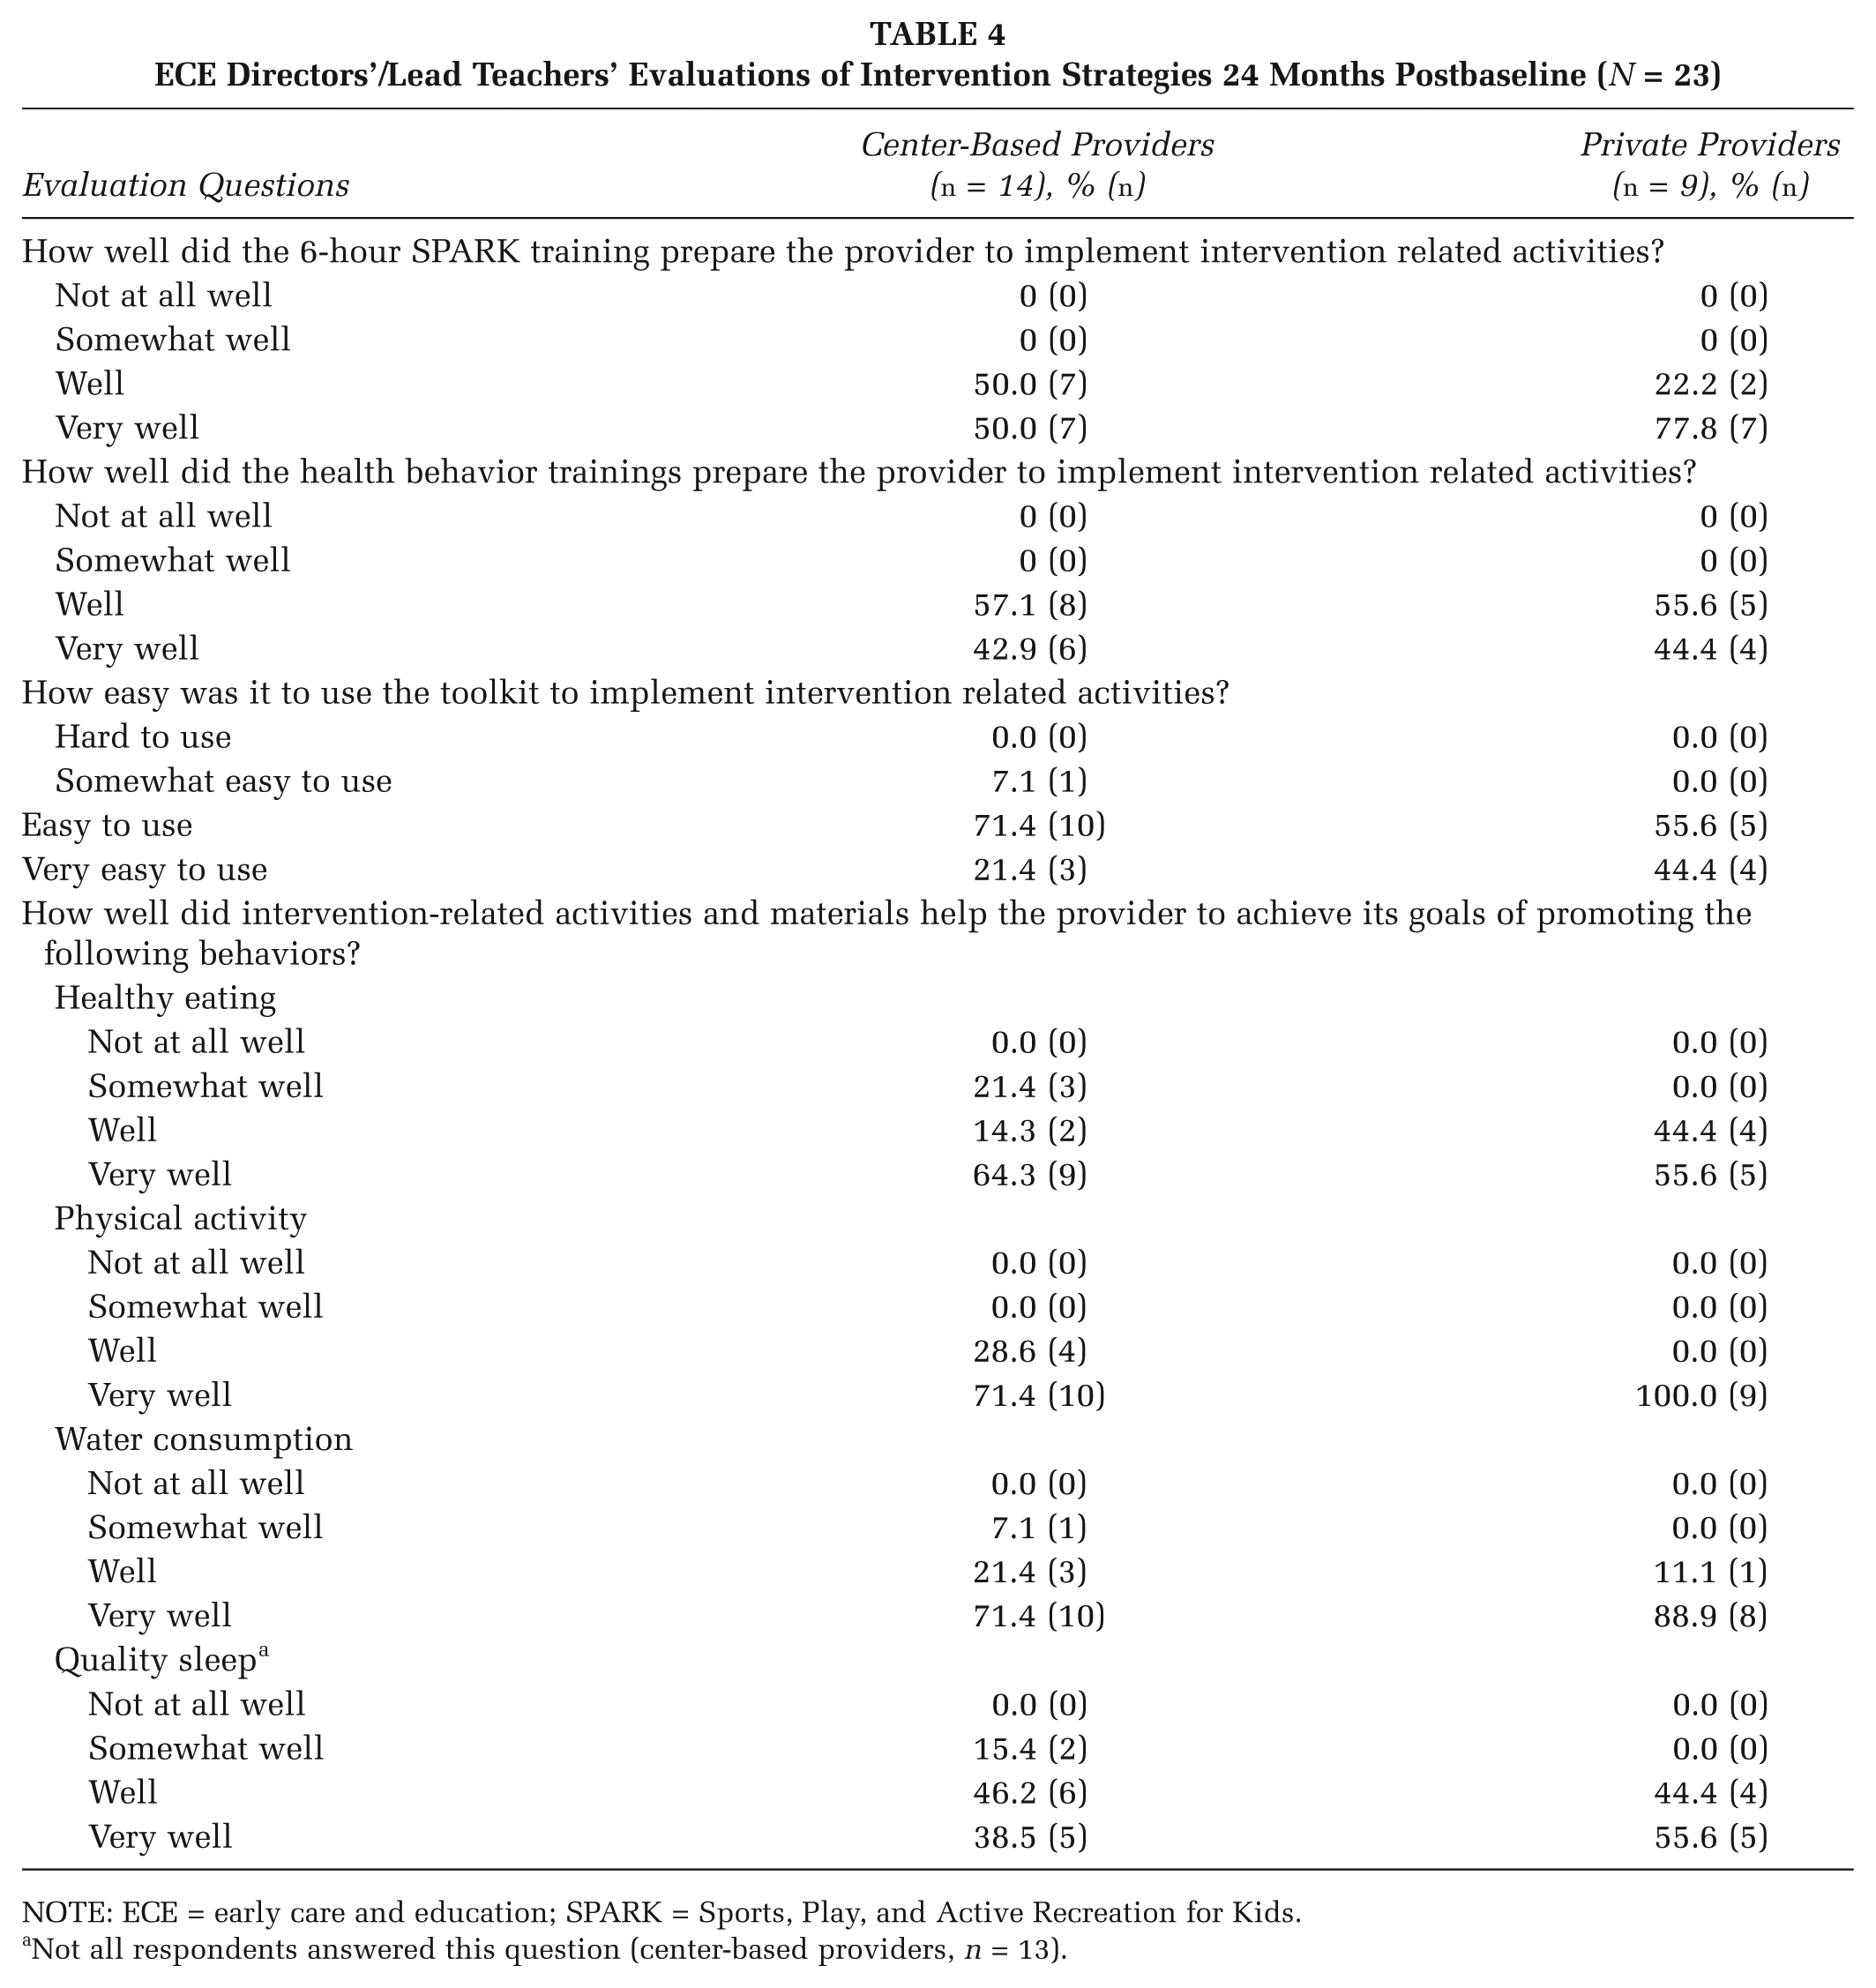
NOTE: ECE = early care and education; SPARK = Sports, Play, and Active Recreation for Kids.
Not all respondents answered this question (center-based providers, n = 13).
Health Behavior Trainings
While the median fidelity for both center-based and private ECE providers was 100%, the fidelity score for some providers was 100% or more, indicating that more than one staff member (the minimum number recommended) attended all three trainings. Three center-based providers had a 0% fidelity because they did not have at least one staff attending all three recommended trainings. All providers with any staff attending three trainings received 100% of the incentive; however, five providers received only 67% of the incentive because their trainings were not completed on time. Table 4 shows that all directors/lead teachers across ECE provider types reported that the health behavior trainings prepared them to implement the intervention activities well or very well (100%)
Health Behavior Toolkit, Cooking Kit, and Water Access
All ECE providers received the health behavior toolkit, cooking kit, and a water dispenser. Table 4 indicates that all private provider directors/lead teachers and the majority of center-based directors/lead teachers (93%) reported that the health behavior toolkit was easy or very easy to use.
Media & Messaging
All providers received the number of posters requested. While we did not plan to provide posters to agencies, all four received posters requested.
BMI
Although the fidelity for BMI assessments ranged widely (26% to 88%), the center-based providers had a higher median fidelity score (74.1%) than private providers (41.1%). Nonetheless, all providers reported distributing the BMI information cards to 100% of caregivers whose child had completed a BMI assessment. Given resource limits during Year 3 intervention, BMI training was provided to only 13 of the Wave 1 center-based providers and their affiliated agencies. The median fidelity for the agencies was high (1450%) because two agencies had unexpectedly high fidelity (100% or more; training was made available to all agency staff rather than our original plan of training only staff providing direct care to children). Staff from six center-based providers attended the training; however, because more than half the center-based providers did not participate (0% fidelity), the median fidelity was 0%. The mean fidelity for BMI training was 54.3% (SD = 66.7; data not shown) for the center-based providers.
ECE Director/Lead Teacher Evaluation of Intervention Strategies
Nearly all directors/lead teachers reported that intervention-related activities and materials helped them promote the health behaviors well or very well (Table 4). The exceptions were a small number of center-based directors/lead teachers who reported that the activities and materials helped them “somewhat well” to promote healthy eating (21.4%), water consumption (7.1%), and quality sleep (15.4%).
Contact Hours
Center-based providers received more contact hours with the research staff than private providers (M = 66.2, SD = 21.9 vs. M = 37.0 hours, SD = 9.9, respectively), primarily because of their participation in additional BMI training. Our contact hours with agencies were much lower (M = 35.2, SD = 12.7) than with ECE providers because we provided the former only three intervention strategies. Nonetheless, contact time with agencies was more than expected because the approval to implement activities with center-based providers required substantial management and administration interactions. In-person contact time (center-based, M = 65.7 hours, SD = 21.9; private, M = 36.4 hours, SD = 9.8; agencies, M = 33.2 hours, SD = 12.7) was more frequent than other contact types for both provider types and agencies.
Discussion
Given the widespread use of out-of-home child care and Hispanic/Latino children being disproportionally affected by obesity in the United States, it is imperative to assess the conduct of childhood obesity prevention and control interventions in ECE settings. The results indicate that the intervention was delivered with fidelity, with some strategies delivered with greater fidelity depending on ECE provider type. Additionally, ECE directors/lead teachers reported that the activities and materials supported the intervention and helped promote the four targeted health behaviors with children and parents.
NAP SACC was implemented with high fidelity, and the high scores could be attributed to the collaborative nature of the intervention activities, their organization and ease of use, and the minimal time required of the ECE staff (Ammerman et al., 2007). The substantial technical assistance we provided may have been a motivating factor for ECE staff to complete NAP SACC in their setting. In a previous study, ECE providers also indicated that consultant assistance was one of the most beneficial components of the NAP SACC program (Martin, Martin, Cook, Knaus, & O’Rourke, 2015).
More private than center-based providers (44% vs. 14%) had not previously implemented PA trainings for staff. Similarly, in interviews with key project leaders and stakeholders, center-based providers indicated that they had previous experience promoting healthy behaviors such as Head Start’s “I Am Moving, I Am Learning” initiative (Chuang et al., 2015). Notwithstanding this lack of exposure to promote PA, private providers had a greater median fidelity score for the SPARK trainings compared to center-based providers, and they rated SPARK trainings more favorably in preparing them to implement intervention activities. Therefore, staff from private providers may have been more motivated to attend SPARK trainings because they had no previous PA training. Future research should examine whether previous experience with PA training is related to ECE providers attending such training.
Only 3 of the 23 providers did not receive the planned dose for the health behavior trainings. Overall, directors/lead teachers were satisfied that the trainings prepared them well for intervention activities. Fidelity scores for the health behavior trainings were higher than the SPARK training, perhaps because they were shorter and held during working hours. SPARK trainings were longer (6 hours) and scheduled on Saturdays, which may have deterred staff from attending. Future implementations should consider providing trainings across multiple short sessions, holding them during working hours, and offering refresher courses.
The provision of the health behavior toolkit, cooking kit, water dispenser, and posters had excellent fidelity. This finding is consistent with the ECE directors’/lead teachers’ report that the intervention materials and activities prepared them well or very well to promote the targeted health behaviors, especially PA and water consumption.
Children’s BMI assessment was not implemented as well as planned, but center-based providers had better fidelity scores than private providers. Some center-based providers were affiliated with two agencies that already had policies to collect children’s BMI, and thus, they were more familiar with the routines and expectations. Dispensing BMI information cards to caregivers was implemented with 100% fidelity among all providers. Over half the center-based providers and half the agencies had 0% fidelity for BMI training because they did not accept the offer for BMI training. These agencies and affiliated providers did not have a policy that requires BMI collection, and thus, they were less motivated to schedule agency-wide BMI training for agency- and provider-level staff. Additionally, one agency opted to not schedule BMI training because of staff turnover.
This study has several limitations. First, regardless of the type of training/ECE provider, a barrier to our intervention efforts was that as an external agent we could not “require” ECE providers to attend trainings or fully comply with proposed activities. Second, although 100% of intervention materials were delivered to ECE providers, we did not assess how well teachers incorporated materials into their activities/lessons. We designed a “Lesson Tracking” form for ECE staff to complete; however, they did not always complete it. Future implementers should consider (a) designing a lesson tracking form that aligns with existing required forms and (b) using applications and other e-methods to capitalize on the ability of tablet/mobile devices to collect process evaluation data. Finally, full implementation of tracking of poster deliveries only occurred by the beginning of Year 3; thus, the total number of posters delivered may be underreported. Additionally, we tracked only the numbers delivered to providers, without tracking the numbers displayed on walls. Similarly, tracking the frequency and duration of contacts was not fully implemented until the beginning of Year 3, resulting in an underrepresentation of contact hours during Year 2.
Conclusions
Our process evaluation of this ECE intervention can be used by public health practitioners working on obesity prevention and control with young children. Overall, the results show high fidelity across all intervention strategies, thus providing an indication of the potential replicability. Comparison of intervention implementation by center-based versus private providers also contributes valuable information. For example, we found that more time and labor were needed to sufficiently interact with center-based providers because implementation of activities involved additional layers of management and administration. Documenting the amount of technical assistance that providers/agencies received is valuable (e.g., how to use resources, materials, and equipment provided to ECE providers), as it provides estimated time and labor needed to complete the intervention.
Recognizing the assets and resources that ECE providers bring to an intervention will help determine the most feasible way to integrate evidence-based policy, system, and environmental strategies to promote health behaviors. To design an effective intervention, ECE providers with less capacity are encouraged to target fewer health behaviors at once but focus on multiple levels (i.e., policy, system, and environment) of change. A provider with more capacity should also consider involving parents in SPARK/health behavior trainings to reinforce the health behaviors at home. Finally, ECE providers in low-resource environments are especially encouraged to partner with other entities, such as Parks and Recreation Departments and the Departments of Exercise and Nutrition in community colleges and universities.
Footnotes
Authors’ Note:
We would like to thank the early care and education (ECE) providers and agencies; ECE working group, families, study partners; and California Childhood Obesity Research Demonstration (Our Choice) team members for making this study possible. This research was supported by the Centers for Disease Control and Prevention, National Center for Chronic Disease Prevention and Health Promotion, Award No. U18DP003377.