
Abstract
Students with chronic health conditions miss more school days than their peers and are at increased risk for performing worse on standardized tests and not completing a high school degree. University-based researchers, state government leaders, and a local county school system collaborated to use existing health and academic data to (1) evaluate the strength of the relationship between health status and school performance (absenteeism, grades) and (2) describe the health status of students who are chronically absent. Analyses included descriptive statistics, chi-square tests, negative binomial regression models, and estimated marginal means. The most common health conditions among the 3,663 kindergarten through Grade 12 students were ADD (attention deficit disorder)/ADHD (attention deficit hyperactivity disorder), asthma, migraine headaches, mental health conditions, and eczema/psoriasis/skin disorders. After controlling for covariates, having asthma or a mental health diagnosis was positively associated with absences; and having an ADD/ADHD or mental health diagnosis was negatively associated with GPA (grade point average). Chronically absent students had significantly lower GPAs, and a higher number of health conditions than other students. The success of this demonstration project encourages strengthening existing collaborations and establishing new multidisciplinary partnerships to analyze existing data sources to learn more about the relationship between student health and academic achievement. Moreover, connecting health status to academic achievement might be a chief tactic for advocating for additional resources to improve the care and management of chronic disease conditions among students.
Introduction
Health status can directly influence a child’s academic performance (Basch, 2011; Bradley & Greene, 2013; National Center for Chronic Disease Prevention and Health Promotion, 2014). Promoting good health through eating breakfast, having a balanced diet, and getting sufficient sleep is associated with improved grades, higher standardized test scores, reduced absenteeism and tardiness, and better cognitive performance and attention (Burrows, Goldman, Pursey, & Lim, 2017; Dewald, Meijer, Oort, Kerkhof, & Bögels, 2010; National Center for Chronic Disease Prevention and Health Promotion, 2014; Stroebele, McNally, Plog, Siegfried, & Hill, 2013).
The connection between health and wellness and academic performance is even more important for students with chronic health conditions since they miss more school days than their peers and are at increased risk for not completing a high school degree (Champaloux & Young, 2015; Crump et al., 2013). These students are also at risk for performing worse on standardized tests than students without chronic health conditions, even when accounting for absences (Crump et al., 2013).
The important role that health plays in academic achievement is highlighted in the collective effort of the Centers for Disease Control and Prevention (CDC) and the Association for Supervision and Curriculum Development to merge two independent efforts, the CDC’s Coordinated School Health Program and Association for Supervision and Curriculum Development’s Whole Child Approach, into a single, more comprehensive model (Lewallen, Hunt, Potts-Datema, Zaza, & Giles, 2015). The resulting model, named Whole School, Whole Community, Whole Child (WSCC), aligns the common goals of both the health and education sectors with a student-focused, health-based plan for promoting academic achievement (CDC, 2019). Schools, communities, and health professionals are encouraged to collaborate on 10 components: health education; nutrition environment and services; employee wellness; social and emotional school climate; physical environment; health services; counseling, psychological, and social services; community involvement; family engagement; and physical education and physical activity. With increasingly widespread adoption of this model (Chiang, Meagher, & Slade, 2015; S. M. Lee et al., 2019), school systems are recognizing that health and education both affect individuals, society, and the economy and must work together whenever possible.
With regard to specific chronic health conditions, students with asthma, and particularly those with severe symptoms, miss more days of school than those without asthma (Moonie, Sterling, Figgs, & Castro, 2006; Tsakiris et al., 2013). Chronic absenteeism is linked to poor grades and delayed high school graduation (Allensworth & Easton, 2007; Smerillo, Reynolds, Temple, & Ou, 2018) and has been identified to be a warning sign for mental health problems, particularly when health reasons for absences are vague or nonspecific (DeSocio & Hootman, 2004; Wood et al., 2012). There is strong evidence that childhood physical and behavioral health issues interact to result in decreased academic achievement (Basch, 2011; Bradley & Greene, 2013; Liu, Huang, Kao, & Gau, 2017; Molina et al., 2009; National Center for Chronic Disease Prevention and Health Promotion, 2014).
Theoretical models in the educational literature to explain academic success have traditionally not emphasized the impact of student health or health-risk behaviors. Academic success is viewed as the function of the interaction between distal influences such as socioeconomic status; school resources; proximal influences such as parental expectations, peer influences, and school climate; as well as interpersonal influences such as motivation (Clark, Lotto, & Astuto, 1984; Galindo & Sheldon, 2012; V. E. Lee & Bryk, 1989; Ryan & Deci, 2002; Sirin, 2005; Stewart, 2008). As more and more empirical research studies demonstrate the positive impact of certain health promotion behaviors (e.g., eating breakfast, getting sufficient sleep) and the negative impact of chronic disease conditions on academic outcomes, integration of health factors into these existing theories will be needed. Conceptually, there are two main reasons why students with chronic health conditions might be at heightened risk for academic problems. First, severity matters. The more severe the symptoms, the more likely it is that a child will miss school or not feel well when they are in the classroom, therefore compromising their ability to concentrate on the material being presented. Second, the way the chronic health conditions are managed appears to have a substantial bearing on whether or not the child will experience academic problems. For example, among children with type 1 diabetes, poor glycemic control was linked to missing school, and poor test performance (Cooper, McNamara, de Klerk, Davis, & Jones, 2016). In short, the research evidence strongly suggests that successful management of chronic health conditions can lead to better academic outcomes.
Collecting student-level academic and health information is important for developing a data-informed approach to supporting student success (Rooney, Videto, & Birch, 2015). A better understanding of the relationships among the presence of childhood chronic health conditions, the clinical management of those chronic health conditions, and academic variables will facilitate more comprehensive solutions, and ultimately help students achieve their full potential.
Background
Experiences of Other Communities
The extent to which integration of academic records and student health data is occurring routinely in school systems is unknown, and there are very few examples in the research literature. A 2013 report documented the experiences of Cincinnati, East Baton Rouge, Miami–Dade County, and Seattle in linking data sets from school-based health centers (SBHCs) and schools (Wright, Zimmerman, & Knott, 2013). Each community was at a different point on the continuum of linking health data with academic data. Some communities experienced considerable success from their comprehensive efforts to monitor and manage chronic health conditions. For example, the graduation rate among all high school students in Cincinnati Public Schools increased from 51% in 2000 to 83% in 2009. In this example, PowerSchool®, a web-based student information system, was used to link academic data (i.e., students’ sociodemographic data, attendance, disciplinary actions, grade point average [GPA], class grades, and test scores) to a subset of health data from SBHCs using the student’s identification number. The health data that are entered from school nurses are “partitioned and blocked from the academic data for nonauthorized users such as school staff unless consent is obtained.” Since health data are entered into a student’s record, they are portable (e.g., available at a new school after a move) and retained over time. Information regarding the presence of chronic health conditions (e.g., asthma, ADD [attention deficit disorder]/ADHD [attention deficit hyperactivity disorder]) is obtained from parents at student enrollment using a student health form (Wright et al., 2013).
In East Baton Rouge, some SBHC data are linked with academic outcomes. The “Department of Public Health’s mandate for documentation of psychosocial treatment plans for students showing poor academic performance” spurred an examination of academic outcomes for students “who received mental health therapy” (Wright et al., 2013, pp. 14-15). In this case, the data are manually linked without the use of a system like PowerSchool®. Data analyses showed that the grades of 30% of students “who receive mental health therapy improve by the end of the school year” (Wright et al., 2013, p. 17). The community attributes these improvements to their “ongoing work to standardize clinical protocols in mental health care” (Wright et al., 2013, p. 17) and hopes to refine and expand the system to link other types of health data to academic data in the future. One of the challenges noted in the East Baton Rouge description was that schools do not necessarily collect attendance data in the same way, and thus, this variable needed to be transformed in a standardized way before conducting analyses.
The experience of Miami–Dade County provides an example of barriers to linkage and analysis of academic and SBHC data. Clinical data, including data from student visits to school nurses or SBHCs, as well as results from mandatory screening for vision and body mass index (BMI) are available in one system. Students’ state standardized test scores, demographic information, and attendance data are also available. However, these data were not yet linked “because of limitations in the staff time needed to develop the algorithms to integrate them with the existing health data” (Wright et al., 2013, p. 22).
Finally, Seattle developed a system in 2005 to link SBHC data with demographic and academic data. Considered to be one of the most comprehensive efforts to link SBHC and academic data, this linked data system has enabled “the availability of evidence-based data to support and guide practice and policy decisions county-wide, and the data needed to measure the impact of investments in SBHCs on academic outcomes” (Wright et al., 2013, p. 26).
It is important to note that SBHCs might benefit from specific confidentiality regulations that do not apply to school systems that do not have SBHCs. Privacy and confidentiality guidelines from school systems with SBHCs could help guide other schools in establishing the necessary confidentiality requirements for linking health and academic data.
Leveraging an Existing Data System
With CDC funding, the Maryland Department of Health (MDH) began a state project called the “Healthy Schools Dashboard.” Together with academic partners at the University of Maryland School of Public Health (UMD SPH), potential partners were sought to demonstrate the conceptual framework that they had been developing to link student health and academic data. The MDH’s Healthy Schools Dashboard aimed to assist local schools and communities in Maryland to (1) prioritize school improvement activities; (2) integrate health and academic data indicators to measure and track student health and academic outcomes; and (3) collect and share aggregated data between local school systems and community organizations addressing child and community health indicators.
Because of the known integration capabilities of its student information system, PowerSchool®, Garrett County Public Schools (GCPS) was selected as a potential partner for this demonstration project. Garrett county is a designated rural county and located in the westernmost part of the State of Maryland. GCPS is composed of 12 schools covering kindergarten (K) through Grade 12.
When approached, GCPS was very enthusiastic about collaborating with MDH and UMD SPH, to understand the possible relationships between chronic health conditions of students and academic performance. The two aims of the analyses were to (1) evaluate the strength of the relationship between health status and academic performance as measured by absenteeism and grades, both with and without adjustment of covariates, including sociodemographic characteristics and (2) describe the health status of students who are chronically absent. We hypothesized that students with chronic health conditions would have lower GPAs and more absences than students without chronic health conditions. We further hypothesized that the prevalence of chronic health conditions would be higher among chronically absent students, compared with students who miss fewer school days.
Method
The software program PowerSchool® used by GCPS allows school personnel to enter and manage data on students’ sociodemographic characteristics, contact information, health conditions, and academic outcomes. The software has integration capabilities and was enhanced to meet the needs of the GCPS system. Health and academic information is entered and updated continuously throughout the academic year. Sociodemographic characteristics are reported by parents/guardians on enrollment or updated by parents/guardians annually.
GCPS shared with the UMD SPH a single file exported from PowerSchool® containing linked health, academic, and sociodemographic variables for each student from the 2016-2017 academic year. No student identifiers (e.g., name, date of birth) were included in the data set. All data received by the UMD SPH were anonymous. A data use agreement was signed by GCPS and the UMD SPH. The MDH Institutional Review Board approved the Healthy Schools Dashboard Project. The University of Maryland Institutional Review Board determined that the analysis of GCPS data was not human subjects research.
Measures
Health Conditions
Information on health conditions is based on a mixture of self-reported information from parents/guardians and students, and documentation from providers to the school nurse. The nurse follows up on health conditions that are self-reported by students. Data were provided for the presence of 32 health conditions (blank cells were presumed to indicate the absence of the condition). An “any mental health condition” variable was created using information from six condition-specific variables (anxiety, depression, eating disorder, self-harm, suicide attempts, and “other” mental health) to indicate the presence of at least one mental health condition. Mental health conditions are often not reported to the school at the time of diagnosis; rather the nurse follows up from the parents’ report of medication taken at school and home. Mental health diagnoses are therefore underreported.
Academic Outcomes
GPA was provided for students in Grades 3 through 12. Students in Grades K-2 do not receive numerical grades and therefore do not have a GPA. GPA was cumulative for the academic year and was a continuous variable measured on a standard 4.0 scale.
Absences were also provided as a continuous variable. The variable provided the total number of absences during the academic year and was counted in half-day increments. Students were categorized as “chronically absent” if they missed 20 or more days of school. The 20-day cut-off was utilized to align with the Maryland State Department of Education’s definition of chronic absenteeism (Maryland State Department of Education, 2018). Two dichotomous variables were provided to indicate whether or not the student was enrolled in a special education program and whether or not they had a 504 Plan. A 504 Plan is an accommodation to provide support for a student with a disability. An “accommodation” variable was computed such that students who were in special education and/or who had a 504 plan were coded as having an accommodation.
Sociodemographic Characteristics
Gender was assessed as “male” or “female.” Six variables were provided for race/ethnicity (American Indian, Asian, Black, Hawaiian, Hispanic, and White). The variables were not mutually exclusive. A single categorical variable was created to categorize students into one of five race/ethnicity categories: Non-Hispanic Black/African American, Hispanic, Non-Hispanic White, Two or More Races, or Other Race/Ethnicity. Due to small sample sizes, American Indian, Asian, and Hawaiian students were categorized as Other. A dichotomous variable was provided to indicate whether or not a student received free or reduced-price meals, and this variable was used as a proxy for socioeconomic status. A categorical variable was provided for grade level; this was later categorized as Grades K-5, Grades 6-8, and Grades 9-12.
Analyses
Frequency measures (counts, percentages) were used to calculate proportions for the categorical variables, namely, the health conditions and sociodemographic characteristics (gender, race/ethnicity, receiving free or reduced-price meals, grade level, and having an accommodation). Means and standard deviations were used to measure the continuous academic outcome variables (number of absences and GPA).
Associations between sociodemographic characteristics, health conditions, and academic outcomes were assessed using both bivariate and multivariate approaches. First, to examine the unadjusted bivariate associations, differences in the prevalence of three health conditions (ADD/ADHD, asthma, and any mental health condition) by sociodemographic characteristics were evaluated using chi-square tests of independence. These three health conditions were chosen due to their prevalence among this sample as well as associations with academic performance reported in previous research (Liu et al., 2017; Molina et al., 2009; Tsakiris et al., 2013; Wood et al., 2012). T tests were used to examine differences in academic outcomes by sociodemographic characteristics.
Next, multivariate models were developed to evaluate the effect of health conditions on absences and GPA while accounting for the influence of covariates. Two models were developed; one with absences as the dependent variable, and one with GPA as the dependent variable. Due to overdispersion in both the absences and GPA data, negative binomial regression was used. To transform these data into integers, absences were multiplied by a factor of 2 and GPA was multiplied by a factor of 100. All estimates from the final models were back-transformed to facilitate interpretation.
Three dichotomous health condition variables (yes vs. no for having ADD/ADHD, having asthma, and having any mental health condition) and five covariates (sex, race/ethnicity, receiving free or reduced-price meals, grade level, and having an accommodation) were entered into both models. As a first step, all eight variables were entered into the models. Then, due to nonsignificance in the models, gender and ADD/ADHD status were dropped from the final model for absences, and race/ethnicity and asthma status were dropped from the final model for GPA. Estimated marginal means measuring GPA and absences (adjusted for sociodemographic covariates) were obtained from the regression models for the significant health condition variables. To protect students’ confidentiality and privacy, results are not reported where cell sizes are less than 10.
Results
During the 2016-2017 academic year, 3,663 students attended Grades K-12 at GCPS. Of these 3,663 students, 52.1% were male, 96.9% were non-Hispanic White, 45.0% were in Grades K-5, and 47.6% received free or reduced-price meals (see Table 1). The five most common health conditions among students in Grades K-12 were ADD/ADHD (11.1%), asthma (8.2%), migraine headaches (4.9%), mental health conditions such as anxiety and depression (4.7%), and eczema/psoriasis/skin disorders (3.6%; see Table 1). Fewer than 1% of students in Grades K-12 had diabetes (0.4%). Almost two thirds of all students did not have any health conditions (65.5%), 9.7% had only ADD/ADHD but no other health conditions, 6.8% had only asthma but no other health conditions, 1.4% had both asthma and ADD/ADHD, and 16.6% had other health conditions. The number of health conditions a student had ranged from 0 to 15, with an average of 0.54 conditions per student.
Sociodemographic Characteristics and Health Conditions of GCPS Kindergarten Through Grade 12 Students (N = 3,663)
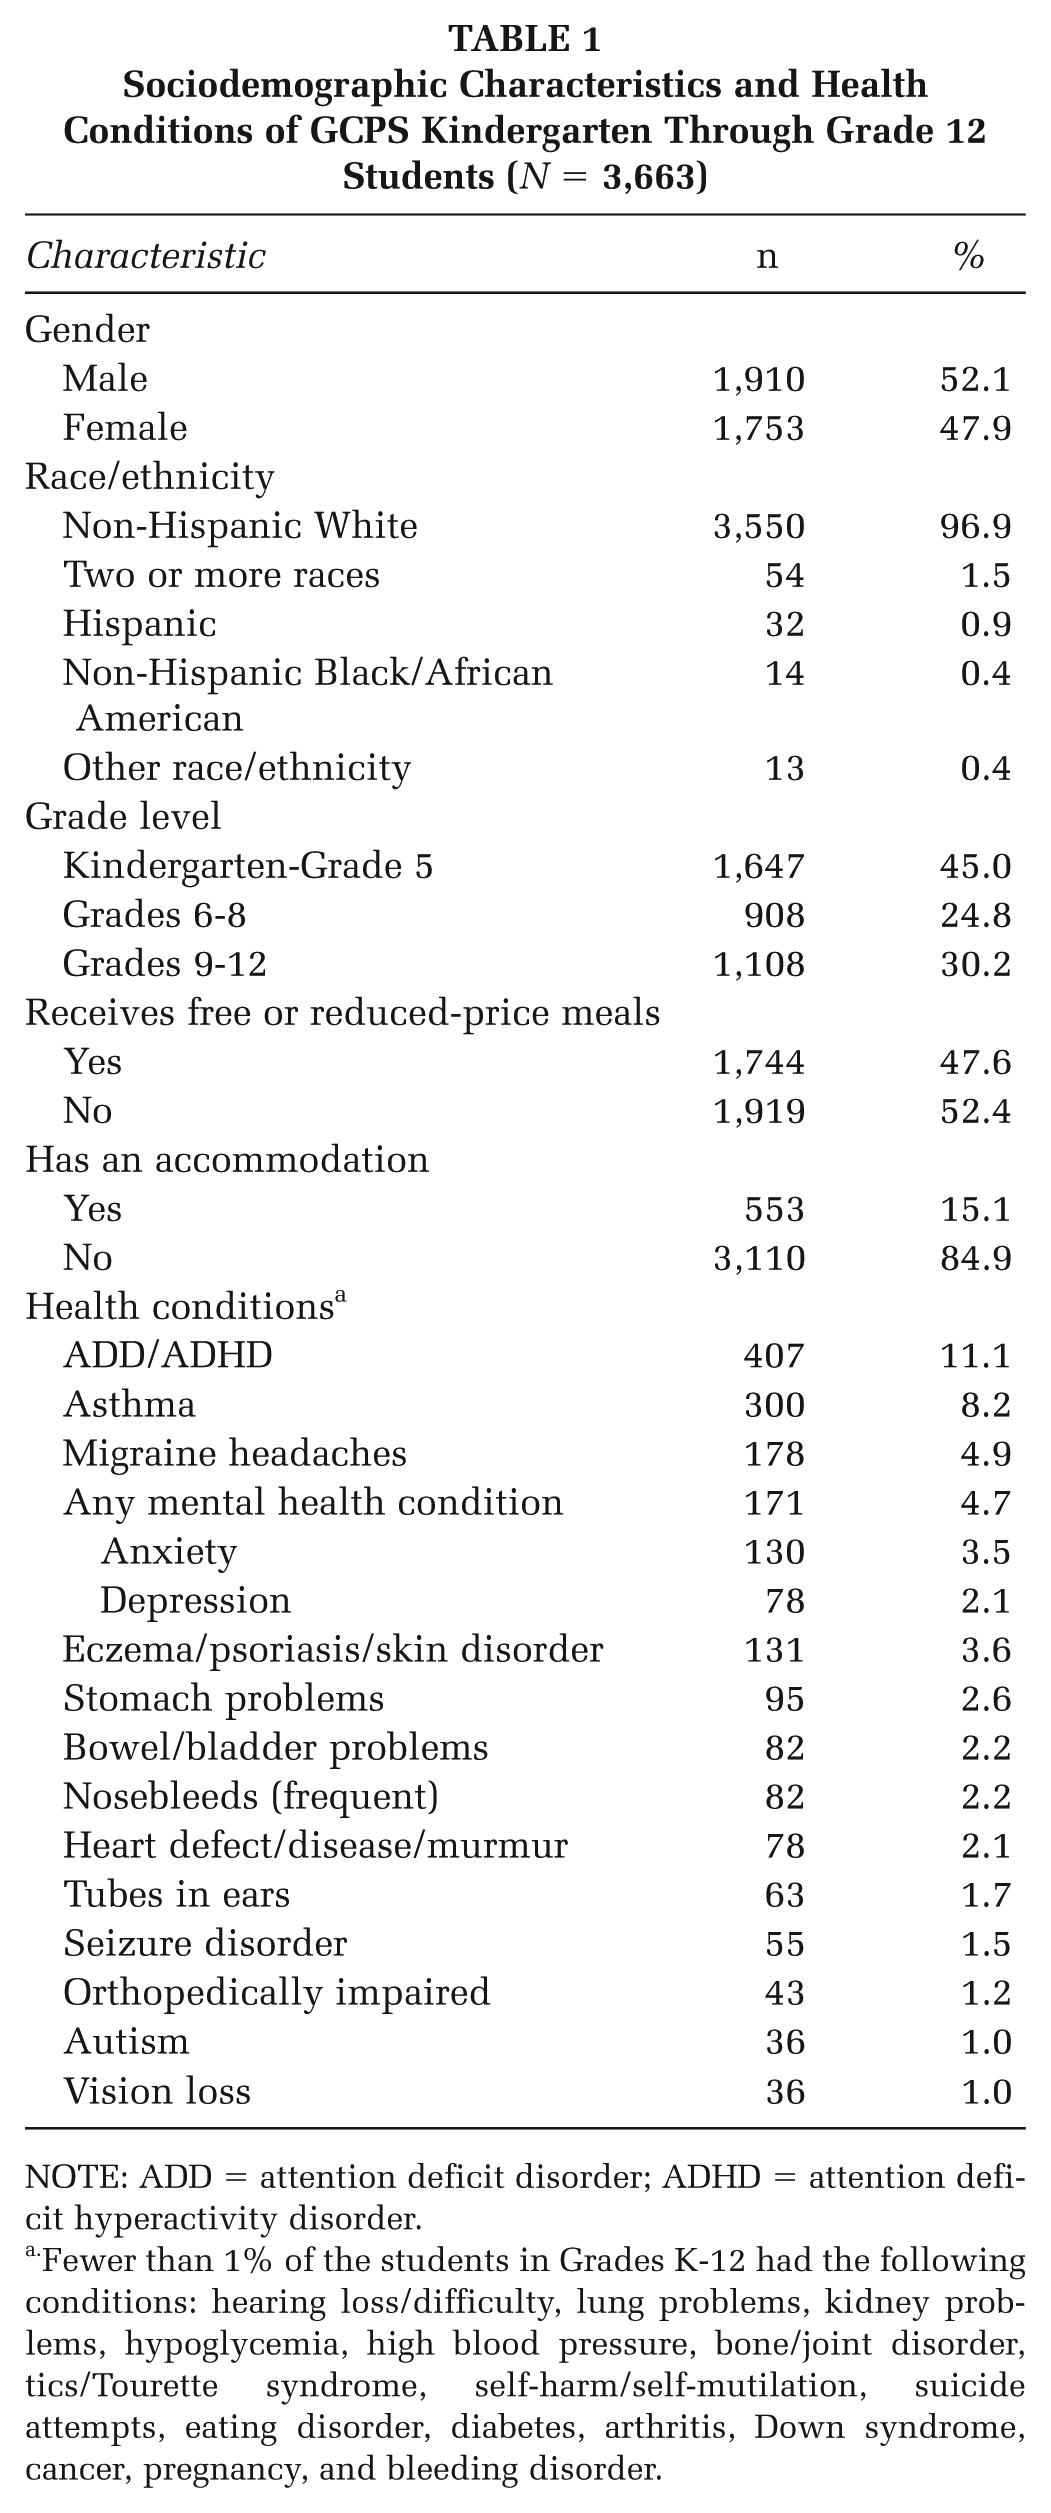
NOTE: ADD = attention deficit disorder; ADHD = attention deficit hyperactivity disorder.
Fewer than 1% of the students in Grades K-12 had the following conditions: hearing loss/difficulty, lung problems, kidney problems, hypoglycemia, high blood pressure, bone/joint disorder, tics/Tourette syndrome, self-harm/self-mutilation, suicide attempts, eating disorder, diabetes, arthritis, Down syndrome, cancer, pregnancy, and bleeding disorder.
Health Status and Academic Performance
The mean number of absences during the academic year was 9.8 per student (SD = 8.3), and median number of absences was 8.0. Multivariate analyses showed that having an asthma or mental health diagnosis was positively associated with absences after controlling for covariates (receiving free or reduced-price meals, grade level, having an accommodation, and race/ethnicity; see Table 2). ADD/ADHD was not associated with absences in the final multivariate model. This finding could be a result of therapeutic management of the students with ADD/ADHD or that parents of students with ADD/ADHD, compared with parents of students with asthma, might not be as reluctant to send their children to school because they are not in need of acute medical attention. Students with asthma and/or mental health conditions had a higher number of absences than students without those conditions, even when accounting for the influence that grade level and socioeconomic status have on health and absences. Figure 1a displays the estimated marginal means from the regression analyses. These are the mean number of absences adjusted for the influence of the covariates. Students with asthma missed, on average, 12.1 days of school, compared with 10.5 days among students without asthma. Similarly, students with a mental health condition missed 13.6 days of school, compared with 9.4 days among students who did not have a mental health condition.
Number of Absences and GPA by Health Conditions and Sociodemographic Characteristics
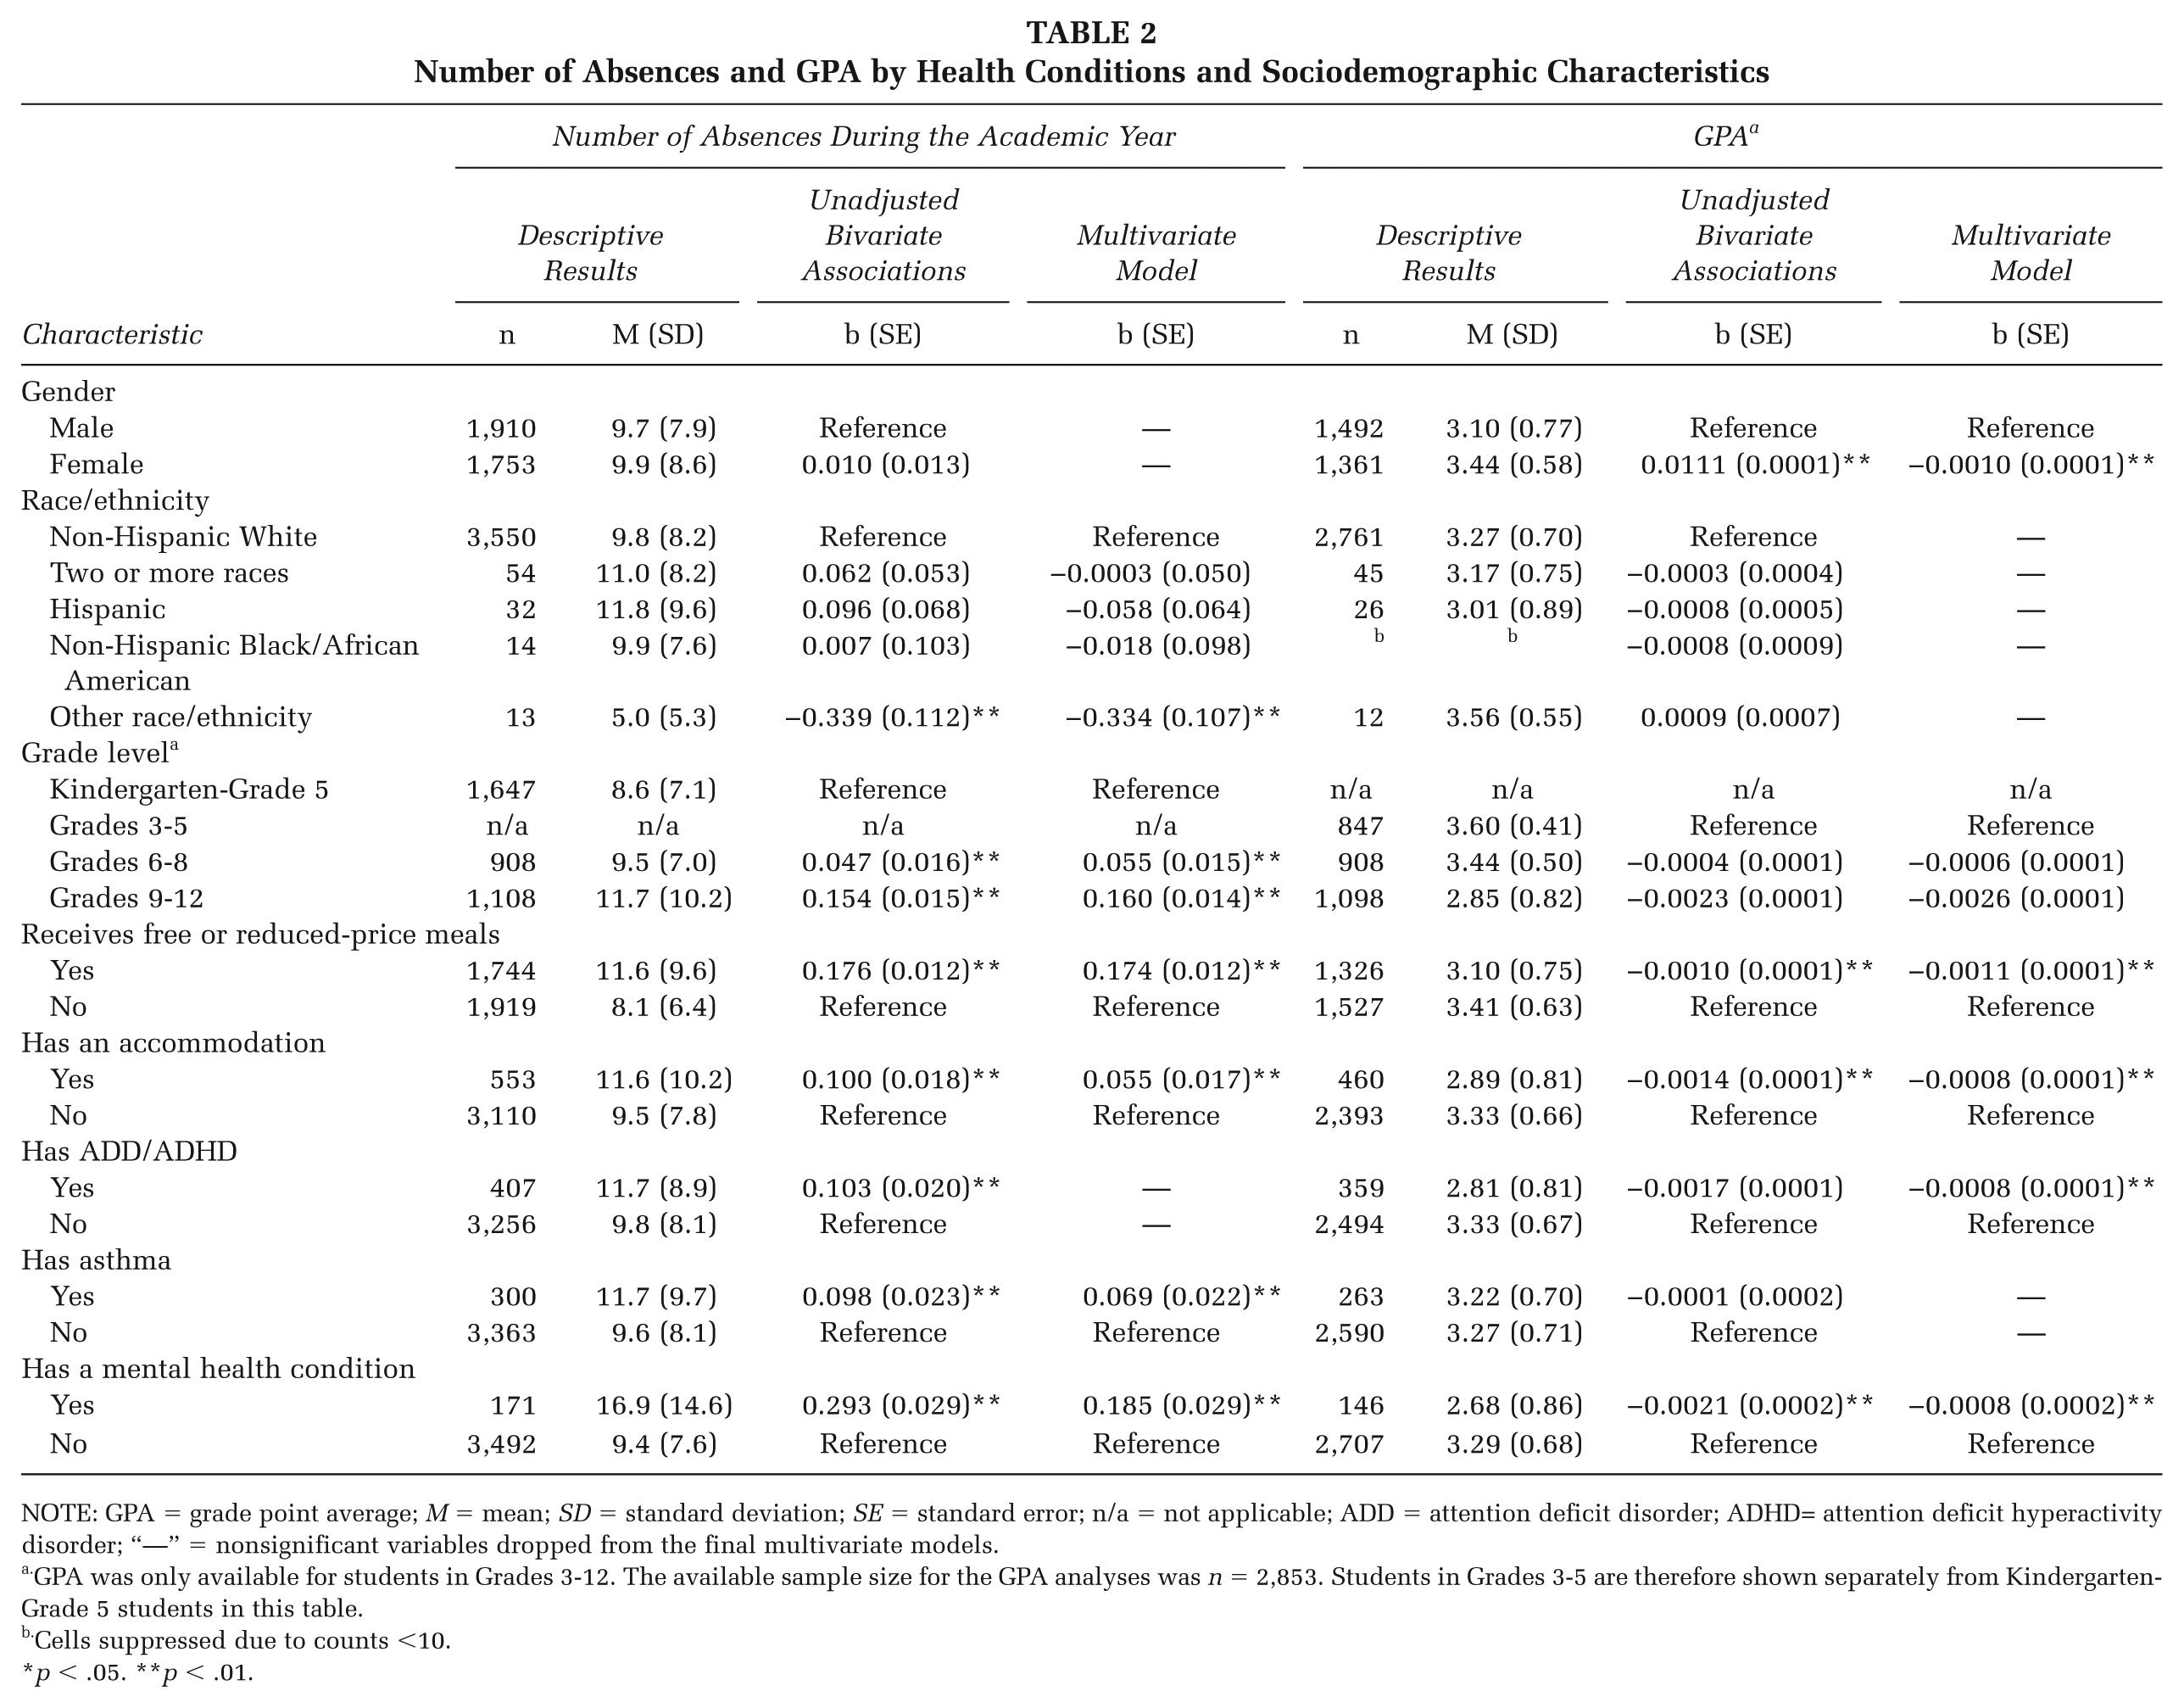
NOTE: GPA = grade point average; M = mean; SD = standard deviation; SE = standard error; n/a = not applicable; ADD = attention deficit disorder; ADHD= attention deficit hyperactivity disorder; “—” = nonsignificant variables dropped from the final multivariate models.
GPA was only available for students in Grades 3-12. The available sample size for the GPA analyses was n = 2,853. Students in Grades 3-5 are therefore shown separately from Kindergarten-Grade 5 students in this table.
Cells suppressed due to counts <10.
p < .05. **p < .01.
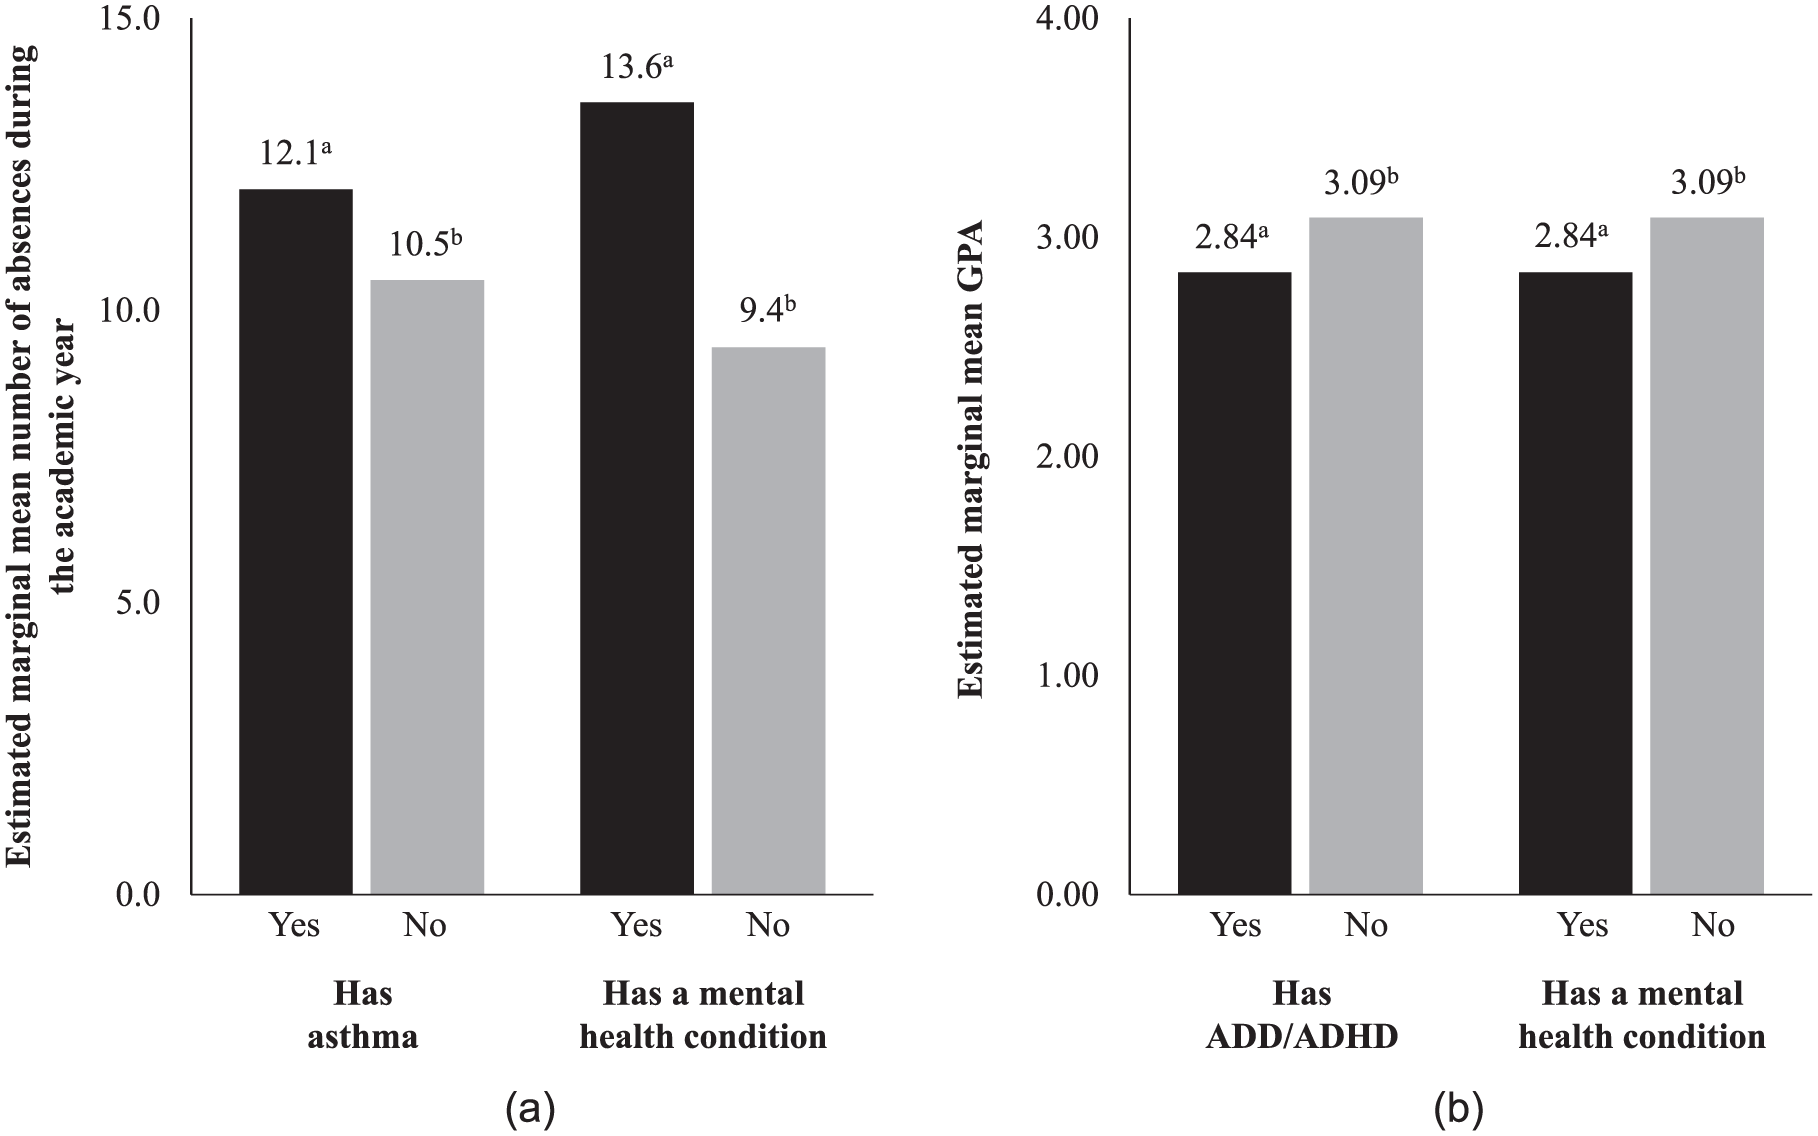
(a) Estimated Marginal Mean Number of Absences During the Academic Year. (b) Estimated Marginal Mean GPA
The mean GPA for all students in Grades 3-12 was 3.26. Having an ADD/ADHD or a mental health diagnosis was negatively associated with GPA after controlling for gender, receipt of free or reduced-price meals, having an accommodation, and grade level (Table 2). Figure 1b shows that, after accounting for the covariates, the mean GPA was 2.84 for students with ADD/ADHD and 3.09 for students without ADD/ADHD. Similarly, students with a mental health condition have a significantly lower GPA than students without a mental health diagnosis. Having asthma was not associated with decreased GPA at the bivariate level or in the final multivariate model.
Chronic Absenteeism
Eight percent of students were absent for twenty or more days during the academic year. Students who were chronically absent had significantly lower GPAs and a significantly higher number of health conditions, compared with students who were not chronically absent (see Table 3). Chronically absent students were also more likely to receive free or reduced price meals (71.4% vs. 45.5%). Absenteeism did not differ by gender or race/ethnicity.
Sociodemographic Characteristics and Health Conditions Among Students Who Are and Are Not Chronically Absent
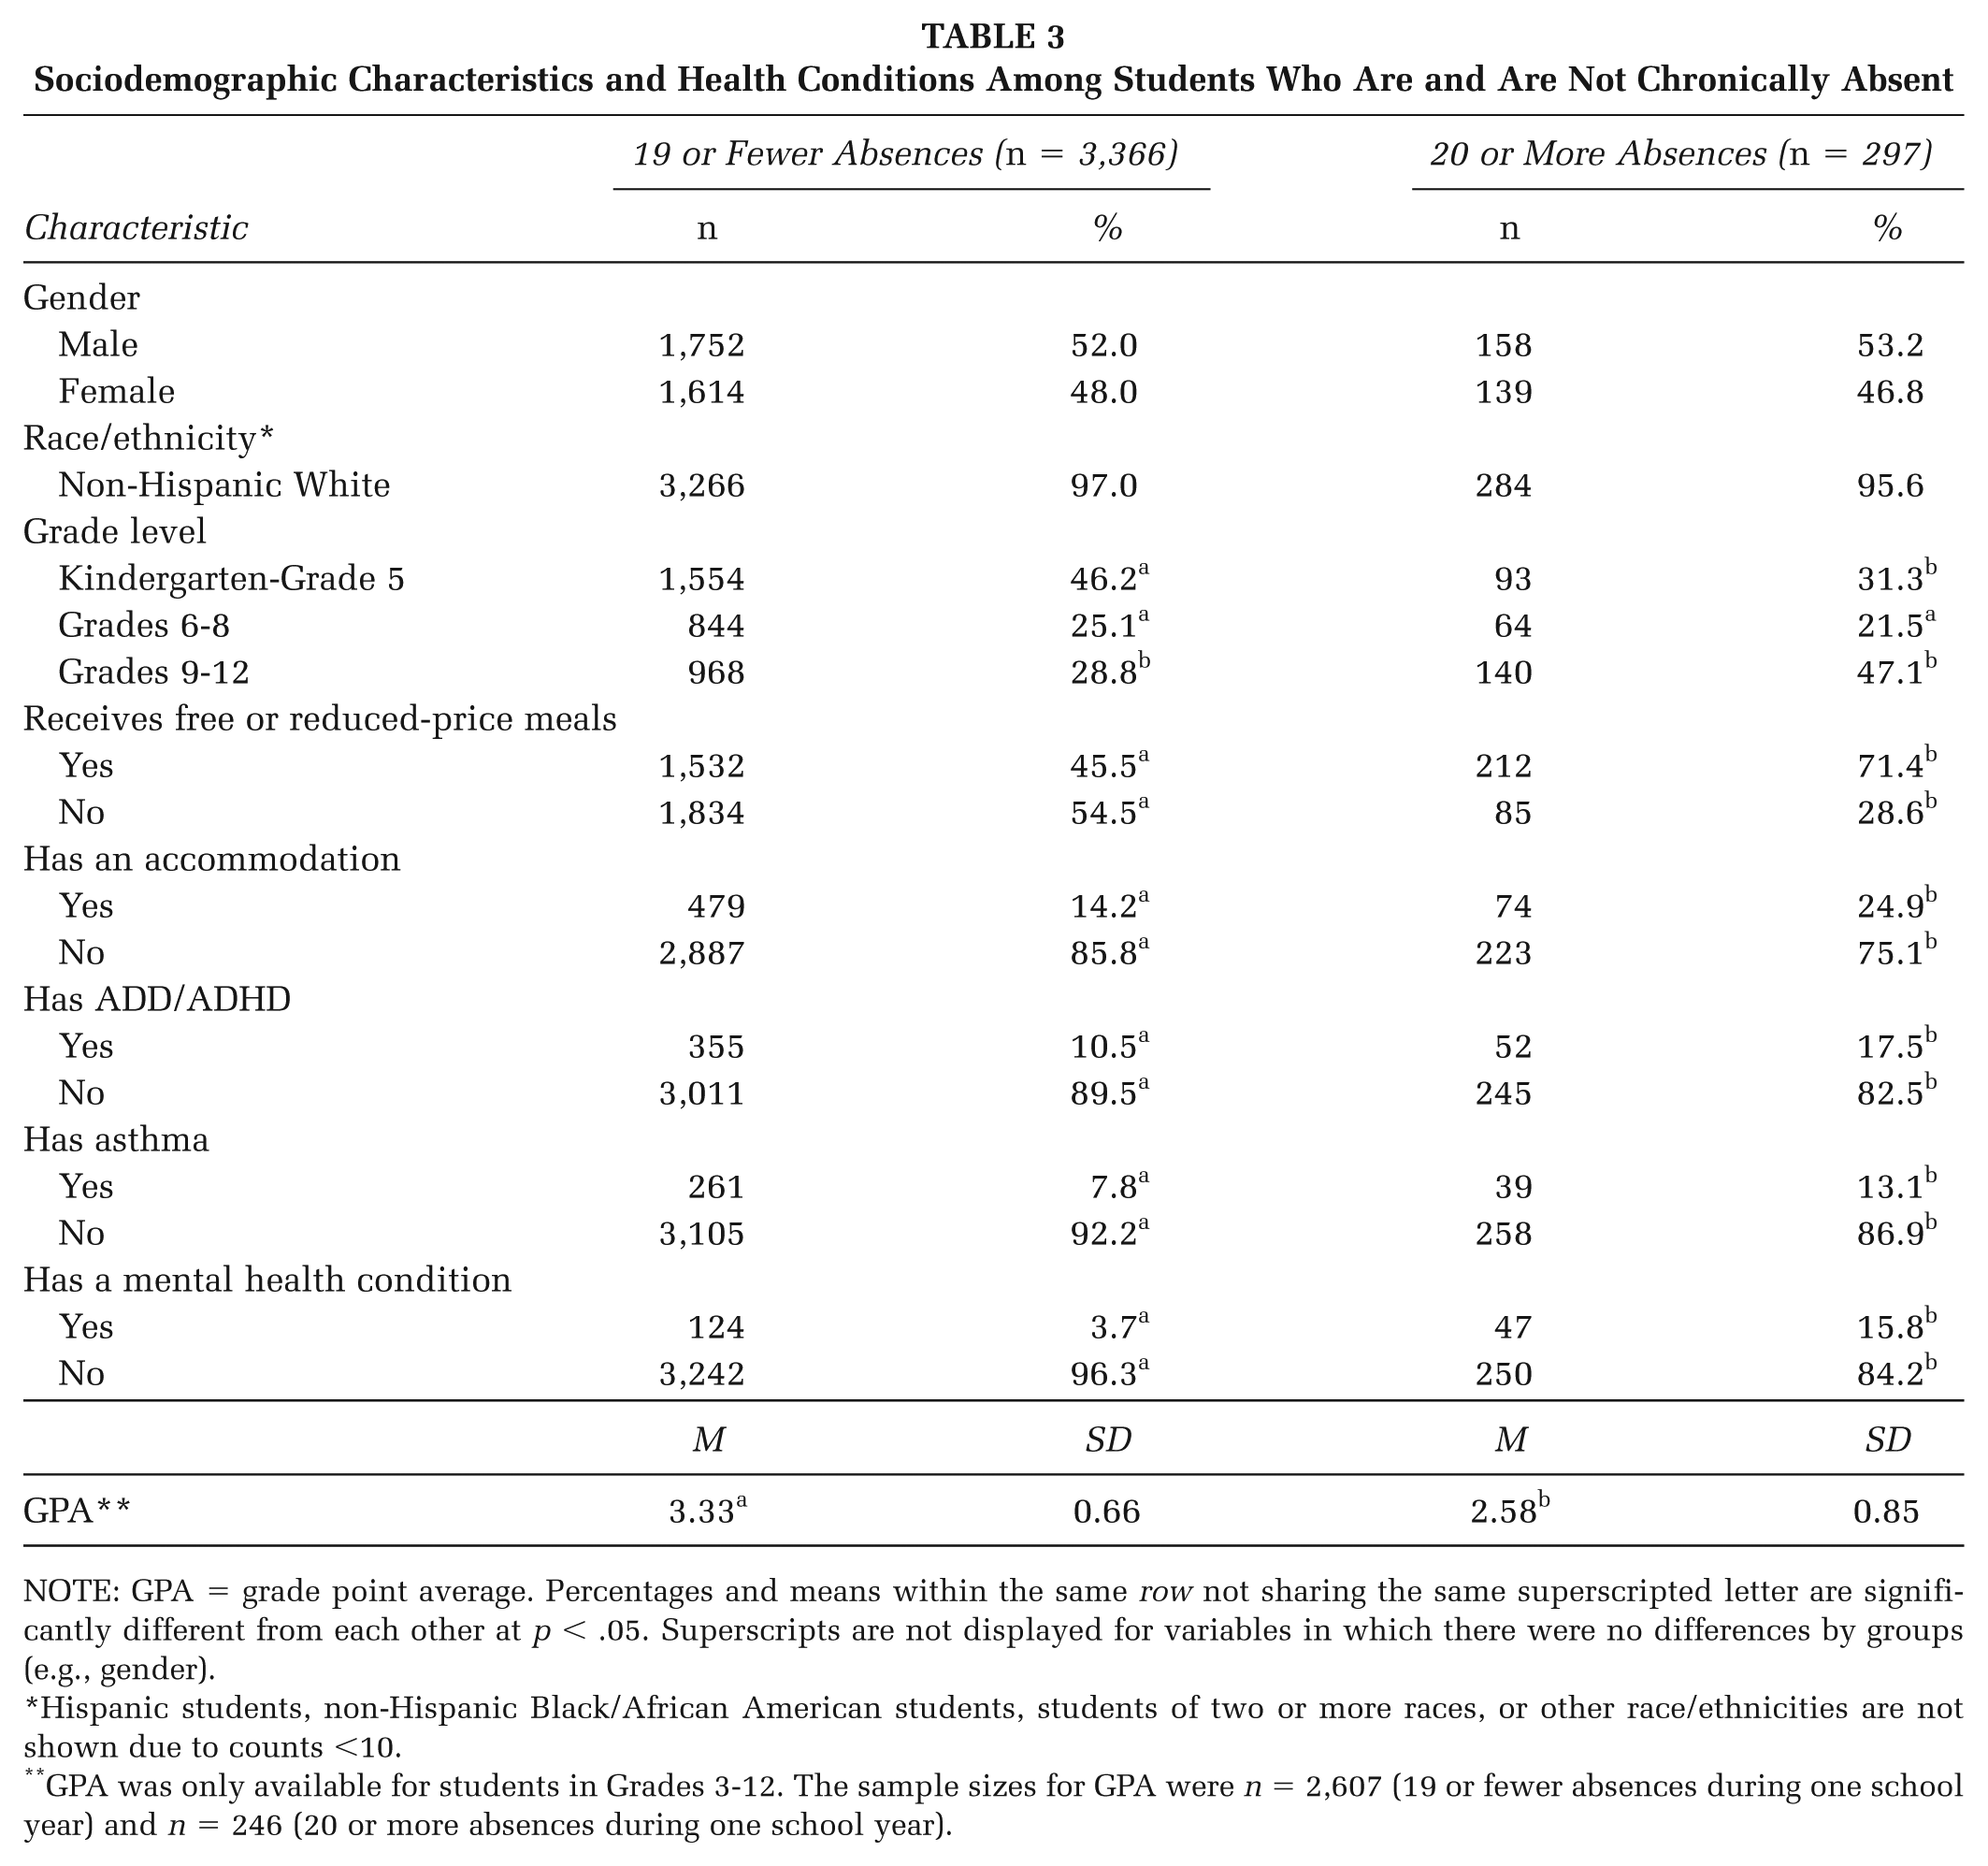
NOTE: GPA = grade point average. Percentages and means within the same row not sharing the same superscripted letter are significantly different from each other at p < .05. Superscripts are not displayed for variables in which there were no differences by groups (e.g., gender).
Hispanic students, non-Hispanic Black/African American students, students of two or more races, or other race/ethnicities are not shown due to counts <10.
GPA was only available for students in Grades 3-12. The sample sizes for GPA were n = 2,607 (19 or fewer absences during one school year) and n = 246 (20 or more absences during one school year).
Discussion
This study demonstrates how merging academic and health data in a real-world school setting can lead to a better understanding of the correlates of student health and how students with certain health conditions might be affected academically. In this county, ADD/ADHD was the most common health condition reported in the data system. As expected, receiving free or reduced-price meals, an indicator of low socioeconomic status, was associated with both health and academic outcomes. Students with ADD/ADHD had significantly lower GPAs than students without ADD/ADHD, even after adjusting for the influence of several covariates, including gender, grade level, and socioeconomic status. The second most commonly reported condition was asthma (8.2%). Asthma was also associated with increased absenteeism, but GPA did not vary significantly by asthma status. Chronically absent students (i.e., students who missed 20 or more days during the school year) had a higher average number of health conditions compared with students who missed fewer days of school.
Our demonstration project experience and findings can help motivate other school systems to use already existing data. In school systems where integrated data streams do not currently exist, additional effort will be required to merge academic and health data for students. There could be a great benefit from doing so because more effective management of chronic health conditions could improve academic performance. Furthermore, students with high levels of absenteeism could be monitored for possible health problems that might interfere with their academic performance. The current study provides a successful model of collaboration—between a team of university-based researchers, state government leaders, and a local county school system. Each partner brought expertise and their combined efforts produced information that is valuable to different audiences (e.g., research, policy, and education).
The research has implications for health promotion practice in at least two ways. First, the finding that chronic health conditions are associated with academic variables can help practitioners advocate for more resources for the management and care of students with such conditions. Second, research on the effectiveness of health promotion programs should consider including academic performance as an outcome variable in addition to health outcomes per se.
Our findings highlight how the utilization of technology can aid in integrating health and academic data to understand the connections between chronic disease conditions and academic performance. While PowerSchool® was used effectively in this county, school systems can evaluate a range of technologies for this purpose. Not all schools might have the analytic capability to take full advantage of such software applications and/or the analytic capability to analyze associations between health and academic variables. Additional reasons to not collect health data with their school system’s PowerSchool® package that were mentioned to us by school health nurses during our project included concerns raised by leadership regarding privacy and confidentiality, having different people in their school system responsible for academic and health data, insufficient staffing and training to enter the data, and being unsure how best to communicate data collection and analytic needs to IT staff. Alternatively, school systems might choose to develop their own separate health data collection system or use different student information systems (only 25% of K-12 schools in North America use PowerSchool® [PeopleAdmin, 2016]) to meet their specific data collection and analytic needs.
Although the issue of confidentiality is often cited as a barrier to linking student academic and health data, this demonstration project showed that it is entirely possible to conduct analyses on a de-identified data set, in which the school-based data file is stripped of any identifying information prior to the transfer to the outside research team. Keeping student information confidential should remain a paramount priority and methods like deidentification and encryption can and should be employed to maintain the security of student records.
The current project could be extended in several ways to learn even more about the relationship between student health and academic performance. First, our demonstration project used existing health and academic data, which was both a strength and a limitation. Future studies could consider collecting data on other variables not available to us such as control of chronic health conditions, parental involvement, standardized test scores, and additional measures of socioeconomic status. Moreover, the current project used a cross-sectional design and therefore no assumptions could be made about the temporality of the findings. Future efforts could prospectively examine a cohort of students to understand how chronic health conditions affect longer term academic achievement. Such a design would be necessary to evaluate the impact of interventions on both improving health status and academic functioning. Furthermore, tracking individual student academic and health data could be a way to evaluate the impact of interventions designed to improve health status (e.g., management programs for chronic health conditions).
One of the limitations of the current analysis is that the findings might not generalize to other school systems, where the sociodemographic characteristics of the student body might be different, or where there are fewer or more resources devoted to managing chronic health conditions of students. Future research would benefit from the use of a larger sample size and more robust data collection that would allow for analysis of the relationship between specific mental health conditions and educational performance variables.
One of the most significant lessons of the current project pertained to data definition and quality. Like most school systems, student health records contain information from parents and are reliant on disclosure of a diagnosis. It is likely that the prevalence of chronic health conditions is underestimated for this reason. Currently, the GCPS system depends on information provided by parents or guardians as the primary means of documenting a mental health condition. As the school system moves forward in meeting requirements for mental health coordination, additional data will need to be collected for this documentation.
It might be more useful to have a set of standard health-related questions that is asked for each student rather than relying on only what is reported by parents or guardians voluntarily. Also, it is unclear if there are discrepancies in the way data about chronic health conditions are being inputted.
Conclusions
Schools using the WSCC model should consider integrating academic and health data to inform practices that support the 10 model components. By understanding the overall health of their students, as well as the specific ways those health problems affect academic achievement, school systems can better tailor their strategies to address issues specific to their student population. Looking to the literature on the WSCC model, there are many indicators of potential benefits from the model, yet the importance of collecting and integrating health and academic data is only rarely highlighted (Lewallen et al., 2015; Murray, Hurley, & Ahmed, 2015; Rasberry, Slade, Lohrmann, & Valois, 2015). A concern we raise is that while we support the WSCC model as critical to the health and academic achievement of students in our nation’s schools, we do not believe the model can be effectively implemented in the absence of collecting and sharing quality data, not only within the schools themselves but also between the schools and community data systems relevant to the health of school children.
In conclusion, the success of this demonstration project encourages strengthening existing collaborations and establishing new multidisciplinary partnerships to analyze existing data sources to learn more about the relationship between student health and academic achievement. School systems would benefit from data collection and analysis of the relationship between chronic health conditions and educational performance markers.
Footnotes
Authors’ Note:
Special thanks are extended to Kathryn Vincent Carr, Cheryl De Pinto, Christina Backe, Jeff Gank, and Jessica Zimmerman. The School Health Chronic Disease Epidemiology and Evaluation Project was funded through a Memorandum of Understanding (OPASS Contract No. 16-16016-G) with the Maryland Department of Health, Office of Population Health Improvement. Funding for this project was made possible by Grant Number 5 NU58DP004812-05-00 from the Centers for Disease Control and Prevention (CDC). The conclusions, findings, and opinions expressed by authors contributing to this report do not necessarily reflect the official position of the U.S. Department of Health and Human Services, the Public Health Service, or the CDC.