
Abstract
The Farmers Market (FM) Food Navigator program was designed over 3 years and follows a social ecological framework to increase vulnerable populations’ access to local foods and build confidence to shop in a FM supporting local food systems while promoting fruit and vegetable consumption. Food Navigators followed a program Playbook, though unlike many similar programs, the program did not offer incentives to subsidize FM purchases. To inform program design and understand outcomes, data were collected from Food Navigators, shoppers, FM managers, and FM vendors. Food Navigators supported five to seven FMs each season (May through October), spending 590 days in FMs over three seasons. Due to their interaction with Food Navigators, shoppers in Season 3 (n = 689) indicated that they would: shop more at the FM (80%); eat more vegetables (52%); and purchase more vegetables (50%). Of shoppers who interacted with Food Navigators more than once (n = 55), 26% reported a higher frequency of vegetable consumption on their last survey compared with their first. In Season 3, at least half of FM managers (n = 4, 50%) and vendors (n = 68, 57%) agreed that food navigators helped increase overall market fruit and vegetables sales. Findings indicated the program did influence multiple levels of a social ecological framework as intended. FM nutrition programs can have success at increasing market sales and improving health-related behaviors without offering incentives. As a result, programs could operate with smaller budgets and be more likely to have increased shopper fruit and vegetable consumption sustainably beyond the direct subsidy of purchases.
Keywords
Background
Eating a healthy diet, including recommended amounts of fruits and vegetables (FV), helps protect against diseases that can lead to death or chronic disability (U.S. Burden of Disease Collaborators, 2013). Americans’ consumption of FV is low and those in poverty are least likely to consume recommend levels (Lee-Kwan et al., 2017). To increase FV consumption, public health programs should educate individuals and work to improve access and affordability of healthy foods throughout communities (Centers for Disease Control and Prevention [CDC], 2018). A community-based approach to support healthy eating has been successful in food system work and is aligned with a social ecological model (SEM), which categorizes factors influencing health behaviors into levels: intrapersonal, interpersonal, organization, community, and public policy (Chen et al., 2015; Sallis et al., 2008). Programs that work to increase access and affordability typically operate within the community level of SEM.
U.S. residents in low-income neighborhoods often have limited access to places that sell fresh FV (Larson et al., 2009). The CDC considers increasing the number of farmers markets (FMs) in low-income communities as one way to improve access to FV and acceptance of food assistance benefits as a way to address affordability (CDC, 2018). The number and proportion of FMs that accept incentive programs are included as two of 10 indicators of FV access and production in the CDC’s 2018 State Indicator Report on Fruits and Vegetables. Multiple federal agencies provide funding to encourage FM shopping by individuals with limited resources (Kahin et al., 2017; U.S. Department of Agriculture, 2020).
Despite FMs providing access to affordable FV, low-income residents experience barriers to shopping at FMs. Freedman et al. (2016) conducted a systematic review of 19 articles and found key barriers for low-income FM shoppers included perceptions that food assistance benefits were not accepted, belief that food variety was limited, limited access to transportation, and lack of racial/ethnic diversity at markets. Additionally, the most common social barrier for low-income shoppers was a perception that the FM is a place for the privileged and not for them (Freedman et al., 2016).
Incentive and voucher programs at FMs have demonstrated increased spending and consumption of FV (Baronberg et al., 2013; Freedman et al., 2014; Savoie-Roskos et al., 2017). Pairing education with incentives has also been successful in increasing FV consumption among low-income populations (Anderson et al., 2001; Bowling et al., 2016; Wetherill et al., 2017). While incentive and voucher programs have increased spending at FMs and low-income shoppers’ FV consumption, they did not address social barriers, including feelings of belonging (Durward et al., 2019 and Savoie-Roskos et al., 2017). Additionally, programs that include an incentive component can cost more than those without incentives, which could affect long-term sustainability. A gap in literature exists regarding FM programs designed to address social barriers while promoting existing food assistance benefits and delivering nutrition education.
Program Design
The FM Food Navigator Program (FMFNP) follows a SEM to address FV consumption barriers while increasing use of FMs to purchase fresh, local produce, without offering subsidies. An SEM approach has been successfully used in other community-based FM health programs to organize components and ensure a focus on multiple levels of influence, including community-level changes and not just individual level behaviors (Sacks et al., 2015). FMFNP components were designed to address individual level factors (i.e., knowledge and skills on selection of ripe produce and different preparation methods), interpersonal factors (i.e., connections between shoppers and vendors, feelings of belonging), and community factors (i.e., promotion of FM and available assistance programs and collaboration with FM managers and vendors regarding policy, systems, and environmental changes to increase access and/or affordability of food).
Content for the FMFNP was developed by Michigan Fitness Foundation (MFF) staff, including Registered Dietitian Nutritionists with community health program expertise. MFF collaborated with the Michigan FM Association (MIFMA) to recruit FMs that accepted Supplemental Nutrition Assistance Program (SNAP) benefits and were located in low-income communities, determined by their placement in SNAP Education (SNAP-Ed) eligible census tracts, where at least 50% of residents’ gross incomes were equal to or less than 185% of the poverty threshold. MIFMA helped inform program design through a lens of FM managers and vendors and managed Food Navigators (FNs) who operated in FMs during 2016, 2017, and 2018 seasons (typically June through October).
MIFMA recruited FNs from surrounding communities who had previous experience in food systems or nutrition education. FNs received training by MIFMA and MFF at the beginning of each season on how to perform key roles: (1) conduct community outreach to increase awareness of FMs and food assistance programs available; (2) work with FM managers and vendors to implement policy, systems, and environmental changes supporting healthy behaviors; (3) help shoppers leverage their food budgets at FMs through tours, tips, and support; and (4) provide resources and nutrition education to shoppers that support healthy eating habits, including tastings and cooking demonstrations. MIFMA provided FNs support throughout the season with regular check-in calls and site observations.
After 2 years of program refinement and based on evaluation findings, a FMFNP Playbook was developed and used during the third season. The Playbook was a resource for FNs on how to perform their key roles. Playbook sections included information on engaging FM managers, conducting community outreach, selecting feature produce items and connected activities, evaluation tools, and recipes for tastings and cooking demonstrations. The Playbook provided structure for implementing with fidelity, while still allowing for flexibility to ensure local relevance for FMs and communities they serve.
Purpose
The purpose of the FMFNP was to support low-income residents shopping at local FMs to increase FV consumption. The main objectives of this study were to describe (1) key stakeholder perceptions of the FMFNP and (2) program outcomes related to FM shopper’s dietary changes and intentions.
Method
Study Design
Using a mixed methods approach, process and outcome data were collected to determine key stakeholder acceptability, identify year-to-year refinements, document implementation, and detect potential outcomes for FM shoppers. Conducting both process and outcome evaluations is considered best practice for health programs and can inform refinements, provide accountability to stakeholders, and contribute to the public health field (McKenzie et al., 2009). Key stakeholder groups included in data collection were FNs, FM managers, FM vendors, and FM shoppers. The study design was created in collaboration with the Public Health Institute Center for Wellness and Nutrition (CWN), who acted as external evaluators.
Data Collection
Food Navigators
FNs tracked daily activities in logs each season. The log format and some items changed each year based on formative evaluation findings. In Season 1, FNs updated one activity log in Microsoft Excel with a row for each day spent in the FM. Logs were used to track hours worked, number of shoppers assisted, and environmental factors, such as weather. During Season 2, FNs completed a one-page paper survey for each day in the FM that collected the hours worked, activities, and the number and types of interactions with shoppers. Season 3 activity logs were completed via an online survey platform. FNs were provided a hard copy for notetaking during market days and transferred information to the online survey within a few days. The Season 3 log included questions regarding time in the market, number of interactions with shoppers and vendors, number of tours given, and notes on any interactions with the FM manager.
FM Managers
At the end of Season 1, six of seven FM managers participated in key informant interviews by telephone with CWN. Interviews included managers’ perceptions of the program and any successes or challenges experienced. FM managers in Season 2 (all five) and Season 3 (four of five) completed an online survey with items and answer options based on the first year’s interview findings. Items covered FN activities, what worked well, and what could be improved. The Season 3 survey also included items regarding possible program effect on FM sales.
FM Vendors
Brief, self-administered surveys were completed by FM vendors near the end of each season. All vendors at participating markets were asked to complete surveys, even those who did not sell produce. Vendors were asked about interactions with FNs, perceptions of program effect on sales, and their attitude about accepting food assistance benefits. Vendor sample sizes for each season were n = 70, n = 80, and n = 68, respectively.
FM Shoppers
Shopper intercept surveys were administered by trained interviewers each year to collect feedback about the program and assessed shopper demographics, behaviors, and interactions with FNs. The survey was designed to be administered during brief encounters (i.e., about 10 minutes) with shoppers in one-on-one interviews conducted with iPad tablets using QuickTap software. Shoppers were screened to ensure they were at least 18 years old and someone in their household received public food assistance (e.g., SNAP, Senior/Market Fresh, Women, Infants, and Children [WIC]). Shoppers who met inclusion criteria were asked to consent to participate in the survey and a $5 cash incentive was provided to participants. Shopper sample sizes by season were n = 34, n = 82, and n = 43, respectively.
During the last season, shoppers completed brief, self-administered shopper behavior surveys (n = 689) after FN interactions. Shopper behavior surveys were aligned with the SNAP-Ed Evaluation Framework’s individual level indicators (U.S. Department of Agriculture, Food and Nutrition Service, 2016) and assessed frequency of vegetable consumption and intentions to shop at the FM, purchase more vegetables, prepare more vegetables, and eat more vegetables as a result of interacting with the FN. Surveys were available at FNs’ tables in all five markets and shoppers were invited to complete them every day they interacted with the FN to be entered into a giveaway for a donated item. Since surveys included shoppers’ names and phone numbers to contact giveaway winners, surveys were matched by shopper across the season to determine if behaviors changed over time.
Analysis
Quantitative data from FN activity logs, vendor surveys, market manager surveys, shopper intercept surveys, and shopper behavior surveys were analyzed using descriptive statistics for all variables of interest. Quantitative analyses were conducted using SAS version 9.4 and Microsoft Excel. Qualitative data from key informant interviews were analyzed using a thematic analysis approach (Braun et al., 2016) in NVivo to identify common themes across FM managers’ perceptions of the FMFNP’s implementation and value.
Results
The FMFNP operated in eight Michigan FMs over 3 years (see Table 1). Findings represent data collected with key stakeholders (FNs, FM managers, FM vendors, and FM shoppers) and address this study’s two main objectives: describe (1) key stakeholder perceptions of the FMFNP and (2) program outcomes related to FM shopper’s dietary changes and intentions.
Farmers Markets by Season
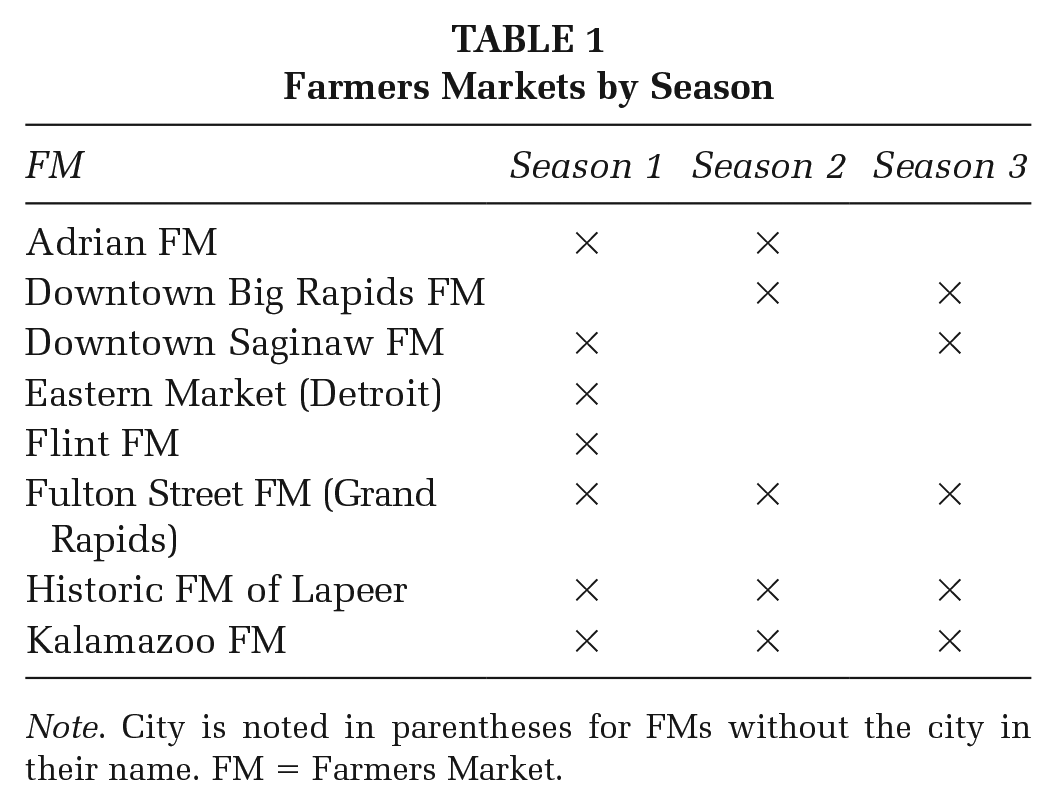
Note. City is noted in parentheses for FMs without the city in their name. FM = Farmers Market.
Food Navigator Activity
Over the course of three seasons, FNs completed logs recording 590 days spent at FMs (see Table 2). Due to missing logs and some missing items within logs, data presented provide estimations rather than precise measures of FNs’ activities. In some instances, FNs worked in FMs for a partial season, which influenced total number of days, shopper interactions, and average days in the market.
Food Navigator Activity by Season
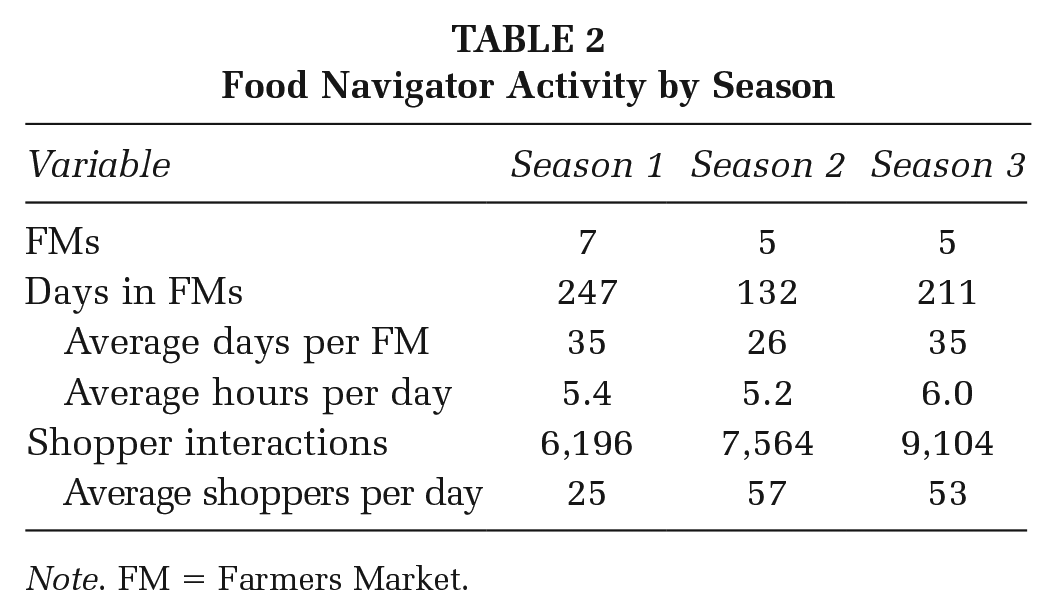
Note. FM = Farmers Market.
Based on logs received, FNs interacted with 22,864 shoppers across eight FMs and three seasons. Unique shoppers were not tracked; therefore, some interactions were likely with repeat shoppers. Since FNs hosted new activities and distributed different materials each day in the FM, some shoppers visited FNs on each visit. During Season 3, FNs reported on interactions with the FM Manager and vendors. On average, FNs interacted with 10 vendors each day and with the FM Manager on 91% of their market days.
FM Managers
Interviews
After the first season, six of seven managers participated in telephone interviews with CWN. Managers appreciated that FNs supported shoppers in their understanding and use of SNAP benefits and provided food tastings and cooking demonstrations at markets. Managers felt a need for help in both these areas and having a FN allowed managers to better focus on other tasks. One manager said it was “good to have [a FN] who really knew about food assistance, [and who] could go more in-depth teaching with food demos [and] nutrition education.” Additionally, a manager felt that FN’s announcements on Facebook about food demos brought more shoppers to the market.
When asked about the greatest program success, themes related to shopper support: offering nutrition education activities (i.e., food demos), distributing nutrition education materials (i.e., recipe cards), and helping shoppers understand how to use their SNAP benefits.
Most managers believed the FN’s presence would improve SNAP redemption at their FMs, but many felt unsure on whether SNAP redemption had improved. Managers commented that having a FN to help people understand and use their SNAP benefits would have positive effects on SNAP redemption, if not during this pilot year, in subsequent years.
Surveys
All managers in Season 2 (n = 5) and four of five in Season 3 completed season-end online surveys. Managers in both seasons were asked the same questions regarding how FNs operated in the FM, what worked well, and what could be improved (Table 3).
Farmers Market Manager Program Feedback
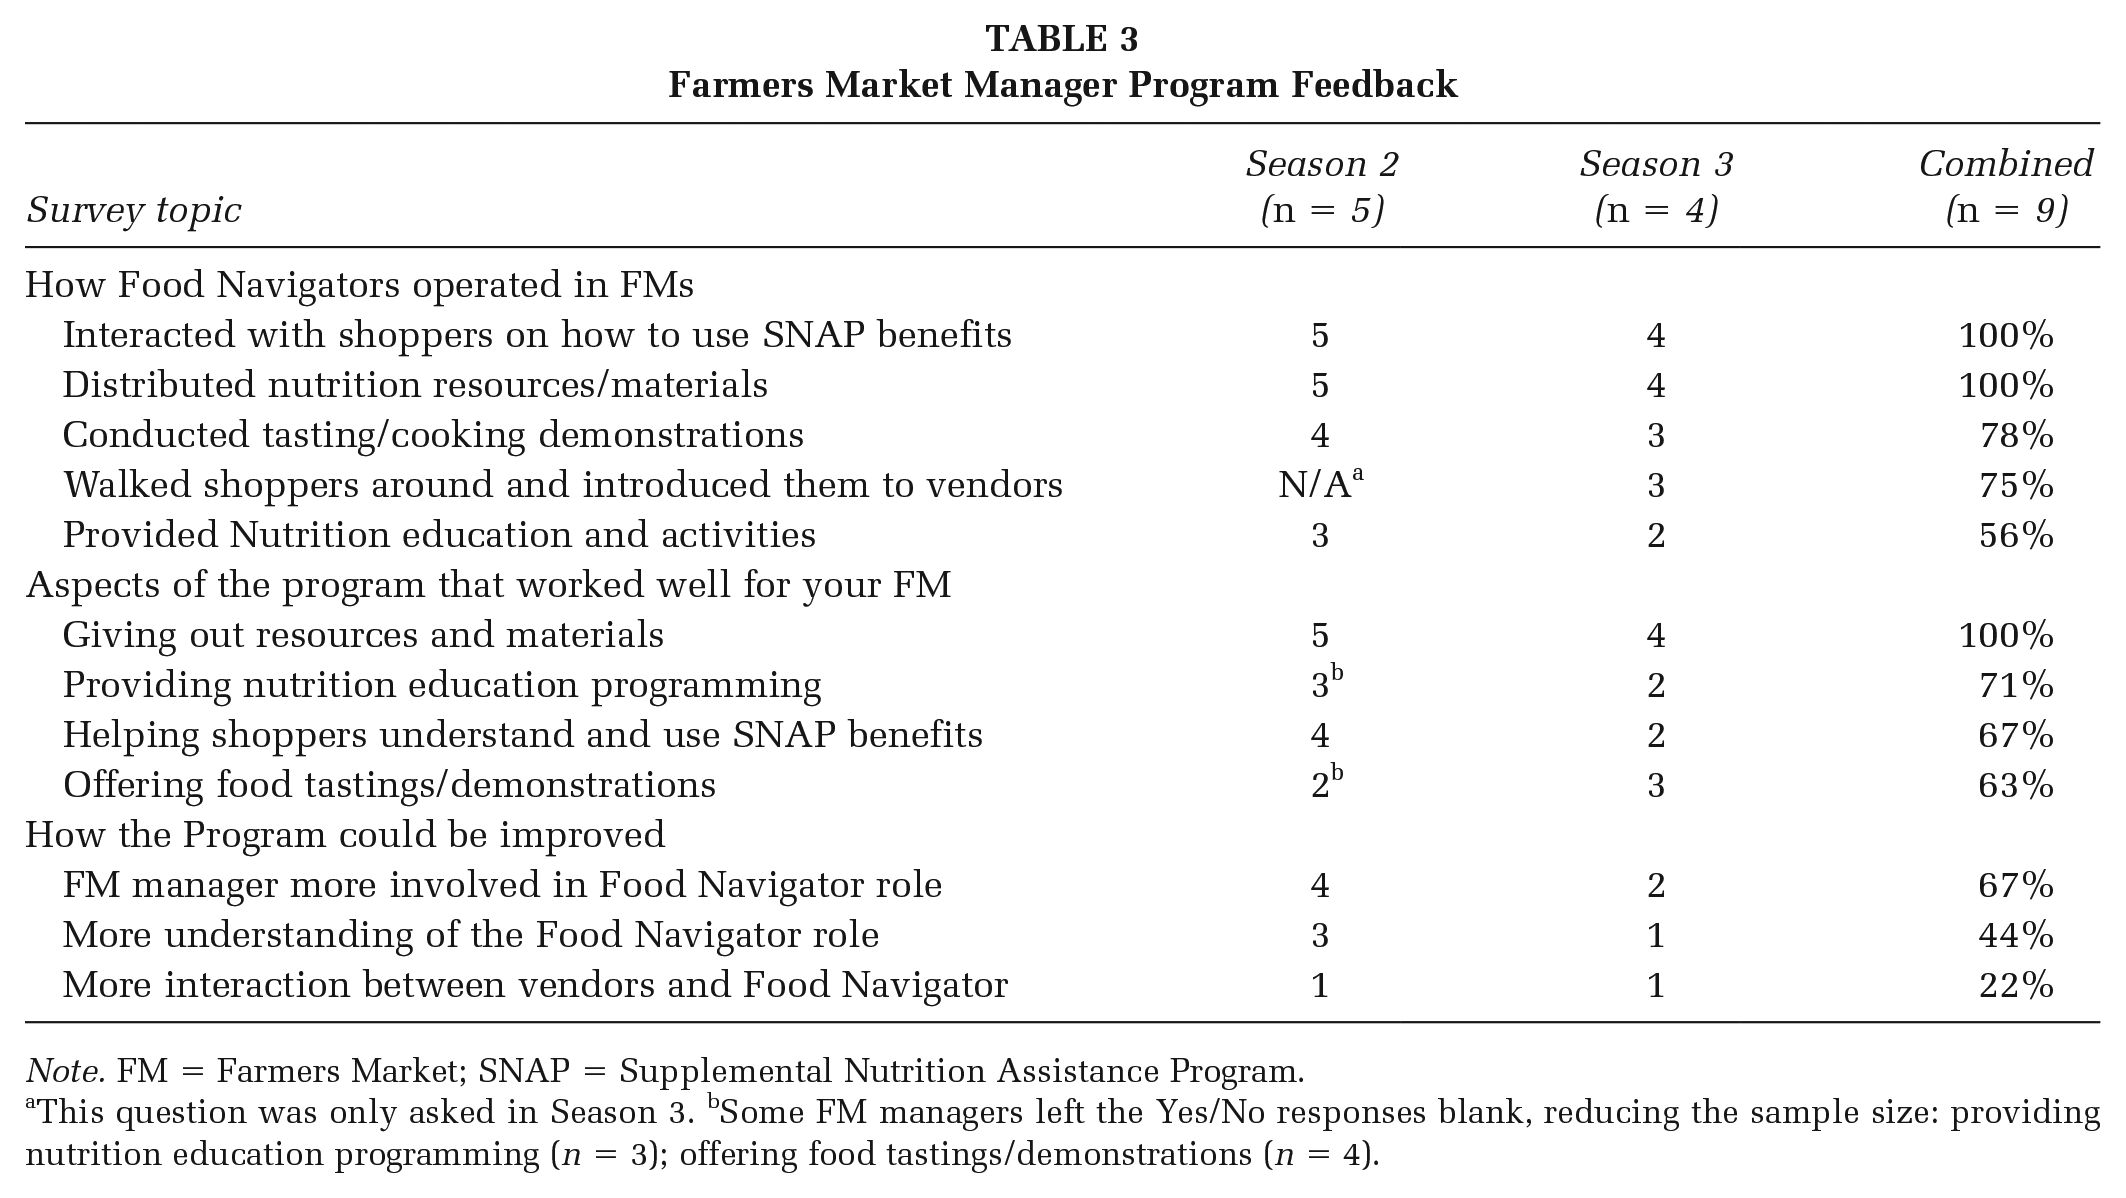
Note. FM = Farmers Market; SNAP = Supplemental Nutrition Assistance Program.
This question was only asked in Season 3. bSome FM managers left the Yes/No responses blank, reducing the sample size: providing nutrition education programming (n = 3); offering food tastings/demonstrations (n = 4).
Managers across seasons agreed FNs interacted with shoppers on how to use SNAP benefits and distributed nutrition resources. There was further agreement that providing resources worked well; however, only six of nine thought helping shoppers with SNAP benefits worked well. Manager feedback in Season 2 regarding desired program improvements informed refinements for the last season. The proportion of managers who reported wanting more involvement in the FN role decreased from 80% to 50% and those who wanted more understanding of the FN role decreased from 60% to 25%. This could indicate program refinements in those areas were successful.
Season 3 managers were asked their perceptions on program aspects’ influence on market sales. Three of four managers felt FN activities increased FV sales. Half of managers felt the FN’s efforts increased FV sales specifically, as well as overall FM sales.
FM Vendors
Table 4 displays vendor data across three seasons regarding vendor profile, interactions with FNs, and perceptions of serving shoppers with food assistance and program effect on FM sales. There was an increased proportion of vendors from Season 1 to Season 2 who sold FV (50% to 61%) that was sustained in Season 3 (59%). This shift in vendor profile could increase vendors’ chance of interacting with FNs and perceptions of the program. A plurality of vendors each season reported a daily market sales level of $100 to $499.
Farmers Market Vendor Program Feedback
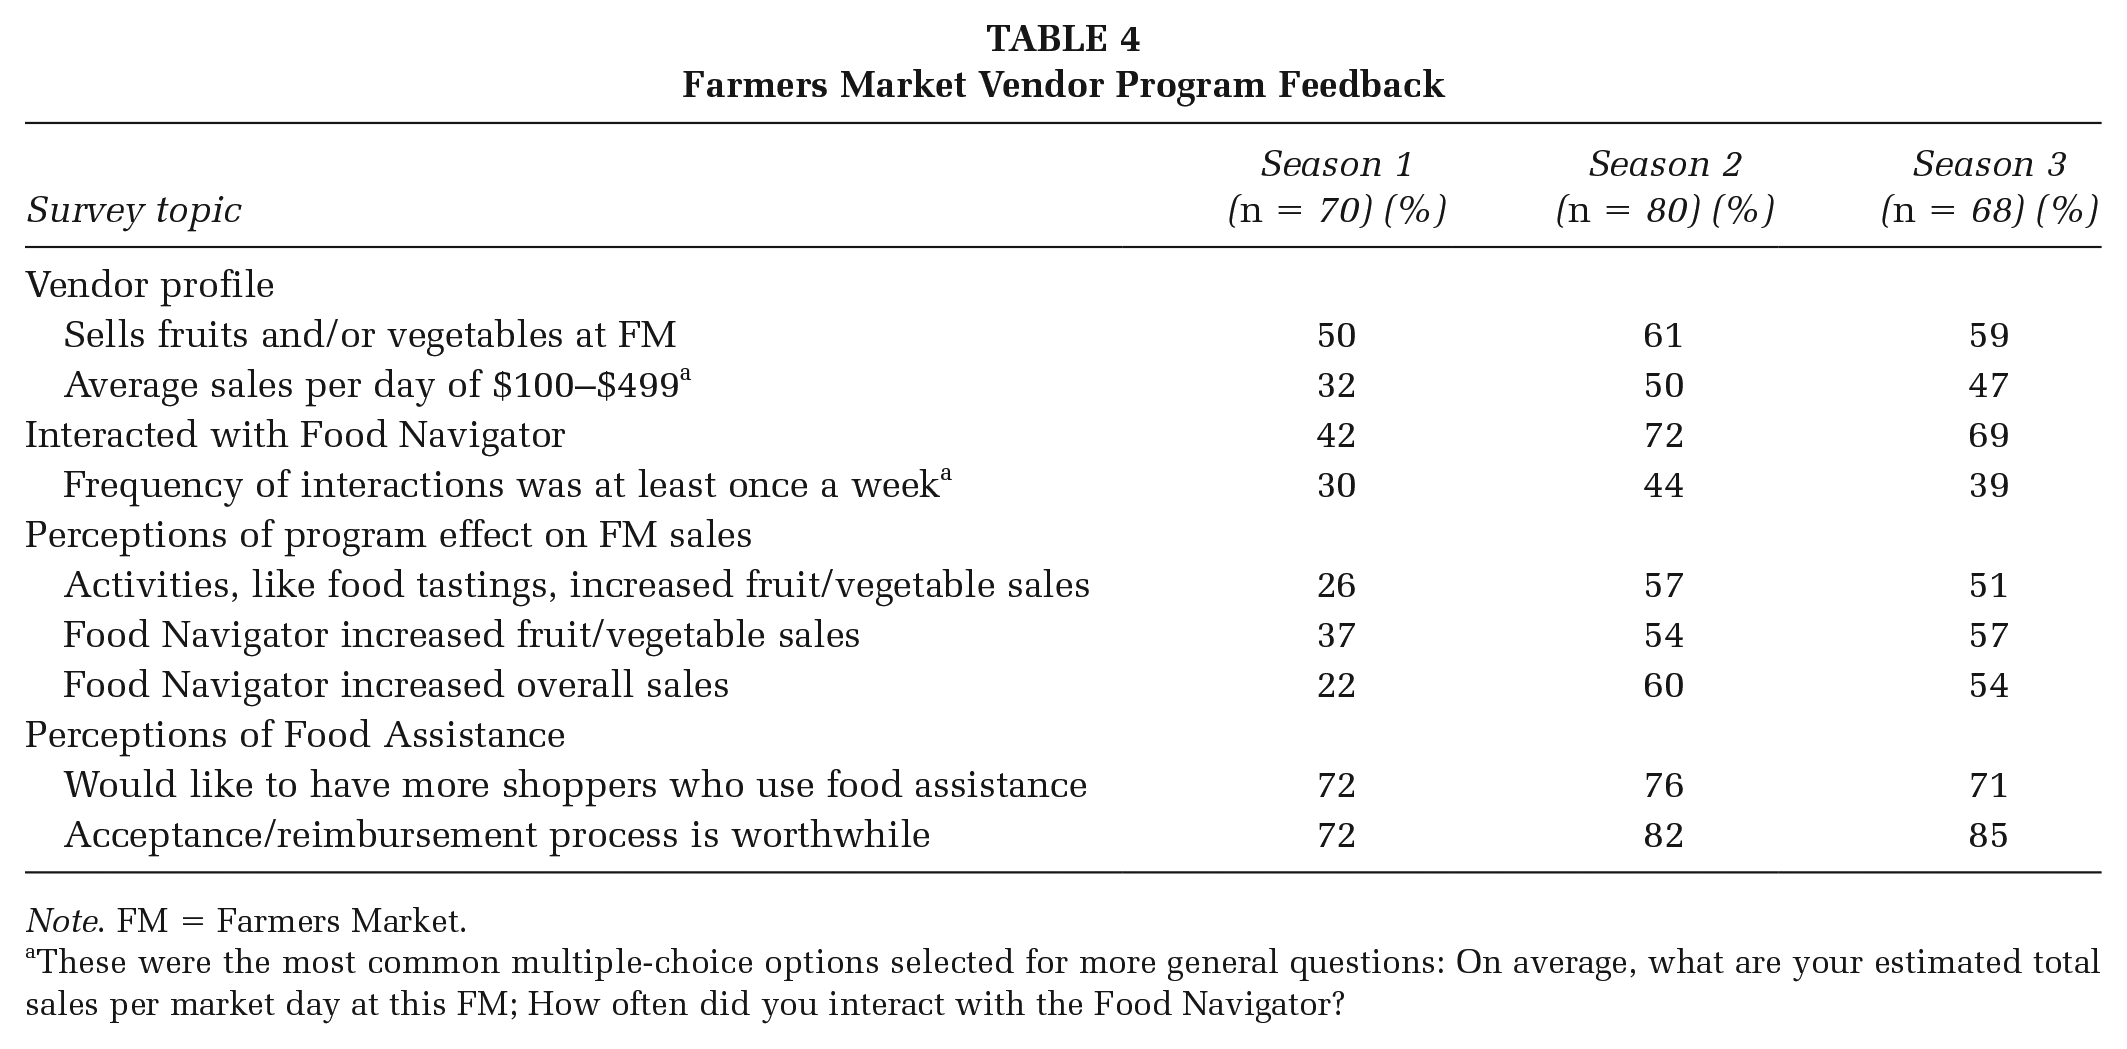
Note. FM = Farmers Market.
These were the most common multiple-choice options selected for more general questions: On average, what are your estimated total sales per market day at this FM; How often did you interact with the Food Navigator?
The proportion of vendors who reported interactions with FNs substantially increased from Season 1 to Season 2 (42% to 72%) and was maintained in Season 3 (69%). Based on feedback from Season 1, the importance of interactions with vendors was emphasized during trainings and check-ins with FNs in Seasons 2 and 3. There was a considerable increase from Season 1 to 2 in the proportion of vendors who perceived positive effects on both FV and overall sales as a result of the FN and connected activities; this change in perception could be linked to the increased percentage of vendors who interacted with FNs. The perception of positive effect on sales was maintained in Season 3.
The proportion of vendors in Season 1 who wanted (1) more shoppers with food assistance and (2) thought the process to accept and be reimbursed for food assistance was worthwhile was the same (72%). Interestingly, the perception that the process to accept and be reimbursed for food assistance was worthwhile increased each year (82% in Season 2 and 85% in Season 3), yet the proportion of vendors who would like to have more shoppers who use food assistance did not keep pace (76% in Season 2 and 71% Season 3).
FM Shoppers
Shopper Intercept Surveys
Shopper intercept survey respondents across the three years (n = 159) were primarily non-Hispanic (92%) and White (68%; Table 5). Just more than half (53%) reported they visited the FM at least once a week. Fifty-six percent of shoppers remembered being assisted by the FN. The types of interactions and behavior outcomes reported by shoppers had fluctuation across seasons. Overall, shoppers who recalled interacting with the FN reported interactions most often included receiving tools/resources to take home (52%) or being shown how to use their food assistance benefits (43%). Shoppers in Season 2 who reported interacting with FNs indicated they less ways they were helped than shoppers in the first and third seasons. It is hard to determine what might have caused this variation; the larger sample size in Season 2 might be a factor. Forty-five percent of shoppers had attended a cooking demonstration, food tasting, or nutrition talk at the market. These activities resulted in shoppers: tasting new types of fruits and/or vegetables (77%); purchasing new fruits and/or vegetables (63%); preparing new types of fruits and/or vegetables (63%); and starting to eat new types of fruits and/or vegetables (62%).
Shopper Intercept Survey Results
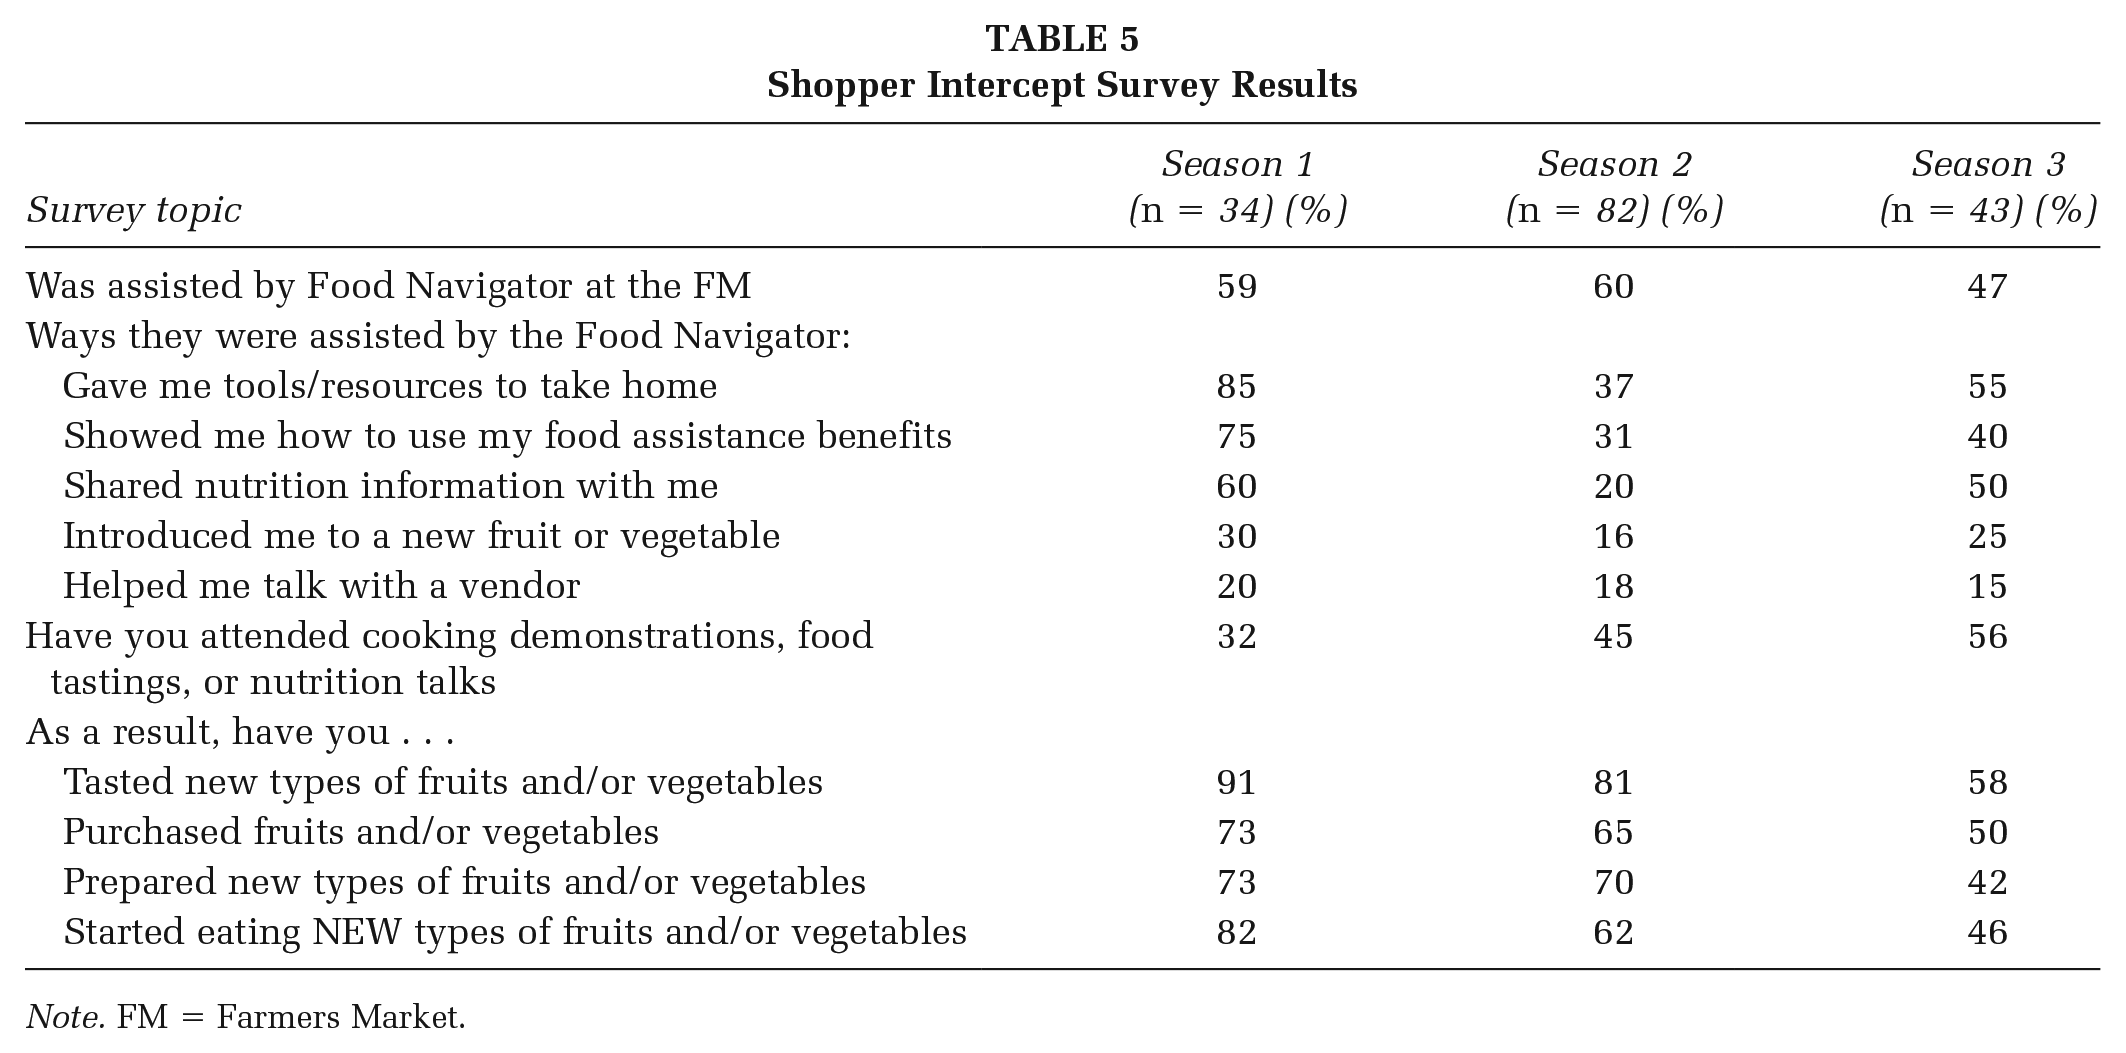
Note. FM = Farmers Market.
Shopper Behavior Surveys
Season 3 shoppers who interacted with a FN and then completed a self-reported behavior survey (n = 689) indicated that because of their interaction, they would shop more at the FM (80%), eat more vegetables (52%), and purchase more vegetables (50%). Ninety percent of shoppers (n = 674) reported consuming vegetables at least once a day, which is higher than the Behavioral Risk Factor Surveillance System reported in 2017 for Michigan (82%) and the United States (82%; CDC, 2017). Among shoppers who interacted with FNs more than once and completed multiple surveys (n = 55), 26% reported a higher frequency of vegetable consumption on their last survey compared with their first survey.
Perceptions Over Time
Data were collected over three seasons and used to refine the FMFNP. This strategy allowed for new data to help verify if refinements had changed perceptions. For instance, FM managers in the last season were less likely to report wanting a clearer understanding of the FN role or more interaction with FNs (Table 3). Vendors in Seasons 2 and 3 more often reported weekly interactions with FNs and positive effects on sales than in Season 1 (Table 4). Interestingly, shopper intercept surveys showed a decrease in the proportion of shoppers who remembered interacting with a FN and indicated changes in how FNs supported shoppers (less take-home tools/resources and more tastings and cooking demonstrations; Table 5).
Discussion
Evaluating program outcomes from a variety of key stakeholder perspectives allowed for a better understanding of how the program met its purpose to support residents with low resources in shopping at local FMs to increase their consumption of FV. Collecting data from shoppers regarding their interactions and any resulting health behavior intentions or changes is necessary to discern if this purpose was met. FNs worked to address key barriers low-income shoppers experience at FMs; including support for understanding what and how food assistance can be used at a market, promoting the variety of produce available at a FM, and helping shoppers feel welcome (Freedman et al., 2016). Shoppers reported interacting with FNs in ways aligned with their key functions and self-reported positive dietary changes and intentions as a result of these interactions.
Understanding how the program was perceived by FM managers and vendors helped refine the program over the three seasons and indicated program acceptance by key decision makers. Ultimately, for the FMFNP to be accepted and continued on, FM managers and vendors must see its value. Demonstrating manager and vendor acceptance has also been helpful when recruiting new FMs to host the program.
Findings indicated the program did influence multiple levels of a SEM as intended (Chen et al., 2015; Sallis et al., 2008). At the individual level, shoppers tried and prepared new foods; at the interpersonal level shoppers interacted with vendors and reported intentions to shop more at the FM; and at the community level shoppers purchased more vegetables and FM managers and vendors reported increased sales. Ultimately, shoppers who interacted with FNs improved health-related behaviors and intentions in ways aligned with program objectives.
Limitations of this study included the small sample size of markets each season (a range of five to seven), shoppers who completed intercept surveys each season (a range of 34 to 82), and shoppers who filled out more than one behavior survey (n = 55). Conducting shopper intercept surveys at comparison FMs could further inform if some FN duties are being completed by other people, perhaps by the FM manager, vendors, or volunteers.
Implications for Practice
FMFNP findings indicated market sales can be increased and shoppers’ health-related behaviors and intentions can be improved without offering incentives. As a result, programs could operate with smaller budgets and possibly have more likelihood that increased vegetable consumption lasts beyond direct subsidies of purchases. Community health interventions often have considerations unique to their setting that should be addressed during the program design phase. For programs in FMs, considerations included addressing perceptions that low-income shoppers might not feel they belong. Having input and buy-in from community stakeholder groups like FM managers, vendors, and shoppers is critical to identifying program aspects that support sustained success.