
Abstract
Grocery store intervention trials, including trials testing behavioral economics “nudges,” may change food-purchasing behaviors and improve diet quality. This study aimed to design and evaluate a grocery store healthy checkout lane “nudge” intervention on sales of a targeted healthy item. We conducted a randomized controlled trial based on the behavioral economic concept of cognitive fatigue and the marketing concept of impulse buying. Six grocery stores from one North Carolina-based chain were randomized to the intervention (n = 3) or control (n = 3) condition. Researchers tested a 4-week healthy checkout lane intervention, in which intervention stores moved 6-ounce cans of peanuts to the cash registers. Cashiers were instructed to upsell the peanuts to all shoppers at checkout. While not a component of the intervention, the retailer decreased the price of the peanuts from $1.99 to $1.50 during the first 2 weeks of the intervention. Fidelity to the checkout display was high. Fidelity to the upsell was low. The main outcome measure was aggregated store-level sales of the promoted peanuts for 4 weeks before the intervention and during the 4-week intervention period. On average, sales increased by 10 units/week in intervention stores (5.83 vs. 15.83 units, p = .04) with no significant change in control stores (1.42 vs. 1.17 units, p = .64). The difference (10 vs. −0.25 units, p = .02) was likely due to displaying the peanuts at checkout combined with the price promotion. Larger randomized controlled trials should examine whether healthy checkout lane interventions are effective “nudges” for promoting purchases of healthier foods in grocery stores.
Keywords
Diet quality is a strong predictor of health, and a poor diet is associated with one’s risk of becoming obese (Centers for Disease Control and Prevention National Center for Chronic Disease Prevention and Health Promotion [CDC NCCDPHP], 2021). Unfortunately, most Americans do not consume a healthy diet (Wilson et al., 2016). Over 40% of U.S. adults are obese, making it a national epidemic (CDC NCCDPHP, 2021). It is well documented that obesity is associated with poor health outcomes and a lower quality of life (CDC NCCDPHP, 2021; Wolongevicz et al., 2010; World Health Organization [WHO], 2003); Wright et al., 2017). Concerningly, conditions related to obesity such as cancer, type 2 diabetes, heart disease, and stroke are among the leading causes of preventable premature death in the United States (CDC NCCDPHP, 2021; Wright et al., 2017). Given the relationship between diet quality, obesity, and the occurrence of health problems, interventions targeting dietary intake–related behaviors have the potential to impact the health and quality of life of Americans.
A variety of factors, including governmental policy, media and advertising, social/cultural elements, and the built environment and product availability impact individual dietary choices and eating patterns (Glanz et al., 2005; Hollands et al., 2013). Built environment interventions, including interventions in grocery stores and other food retail outlets, are becoming increasingly popular in public health nutrition research. The field of behavioral economics, which examines how psychological, social, cognitive, and emotional factors affect people’s economic decision-making (Goodwin et al., 2005), may offer new insights and tools for informing the design of retail-based nutrition interventions (Ammerman et al., 2017). “Nudges,” which are a key component of behavioral economics, aim to alter behavior predictably without forbidding any options or significantly changing shoppers’ economic incentives (Thaler & Sunstein, 2009). Examples of grocery store “nudges” include displays for products placed at the end of an aisle, moving promoted items to the front of the store, and healthy checkout lanes (Ammerman et al., 2017).
Several studies have examined the impact of healthy checkout lane “nudge” interventions on healthier food purchases at food retail outlets with mixed results. For example, a quasi-experimental study by Payne and Niculescu (2018) conducted in three Southwestern U.S. supermarkets placed low-cost fruits and vegetables on checkout lane product displays. A significant increase in product purchases occurred at the experimental stores compared with control stores, particularly, among SNAP (Supplemental Nutrition Assistance Program) shoppers (Payne & Niculescu, 2018). Another quasi-experimental study by Adjoian et al. (2017) examined the impact of promoting nuts, seeds, dried fruits, granola bars, and produce at checkout lanes in three supermarkets in the Bronx, New York City. The authors found that a higher proportion of customers using a healthy versus standard checkout lane bought healthy items (56.5% vs. 20.5%; p < .001; Adjoian et al., 2017). In contrast, a quasi-experimental study by Huitink et al. (2020) analyzed the impact of healthy snack substitutions at supermarket checkout lanes in underserved, urban communities in the Netherlands, finding no statistically significant difference in the change during the control and intervention period of sales of unhealthy snacks between the control and intervention supermarkets (Huitink et al., 2020).
Many retail-based nutrition interventions are based on the behavioral economics concept of “cognitive fatigue” and the marketing concept of “impulse buying.” Most American grocery stores contain over 40,000 brands (Ruhlman, 2017); shopping may therefore lead to cognitive fatigue (Iyengar & Lepper, 2001) which posits that prolonged engagement with cognitively demanding tasks, such as selecting multiple food items and making economic trade-offs, often leads to cognitive overload and weariness (Massar et al., 2018). Consumer fatigue could lead to impulse buying, defined as the feeling of forceful intrinsic motivation to purchase a product with no preconceived intention to do so (Almy & Wootan, 2015; Tirmizi et al., 2009). By just seeing a product, consumers are urged to purchase it, and this effect is compounded by the immediate availability of said product (Dholakia, 2000). Given that cognitive fatigue can destabilize shoppers’ economic decision making (Mullette-Gillman et al., 2015) and cause quicker decision making, customers may be likely to make an impulse purchase from a checkout lane (Beatty & Ferrell, 1998). Unhealthy snacks are often sold at these checkout lanes, and these products tend to be marketed at a lower price-point than healthy options, further increasing the urge to make an impulse purchase here (Drewnowski & Eichelsdoerfer, 2010). Grocery stores capitalize on this given that checkout lanes are an unavoidable aspect of the consumer shopping experience. They are often used to increase snack sales with product displays, and such displays typically feature products that are processed, nutrient poor, and discounted (Grandi & Cardinali, 2018; Winkler et al., 2016).
Low-income shoppers experience an increased burden from unhealthy checkout lane displays as compared with higher income shoppers, and this can be explained by various socioeconomic, environmental, and individual influences in the local nutrition landscape (Glanz et al., 2005). First, healthy foods, in general, are less available and of lower quality in areas with a high population of low-income shoppers (Glanz et al., 2005). Second, lower income shoppers make more economic decisions and trade-offs than higher income shoppers due to limited budgets, and therefore, experience greater cognitive fatigue than their higher income counterparts (Spears, 2011). Additionally, due to financial constraints, low-income shoppers tend to purchase cheaper, less nutritious options (Drewnowski & Eichelsdoerfer, 2010). All these factors increase the likelihood that a low-income shopper would make an unhealthy impulse purchase at checkout.
Based on the evidence, healthy checkout lane interventions appear to have promise for improving diet quality and disparities in dietary intake but have produced mixed findings. Thus, further examination of the impact of “nudge” interventions on sales of promoted healthy items in grocery stores is warranted. The objective of the current study was to design and evaluate a grocery store “nudge” intervention on store sales of a targeted healthy item. Researchers tested a healthy checkout lane intervention, in which stores moved 6-ounce cans of discounted peanuts to the cash registers, and cashiers were asked to upsell the peanuts to all shoppers at checkout. A price promotion on the peanuts was run by the retailer concurrently during the first 2 weeks of the intervention period; however, this was a preplanned discount that the retailer failed to inform the research team about during the intervention planning process.
Method
Study Population
A randomized controlled trial (RCT) was conducted in collaboration with a North Carolina–based grocery store chain to test a 4-week “nudge” healthy checkout lane intervention in grocery stores from July to August 2018. The chain operates six stores throughout North Carolina. Five stores are in rural, low-income municipalities (populations less than 15,000 and poverty rates greater than 25%, Table 1). The sixth store is in a suburban neighborhood north of downtown Charlotte, North Carolina.
Demographic Information for the Six Municipalities in North Carolina in Which the Grocery Stores Are Located
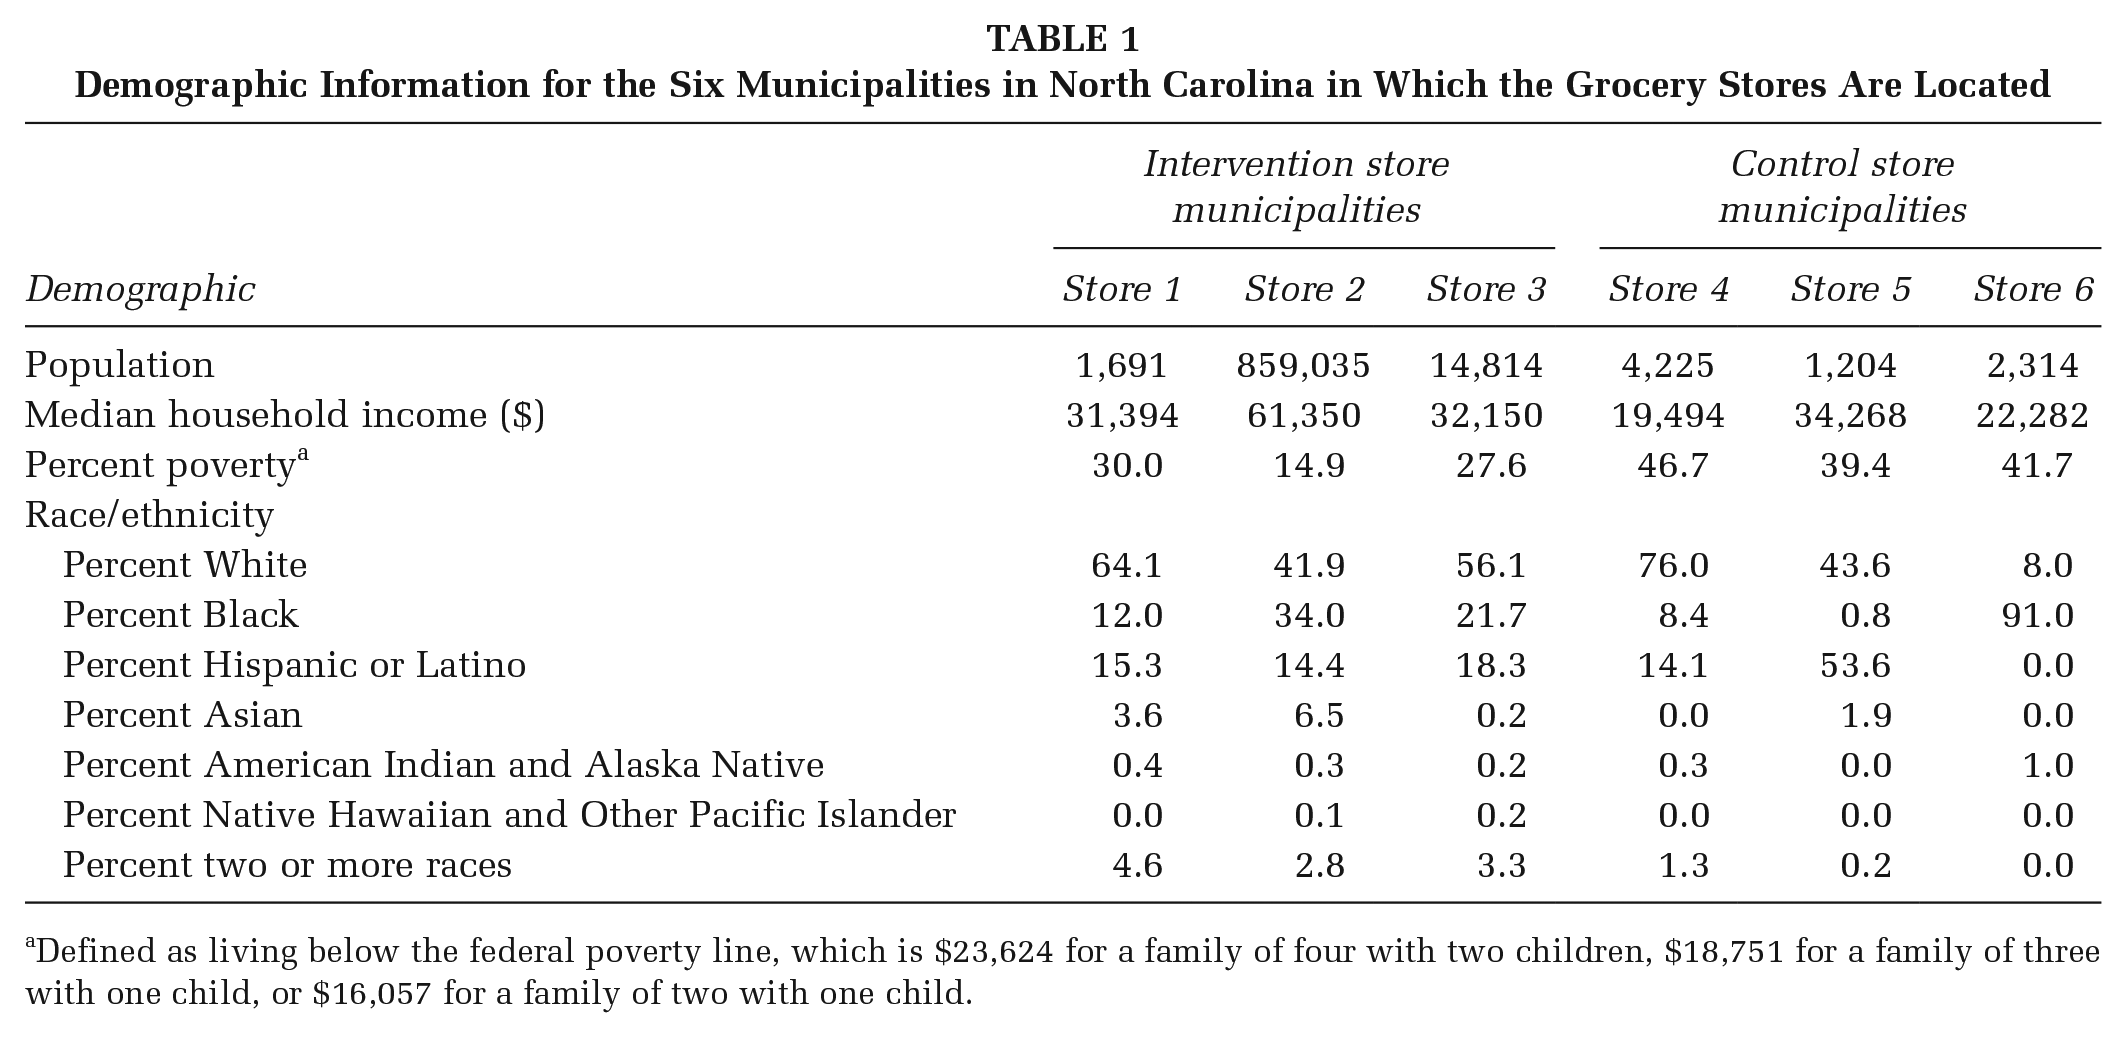
Defined as living below the federal poverty line, which is $23,624 for a family of four with two children, $18,751 for a family of three with one child, or $16,057 for a family of two with one child.
Stores were randomized using a 1:1 ratio to receive the healthy checkout lane intervention (n = 3 stores) or to the control condition (no healthy checkout lane intervention, but the promoted item was still available on store shelves; n = 3 stores; Figure 1). Randomization was performed using the Excel =RAND() function. The research team determined the sample size based on available stores from an existing partnership with a particular retailer, and not an a priori power calculation. The study was approved by The University of North Carolina-Chapel Hill Institutional Review Board.
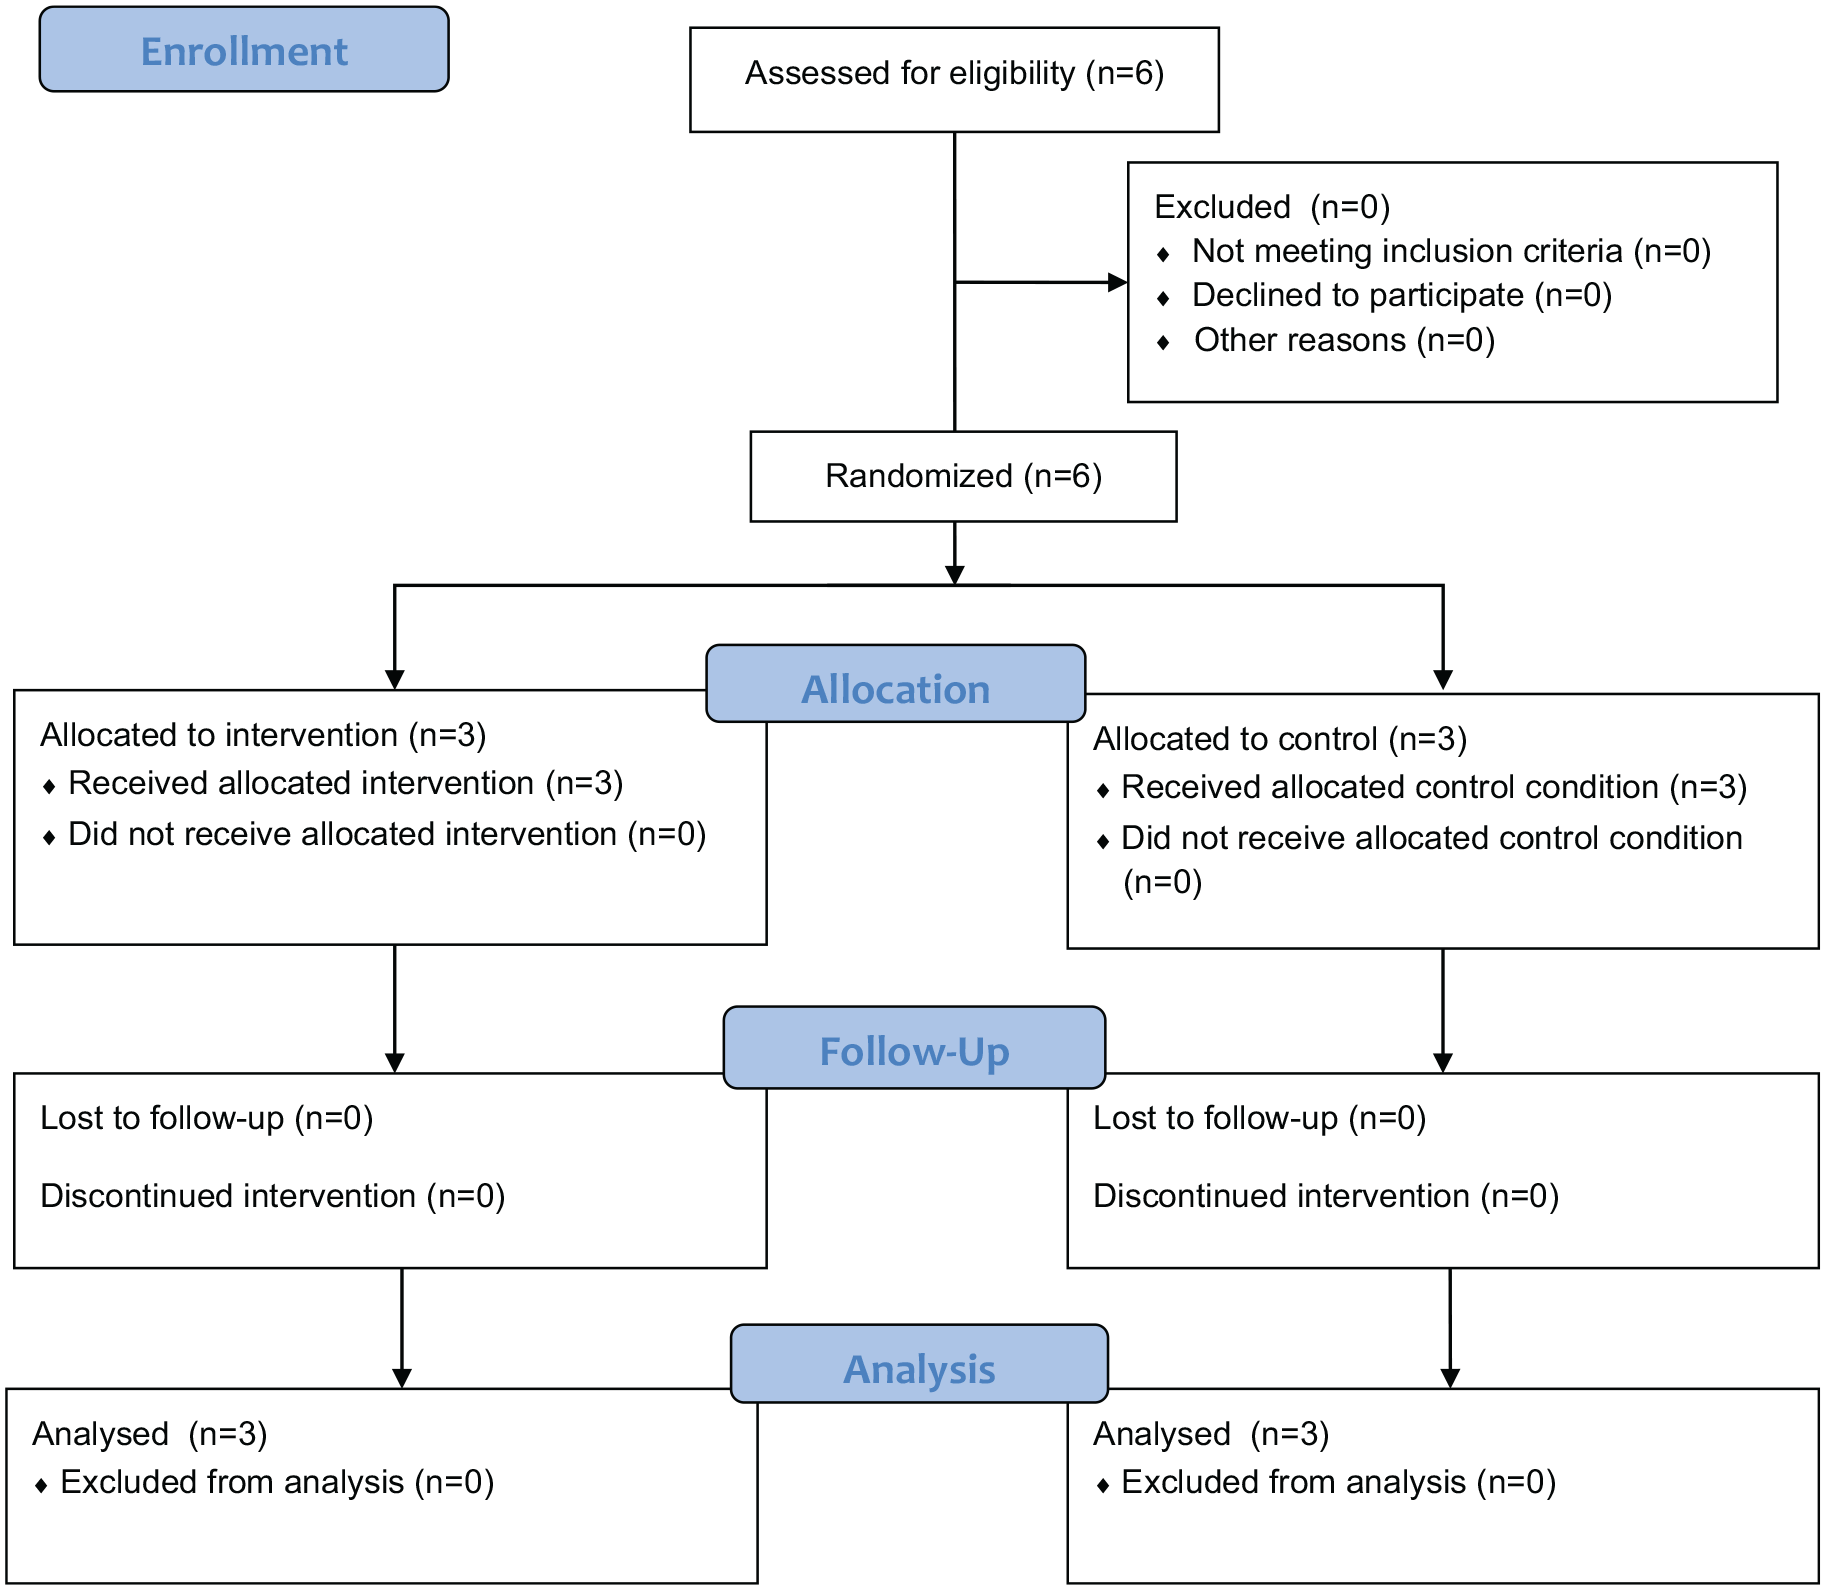
CONSORT (Consolidated Standards of Reporting Trials) Flow Diagram
Intervention Development
A healthy checkout lane intervention was selected and designed based on scientific literature and discussions with the retail partner. The research team first conducted a literature review and compiled a list of potential “nudges” for consideration to test in stores, as well as the behavioral economics theory behind each “nudge.” The list contained 11 potential “nudges,” one of which was the healthy checkout lane experiment.
The research team met with the retailer’s regional operations manager and one grocery store’s general manager to review the list of potential “nudge” experiments, highlighting the behavioral economics theory or concept behind each. The store managers chose to implement the healthy checkout lane product display experiment because it was inexpensive and the most feasible since they had experience implementing similar nudges with unhealthy food items.
In addition to the product display, the regional operations manager recommended adding a secondary “upsell” component to enhance the healthy checkout lane intervention. The researchers defined an upsell as “a sales technique in which a seller induces the customer to purchase more expensive items, upgrades, or other add-ons in an attempt to make a more profitable sale” (Krishnan, 2017). During the checkout process, clerks would ask customers if they would like to purchase a can of peanuts. The regional operations manager thought this would be a simple addition to the intervention since all six stores had previously implemented upsell promotions, and store managers and clerks were already trained on upselling protocols. In previous upsell promotions at the stores, the stores offered cashiers incentives for upselling; however, the stores and research team did not offer incentives to cashiers for performing the upsell due to reproducibility concerns.
The research team and store managers selected a healthier product to promote during the healthy checkout lane intervention. The managers conveyed that many customers have type 2 diabetes mellitus and often ask where they can find “diabetic-friendly snacks” within the stores. Given the large number of epidemiological studies demonstrating that the consumption of nuts (including almonds, walnuts, hazelnuts, pecans, peanuts, pistachios, macadamia nuts, cashews, and Brazil nuts) is associated with a reduced risk of type 2 diabetes mellitus (Del Gobbo et al., 2015; Jaceldo-Siegl et al., 2014; R. Jiang et al., 2002; Kochar et al., 2010; Luo et al., 2014) and cardiovascular disease (Del Gobbo et al., 2015; Grosso et al., 2015; Jaceldo-Siegl et al., 2014; Kochar et al., 2010; Luo et al., 2014; Mayhew et al., 2016), the research team proposed that nuts be displayed in the checkout lane. The managers provided the research team a list of nut products that all six stores currently sold. The research team selected a 6-ounce can of peanuts, a small “grab-and-go” item with an affordable price point of $1.99, familiarity with customers, and low sodium content.
Although not a component of the intervention, the store ran a price promotion on the product concurrent with our intervention. This price promotion was scheduled in advance though not shared with the research team during intervention planning. The retailer normally sells the 6-ounce can of peanuts for $1.99. During the first 2 weeks of the intervention, the stores reduced the price to $1.50 per can. All stores (both intervention and control) implemented the same price decrease at the same time.
The research team developed a one-page document for store managers detailing the purpose, product, and duration of the healthy checkout lane intervention to facilitate implementation. Cashiers received a short script to upsell the peanuts stating: “[Retailer name] is promoting alternatives to sweet snacks. Would you like to purchase a can of peanuts for only $1.99?” The research team trained managers on the script and the one-page document during a weekly store manager conference call before initiating the intervention. Following the training, the regional operations manager instructed the managers of the intervention stores to move one case of peanuts to the registers and train their cashiers to use the script. All intervention stores displayed six cans of neatly stacked peanuts and a clear price tag at the register. The displays were standardized across the intervention stores’ checkout lanes (i.e., the peanuts were displayed prominently at the registers, no other products were part of the peanut display, and the peanut’s price was clearly displayed; Figure 2). The display and placement were decided on and designed by the retailer’s regional operations manager and executed by the store managers. The intervention began on Sunday, July 29, 2018 and ended on Saturday, August 25, 2018.
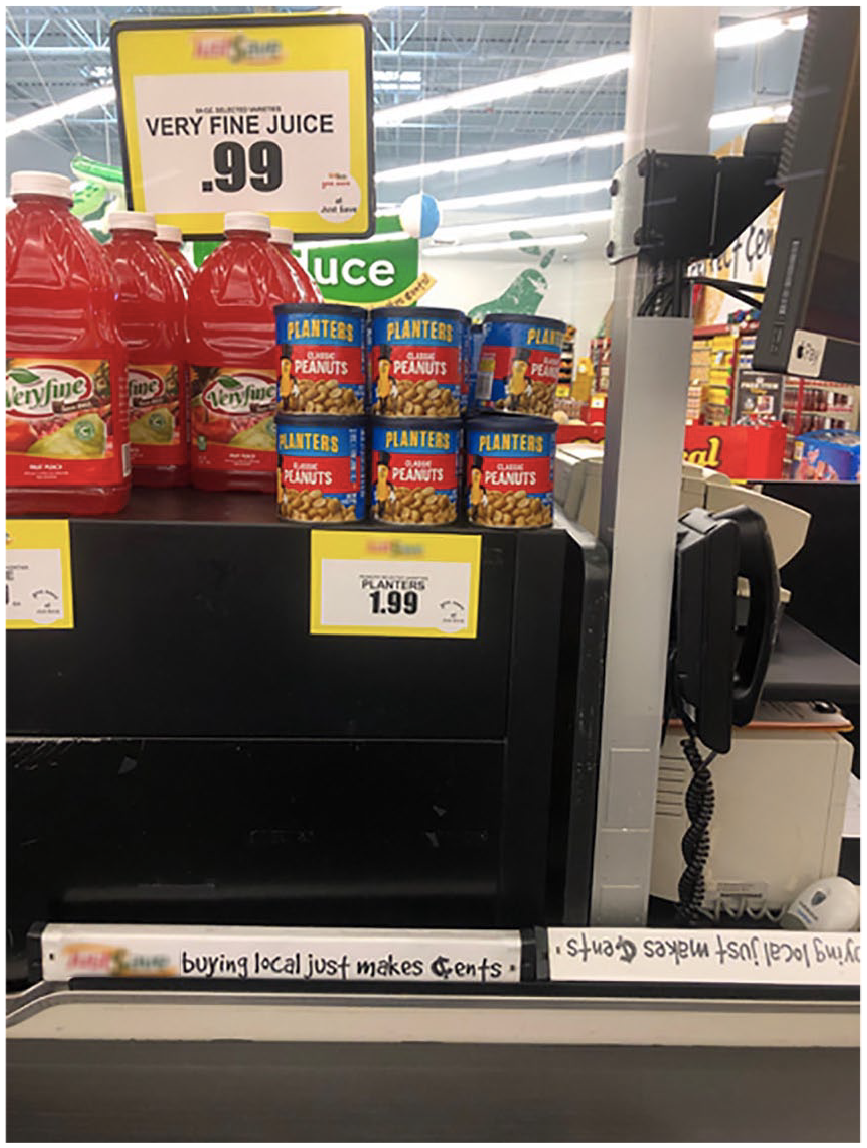
Intervention Checkout Lane Display
Measures
The primary outcome measure was sales of the 6-ounce can of peanuts. Weekly aggregated store-level sales data were collected for the promoted intervention item from July 1, 2018 to August 25, 2018 from each of the six grocery stores. Sales of the peanuts were provided for 4 weeks before the intervention (the preintervention period, July 1, 2018 to July 28, 2018) and for the 4-week intervention period (July 29, 2018 to August 25, 2018). Sales data for the peanuts from 1 year prior (July 2, 2017 to August 26, 2017) was used to compare yearly sales trends and draw stronger conclusions from the 2018 sales data.
Two trained research assistants (RAs) conducted weekly fidelity checks in each of the intervention stores during the 4-week intervention period. Fidelity checks were conducted covertly and at random so that managers and cashiers did not change the checkout lane display or their upselling behaviors due to the presence of research staff. RAs would either discreetly observe two cashiers or act as “secret shoppers” to determine whether the display was correctly presented and if cashiers were performing the upsell. RAs were instructed to observe at least three transactions for each cashier. RAs then completed checklists on whether the correct product was present at checkout, whether the cashiers performed the upsell and used the correct script, and whether the cashiers upsold the correct product. Additionally, because price influences food purchasing behaviors (DiSantis et al., 2013), RAs recorded the prices of the promoted peanuts during each fidelity check.
Statistical Analysis
To analyze the primary outcome measure, t tests were performed to assess the change in mean preintervention sales to mean sales during the intervention period between intervention and control stores. All sales data were analyzed in December 2018. To analyze intervention fidelity data, the research team calculated (a) the proportion of times the correct peanuts were promoted at the cashier’s station, (b) the proportion of times in which the promoted peanuts were priced correctly, (c) the proportion of times each cashier upsold the peanuts, and (d) proportion of times the cashier used the correct script to upsell the peanuts. An aggregate intervention store fidelity score (e.g., proportion of times when the observation satisfied all components of fidelity) was then calculated for each intervention store. All analyses were conducted using Stata/SE (Version 15, 2017, StataCorp LLC, College Station, TX).
Results
RAs conducted weekly fidelity checks for 4 weeks in the three intervention stores, resulting in a total of 12 fidelity checks. Table 2 displays the fidelity results by store and cashier. Adherence to the product display component of the healthy checkout lane protocol was high. All three intervention stores displayed the correct 6-ounce can of peanuts at each cashier’s station during each week of the intervention with the correct display design (Table 2). Additionally, the peanut displays were standardized across the stores, and no other products were displayed next to the peanuts except during two of the fidelity checks in Store 3 (Table 2). However, no cashiers upsold the peanuts using the script during any of the fidelity checks in Stores 1 and 2 (Table 2). The cashiers in Intervention Store 3 upsold the peanuts in two out of the four fidelity checks and used the correct script in one out of the four fidelity checks (Table 2).
Results From Weekly Fidelity Checks in the Three Intervention Grocery Stores During the Upsell Experiment
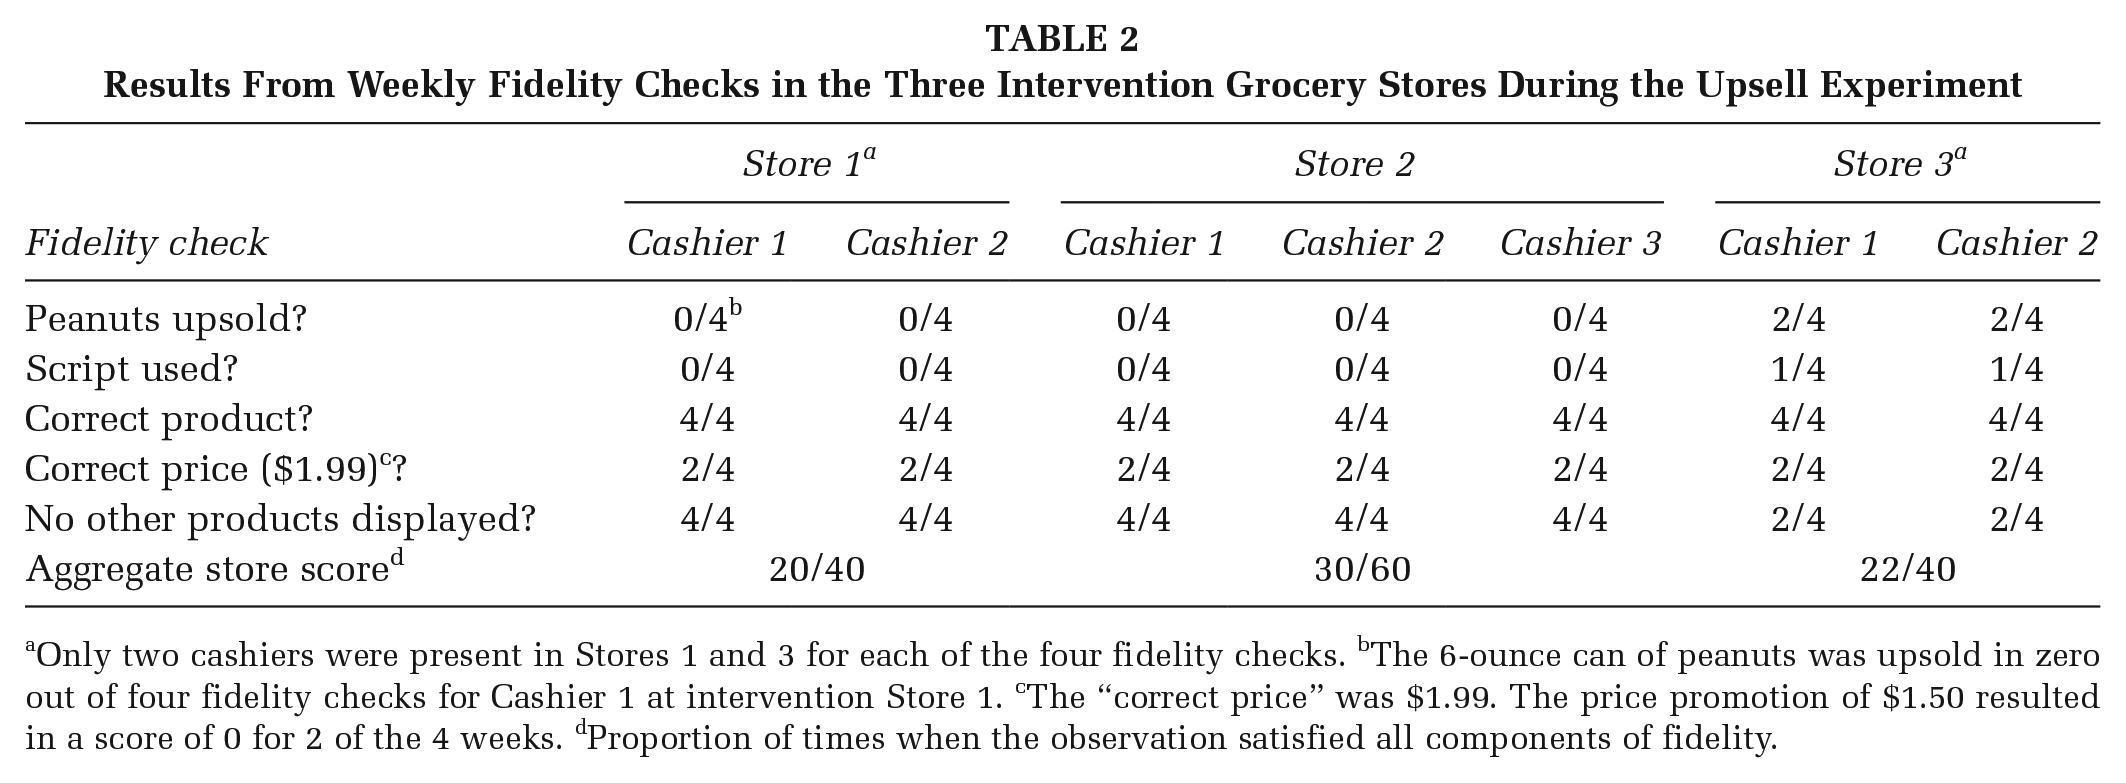
Only two cashiers were present in Stores 1 and 3 for each of the four fidelity checks. bThe 6-ounce can of peanuts was upsold in zero out of four fidelity checks for Cashier 1 at intervention Store 1. cThe “correct price” was $1.99. The price promotion of $1.50 resulted in a score of 0 for 2 of the 4 weeks. dProportion of times when the observation satisfied all components of fidelity.
Average weekly unit sales from 4 weeks before the beginning of the healthy checkout lane intervention, as well as average weekly sales during the 4-week intervention period, are summarized in Table 3. On average among the intervention stores, sales of the promoted peanuts increased by 10 units during the 4-week intervention period compared with the preintervention period (15.83 vs. 5.83 units, p = .04). In the control stores, there were no significant changes in sales of the promoted peanuts during the 4-week intervention period compared with the preintervention period (1.17 vs. 1.42 units, p = .64). The changes in sales (+10 vs. −0.25 units) were statistically significantly different from each other (p = .02).
Sales of the Promoted Peanuts During the 2018 Intervention Compared With 1 Year Earlier
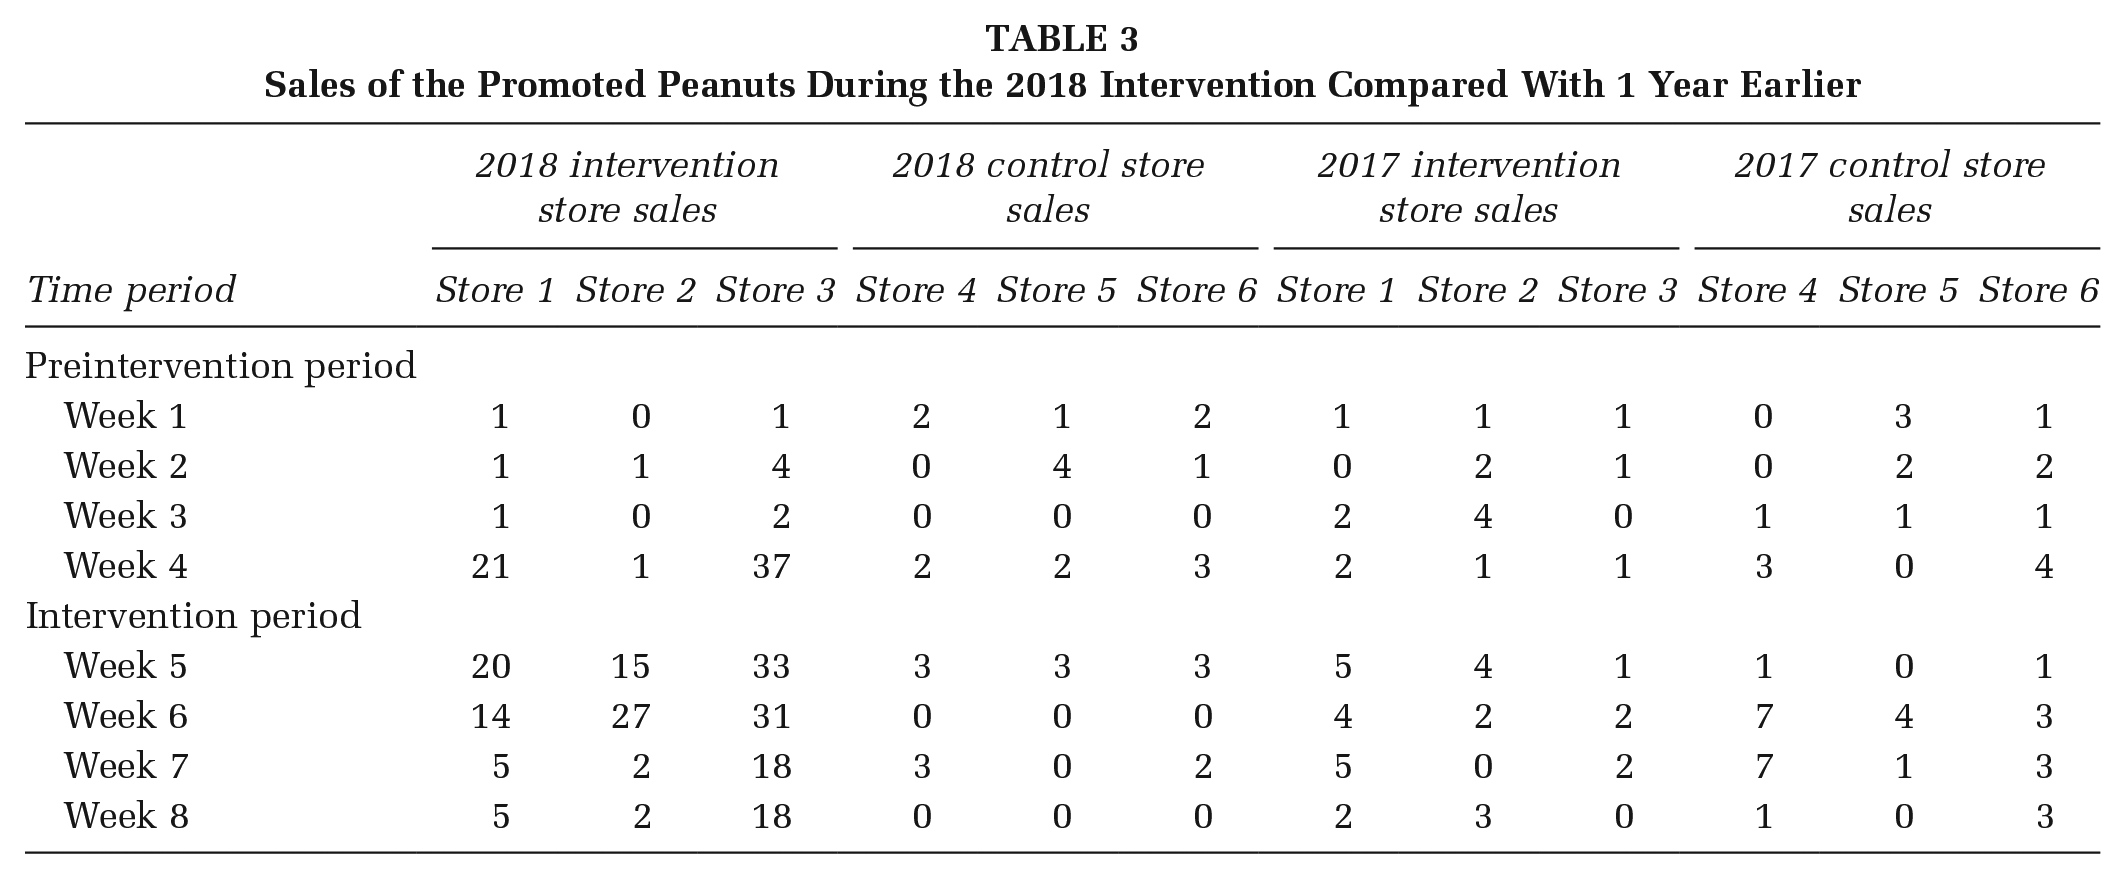
Table 3 presents average weekly unit sales from July 2, 2017 to August 26, 2017 (the same time period as the preintervention period and the intervention period for 2018, but 1 year earlier). In 2017, weekly sales were relatively stable across all stores and similar in magnitude throughout the 8-week time period (Table 3). Conversely, in 2018, sales were similar at baseline between intervention and control stores, remained relatively stable until Week 3, and then significantly increased starting at Week 3 among the intervention stores, while remaining mostly constant among the control stores throughout the 8-week time period (Table 3).
Discussion
In this study, 6-ounce cans of peanuts were moved to the cash registers, the product was temporarily sold at a discount price, and cashiers were told to upsell the product. Results indicate that the 4-week healthy checkout lane intervention increased sales of the promoted peanuts by an average of 10 units per week among the intervention stores. This increase in sales is most likely attributable to a price discount combined with displaying the peanuts at the checkout lane but cannot be attributed to upselling the product alone. During the first 2 weeks of the intervention, the stores ran an unanticipated discount decreasing the promoted product’s price from $1.99 to $1.50 per can in both intervention and control stores. Peanut sales were higher in the intervention stores than control stores. This suggests a positive impact of the product display on peanut sales in intervention stores. Additionally, when the discount began, sales further increased in the intervention stores while remaining constant in the control stores, and when the discount ended during Week 2 of the intervention period, sales in the intervention stores started to decrease. This suggests that a price promotion in addition to displaying the peanuts at the checkout space may be necessary to maximize sales. There was little adherence to the upsell portion of the experiment, so the research team cannot make conclusions about its effect on the study outcome.
Consistent with the results reported by Payne and Niculescu (2018) and Adjoian et al. (2017), this study found that the healthy checkout lane “nudge” was associated with increased sales of a promoted intervention item. However, this study’s “nudge” promoted nuts and discounted the price of the nuts for the first 2 weeks of the intervention period due to previously planned promotion by the retailer, whereas Payne and Niculescu (2018) promoted low-cost fruits and vegetables with no price discount. Our results are also similar to Adjoian et al. (2017) in that our intervention increased sales of a healthy promoted item. However, while our study promoted discounted nuts, their study promoted a variety of snacks such as nuts, seeds, dried fruits, granola bars, and fruits and vegetables with no discount. Additionally, Adjoian et al. (2017) also only offered healthier options at the intervention checkout lanes, whereas our study kept unhealthy snacks in their usual position. Further, unlike the null findings of the Huitink et al. (2020) study, this study did find that the healthy checkout lane “nudge” was related to increased sales of healthy grocery store options.
Limitations and Strengths
The study has several limitations. First, this study included only six stores; thus, the trial may have been underpowered and results are preliminary (Abbott, 2014). A fully powered RCT should be conducted in the future to determine the effectiveness of this intervention in other settings. Additionally, this study took place in five rural and one urban municipality in North Carolina, which limits the generalizability of the study’s findings. However, these study results are likely generalizable to other stores located in rural communities in the American South.
Additionally, the research team initially requested total store sales for each week during the preintervention and intervention period to ensure that changes in the promoted intervention item were not due to overall store sales increasing. However, the retail partner did not provide weekly total store sales to the research team because the information was deemed proprietary. Thus, the study was unable to control for total store sales in the analysis. Future studies should include stipulations in data use agreements stating that “X person (or any ensuing replacement) shall provide X data to the research team.” Researchers could also request total sales from certain sections of the store (e.g., if the intervention targets a fresh fruit or vegetable, the researchers could request total produce sales, which may be a less “protected” number than total store sales).
Furthermore, there was an unintentional price promotion intervention component added to the intervention in which the peanuts were sold at a discount price. This discount was planned in advance, but the research staff were not informed about it during the intervention development process. Therefore, the results of this study are only generalizable and reproducible by retailers and institutions with the capability to implement a price decrease.
Additionally, adherence to the upsell portion of the intervention was low. There are several potential reasons for this. First, during previous upsell promotions at the stores, cashiers were motivated with incentives for producing the highest sales of the product. The research team decided not to offer incentives to the cashiers to enhance the study’s reproducibility, as other research teams or public health practitioners wanting to replicate this experiment may not have the ability to offer cashiers incentives. Additionally, the inability of the research team to build strong relationships with all store managers may have impacted the fidelity of the intervention component. The research team was only able to build a strong relationship with the manager of Intervention Store 3 because it was located close to the team’s university. This strong relationship most likely explains why Store 3 had the highest fidelity to the intervention (fidelity score of 22/40, Table 2). Perhaps if the research team had been able to build strong relationships with the other two intervention store managers, these managers would have taken more ownership in implementing the upsell intervention. Given time and financial constraints, the research team relied on the regional sales manager’s relationship with the managers of Stores 1 and 2 for communicating and implementing the intervention components.
Last, the research team instructed the retail staff to set up the peanut displays in a consistent manner across the stores (i.e., place the same product at the same place near the register, with a consistent price tag, with no other items near the peanuts that would distract from the display). However, while all stores displayed the correct product with consistent pricing throughout the 4-week intervention, the displays did vary somewhat across the stores. For example, some displays had sugary juice drinks and snacks near the peanuts, while other displays did not. These additional and less healthful items may have distracted from the peanut display, decreasing the effectiveness of the healthy checkout intervention.
This study also has several notable strengths. First, this study tested an inexpensive intervention that was easy for retailers to implement. Second, the research team used an objective measure (aggregated store sales data) to analyze the primary outcome, eliminating the possibility of reporting bias. Third, the research team tested the healthy checkout lane intervention in brick-and-mortar grocery stores as opposed to web- or lab-based simulated shopping experiences. Fourth, the research team developed and implemented the intervention in partnership with the retailer, which increased ownership of intervention implementation. Fifth, fidelity checks were conducted regularly, which allowed the research team to discover the retailer’s price promotion. Finally, the research team promoted a common item that the stores were already selling, rather than a new item that the retailer had to procure and introduce to customers, which improved the feasibility and acceptability of the intervention.
Implications for Practice and Research
The prevalence of inexpensive, low-nutrient snack options displayed at grocery store checkout lanes motivates the purchasing of unhealthy items, and thus, poor dietary habits, which ultimately contribute to one’s risk of obesity and associated ailments. This is most burdensome for low-income shoppers who are destabilized by their economic situation and more likely to make an impulse purchase from a checkout lane. Small, community-based grocery stores are excellent settings to conduct health interventions targeted toward food-purchasing behaviors of at-risk populations and improvement of diet quality because they have a community focus, accessibility to low-income shoppers, and relative flexibility compared with larger retailers. Additionally, this study implemented a “nudge” healthy checkout lane intervention with the goal of influencing dietary behavior. This type of intervention is feasible, low-cost, and some components were implemented with fidelity.
Early data from the study indicate that the intervention may be associated with changing consumer purchasing behavior. Given this outcome, the study has the potential to inform store-level policy decisions and grocery store marketing tactics to improve local consumer dietary habits. The findings contribute to the limited research on the effect of healthy checkout lanes on consumer purchasing behavior. Additionally, the study suggests that retailers may need to implement healthy checkout lanes in concurrence with price discounts for a healthy checkout intervention to be successful. Larger RCTs should examine whether discounts are needed for checkout lane product placement to be an effective “nudge” for promoting purchases of healthier foods in stores.
Footnotes
Authors’ Note:
We thank Abrar Al-Shaer for her assistance with the data collection for this project. We also thank Daniella Uslan, Bill Kearney, Brett Sheppard, and Tiki Windley for their assistance with this project. We are also grateful to the six grocery stores for their participation and cooperation during the study. However, the study sponsor had no role in study design; collection, analysis, and interpretation of data; writing the report; or the decision to submit the report for publication. Funding for this project was provided by a grant from the U.S. Department of Agriculture through the North Carolina Department of Health and Human Services, Division of Social Services, Federal Award Identification Numbers: 17165NC4062514 and 18175NC4062514.