
Abstract
This study aimed to use systems thinking tools to understand network relationships to inform discussions, policy, and practice to improve nutrition, physical activity, and overweight/obesity prevention activities in a Western Australian local government area. An audit of nutrition, physical activity, and obesity prevention activities was conducted, and identified organizations were invited to participate in an organizational network survey. Social network analysis (SNA) determined the extent to which organizations shared information, knowledge, and resources; engaged in joint program planning; applied for and shared funding; and identified operational barriers and contributors. SNA data were mapped and analyzed using UCINET 6 and Netdraw software. Five organizations within the network were identified as core; the remainder were periphery. The strongest networks were sharing information, and the weakest was funding. The connections were centralized to one organization, enabling them to readily influence other organizations and network operations. Remaining organizations indicated limited partnership across the networks. Strengthened collaborations and partnerships are essential to health promotion, as they extend reach and organizational capabilities. This study provides a process for undertaking network analysis, identifying leverage points to facilitate communication and information sharing, and reorienting of collaborations and partnerships to consolidate scarce resources and act strategically within a bounded area. There is a need for stronger relationships between organizations and a reorientation of partnerships to facilitate resource sharing within the local government area, to improve nutrition, physical activity, and obesity prevention practices. SNA can assist in understanding organizational prevention networks within a bounded area to support future planning of practices and policy.
Keywords
Poor nutrition, physical inactivity, and overweight/obesity are common risk factors for noncommunicable diseases (NCDs), with more than 1.9 billion people globally classified as overweight/obese in 2016 (Australian Institute of Health and Welfare, 2018; Di Angelantonio et al., 2016; Green et al., 2013; World Health Organization, 2018). In Australia, two thirds of adults (67%) fall within the classifications of overweight/obesity, equating to 12.5 million people (Australian Bureau of Statistics, 2018). The indirect and direct costs amounted to $8.6 billion in 2011–2012, which is estimated to increase to $87.7 billion by 2025 should no further preventative action be taken in Australia (PwC Australia, 2015).
Obesity is a complex issue, resulting from an interplay between socioecological factors (Australian Institute of Health and Welfare, 2018). The built environment, occupation type, and available food and physical activity options are just some of the factors enmeshed with an individual’s ability to meet dietary guidelines and engage in recommended levels of physical activity for health benefit (Committee on Evaluating Progress of Obesity Prevention et al., 2013; Dalle Grave et al., 2013). It is therefore vital to consider behavioral, social, and environmental influences that affect obesity (Australian Institute of Health and Welfare, 2018)
Yet many organizations implementing prevention activities tend to favor behavior change programs focusing on risk factors such as poor nutrition and inadequate physical activity levels, to address overweight/obesity (Dalle Grave et al., 2013; Swinburn et al., 2004). These types of programs can be difficult to sustain in the long term and have been found to have limited success (Committee on Evaluating Progress of Obesity Prevention et al., 2013; Gray et al., 2017; Khanal et al., 2016). In addition, there is a tendency for organizations to work in a siloed manner, limiting their interaction with other groups or sectors to affect change, often competing for minimal and/or the same funding (Bevc et al., 2015; Butcher et al., 2014; Nader et al., 2012; Reicks et al., 2014). Insufficient funding also supports competitive program design, with organizations at times seeking to implement prevention strategies in which they can justify their influence on health and maintain funding (Kania & Kramer, 2011). These stand-alone programs can waste limited resources and saturate the prevention space with duplicative interventions (Kania & Kramer, 2011; Whelan et al., 2015).
Systems thinking has emerged within public health as a method to explore the interconnected factors that contribute to prevention, thus improving understanding of an issue in a broader context (Bensberg et al., 2020; Valente, 2010). Systems thinking can determine the relationships between actors (e.g., individuals or organizations), facilitating discussions that can lead to a better understanding of the shifting influences that exist and affect a network’s operation (Bensberg et al., 2021; Carey et al., 2015). A network’s structure can be explored using social network analysis (SNA), which can assist in developing an understanding of the opportunities and constraints placed on individuals and organizations and the roles they play in the outcomes of the network (Borgatti et al., 2018; Valente, 2010).
Understanding prevention initiatives and collaborations between organizations is particularly important considering the need for partnership to address inherently complex issues, such as risk factors for NCDs (Riley et al., 2018; Roussy et al., 2019). By understanding the ways in which these partnerships function, efforts to improve health can be better understood, discussed, and potentially strengthened (Committee on Evaluating Progress of Obesity Prevention et al., 2013).
Purpose
This study aimed to use systems thinking tools to understand network relationships to inform discussions and policy and practice to improve nutrition, physical activity, and overweight/obesity prevention activities in a Western Australian local government area (LGA).
Method
The systems change framework (Davidson & Morgan, 2018), a cyclical, iterative process, guided the research methodology for the study. The framework comprised four stages: (1) defining the situation (establishing boundaries and context), (2) gaining clarity (identifying actors and exploring relationships), (3) finding leverage (identifying strengths and opportunities), and (4) acting strategically (discussing actions to build strength in the network). Approval for the research was obtained from the Curtin University Human Research Ethics Committee (Ethics approval number HRE2017-0862).
Defining the Situation
The boundary of the study was an LGA encompassing eight metropolitan suburbs in Perth, Western Australia. The LGA had a population of 36,549 people, composed largely of adults aged 20 to 40 years (44%), with most classified as overweight or obese (60.5%). Chronic disease among residents included heart disease (4.6%), diabetes (3.8%), and cancer (3.5%) (South Metropolitan Health Service, 2016). The majority of residents did not meet the recommended intake of vegetables (91%) or fruit (51%) (National Health and Medical Research Centre, 2013), and 32% were insufficiently active (South Metropolitan Health Service, 2016).
Gaining Clarity
Phase 1: Network inventory: An advisory committee comprising the research team, obesity experts, community health promotion officers (HPOs), and those working in the LGA (health promotion practitioners and policymakers) used a nominal group technique (Lee-Han et al., 1996) to identify organizations within the LGA based on the frequency they contributed to nutrition, physical activity, and overweight/obesity prevention activities. Activities were included (policy regulation or program) if they were current, conducted in the LGA, comprised more than one session (indicating an ongoing nature), and were population based (not one-on-one). The appropriate person from the identified organizations was contacted and invited to participate in a face-to-face interview at their worksite. Participants were provided with an information sheet, and informed consent was obtained prior to the interview.
Data Collection
The interviews took between 1 and 2 hours to complete, and the data were entered into custom-built software. The inventory (Riley et al., 2018) captured data on the profile of the contact person, type of activity, activity’s objectives (e.g., awareness raising, influencing attitudes, increasing knowledge, behavior change, partnership development), and strategies (e.g., unpaid, paid, and social media, policy/legislation change, advocacy, online/printed resources, education session), and funding type (e.g., charity, local, state and federal, philanthropic). These data were used to inform the second phase of the project (Davidson & Morgan, 2018).
Phase 2: Organizational network survey: The staff members within each identified organization from the systems inventory were contacted via telephone to discuss the second phase of the study and to provide informed consent. After being emailed the survey, a week was provided for completion. To increase the likelihood that a response rate of at least 75% was achieved and the network data could be classified as reliable (Borgatti et al., 2006), two to three reminder telephone calls were carried out.
The online organizational network survey (ONS) was adapted from previous Australian community projects (Davidson & Morgan, 2018; Milward & Provan, 1998) and sought to obtain information on the organizations sharing of information, knowledge, or resources; engagement in joint program planning and implementation; and using an organizational network roster that ranked relationship strength as “high,” “medium,” “low,” or “none.” Participants were also asked to nominate barriers and contributors to implementing physical activity, nutrition, and obesity prevention activities (Bess, 2015; Qualtrics, 2018). This instrument is available on request from the authors.
The ONS was reviewed by the expert advisory committee to establish face and content validity. The instrument was checked for comprehension by six representatives from a health promotion organization whose staff were not involved in the research. Following consolidation of the feedback, the ONS was trialled with HPOs (n = 10) working in the health service to test functionality
Data Analysis
Data collected from the inventory were entered into SPSS, and frequencies and proportions were calculated. ONS data were mapped and analyzed using UCINET 6 and Netdraw software (Borgatti, 2002; Borgatti et al., 2002). Each of the network relationships (Borgatti et al., 2018)—share information or knowledge, share resources, joint planning or running joint programs, receiving funding, providing funding, sharing funding, or applying for shared funding—were combined (Dickison et al., 2016) to create a composite network. Organization responses to barriers and contributors were analyzed using descriptive statistics in SPSS.
The relationships between organizations (nodes) were measured using the composite network. This analysis allowed the position of organizations relative to others to be determined as well as identifying the general structure of the network. We identified the average degree (the average number of ties for each organization), the density (proportion of ties between organizations), the diameter (shortest pathway between two organizations furthest from each other in the network), and the reciprocity (extent to which a relationship between two organizations is nominated as present by both (Borgatti et al., 2018; Hanneman & Riddle, 2005; Hawe et al., 2004). These measures detail the frequency with which organizations were nominated by respondents and assist in determining an organizations influence in a network and overall system cohesion (Borgatti et al., 2018; Valente, 2010). Core–periphery analysis was conducted to segment core organizations with the strongest connections to one another within the network (core nodes), from those that are the least connected (periphery nodes; Borgatti et al., 2018).
Results
Phase 1: Prevention Activities in the LGA
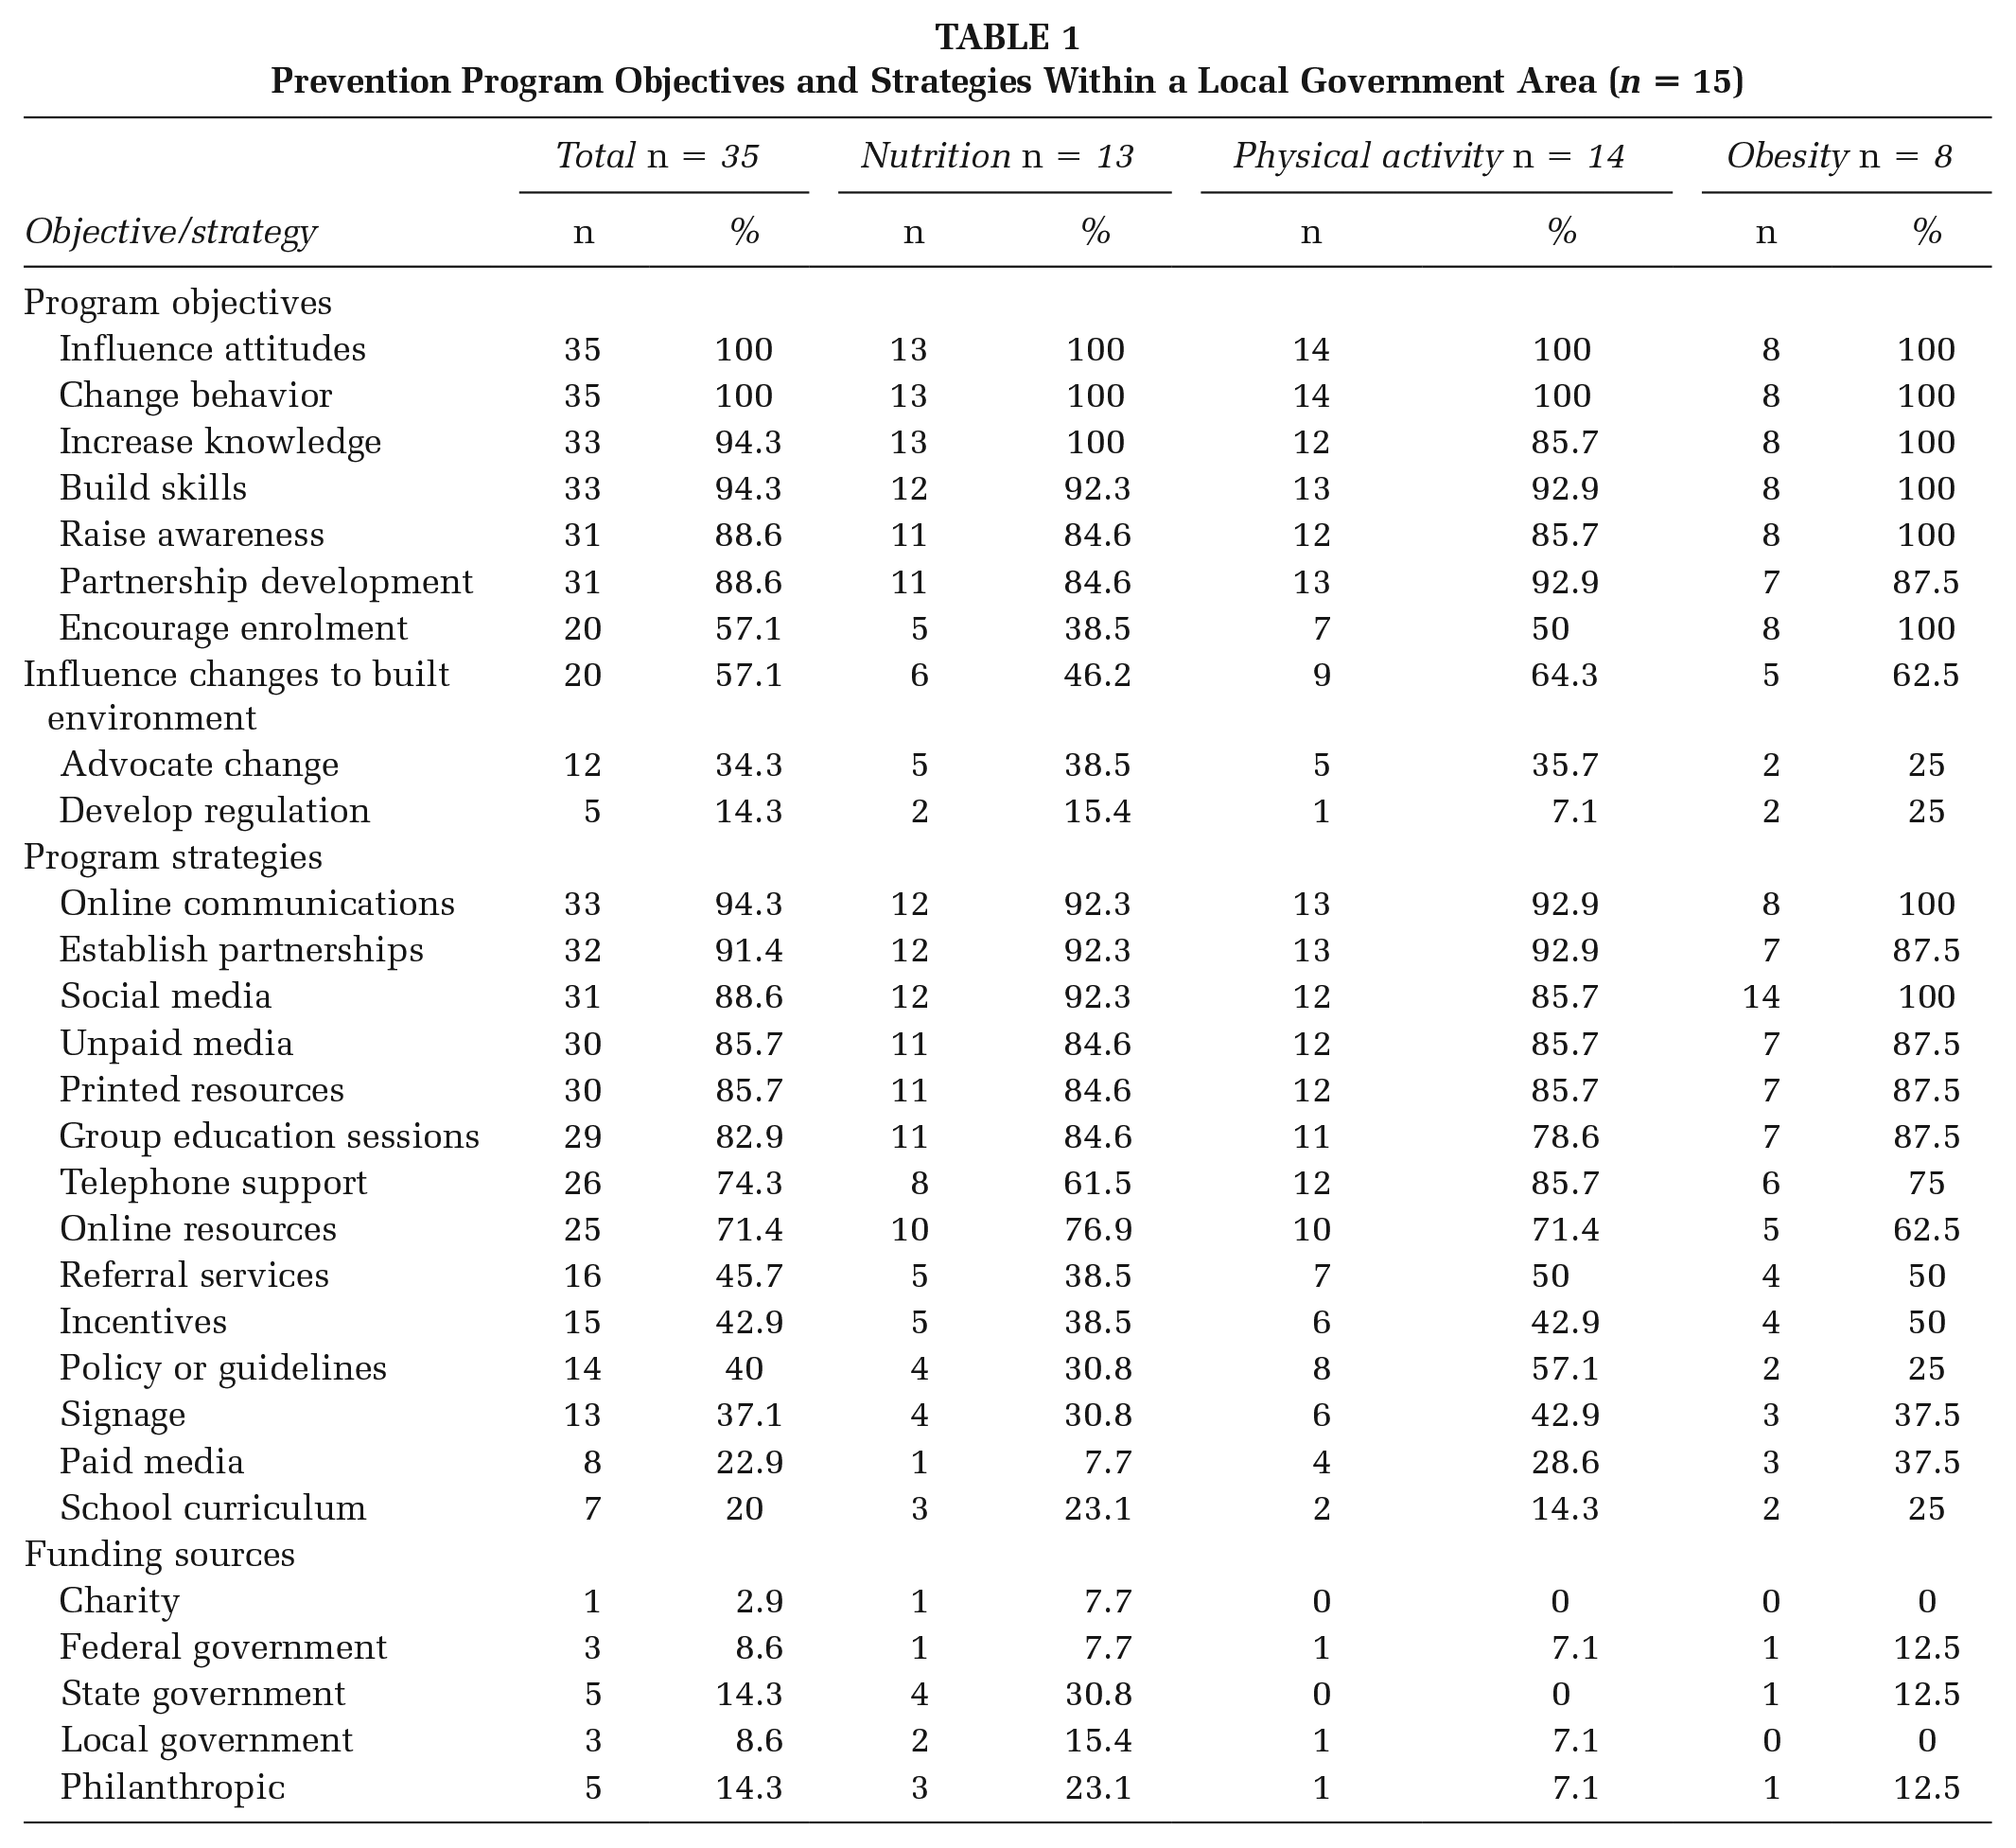
A total of 35 prevention activities were identified in the LGA—13 nutrition, 14 physical activity, and eight obesity. Table 1 provides a summary of the objectives and strategies used by each program.
Prevention Program Objectives and Strategies Within a Local Government Area (n = 15)
Social Network Analysis
Characteristics
Fourteen (93%) of the 15 organizations completed the ONS. The majority were nongovernment organizations (n = 11, 73%), and the remainder were government organizations (n = 3, 20%). The respondents identified as coordinators (community, health promotion, and program; n = 5, 36%), managers (state, center, program, and prevention; n = 4, 29%), and officers (executive or program; n = 3, 21%).
Cohesion
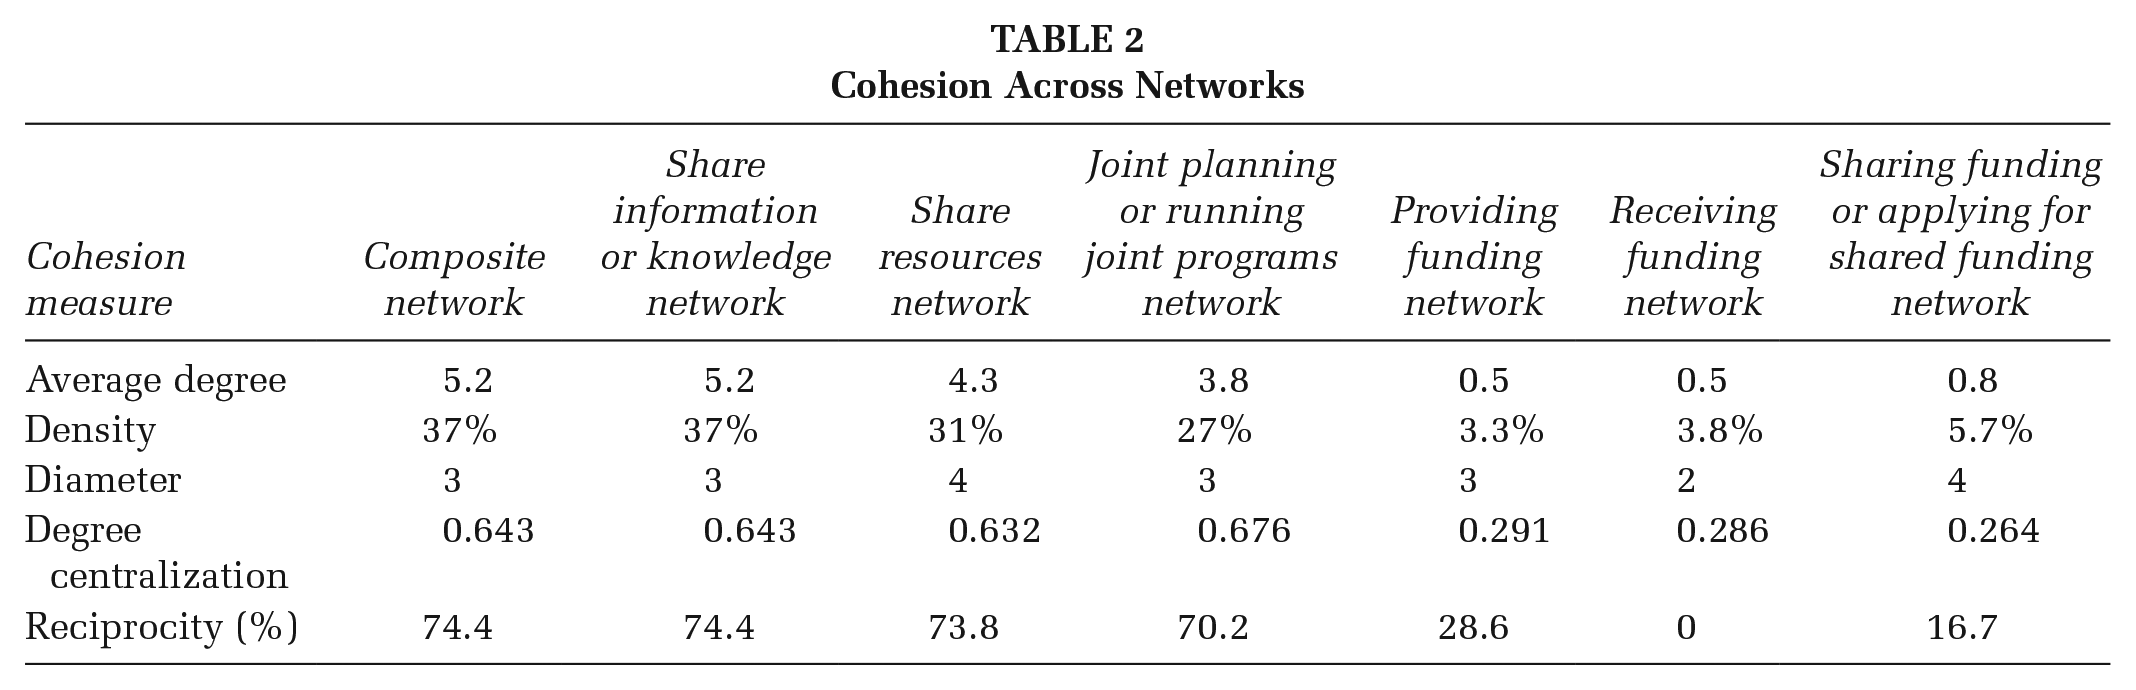
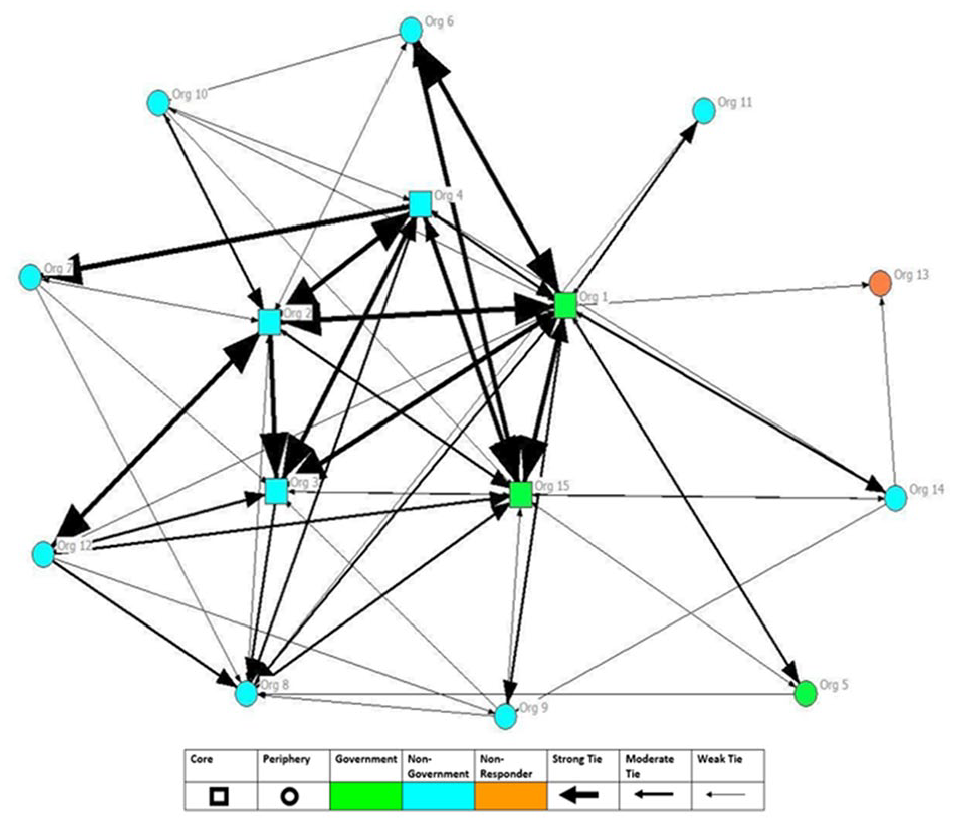
On average, each organization was aware of six of the 15 organizations identified in the ONS. Table 2 shows the cohesion measures for the composite network and within networks (share information or knowledge, share resources, joint planning or running joint programs, receiving funding, providing funding, and sharing funding or applying for shared funding). Density for this network was 0.371; reciprocity for the network as a whole was 74.4%. The “sharing information or knowledge network” produced the same results as the “composite network.” Each subsequent network was reduced in its degree, density, and centralization, though the “joint planning network” had the highest value for degree centralization. The three funding networks (providing funding, receiving funding, and sharing funding or applying for funding) scores were the lowest with density values ranging between 3.3% and 5.7% and average degree values of 0.5 to 0.8. Centralization for these networks was highest for the “providing funding network” (0.291), followed by “receiving funding network” (0.286) and “sharing funding network” (0.264). Figure 1 depicts the three nongovernment and two government organizations identified as core (n = 5; most connected within network) and periphery (n = 9; least connected within network) organizations.
Cohesion Across Networks
The Whole Network and Strength of Relationship Between Organizations
Barriers and Contributions
The most frequently nominated barriers to implementing nutrition, physical activity, and obesity prevention were “insufficient funding” (n = 11), “limited staffing” (n = 11), “limited capacity of partner organizations” (n = 5), “insufficient collaborations and partnerships” (n = 4), “political feasibility” (n = 4), “not enough volunteers/volunteer staff” (n = 3), “insufficient community connections” (n = 3), and “lack of IT [information technology]/web resources” (n = 3).
The nominated highest-ranking contributions by organizations to implementing nutrition, physical activity, and obesity prevention programs were “developing health policy,” “health prevention data,” “funding,” “advocacy,” “expertise other than health,” “facilitation/leadership,” “nutrition expertise,” “program support and coordination,” “paid staff,” and “in-kind resources.”
Discussion
This study assessed the nutrition, physical activity, and obesity prevention network within a metropolitan LGA in Perth, Western Australia. Guided by the system change framework (Davidson & Morgan, 2018), the bounded system was defined, and relationships between organizations within the network were explored with the objective of using this data to identify opportunities that could stimulate discussions to facilitate strategic actions to increase collaborative work.
Both government (n = 4) and nongovernment organizations (n = 11) were identified as being active in conducting nutrition, physical activity, and obesity prevention programs in this network. The intervention activities aimed to incorporate a range of behavioral and environmental initiatives to support healthier lifestyles. Of the 35 prevention activities identified in the LGA, the nominated objectives were predominantly aimed at changing behaviors (n = 35), influencing attitudes (n = 35), and increasing skills and knowledge (n = 33). Conversely, few organizations identified advocacy (n = 12) and policy reform (n = 5) as objectives. The activities were predominantly implemented through an assortment of media strategies and resource development. Although these strategies are not recognized as being inherently ineffective, a more comprehensive approach to prevention encompassing a broader range of objectives and strategies could strengthen their impact (Whelan et al., 2015). The synthesis of current prevention approaches also presents an opportunity for extending the capabilities of organizations by allowing skills and resources to be better harnessed to meet the diverse needs of a population, creating an environment that supports positive health outcomes (Anaf et al., 2014; Corbin et al., 2018). A whole-of-system approach using a multifaceted interconnected response would certainly provide the greatest opportunity to address risk factors and improve health of the community (Bensberg et al., 2020).
The researched network consisted of 15 identified organizations all working in physical activity, nutrition, and obesity. Based on Borgatti’s theory, collaboration between organizations in this network was lower than expected (Borgatti et al., 2018). Furthermore, on average, each of the organizations in the network identified that they were aware of only six of the other organizations listed. This is surprising considering that all the organizations in the network identified nutrition, physical activity, and obesity prevention as a priority and indicate an opportunity for more collaborative approaches to prevention. A potential leverage opportunity would be to raise organizations’ awareness of others prevention activities, to foster increased collaboration.
There were five core organizations within the network (greatest connections), made up of three nongovernment and two government organizations. The remaining organizations (n = 9) were far less connected. Interestingly, while both core and periphery groups frequently selected limited funding and staffing as a barrier to implementing prevention activities, only periphery organizations indicated “insufficient collaborations and partnerships” and “insufficient community connections” as barriers. Core organizations were also more likely to select “limited capacity of partner organizations” as a barrier to implementing programs. This also highlights opportunities for core Organization 1 and other core organizations to facilitate partnerships and collaborations, perhaps reorienting the way in which partnerships are currently conducted.
The weakest whole networks identified were “providing funding network,” “receiving funding network,” and “sharing funding network.” Parameters identified by Gessell et al. (2013) suggest that the average degree value for a network should be greater than one; however, each of the funding networks in our study did not achieve this, ranging from 0.5 to 0.8. Similarly, for a network to indicate a greater probability of mutual relationships between organizations, density values should be greater than 50% but no lower than 15% (Gesell et al., 2013). The “providing,” “receiving,” and “sharing funding” networks in the system also fell outside this range. This is not surprising, given the increasing disinvestment in NCD prevention and the strong competition to access the mere 6% available within the $181 billion Australian health care budget (Bagnall et al., 2019; Di Angelantonio et al., 2016). Consideration of opportunities to apply for joint funding and collaborate on such projects warrant exploration and discussion.
Study Limitations
We may have failed to capture all organizations and the prevention programs operating within the LGA; however, we attempted to address this by seeking advice on who to include in the study from the advisory committee members, local HPOs, and the organizations operating in the LGA. The cross-sectional data are a snapshot in time of the nutrition, physical activity, and obesity prevention network of a metropolitan LGA, but it does provide insights into the network, which will inform future discussions and planning.
Implications for Practice and Policy
Collaboration and partnerships are an essential component of health promotion, as improved health outcomes and prevention of NCDs cannot be attained by any one organization, given their inherent complexity. Therefore, collecting data on what is happening within a network, such as an LGA, is invaluable as it can inform open discussions across the networks organizations, which can facilitate collaborative planning of policy and practices to improve system operations.
In this research, the potential role of core organizations needs to be recognized. These organizations have the capacity to play a facilitation role in strengthening the system through supporting increased communication fostering collaborations and partnerships. Increased communication will raise awareness of other organizations in the network and their activities and provide opportunities for discourse around collaborative activities and potentially joint funding applications. Reorienting partnerships to facilitate resource and expertise sharing will also improve the ability of organizations to consolidate scarce resources and act strategically in addressing obesity and its associated risk factors in the network. The findings from this study will be provided to the participating organizations by the HPOs working in the LGA.
SNA can assist in understanding the complex area of NCD prevention, but it has had limited application. This social network study provides data that can be discussed and actioned, thereby acting as a catalyst for change.