
Abstract
Background
One in four South Carolinians lives in a county along a nearly 200-mile stretch of Interstate 95 (I-95). Stretching from North Carolina to Georgia, this region is among the most rural, economically depressed, and racially/ethnically diverse in the state. Research is needed to identify social factors contributing to adverse health outcomes along the I-95 corridor, guide interventions, and establish a baseline for measuring progress. This study assessed social determinants of health in counties in South Carolina’s I-95 corridor relative to the rest of the state.
Method
Data for South Carolina’s 46 counties were extracted from the Centers for Disease Control and Prevention Minority Health Social Vulnerability Index (SVI), which grouped 34 census variables into six themes: socioeconomic status, household composition and disability, minority status and language, housing type and transportation, health care infrastructure, and medical vulnerability. Each theme was ranked from
Results
Compared with counties outside the I-95 corridor (n
Conclusion
Identifying social determinants of health in South Carolina’s I-95 corridor is a crucial first step toward alleviating health disparities in this region. Interventions and policies should be developed in collaboration with local stakeholders to address distal social factors that create and reinforce health disparities.
Keywords
About one in four South Carolinians lives in a county along a nearly 200-mile stretch of Interstate 95 (I-95) deemed the “Corridor of Shame” (Bowers, 2021; Ferillo, 2005; Moore & Lawrence, 2009). Stretching from North Carolina to Georgia, this region is among the most rural, economically depressed, and racially/ethnically diverse in the state (Moore & Lawrence, 2009). Whereas this moniker originally referred to the region’s poor educational outcomes (Ferillo, 2005), recent research suggests that adverse health outcomes are clustered along the I-95 corridor as well (Mandelbaum et al., 2022; Mandelbaum, Myers, et al., in press; White et al., 2016). For example, young children residing in the I-95 corridor accessed well-child visits less frequently than children in other rural South Carolina counties (McElligott & Summer, 2013). Another study found that high-hypertension prevalence among Black and White Medicaid enrollees was clustered along the I-95 corridor (White et al., 2016).
Many of the same mechanisms underlying poor educational outcomes in the I-95 corridor may also be driving health disparities between this region and other areas of the state (Zimmerman & Woolf, 2014). Education and health disparities are both embedded in macro-level sociocultural, historical, political, and economic contexts that may reinforce one another (Zajacova & Lawrence, 2018). The socio-ecological model considers how individual, relationship, community, and societal factors may put people at risk or protect them from adverse health outcomes, and how these factors may influence one another (National Center for Injury Prevention and Control, Division of Violence Prevention, 2022). Health disparities are often conceptualized as the outcome of multiple causes (e.g., related to economic, policy, environment, and behavioral factors) intersecting at multiple levels (Palmer et al., 2019). The socio-ecological model suggests that approaches that address the social and environmental influences on health (e.g., through interpersonal, organizational, community, and policy changes) may be more likely to sustain prevention efforts and reduce health disparities than individual-focused interventions (Thornton et al., 2016). These social determinants of health (SDOH) are estimated to account for 50% to 60% of health outcomes (Braveman & Gottlieb, 2014; McGinnis et al., 2002). For example, social determinants, such as lack of stable access to broadband internet service can pose challenges to learners and those seeking telehealth services, particularly in rural areas (Graves et al., 2021). More than 220,000 households in South Carolina are underserved in terms of broadband service (do not meet a minimum of 25 Mbps download and 3 Mbps upload speed), many of which are located in the I-95 corridor (State of South Carolina Office of Regulatory Staff, 2022).
Rural hospital closures, historical oppression of indigenous populations, and human trafficking also affect health outcomes in this region. The Southeastern United States has experienced some of the greatest impacts of hospital closures and mergers (McCarthy et al., 2021). Between 2010 and 2019, more than 80,000 South Carolinians lost access to a hospital within a 15-minute drive of their home (McCarthy et al., 2021). The I-95 corridor is also home to five of the nine state-recognized Tribes (South Carolina Commission for Minority Affairs, 2022). Poor social conditions and economic adversity (e.g., disproportionate poverty, inadequate education, and inequitable health service delivery) have contributed to substantially lower health status among the Indigenous Americans compared with non-Indigenous Americans (Indian Health Service, 2019). For example, compared with all races/ethnicities in the United States, Indigenous Americans have a lower life expectancy and higher mortality from conditions including diabetes, chronic liver disease and cirrhosis, and kidney disease (Indian Health Service, 2019).
A substantial number of migrant and seasonal farm workers (MSFW) are employed in South Carolina’s I-95 corridor, and this population faces unique health challenges. The South Carolina Department of Employment and Workforce estimates that nearly 5,000 MSFW were employed in 2015 (“Wagner-Peyser Act,” 2018–2019). This population has complex health care needs; MSFW in South Carolina have higher rates of chronic diseases including diabetes and hypertension, receive insufficient prenatal care, and are exposed to pesticides and other toxins (Halfacre-Hitchcock et al., 2006). The MSFW in the state also encounter barriers to health, including low English proficiency (85% of MSFW are of Hispanic/Latinx origin), limited access to transportation, lack of health insurance, and work in hard-to-reach locations (Halfacre-Hitchcock et al., 2006).
Although several studies have identified differences in health between populations along the I-95 corridor and populations in other regions of South Carolina, few have examined factors that may underlie these findings. Research is needed to identify social determinants that contribute to adverse health outcomes in populations along the I-95 corridor, guide interventions, and establish baseline measures against which progress can be measured (McElligott & Summer, 2013). This study aimed to assess a set of SDOH in counties in South Carolina’s I-95 corridor relative to the rest of the state.
Method
Data for this study came from the Centers for Disease Control and Prevention’s (CDC) Minority Health Social Vulnerability Index (SVI). The SVI was originally developed by the Agency for Toxic Substances and Disease Registry to help identify communities that may be more susceptible to the impacts of disasters (B. E. Flanagan et al., 2011). In addition to disaster management, the SVI has been used to examine multilevel social influences on health outcomes at the local, state, and federal levels (B. Flanagan et al., 2021; see, for example, Gay et al., 2016; Wild et al., 2022; Yee et al., 2019). The SVI uses 15 U.S. census variables grouped into six SDOH (socioeconomic status, household composition and disability, minority status and language, housing type and transportation, health care infrastructure, and medical vulnerability), with percentile rankings for each SDOH and an overall ranking ranging between 0 (least vulnerable) and 1 (most vulnerable). Each SDOH and the data source for its measures are described briefly below and outlined in Figure 1.
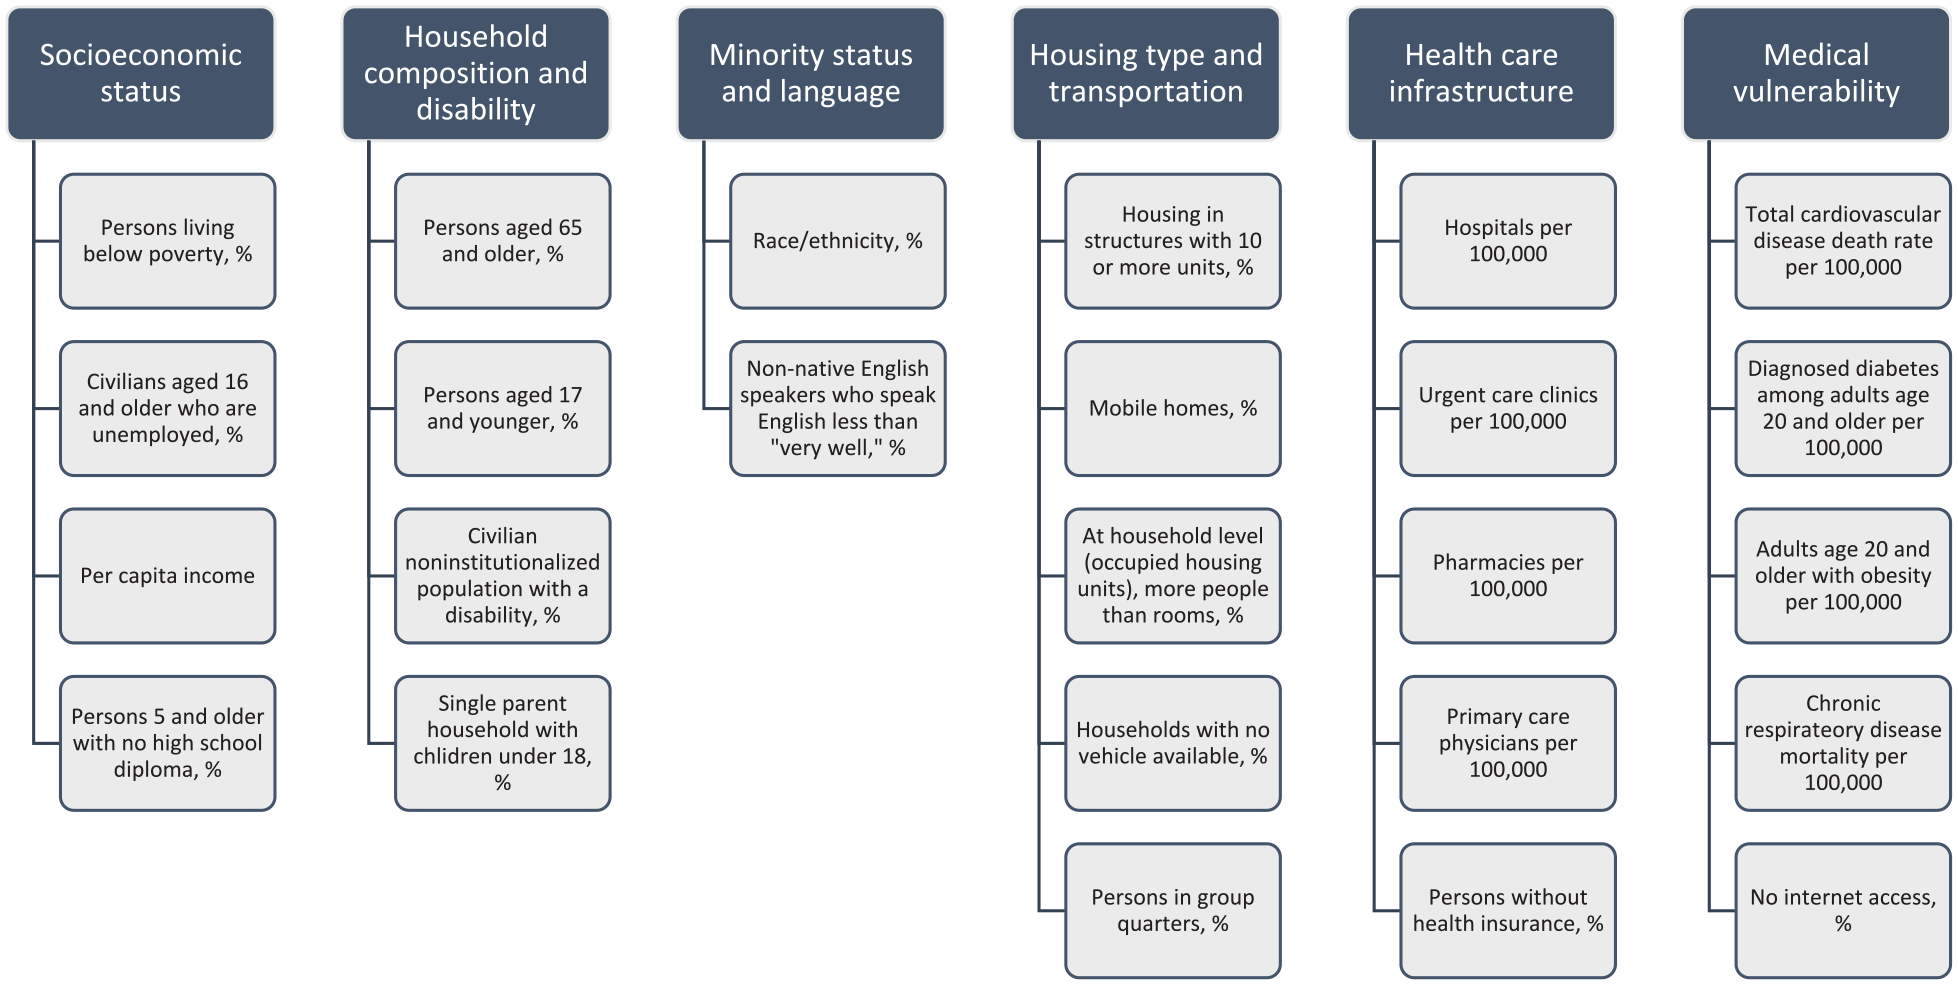
SDOH Measures Used to Examine South Carolina Counties in and Outside of the I-95 Corridor
Socioeconomic status included the percentage of persons living below poverty, civilians aged 16 years and older who are unemployed, per capita income, and persons aged 25 years and older with no high school diploma. Data came from the 2014–2018 American Community Survey 5-year estimates.
Household composition and disability included the percentage of persons aged 65 years and older, persons aged 17 years and younger, civilian noninstitutionalized population with a disability, and single-parent household with children aged below 18 years. Data came from the 2014–2018 American Community Survey 5-year estimates.
Minority status and language included the percentage of persons by race/ethnicity (Indigenous American, Asian, Black, Native Hawaiian/Pacific Islander, Hispanic or Latinx, or Some Other Race Alone) and the percentage of non-native English speakers (i.e., Spanish, Chinese, Vietnamese, Korean, or Russian speakers) who speak English less than “very well.” Racial/ethnic data came from the 2014–2018 American Community Survey 5-year estimates, and language data came from the 2011–2015 American Community Survey 5-year estimates.
Housing type and transportation included the percentage of housing in structures with 10 or more units, mobile homes, occupied housing units with more people than rooms, households with no vehicle available, and persons in group quarters. Data came from the 2014–2018 American Community Survey 5-year estimates.
Health care infrastructure included number of hospitals per 100,000, number of urgent care clinics per 100,000, number of pharmacies per 100,000, number of primary care physicians per 100,000, and the percentage of persons without health insurance. Data on hospitals, urgent care clinics, and pharmacies came from the 2017 U.S. Department of Homeland Security Homeland Infrastructure Foundation. The measure of primary care physicians per 100,000 came from the 2018 Health Resources and Services Administration. Data on persons without health insurance came from the 2014–2018 American Community Survey 5-year estimates.
Medical vulnerability included total cardiovascular disease death rate per 100,000, the number of diagnosed diabetes cases among adults aged 20 years and older per 100,000, the number of adults aged 20 years and older with obesity per 100,000, chronic respiratory disease mortality per 100,000, and the percentage of people with no internet access. Cardiovascular disease mortality data came from the CDC’s 2014–2016 Interactive Atlas of Heart Disease and Stroke. Rates of diagnosed diabetes and persons with obesity were obtained from the CDC Division of Diabetes Translation’s 2016 U.S. Diabetes Surveillance System. Chronic respiratory disease mortality data came from the Institute for Health Metrics and Evaluation. internet access data came from the 2014–2018 American Community Survey 5-year estimates.
Data for all 46 South Carolina counties were extracted from the SVI through a publicly available online database (svi.cdc.gov; CDC) that matched data across several years. Counties were categorized as being in the I-95 corridor based on previous publications (McElligott & Summer, 2013; White et al., 2016). The 17 counties in the I-95 corridor were Bamberg, Beaufort, Calhoun, Clarendon, Colleton, Darlington, Dillon, Dorchester, Florence, Hampton, Jasper, Lee, Marion, Marlboro, Orangeburg, Sumter, and Williamsburg Counties (Figure 2). Data were analyzed using Stata Version 15 (StataCorp, 2017). Descriptive statistics (mean, standard deviation) were calculated, and the Wilcoxon–Mann–Whitney test was used to compare measures between counties in and outside of the I-95 corridor. This nonparametric test allowed us to test the equality of means in two independent samples where the data were not normally distributed (Whitley & Ball, 2002). Institutional review board approval was not needed as this study used a publicly available data set.
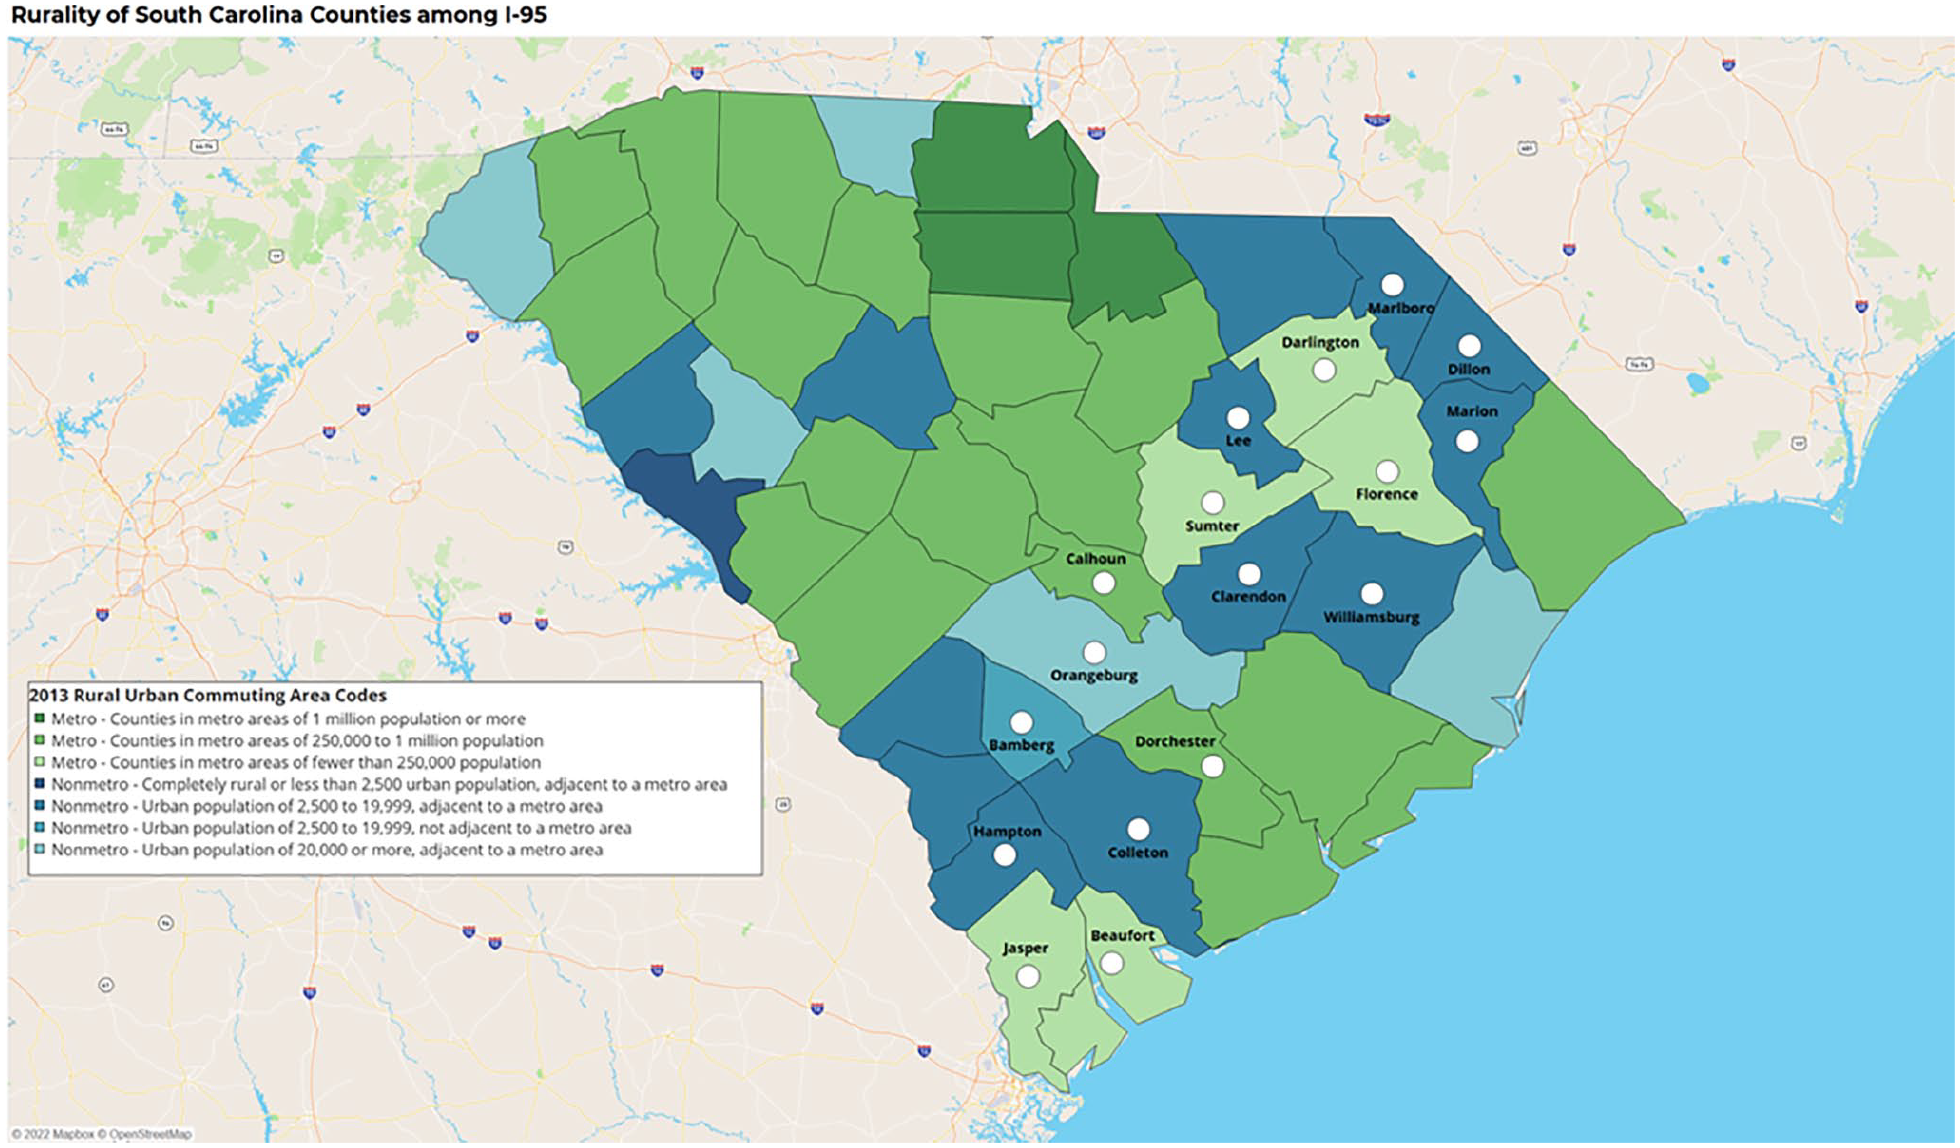
Counties in South Carolina’s Interstate 95 Corridor
Results
About one in five (20.83%) people in counties in the I-95 corridor live below the federal poverty threshold, and 8.86% are unemployed (Table 1). Nearly a third (30.33%) of people in counties in the I-95 corridor do not have internet access, and 8.79% of households do not have a vehicle available. Nearly 50% of people in the I-95 corridor are Black, whereas 4.09% are Hispanic or Latinx. More than a quarter (29.65%) of residences in these counties are mobile homes.
Social Vulnerability Index (SVI) Measures in and Outside of South Carolina’s Interstate 95 Corridor
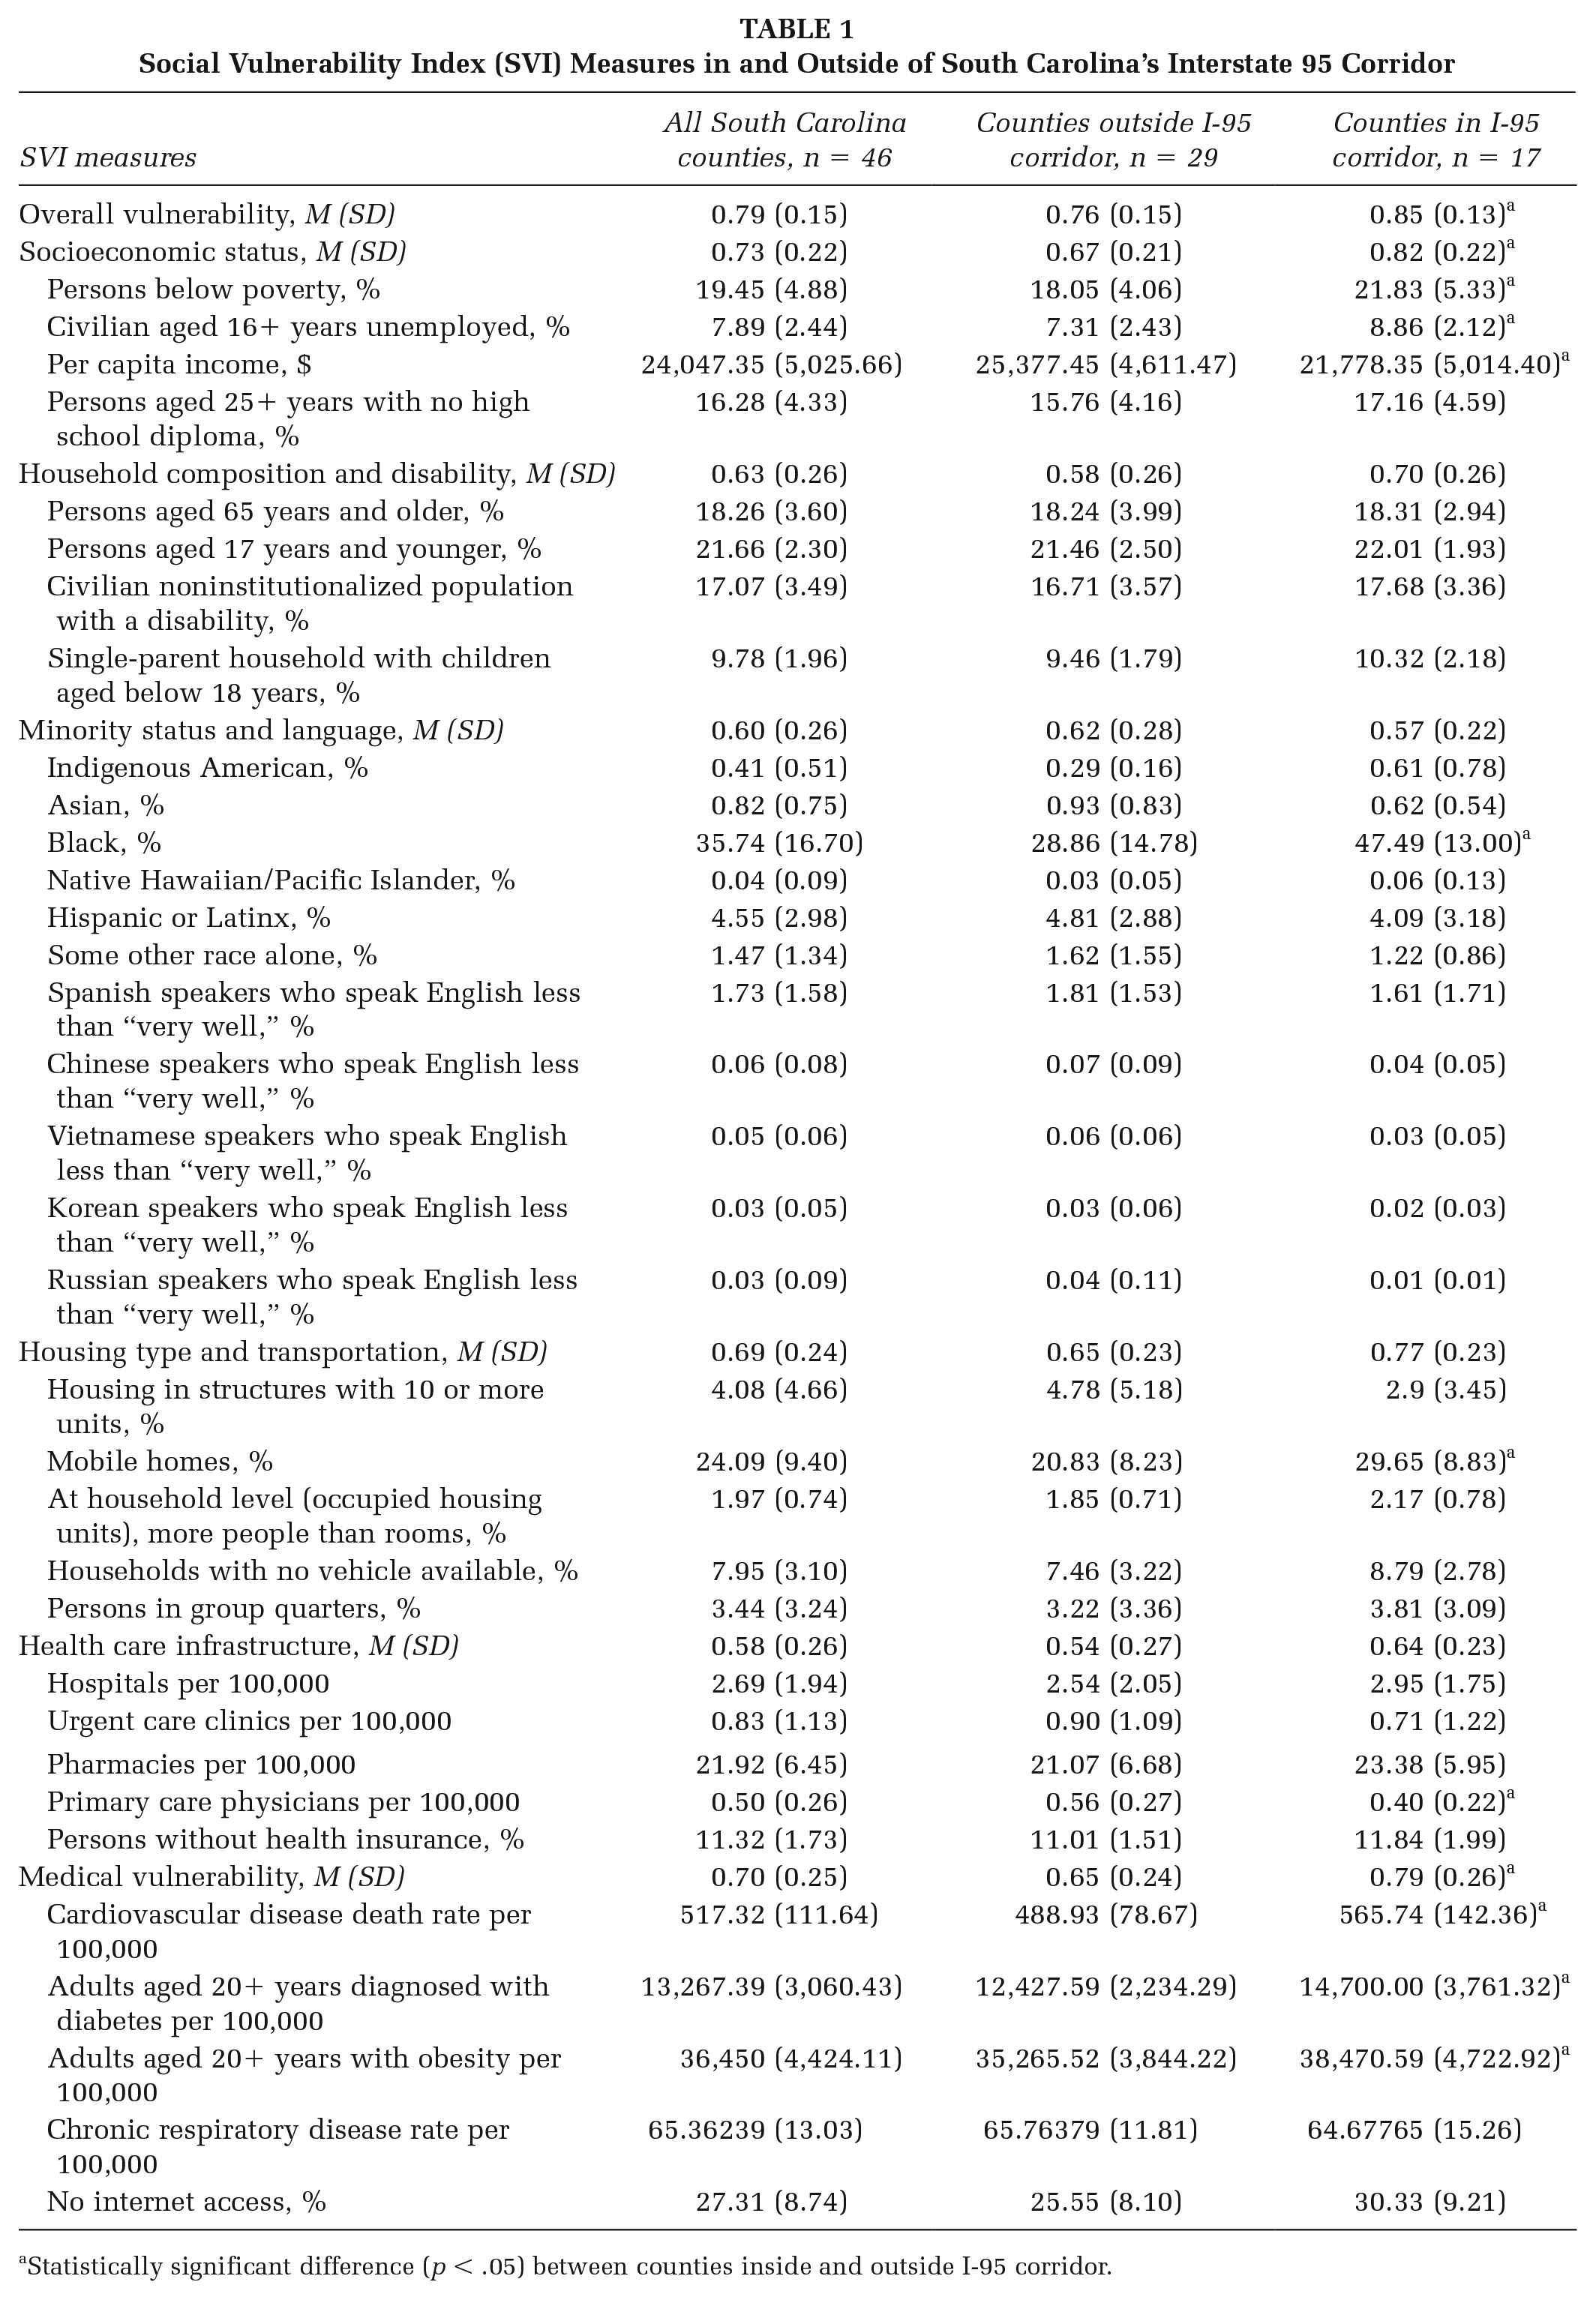
Statistically significant difference (p < .05) between counties inside and outside I-95 corridor.
Several differences were found in SDOH indices between counties in and outside of the I-95 corridor (Table 1; Figure 3). Counties in the I-95 corridor had higher overall SVI scores compared with counties outside the I-95 corridor (0.85 and 0.76, respectively). Counties in the I-95 corridor also scored higher on the socioeconomic status SVI index (0.82 and 0.67, respectively) and the medical SVI index than counties outside the corridor (0.79 and 0.65, respectively). No statistically significant differences were found between counties in and outside the I-95 corridor in terms of SDOH related to household composition and disability, minority status and language, housing type and transportation, and health care infrastructure.
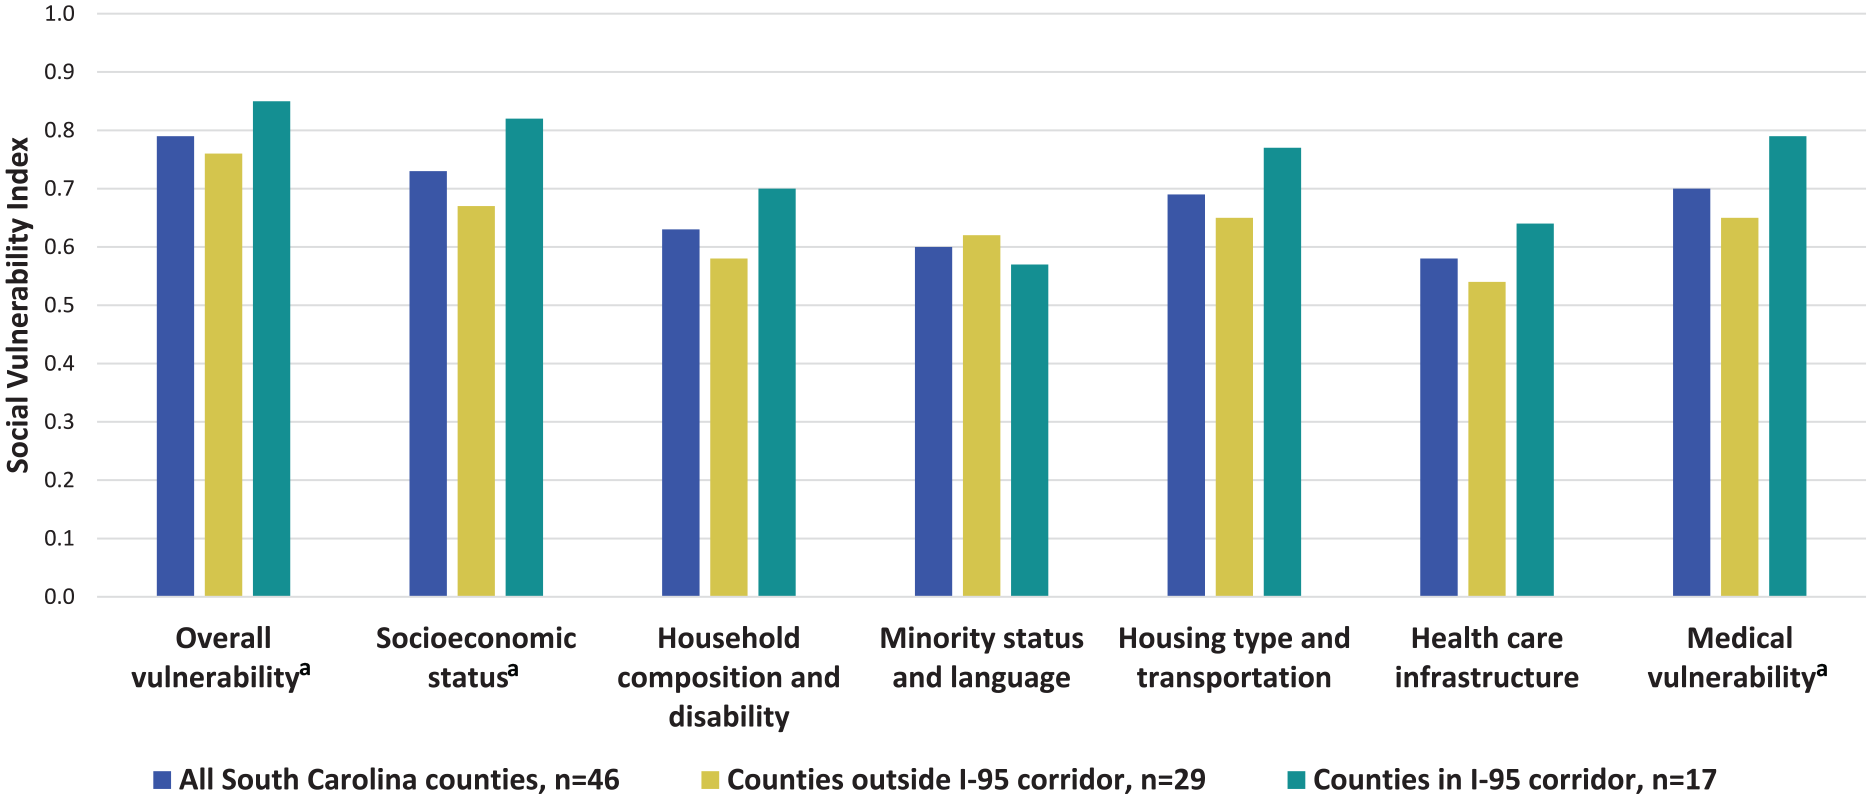
Comparison of Social Vulnerability Index (SVI) Measures in and Outside of South Carolina’s Interstate 95 Corridor.
These indices, however, mask heterogeneity between individual measures. For example, closer inspection of the measures within the medical vulnerability index found that counties in the I-95 corridor had higher rates of cardiovascular disease death, diagnosed diabetes, and obesity, compared with counties outside of the I-95 corridor. In addition, although no statistically significant difference was found between regions in terms of SDOH related to health care infrastructure, counties in the I-95 corridor had significantly fewer primary care physicians than those outside the corridor. Compared with counties outside the I-95 corridor, those in the corridor also had a higher percentage of persons below poverty, higher rate of civilian unemployment, lower per capita income, a greater proportion of individuals identifying as Black, and a higher percentage of mobile homes.
Discussion
This study is one of the few to identify the social determinants that may contribute to adverse health outcomes along South Carolina’s I-95 corridor. Consistent with the published literature, counties in the I-95 corridor of South Carolina face a number of social disadvantages compared with counties outside this region. Identifying these SDOH is important as they may be used to guide interventions and policies addressing the distal social factors that result in the observed health disparities in this region (Williams & Jackson, 2005). Given the SDOH examined in this study, engaging key partners (e.g., community leaders, local health care practices), particularly those outside of the health sector (e.g., those working in unemployment or housing), may be beneficial (de Leeuw, 2017).
This study shows that the I-95 corridor has a higher percentage of persons below poverty, higher unemployment rate, and lower per capita income compared with counties outside of the I-95 corridor. These findings are consistent with previous studies that have found rural areas to have higher rates of poverty than urban areas, especially in the American South (Economic Research Service, 2022). Some of these disparities may be attributable to economic transformations in the South, which led to economic disadvantage (e.g., persistent poverty) and uneven development for many rural regions (Baker, 2020). Federal and state programs to provide human services, income support, job training and placement, and income support, such as Temporary Assistance to Needy Families, may help to reduce these disparities (Rural Health Information Hub, 2022a). Notably, these types of services cannot be separated from related challenges, including lack of access to transportation and inadequate broadband service. Rural areas, such as the I-95 corridor, also tend to have fewer public transportation options and populations living in this region may have to drive longer distances to reach employment, health care, and social services (Rural Health Information Hub, 2022b). Broadband access is also a critical infrastructure for accessing human services, employment opportunities, and educational programs through online portals (Bauerly et al., 2019).
The I-95 corridor also has a higher percentage of Black residents than counties outside the I-95 corridor. Although beyond the scope of this study, numerous studies have documented persistent racial inequities in the SDOH related to both chronic and acute disease outcomes (Cousin et al., 2021; Dalsania et al., 2022; Hunter et al., 2021; Skolarus et al., 2020; Wesselman et al., 2021). This finding points to the importance of ensuring that the programs and policies implemented in this region are equitably distributed and delivered by trusted members of this community. Systemic causes of racial inequities must be addressed with systemic solutions, such as social programs, more inclusive health care institutions, and economic investment (Noonan et al., 2016; Williams & Cooper, 2019).
About 20 million Americans reside in mobile homes (Al-Rousan et al., 2015) and previous research has found that mobile home residents are more vulnerable to natural disasters and worse respiratory health outcomes. For example, mobile home residents are less likely to be ready to evacuate during a hurricane (Kusenbach et al., 2009) and more likely to die from a tornado (Sutter & Simmons, 2010) than residents of a permanent home. These residents are also more likely to have respiratory conditions, such as wheezing and dyspnea, than residents of single-family homes (Gan et al., 2017). These studies suggest that residing in a mobile home can have real health consequences and they point to the need for further research and intervention in the I-95 corridor, where nearly one third of residents reside in a mobile home.
Data also support the need for recruitment and retention of primary care physicians in this region. There is a strong correlation between a more robust primary care presence and better population health outcomes (Starfield et al., 2005). Low access to primary care hinders patients’ ability to receive integrated, comprehensive, coordinated, and continuous services from clinicians who understand their individual needs (Institute of Medicine Committee on the Future of Primary Care, 1994). Nearly two million South Carolinians live in a Health Professional Shortage Area (HPSA), which is an area experiencing a shortage of primary medical, dental, and mental health care providers (Kaiser Family Foundation, 2021). Previous research predicted that, in the next decade, the Southern United States will be among the regions with the largest physician shortage in the country (Zhang et al., 2020). Medical trainees may be incentivized to work in rural practices by loan repayment programs such as the South Carolina Rural Physician Incentive Grant (South Carolina Office of Rural Health). These data should be used in conjunction with key partners (e.g., the South Carolina Area Health Education Center and South Carolina Primary Health Care Association) who can provide community-specific knowledge.
Finally, this study found that residents of the I-95 corridor had higher rates of adverse chronic disease outcomes compared with counties outside of the I-95 corridor, including a higher cardiovascular disease death rate, higher rate of diagnosed diabetes, and higher rate of obesity. As discussed later, current efforts by the state health agency are underway to improve chronic disease prevention and management in this region.
Limitations
This study is limited in that it assumes that counties are homogeneous regions; differences such as geography, demographics, and access to resources may exist within counties. Further inspection of these data at the census tract level may provide more nuance. Some limitations of the SVI are common among census-derived socioeconomic status measures (Geronimus & Bound, 1998). For example, indigenous populations racially may not self-identify as Indigenous; many Indigenous Americans have mixed racial heritage and may report their identities through a combination of census questions on ancestry, tribal information, race, and ethnicity (Liebler, 2018). Census-identified race/ethnicity categories may also not necessarily portray the disparities within certain racial/ethnic groups, for example, comparisons between Afro-Latinx health conditions versus White Latinx populations (Cuevas et al., 2016), or higher rates of heart disease among those with origins from the Philippines versus those from Korea (Reyes et al., 2016).
In addition, some measures in the SVI do not adequately capture upstream structural or institutional determinants of health. For example, the SVI measures racial indicators, such as the proportion of individuals identifying as Black, but not measures of racism (e.g., residential segregation; Williams et al., 2016). Practitioners, researchers, and policy makers should use caution when interpreting these data so as not to implicate race as a risk factor (as opposed to racism; Silverman-Lloyd et al., 2021).
This study aimed to compare aggregate measures of social vulnerability between two regions and the absence of a disparity between regions should not necessarily be viewed as an indication that these measures are at acceptable rates. For example, the state of South Carolina has fewer than three hospitals per 100,000 population, below the high-income country average of 5.3 per 100,000 (The World Bank, 2021). This statistic may be particularly concerning in the context of recent rural hospital closures in the Southern United States (McCarthy et al., 2021).
Implications for Practice
Identifying SDOH in South Carolina’s I-95 corridor is a crucial first step toward alleviating health disparities in this region, and this study’s findings provide several possible points for intervention. Counties in the I-95 corridor may be more socially vulnerable in regard to socioeconomic status and medical vulnerability. Interventions and policies should be developed in collaboration with key partners to address distal social factors that may create and reinforce health disparities. For example, the state health agency is currently implementing evidence-based strategies to prevent and manage heart disease (e.g., self-measured blood pressure monitoring) and diabetes (e.g., diabetes self-management education and support) to address relatively high rates of cardiovascular disease, diagnosed diabetes, and obesity in the I-95 corridor. This agency is also piloting a new initiative in which community coalitions can apply for funding to address a social determinant of health of their choosing to increase access to the National Diabetes Prevention Program (Mandelbaum, Brightharp, et al., in press).
State and local policies might also consider taking a collaborative approach to integrating health considerations into policy known as Health in All Policies (HiAP; CDC, 2016). The HiAP recognizes that many SDOH are determined by actions outside of health care, and that improvements to environmental conditions, such as access to services and safe housing, can have a significant impact on public health (Association of State and Territorial Health Officials, 2013). Implementing an HiAP approach may also include regularly examining the effect that local, state, and national policies have on health equity (Association of State and Territorial Health Officials, 2013). Previous research has found evidence to support policies targeting the SDOH (e.g., income supplements, employment, education, and urban planning and community development), which may help reduce health disparities (Thornton et al., 2016). Despite this evidence, further research is needed to determine the most effective ways to scale-up these interventions (Thornton et al., 2016).
Future studies may combine South Carolina SVI data with health outcomes data to raise awareness among public health practitioners, researchers, and policy makers of the effects of SDOH of South Carolinians. Future work may involve interviews with key partners who work directly with populations in this region (e.g., the migratory farmworker population). Interviews with community members could also be used to see whether their experiences or perceptions align with what these data showed.