
Abstract
State and federal prison systems have experienced an unprecedented and accelerating growth in their elderly inmate populations over the past three decades. While aging inmates have significant operational and cost implications for correctional systems, a clear understanding of the nature and mechanisms behind the growth in this special population does not exist. This article examines the trends in the older inmate population in Florida from 1980 to 2010 to assess whether significant changes in the punishment policies in the state over this period have contributed to this population’s growth and to better understand the composition of this special inmate group. We present annual data over a 31-year period to describe the trends in prison admissions, releases, stock populations, and the average length of stay for the age-groups of 49 or younger versus 50 and older. This trend analysis against a backdrop of changes in punishment structure over time will inform policy makers about how trends in demographic populations like the elderly inmate population in Florida have coincided with shifts in sentencing practices.
Introduction
Over the past three decades, the United States has experienced a substantial growth in the number and proportion of total prison inmates who are elderly. These increases have outpaced those seen in younger age-groups (Human Rights Watch, 2012). The management and medical costs of incarcerating elderly inmates have been found to be substantially greater than those of younger prisoners (Colsher, Wallace, Loeffelholz, & Sales, 1992). Due to declines in health conditions resulting from the natural aging process and preprison risky lifestyles, many older inmates require substantial medical care and assistance with daily living needs from prison staff or other inmates as they age in prison (Colsher et al., 1992; Williams et al., 2006).
A variety of factors have converged to impact the size and change in the composition of this population. Among several other factors, scholars have recently implicated the power of punishment policies to shape the size of prison populations (see Aday 1994, 2003; Georgia Department of Corrections, 2001; Rikard & Rosenberg, 2007). Specifically, numbers of felony arrests, mean sentence lengths, and admissions rates have been suggested as contributors to the growth in prison populations. Only one empirical research study to date has attempted to link punishment and sentencing policies to the growth in the elderly inmate population (see Auerhahn, 2002). Auerhahn focused exclusively on the role that a selective incapacitation (three strike) law played in contributing to the growth in the elderly inmate population in California. The author suggested that sentencing policies led to increases in average sentence lengths and admissions to prison, thereby indirectly contributing to the growth in the overall inmate population. However, it is not well understood whether changes in overall inmate populations directly contribute to the growth in the number of elderly inmates. More than a few of these factors have occurred in Florida, which makes it an important site to determine whether the changes in the number of older inmates and the larger proportions of total correctional systems they comprise have coincided with shifts in punishment policies.
We begin this article by providing the background of the current aging inmate crisis occurring within state and federal prisons, how scholars have defined the elderly inmate, and an examination of the research that has addressed possible causes and consequences of the expanding elderly prison populations. We then turn our focus to Florida with a summary of the state’s sentencing and punishment policies that have been implemented over the last three decades. The current study is then described, including the data, methods, and analytical approaches used to address the research questions. Finally, we provide empirically based answers to the research questions in the form of a comprehensive examination of the trends in the changing elderly inmate population and how changes in Florida’s punishment policies have impacted this special population.
Background
Since the early 1980s, state and federal prisons have witnessed an unprecedented growth in the number of “elderly” inmates. According to Guerino, Harrison, and Sabol (2011), an estimated 246,600 of the 1,446,000 prisoners nationwide are of age 50 and older. In 2000, the estimate of the number of state and federal prisoners of age 55 and older was 44,200 of the 1,237,500 prisoners (Beck & Harrison, 2001; Guerino, Harrison, & Sabol, 2011). According to the American Correctional Association (ACA, 2001), 113,358 out of a total of 1.3 million prisoners nationwide are over the age of 50, which represents a 3-fold increase from the 1990 estimate of 33,499 prisoners over the age of 50. Approximately half of the individuals in this figure are over the age of 55 (ACA, 2001). This growth has increased the average age of all U.S. prisoners behind bars. From 1990 to 1999, the mean age of state and federal prisoners increased from 31 to 34 years (Hughes, Wilson, & Beck 2001). Additionally, the percentage of total “lifers” in state and federal prisons increased from 17.8% in 1992 to 26.3% in 2003 (Mauer, King, & Young, 2004).
The increase in the proportion of elderly inmates has resulted in a substantial economic cost. Recent studies report estimates of elderly inmates costing 2–3 times more than the average inmate, largely the result of significantly higher health care and management costs associated with elderly inmates relative to younger inmates (Chettiar, Bunting, & Schotter, 2012; Curtin, 2007; Fellner & Vinck, 2012; Yates & Gillespie, 2000). While annual incarceration costs for the average inmate are commonly reported to range from US$20,000 to US$30,000, older adult inmates may cost anywhere from US$40,000 to US$90,000 per year to incarcerate, mostly resulting from the additional medical care they require (Dubler, 1998; Ornduff, 1996). As this population continues to expand, the health care costs, number of personnel, and equipment resources required to address their daily living needs will increase, and the financial burden on state and federal government will continue to rise (McDonald, 1995).
Defining the Elder Inmate
The aged inmate has been defined in a variety of ways. Some studies have defined “older offenders” as those 50 or older (Goetting, 1992), 55 or older (Aday, 1994; Anderson, 1997; Auerhahn, 2002), 60 or older (Kratcoski, 1990), or even 65 and older (Newman, 1984). Chronological definitions of “oldness” should be used with caution, however, since they do not always accurately depict the physical and mental health condition of prisoners. An inmate who exhibits the physiological conditions of a 60-year-old may only be 50 years of age (Petersilia, 2001). This accelerated aging is due to a combination of preprison risky lifestyles combined with the consequences of the natural process of aging. As a result, inmates’ physical (and possibly mental) health often declines at a greater rate compared to elderly persons in the general resident population (Colsher et al., 1992; Kerbs & Jolley, 2009). While there is no universally agreed upon operational definition of who should be defined as an elderly inmate, the most common threshold of what constitutes an elderly offender, based on a national survey of state correctional institutions, is the age of 50 or older (Aday, 1999).
Most of the research focuses on conceptual issues associated with the growth in the elderly inmate population, including prison management considerations associated with imprisoning the elderly (Aday, 2006; Hurley, 2014), health care issues (Aday, 2003, 2006; Hurley, 2014; Jaques, 2006; Williams, Goodwin, Baillargeon, Ahalt, & Walter, 2012), reentry challenges (Williams & Abraldes, 2007), and public policy concerns (Aday, 2003; Hurley, 2014; Miller, 2009). Despite a near absence of empirical research on the contributors to the growth in this population, some scholars and practitioners have claimed that determinate sentencing policies implemented in the 1980s and 1990s have had a hand in contributing to the current aging inmate crisis (Aday, 2003; Georgia Department of Corrections, 2001).
Contributors to the Growing Elderly Inmate Population
Scholars and researchers (Aday, 1994, 2003; Georgia Department of Corrections, 2001) attribute the growth in the elderly prison population to the convergence of several factors in a relatively short period. First, there was growth in the proportion of elderly in the general population and elderly citizens being arrested for serious crimes that warrant long-term prison sentences ( Corrections Yearbook, 2000; Silverman & Vega, 1996). Second, prison capacity expanded during the 1990s, which allowed for more persons to be incarcerated (Aday, 2003). Third, the use of discretionary release mechanisms was greatly reduced, which affected the number of people leaving prison (Aday, 2003; Edwards, 1998). In some states, such as Florida, parole was abolished and replaced with a more determinate punishment structure in which prisoners were required to serve at least a minimum proportion of their court-imposed sentence length (i.e., truth in sentencing). Even in those states that retained parole, policies such as mandatory minimum sentencing reduced the number of eligible inmates who could be paroled (Georgia Department of Corrections, 2001). Two- and three-strike laws, which generally mandate that an offender serve the majority of their court-imposed sentence length (e.g., 90%), may also lead to more prisoners serving longer periods in prison.
With much speculation pointing to determinate punishment policies as a contributor to the aging inmate population, it is surprising that only two studies have quantitatively assessed the factors that contribute to the growth in the prison population—one of which examines the impact of punishment policies on the growth in the elderly inmate population (Auerhahn, 2002; Luallen & Kling, 2014). Auerhahn (2002) examined the impact of three-strike laws on the proportion of elderly inmate populations using dynamic simulation modeling. This nonconventional modeling approach is most often used in engineering to examine the changing composition of populations in a system. The author applied this technique to examine population flows through the criminal justice system in California. Additionally, this approach allows for assessing changes in populations from 1 year to the next. Auerhahn found that the three-strike law in California did not have a discernible effect on the growth in the aging inmate population and would not affect the distribution of older inmates in subsequent years.
Another study that has quantitatively examined the predictors of the change in the elderly inmate population, conducted by Luallen and Kling (2014), used a population decomposition approach to determine the factors that contributed to changes in the elderly inmate populations in four states since 2000 (South Carolina, North Carolina, New York, and California). Using data collected from reports submitted to the Bureau of Justice Statistics’ National Corrections Reporting Program, the authors found that age at prison admission among older inmates is the main contributor to the growth in the older adult prisoner population (50 and older) since 2000. The inmates’ offenses and time served/sentence lengths did not have as much influence on the composition of elderly inmate populations during the same period. A limitation of this study is the relatively short time frame (2000–2012) used to examine changes in the prison population, which does not allow for assessing the impacts of the shifts in punishment policies that occurred over the last three decades.
The Evolution of Florida’s Punishment Structure
Since the early 1980s, Florida, like most other states in the United States, has experienced a dramatic shift in its punishment structure. Prior to 1983, Florida’s approach to criminal punishment involving imprisonment was to mete out indeterminate sentences with the possibility for parole. The amount of time inmates served in prison was largely dependent upon when the Florida Parole Commission deemed the offender was rehabilitated and was a minimal risk to public safety. Parole was eliminated in Florida for crimes committed on or after 1983 except for first-degree murder convictions that resulted in a life sentence. While the elimination of parole was touted as a change from indeterminate to determinate sentencing, which returned the punishment decision back to the judiciary, the gaintime laws were also changed. This latter change allowed for significant reductions in time served through the earning of gaintime through good behavior and even provided for unearned gaintime that resulted in one third of the court-imposed sentence. The use of these various forms of liberal gaintime policies and early prison release credits was required from 1987 to the end of 1994 to prevent Florida from violating the legal maximum prison population imposed by the courts.
True determinate sentencing in Florida was not a reality until late 1995, when the state enacted a “truth-in-sentencing” law which required all offenders sentenced to prison for a crime to serve a minimum of 85% of their court-imposed sentence length (Bales et al., 2010). Prior to the implementation of this 85% law, the average percentage of sentence served was between 34.9% and 39% (Bales et al., 2010, p. 51). Among the 7,967 inmates released from Florida prisons between October and December 2013, 7,832 (98.3%) had been sentenced under the minimum 85% of sentence served law passed in 1995 (Florida Department of Corrections [FDC], 2014). It is also important to note that the average percentage of sentence served among inmates released in June 2013 was 85.2% (FDC, 2014).
To date, the empirical research has not examined the link between state truth-in-sentencing laws and the growth in the elderly inmate population. While there is reason to believe that time served may be drastically affected by this determinate punishment structure, it is not well understood whether prison admissions or the type of offenders entering prisons would also be indirectly affected by these shifts.
The Present Study
The present study contributes to the correctional literature on elderly inmates in a few specific ways. First, we use data from the state with the third largest inmate population and the second largest elderly inmate population in the United States. In addition, our data span the period from 1980 to 2010, a length of time that, to the best of our knowledge, is unprecedented in the literature. As a result, these data allow us to examine how changes in the elderly inmate population coincided with policy changes in Florida.
This study is guided by a number of specific research questions. The first research question frames the study by considering both the shifts in punishment structure and the growth of the elderly inmate population in Florida. Specifically, do punishment policy shifts in Florida coincide with the growth in the elderly inmate population from 1980 to 2010?
This research also draws attention to the importance that the proportion of inmates with lengthy life or death sentences may play in contributing to the aging inmate population. The second research question is: Have changes in Florida’s punishment structure coincided with the percentage of elderly inmates who are serving a life or death sentence from 1980 to 2010?
Even if inmates are not serving life or death sentences, prior research suggests that a greater proportion of more serious offenders could be contributing to the growth in the elderly inmate population. As a result, the third research question examines the proportion of crime types across elderly inmate age groupings over time and asks: Has the punishment policy shift in Florida to determinate sentencing corresponded with changes in the percentage of the elderly prison population who were sentenced for more serious offenses from 1980 to 2010?
Since previous research has implicated an increase in prison admissions and a reduction in releases as a driving force in the growth in the elderly inmate population (Luallen & Kling, 2014), the next research questions involve describing aggregate trends in prison admissions and releases among elderly inmates. The fourth research question is: Has changes in Florida’s punishment policies between 1980 and 2010 coincided with increases in the percentage of admissions for older inmates during this same period?
If prison releases declined as a result of the shift to a determinate punishment structure, there is one less outlet to slow prison growth. Alternatively, more releases may have been employed to keep pace with the growth in the number of older people being admitted to prison. As a result, the fifth research question is: Have changes in Florida’s punishment policies between 1980 and 2010 coincided with increases in the percentage of releases for older inmates during this same period?
To further illustrate how release mechanisms impact the growth in the elderly inmate population in a determinate punishment policy state, the sixth research question will examine the effects of time served for individuals in these same age-groups. The specific research question that will be addressed is: Has the punishment policy shift in Florida from indeterminate to determinate coincided with changes in average time served for inmates from 1980 to 2010?
The final issue we address is whether the significant increases in the percentage of the prison population who were elderly during the determinate punishment policy is due to the length of prison time served increasing more among inmates 50 and older than younger inmates. The specific seventh research question is: Did the shift from an indeterminate to a determinate punishment policy in Florida have a significant influence on the trend of the prison population who were 50 and older increasing during the determinate period?
Method
The data used in this study were obtained from the FDC, Bureau of Research and Data Analysis (BRDA). The corrections data from the BRDA originate from the FDC’s Offender-Based Information System (OBIS). The OBIS database contains detailed data on all offenders in Florida’s correctional system in 1979, and all subsequent offenders sentenced to state prison or community supervision (probation, community control, etc.). OBIS contains the sentencing information recorded on the Sentence and Judgment Form completed by the court when an offender is convicted, comprehensive data relating to the demographic characteristics of offenders, and specific data on all inmate movements within and in and out of prison. To facilitate the tracking of individual offenders over time, the FDC utilizes a unique offender identifying number that remains constant throughout the system and over the course of each offender’s criminal career in the state of Florida. In 1996, the BRDA built a SAS data warehouse of research files that are extracted from OBIS and contain detailed information relating to all prison admissions, releases, and status populations at the end of each month back to January 1, 1980. These files can be linked using the offender identification number and are routinely used by FDC and external researchers to examine cohorts of offenders admitted, released, and in prison.
The authors contacted BRDA about conducting research relating to Florida’s elderly inmate population, and they were also interested in this topic and were able to provide the following three data sets: first, all inmates admitted to Florida’s prison between January 1, 1980, and December 31, 2010 (n = 837,869); second, all inmates released from Florida’s prison between January 1, 1980, and December 31, 2010 (n = 783,978); and third, the active prison population on June 30 of each year from 1980 to 2010 (n = 1,785,397).
A description of the major shifts in Florida’s punishment policies between 1980 and 2010 was presented previously. We define offenders sentenced from 1980 to 1992 as serving an indeterminate punishment, those sentenced from 1997 to 2010 as serving a determinate punishment, and those entering between 1993 and 1996 as being subjected to a mix of indeterminate and determinate punishment. The rationale for these three periods is that from 1980 to 1992, either parole or massive levels of gaintime and/or early release credits were afforded to offenders entering prison. In contrast, from 1997 to 2010 virtually every inmate entering prison was required to serve a minimum of 85% of the court-imposed sentence; therefore, we define this time frame as the determinate punishment period.
Offenders entering prison from 1993 to 1996 are defined as sentenced under a combination of indeterminate and determinate sentencing for a couple of reasons. First, while early prison release ended completely in December 1994, its usage had decreased significantly since 1993 and the availability of gaintime had been reduced during this period. Second, while true determinacy resulted from the minimum 85% time served law enacted in 1995, it impacted only crimes committed on or after October 1, 1995. Given the often significant lag time from the date when a crime occurs and when the offender actually enters prison, the majority of offenders entering prison in 1996 would have been under the indeterminate policy. Therefore, beginning the deterministic period for prison admissions in 1997 seemed prudent.
Analytic Strategy
The first six research questions require that we describe the trends in prison admissions, mean sentence lengths, and stock population from 1980 to 2010. We accomplish this task by calculating the relative proportion of elderly inmates to all other inmates by year. The seventh research question is answered through an examination of changes in the expected time served in prison for all inmates in the stock prison population on June 30 of each year from 1980 to 2010. 1
Results
To illustrate how changes in punishment structure coincide with changes in the overall populations, admissions, and releases among elderly inmates of age 50 and older, the data are displayed as univariate trends from 1980 to 2010. The distinct shifts in punishment structure are demarcated by lines and titles within each major period.
The data necessary to answer the first research question are displayed in Figure 1. This figure shows that the proportion of prisoners aged 50 and older increased from 4.6% in 1980 to 16.1% in 2010, which represents a 3-fold increase in three decades. Initially, the proportion slightly declines in the early 1980s, but then experiences a slight and stable increase from 3.9% in 1982 to 5.3% in 1996. The 50 and older population started a more drastic upward climb in 1997, the first year of the determinate punishment period. The implementation of the truth in sentencing law in 1995 coincides with the start of this dramatic increase in the elderly inmate prison population through 2010.
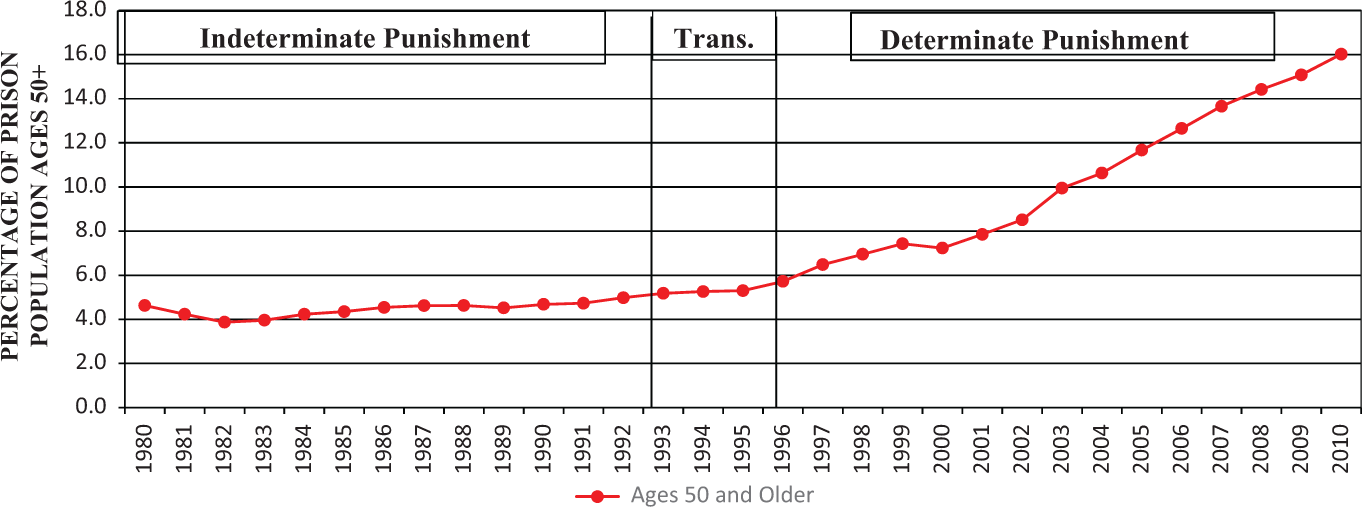
Percentage of Florida’s prison population of age 50 and older: 1980–2010.
Figure 2 displays the data that addresses the second research question pertaining to the relationship between changes in the punishment structure in Florida from 1980 to 2010 and the percentage of elderly inmates serving a life or death sentence. Prior to 1983, prisoners could receive lengthy prison terms but be paroled after serving only a proportion of the sentence. In addition, prisoners who received a murder conviction could be eligible for parole after serving only 25 years of their prison term, a loophole that was closed in 1995. The figure shows partial support for the idea that the elimination of parole and the use of gain time and guidelines may have coincided with the increase in the proportion of elderly prisoners with a life or death sentence. The proportion of these elderly inmates increased from 21.8% in 1980 to 30.9% in 1999. However, the assertion that the proportion of elderly persons serving a life or death sentence has increased over time due to the truth in sentencing law is not supported by these data. In fact, the trend in elderly life and death sentence inmates began a decline from 30.9% in 1999 to 26.1% in 2010.
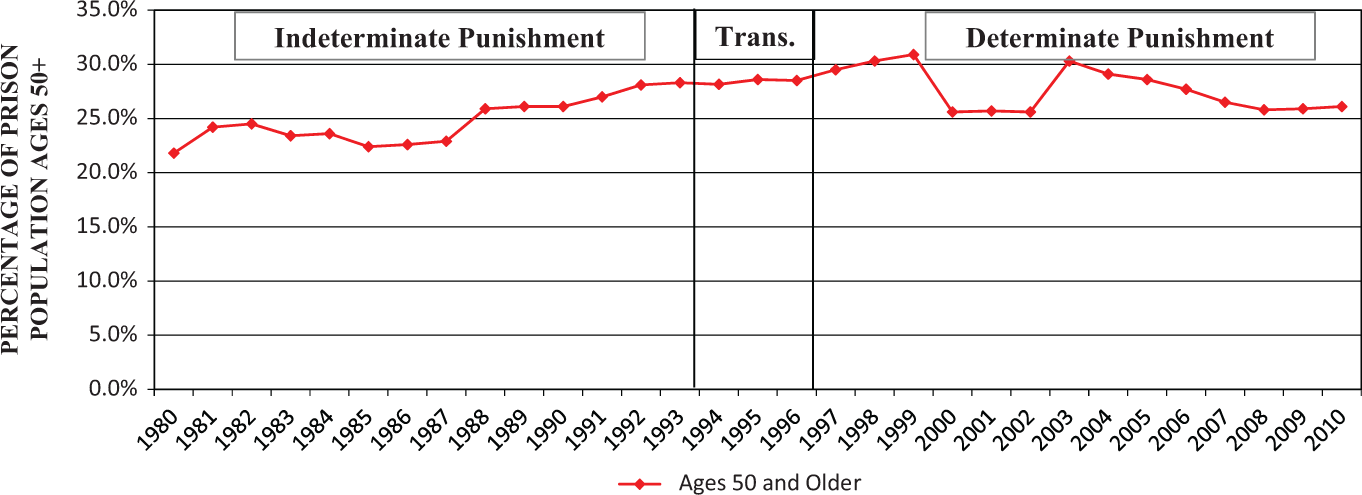
Percentage of Florida’s prison population of age 50 and older serving a life or death sentence: 1980–2010.
Figure 3 addresses the third research question: Whether the percentage of older inmates serving a prison sentence for a violent or sex crime (as opposed to a property, drug, or other offense) changes as the punishment structure becomes more determinate over time. If the percentage of elderly inmates serving a prison term for a serious crime increases, the change in the overall elderly inmate population should also increase. The results indicate that the trend declines during the parole era from 1980 to 1983, but then only slightly increases from 1980 to 1992, fluctuates until 1998, and then begins to slightly decline to 59.4% in 2010. While the percentage of more serious older offenders declines during the 85% law period, there are consistently more violent and sex offense convictions among elderly offenders over the entire 31-year-period.
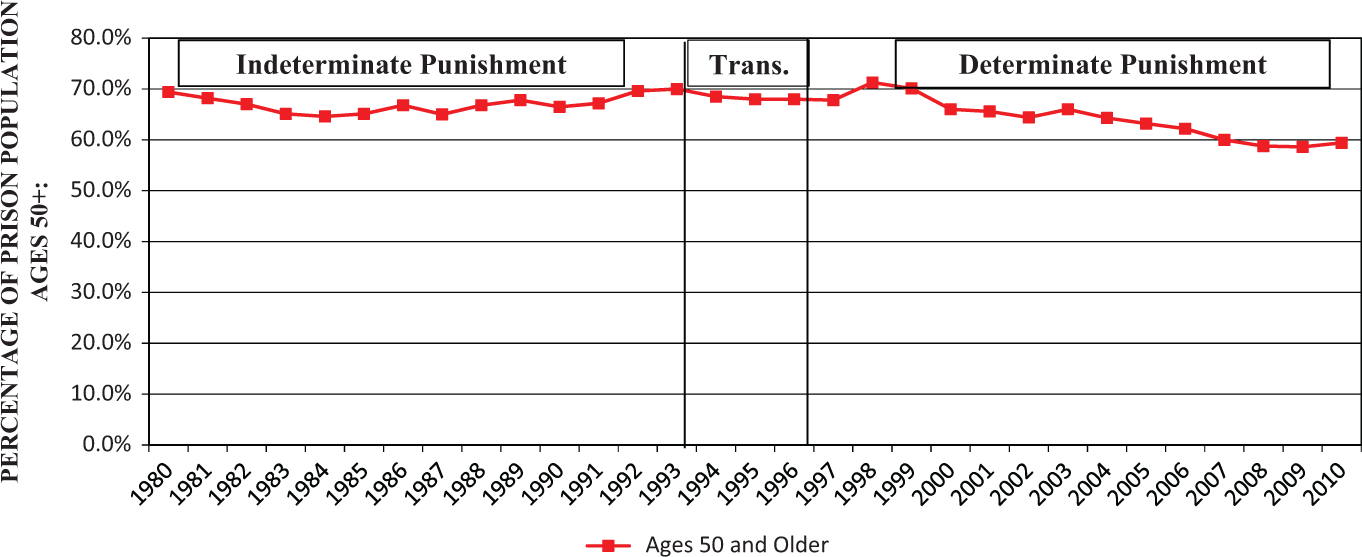
Percentage of Florida’s prison population of age 50 and older serving a sentence for a violent or sex crime: 1980–2010.
Figure 4 displays the data necessary to address the fourth research question, concerning the percentage of prison admissions that are of age 50 and older from 1980 to 2010. We see in this figure that the trend in inmates of age 50 and older begins an upward climb from 2.2% in 1989 to 9.4% in 2010. This finding might indicate that a greater percentage of elderly prisoners are being reimprisoned for violating their conditions of supervision. However, there is no direct link between shifts to a more determinate punishment structure and admissions, especially since the 85% law is more likely to affect the time served in prison rather than admissions. Either the punishment structure had an indirect effect on the increase in elderly admissions or other policies (not discussed here) affected the increase in elderly admissions.
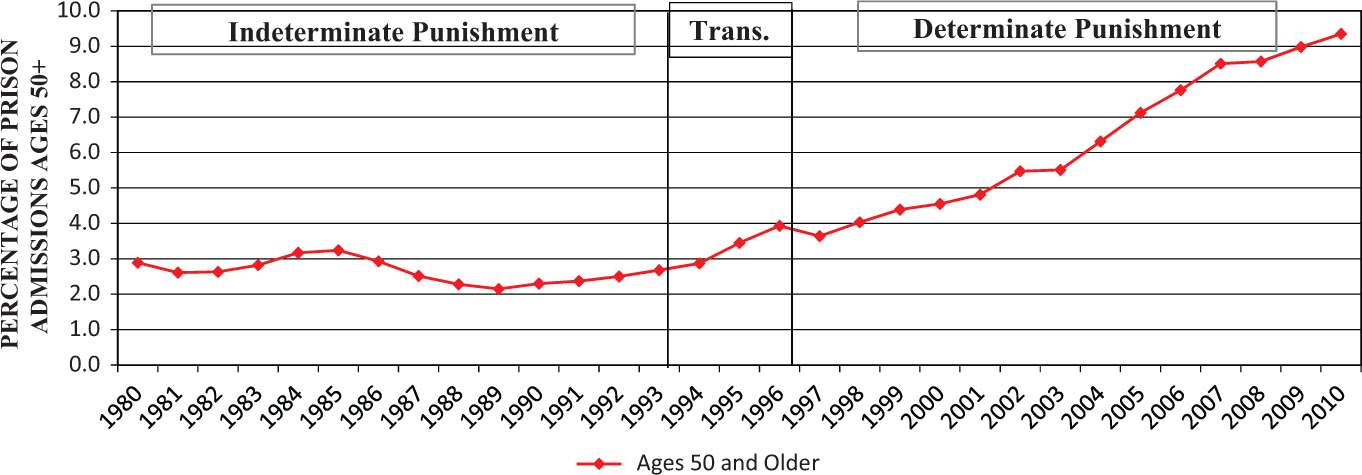
Percentage of Florida’s prison admissions of age 50 and older: 1980–2010.
Figure 5 displays the data to address the fifth research question about the annual change in the percentage of elderly prison releases from 1980 to 2010. The expectation is that an increase in admissions combined with a decline in releases would lead to the unprecedented increase in the elderly inmate population. However, the data in this figure indicate that releases began an upward trend in 1989 at 2.5% and ended in 2010 at 13.9%.
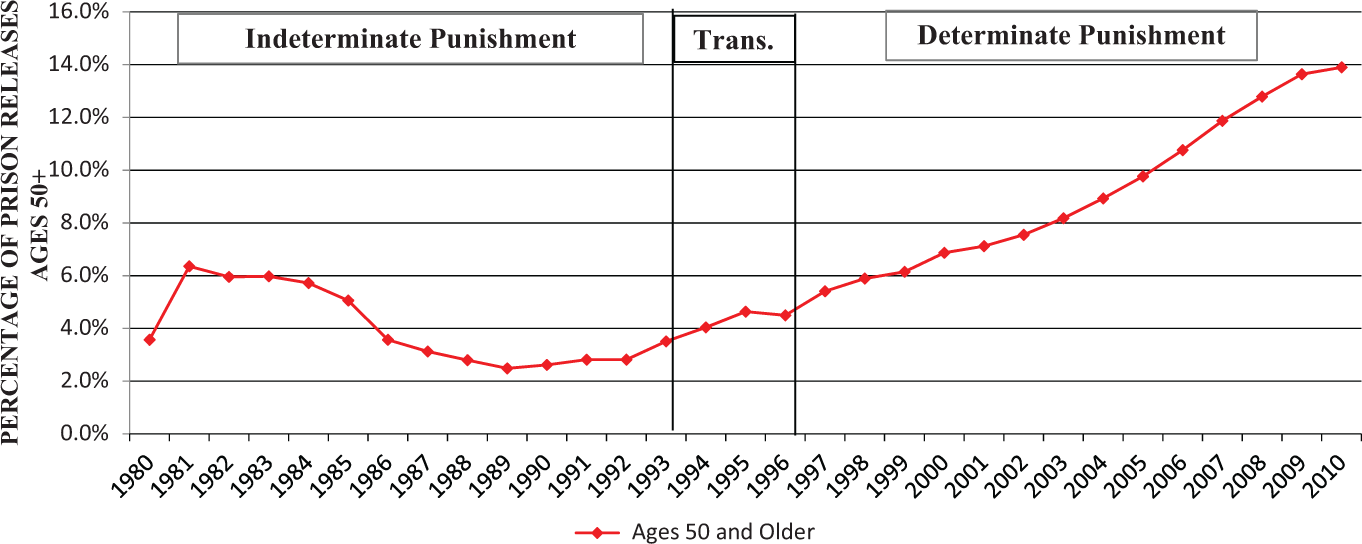
Percentage of Florida’s prison releases of age 50 and older: 1980–2010.
Figure 6 addresses the sixth research question by displaying the trends in average months served among prison releases for each year during the three decades. With the exception of the first 5 years of the 31-year-period, the average time served in prison was always higher for inmates released when they were 50 years of age or older than those under the age of 50. Also, the gap between younger and older inmates released during the last year of the indeterminate period in 1993 increased considerably and remained quite wide on a consistent basis through 2010. In terms of the magnitude of the difference in prison time served across the two age-groups since 1993, Figure 6 shows a relatively consistent 20-month gap between the two age-groups, with the 50 and older released inmates serving on average about 20 months more than their younger counterparts. Given that this time served difference in older versus younger inmates did not begin until after the indeterminate punishment period, we suggest that enhanced time served among those released from prison caused by Florida’s determinate punishment policy has impacted the growth in the elderly inmate population.
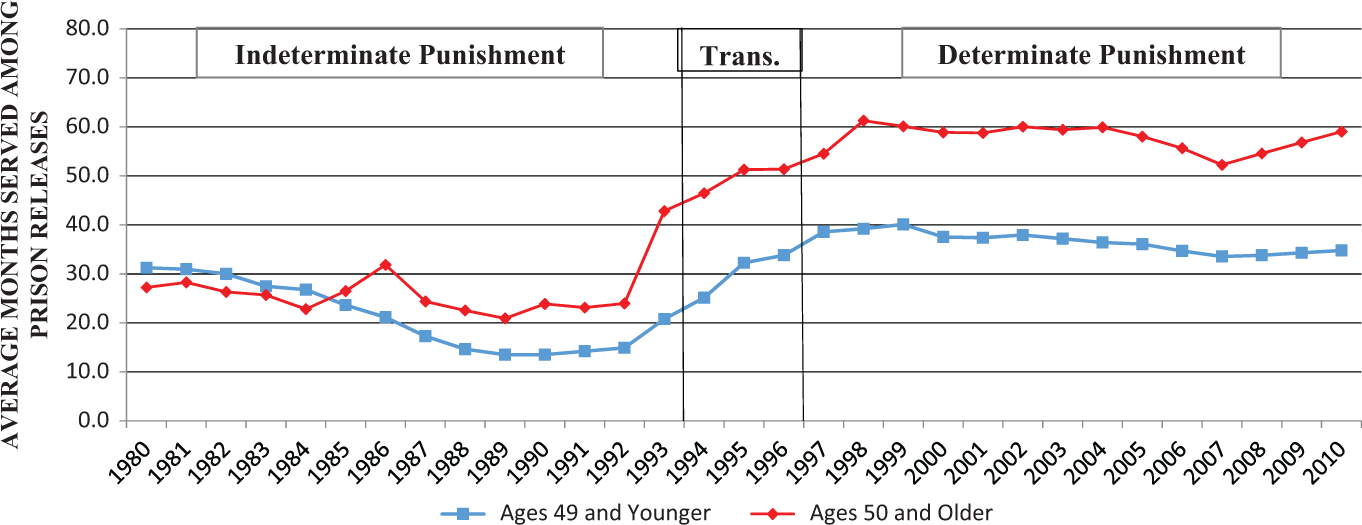
Average months served in Florida prisons among inmates of age 49 and younger and 50 and older: 1980–2010.
Figures 7 and 8 display data that inform the seventh and final research question, which asks whether the determinate punishment policies beginning in 1997 resulted in the length of time served among the prison population who were 50 and older increasing at a faster rate than among inmates younger than 50. If this question is answered in the affirmative, it would clearly indicate that a major reason why the elderly inmate population increased at a significantly greater rate than younger inmates during the determinate punishment policy period is because this policy resulted in older inmates serving longer prison terms than younger inmates.
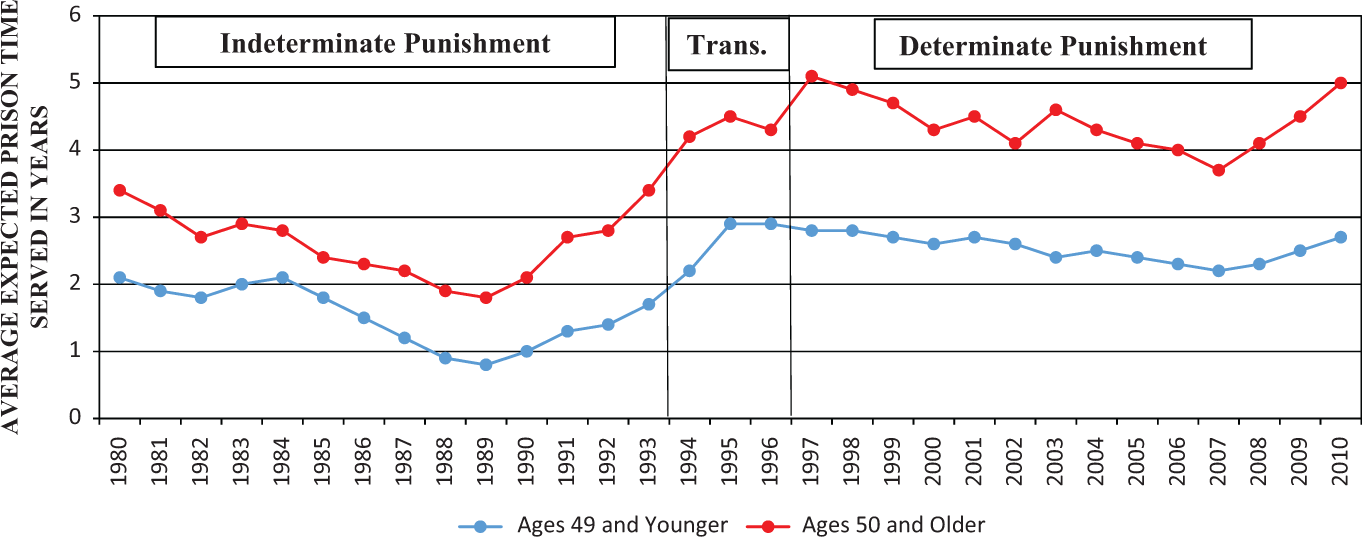
Changes in Florida’s average expected prison time served in years among inmates of age 49 and younger and 50 or older: 1980–2010.
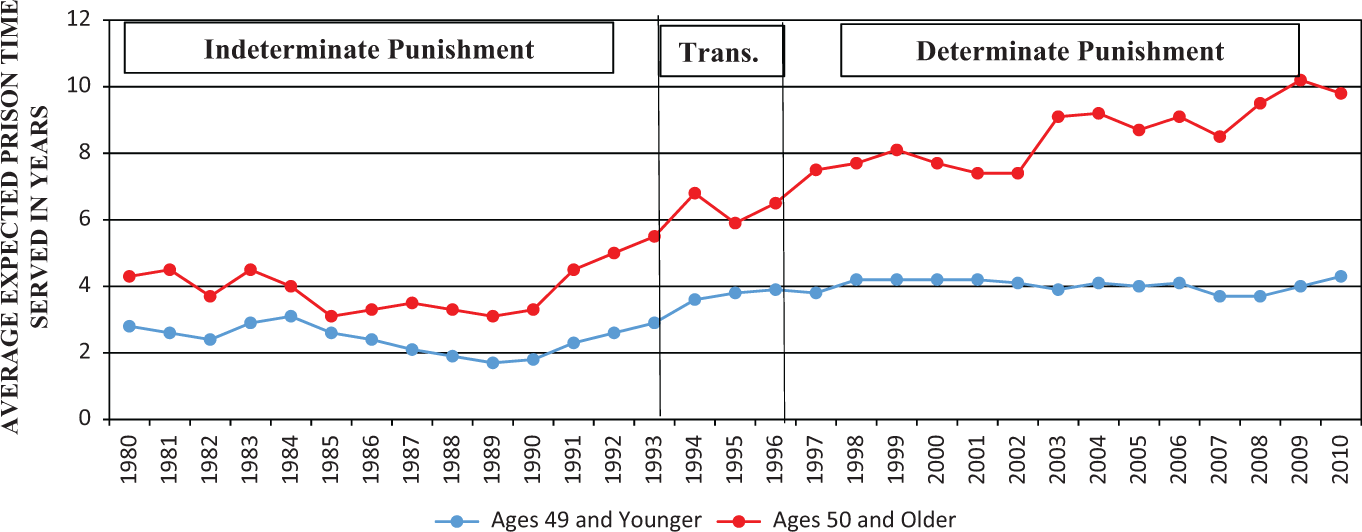
Changes in Florida’s average expected prison time served in years among violent and sex offenders of age 49 and younger and 50 or older: 1980–2010.
When analyzing inmates regardless of the type of crime resulting in their incarceration, Figure 7 indicates that the average expected number of years inmates aged 50 and older served during the indeterminate period declined from 3.4 years in 1980 to 1.8 years in 1989, and then began a relatively steady increase that would carry into the transitional and determinate periods to a length of 5.1 years in 1997. The average time served among inmates of age 49 and younger imprisoned during the indeterminate period initially remained relatively stable at 2.1 years from 1980 to 1984 and then declined to 0.8 years in 1989. This trend began an increase that would take it into the transitional period and hit a peak of 2.9 years in 1995. After remaining stable for the remaining year in the transitional period, the average time served for younger inmates began a slight decline from 2.9 years in 1996 to 2.2 years in 2007. After 2007, the average time served among inmates of age 50 and older and 49 and younger began to increase, with the climb more dramatic for the older group. Two important features of this figure are worth noting: (1) the average time served among elderly inmates compared to inmates of age 49 and younger is consistently higher over the 31 years and (2) the gap between their trends slightly diverges in the latter part of the indeterminate period and continues this pattern in the transitional and determinate periods.
When analyzing inmates regardless of the type of crime resulting in their incarceration, Table 1 reveals that time served in prison among inmates of age 50 and older during the indeterminate period, based on the ratio of the prison population to prison admissions from court in this age-group, averaged 2.6 years and ranged from 1.8 years to 3.4 years. Among inmates under the age of 50, we find a range of 0.8 years in 1989 to 2.1 years in 1980 and 1984 and an average of 1.5 years during the indeterminate period, which is significantly lower than among the 50 and older group. During the period of transition from indeterminate to determinate punishment from 1993 to 1996, both younger and older inmates experienced longer lengths of stay at the end of the period than at the beginning. Most importantly, the data during the determinate punishment period demonstrate that the percentage change in the average time served increased by 75% relative to the indeterminate period among inmates aged 50 and older compared to 66% among inmates under the age of 50.
Changes in the Estimated Average Number of Years Inmates of Age 49 and Younger and 50 and Older Will Serve in Florida’s Prisons: 1980–2010.
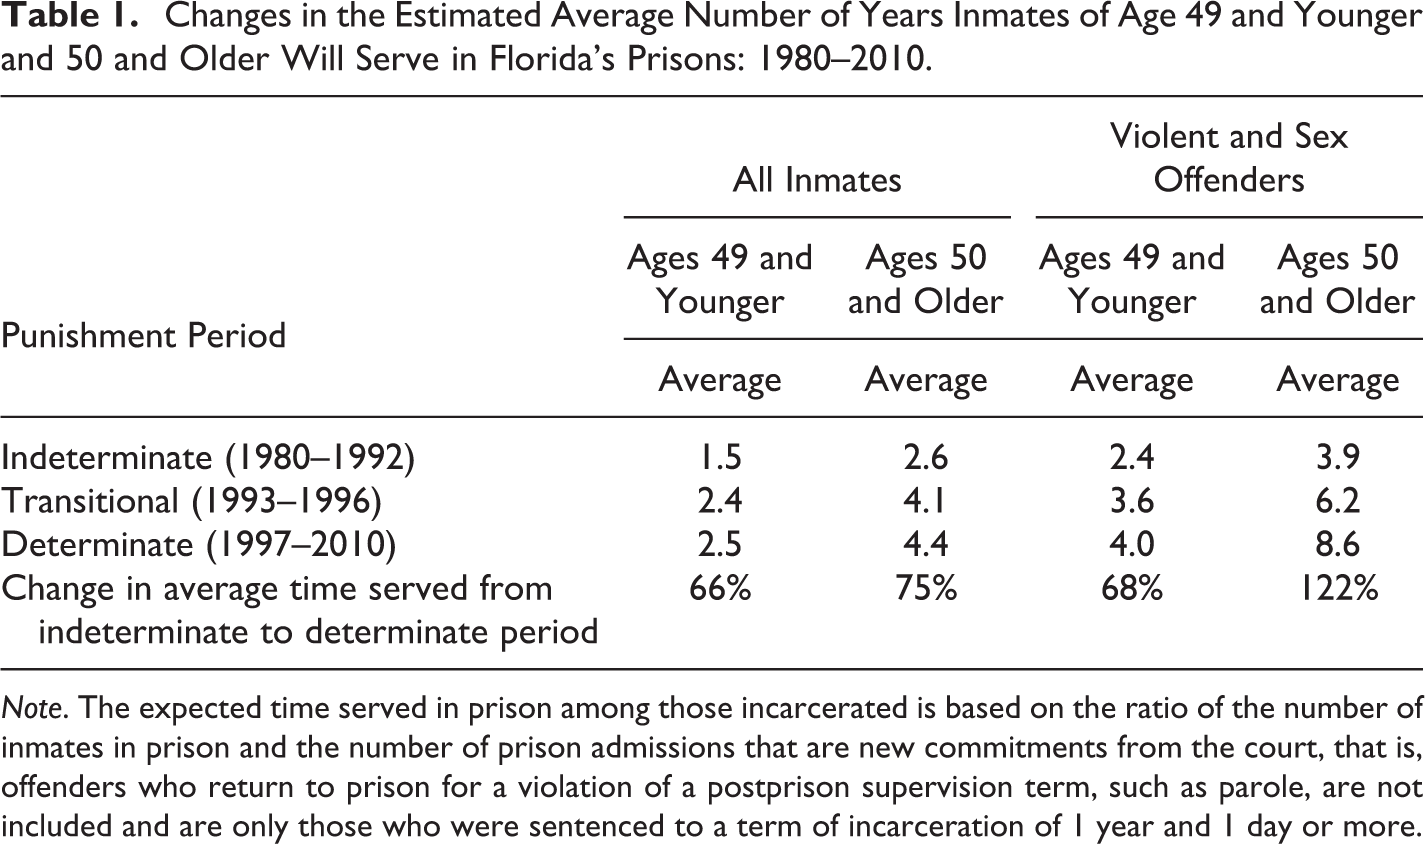
Note. The expected time served in prison among those incarcerated is based on the ratio of the number of inmates in prison and the number of prison admissions that are new commitments from the court, that is, offenders who return to prison for a violation of a postprison supervision term, such as parole, are not included and are only those who were sentenced to a term of incarceration of 1 year and 1 day or more.
Figure 8 focuses on those inmates in prison for the most serious types of crimes, including murder, sexual battery, robbery, aggravated battery, and other violent offenses. The average time served in prison among inmates of age 50 and older in the indeterminate period fluctuated from 4.3 years in 1980 to 5.0 years in 1992, while the trend among younger inmates fluctuated yet ultimately declined from 2.8 years to 2.6 years during that same period. The average time served for both age-groups increased during the transitional period to 6.5 years among inmates of age 50 and older and 3.9 years among the younger inmate age-group. During the determinate period, the average time served among inmates of age 50 and older fluctuated but continued to increase to 9.8 years in 2010, while the trend for younger inmates remained relatively stable, reaching 4.3 years in 2010.
Similar to Figure 7, Figure 8 indicates that the average time served among elderly inmates compared to inmates of age 49 and younger is consistently higher over the 31 years. However, one difference in Figure 8 from Figure 7 is that the gap between their trends began to diverge earlier, in 1985. This divergence continues to increase in the latter part of the indeterminate period and through both the transitional and the determinate periods. In addition, the divergence of the average time served in prison trends between the two age-groups is greater than that difference observed in Figure 7.
Table 1 also provides the averages of trends described in Figure 8 for violent and sex offenders. The time served in prison among inmates aged 50 and older incarcerated for these serious crimes during the indeterminate period, averaged 3.9 years and ranged from 3.1 years to 4.5 years. Among inmates under the age of 50, we find a range of 1.7 years in 1989 to 3.1 years in 1984 and an average of 2.4 years over the period, which is significantly lower than among the 50 and older group. During the period of transition from indeterminate to determinate punishment from 1993 to 1996, both younger and older inmates in prison for the most serious crimes experienced longer lengths of stay at the end of the period than at the beginning. Comparing the overall change in time served from the indeterminate to the determinate punishment period, there was 75% increase from the former to the current period among older inmates and 66% among those inmates aged 49 or younger. Most importantly, the data during the determinate punishment period demonstrate that the percentage change in the average time served increased by 122% relative to the indeterminate period among inmates aged 50 and older incarcerated for violent and sex crimes compared to only 68% among inmates under the age of 50.
These findings provide a compelling answer to our last research question, which asks whether a shift from indeterminate to determinate punishment policies in Florida explains some portion of the reason for why the growth in the elderly inmate population has outpaced that of inmates who are under the age of 50. Overall, the increases in time served in prison from the indeterminate to determinate punishment periods were greater for older than younger inmates. Additionally, among the most serious offenders sentenced to prison (i.e., those convicted of violent and sexual offenses, who generally receive longer sentences and have longer lengths of stay in prison), we find that the length of time served among the prison population who were 50 and older increased at a significantly faster rate than among inmates younger than 50. In other words, the results indicate that at least one of the major drivers behind the unprecedented growth in the elderly inmate population in Florida is the change in the punishment approach from indeterminate to “get tough” determinate punishment practices. 2
Summary and Conclusion
The objective of this article was to determine whether shifts in Florida’s punishment structure coincided with the growth in the elderly inmate population over a three-decade period that was characterized by several changes in policy to make imprisonment more determinate. The trend analyses presented support correspondence between major changes in Florida’s punishment policy and the size of its elderly inmate population.
There are several key findings from the current study: The growth of elderly inmates accelerated after the implementation of the deterministic minimum 85% of sentence served law enacted in 1995. The percentage of elderly inmates with life or death sentences did not substantively increase at any point during the entire 31 years and actually decreased in the latter part of the 85% law period captured by these data. The percentage of elderly inmates serving a prison term for a serious offense, while remaining above 58%, actually declined during the 85% law period. Prison admissions for elderly inmates began to increase in the late-1980s and continued a steady incline through the deterministic period. Theoretically, the 85% law should not directly impact changes in the number of admissions to prison. Based on the trend, we believe that other punishment policies in the 1990s must have affected the growth in admissions of elderly offenders. The percentage of elderly prison releases began to increase in 1989, around the same time that admissions for this population began an upward trend. This finding suggests that increasing the percentage of elderly inmate releases may have been an effort to offset the increase in prison admissions. The average time served for younger and elderly inmates increased dramatically in 1992. This finding indicates that other punishment policies and/or practices enacted prior to the 85% law had an effect on the average time served among all inmates regardless of age. While the baseline for average time served among elderly inmates is typically longer than that of younger inmates, the trends for average time served for elderly and younger inmates remained relatively stable during the 85% law period. Finally, the results indicate that one of the primary drivers of the growth in the elderly prison population relative to those under the age of 50 was the increase in time served in prison resulting from determinate punishment impacting older inmate significantly more than their younger counterparts, especially among the more serious violent and sexual offenders.
There are some limitations of the current research that should be mentioned. First, the analyses are only descriptive and bivariate, which does not allow for making causal statements about the phenomena studied. At best, this research describes the correspondence of two factors: years in which determinate punishment policies were enacted and the percentage of the elderly inmate population. With this being said, these analyses are a starting point for more sophisticated analyses that assess effects of punishment policies on the growth in the elderly inmate population. Although these analyses are only bivariate, they do illustrate that other factors aside from implementation of the 85% law affected the growth in elderly inmates. In addition, this study does not have the benefit of a control series displaying, for example, similar trends in the percentage of elderly inmates from another state. If other states show similar changes in the growth in the older inmate population, then the changes reported here may not be due to determinate punishment policies. We focus on showing the major shifts in the determinate punishment structure (i.e., the 85% law), but other policies enacted in Florida could also be affecting this growth. Further, nationwide initiatives and policies implemented under the “war on drugs” in the late 1980s may have also had an impact on the increases in the percentage of older inmates.
Policy Implications
The aging inmate phenomenon has led many states to consider various policy changes. These proposed solutions include reducing the number of older people sent to prison and jail, using age as a mitigating factor during the sentencing process, and implementing early release for older inmates. According to Chiu (2010), at least 15 states have already implemented geriatric-related prison release policies. Considerations of age, medical conditions, and/or their risk to public safety are made before elderly inmates are released. However, there are challenges to implementing these early release policies. For example, practitioners and policy makers may be reluctant to implement them due to the possibility of an elderly former prisoner committing a serious violent or sexual crime in the community, which would more than likely create negative publicity for the state and lead to a return to the “old policy” and ultimately more punitive solutions.
Conclusion
In the coming years, as correctional budgets continue to swell due to the housing and care of a rapidly growing older adult inmate population, policy makers will no doubt demand empirical research to better understand and address the aging inmate crisis. Their search for solutions may mean documenting the annual growth and expenditures of this population at the state and federal levels. In addition, they may be forced to consider alternatives to incarceration for this expensive population. Despite the good intentions of selective decarceration for older adult inmates for reducing correctional costs, much is unknown about how older adults will fare upon release. Like younger ex-prisoners, older adult prisoners face obstacles in securing housing, obtaining employment, and accessing health care in the community, but unlike their younger counterparts, they face unique challenges that warrant special attention and forethought. As evident in official documentation of the growth in the proportion and number of older adult inmates within prisons, the problem of the “aging prison population” does not appear to be dissipating on its own. Without intervention, the number and proportion of elderly inmates behind prison gates will continue to grow and the correctional costs associated with these inmates will only become greater with time. To the extent that this growth is a significant concern for policy makers, the management of older adult offenders in prison and the community will require more thought concerning possible and feasible release mechanisms that balance concerns regarding inmates’ success and well-being with those of public safety.
Footnotes
Declaration of Conflicting Interests
The author(s) declared no potential conflicts of interest with respect to the research, authorship, and/or publication of this article.
Funding
The author(s) received no financial support for the research, authorship, and/or publication of this article.