
Abstract
This study determined whether using photographic stimuli displaying different ethnicity (African American vs. Caucasian American) influenced preference, word count, and number of content units produced by African American or Caucasian American participants. Six photograph pairs depicting common scenes were developed, differing only by model ethnicity. Participants sorted photographs by preference and described each photograph from which word count and content unit were determined. Each group showed significant preference for photographs of their own ethnicity. Caucasian Americans produced significantly more words than African Americans. Caucasian Americans also produced significantly more content units. Caucasian Americans produced more content units for African American scenes (nonsignificant). Results suggest that ethnic groups prefer photographic stimuli representing their own ethnicity. Other factors may influence the amount and content of speech produced. If African Americans typically produce less speech with less content than Caucasian American counterparts, separate normative data may be needed for each ethnic group.
The U.S. population continues to diversify with the number of African Americans now comprising 13.6% of the national population (U.S. Census Bureau, 2010). As the census is often not completed by minorities, there is a strong likelihood that the actual percentage is higher. According to the census, minorities above 65 years of age currently comprise 20% of the above 65 years of age population, with that percentage expected to rise to 42% by 2050. The percentage of African Americans above 65 years currently is at 9% and is expected to rise to 12% by 2050.
The prevalence of untreated disease remains high among minorities. The number of untreated cases of hypertension is especially high for African American males (Connell, Wolfe, & McKevitt, 2008). This group also tends to develop hypertension at younger ages compared with other groups. As hypertension is linked to stroke, the number of African American individuals at risk for neurological insult is persistently high (Howard et al., 2011). Neurological insults frequently result in language deficits such as aphasia. As such, the need for appropriate language assessment and intervention materials for this population is apparent.
Ethnic or cultural differences between Caucasian American and African American adults are frequently noted on psychological test scores. As summarized by Boone, Victor, Wen, Razani, and Ponton (2007), the scores for African Americans are consistently lower than Caucasian Americans on many neuropsychological tests such as the Repeatable Battery for the Assessment of Neuropsychological Status (Randolph, 1998), California Verbal Learning Test (Delis, Kramer, Kaplan, & Ober, 2000), Boston Naming Test (Goodglass & Kaplan, 2001), verbal fluency, and the Paced Auditory Serial Addition Task (Gronwall, 1977). Lower scores for older African Americans on tests such as the Benton Visual Retention Test (Benton Sivan, 1991) have also been found, but differences may be accounted for by such factors as level of education and reading ability. With the report of such a large number of psychological tests revealing lower performance by African American adults, it could be expected that there would be similar systematic differences in scores between African American and Caucasian American adults when evaluated with language assessment batteries whether these adults are normal or diagnosed with aphasia.
Traditionally, clinical evaluation studies of persons with aphasia have focused primarily on Caucasian Americans with aphasia and few-to-no African Americans (Molrine & Pierce, 2002), or the sample used has been underspecified (Ellis, 2009). Molrine and Pierce (2002) compared test scores for typical African American and Caucasian American adults from middle and upper socioeconomic status levels when given the expressive language portions of the Boston Diagnostic Aphasia Examination (BDAE; Goodglass, Kaplan, & Barresi, 2001), the Minnesota Test of Differential Diagnosis of Aphasia (Schuell, 1965), and the Western Aphasia Battery (Kertez, 1982). Results indicated that tasks requiring a response in the form of discourse (i.e., word fluency and paragraph retelling) showed group differences. Although still being within normal limits, African American participants named fewer animals than the Caucasian American group. With regard to the retelling task, the African American participants obtained lower scores. Qualitative analysis of results suggested that the Caucasian American group produced narratives as expected on the test; they produced “topic-centered” styles of communication that are focal and analytical to the story. Some African American participants produced narratives with “topic-associating” styles, which are progressive rather than focal in nature with progressive, linked topics being presented. The use of topic-associating styles resulted in reduced scores, representing a cultural bias in scoring. It should be noted that these findings of strict cultural divides have not been supported by the work of Hyon and Sulzby (1992) and Crabtree (2003).
Specific to the current study, Shade (1997a) stated that there are differences in modality use that distinguishes African Americans from Caucasian Americans. When testing for IQ, it has been found that African American and Caucasian American children perform similarly on verbal subtests, but on visual-spatial performance tasks, African Americans provide scores that are consistently lower than their Caucasian American counterparts. Similar results were found for the Wechsler Intelligence Scale for Children–Revised (Wechsler, 1991) in that African American children did well in processing and synthesizing verbal material but poorly on visually based testing requiring analysis and organization. Shade (1997b) suggested generalization of these findings to adults in that, overall, African Americans appear to process visual information differently from Caucasian American groups. Shade (1997b) stated that when African Americans are presented with a task of determining components of photographs, they may be less analytical or limited in the amount of information they perceive (or state). As such they might be considered “field-dependent” processors.
Picture description tasks are often used for eliciting discourse as part of an aphasia assessment. Findings stated previously suggest that when using current scoring procedures, African Americans would inherently provide narratives of lesser quantity and quality of discourse than their Caucasian American counterparts. However, other factors may come into play that could influence the discourse elicited. According to Olness, Ulatowska, Wertz, Thompson, and Auther (2002), picture description often depends on the familiarity and context of the pictures presented. The majority of drawn stimulus items currently being used during assessment present images of individuals from middle-class Caucasian American families. The “cookie theft” picture from the BDAE represents the prototypical stimulus drawing. It features a typical middle-class, Caucasian scene from the 1950s. Recent revisions in testing materials have maintained the use of such items. The continued use of only Caucasian Americans in pictorial stimuli may represent a cultural bias that could adversely affect the diagnosis of aphasia in persons from non-Caucasian backgrounds. A lack of appropriate testing materials may make it difficult to differentiate between communication differences associated with aphasia and differences associated with ethnicity.
A review of the American Speech-Language-Hearing Association website finds an absence of diverse testing materials for adults with acquired brain injuries. According to Wyatt (2002), there is a need to eliminate format bias in testing where certain pictures and test prompts are unfamiliar to patients from diverse backgrounds. Clinicians should use pictures and test prompts that are meaningful and appropriate for diverse patients. Following this lead, Ramkissoon, Dagenais, and Ennis (2009) conducted a pilot study involving paired drawings of scenes with either African American or Caucasian American persons. Unimpaired participants, who were either African American or Caucasian American, completed a preferential sorting task of the drawings and a discourse task when asked to describe the drawings. The African American group showed a slight preference for African American drawings, whereas discourse was similar for both groups. Anecdotal participant reports suggested that the drawings did not present distinct differences between the two ethnic groups, possibly explaining the lack of difference in group responses.
The purpose of the present study was to explore possible differences in the narrative discourse production of typical African American and Caucasian American adults, aged 45 to 65 years, when presented with photographs, as opposed to drawings. The study examined differences in preference and differences in discourse (word count and content units) across two groups of participants (African American and Caucasian American) who viewed photographic scenes that were identical except for the ethnicity of persons in the scenes (African American or Caucasian American). If differences are found, the development of ethnically sensitive test materials (in this case photographic stimuli), when evaluating persons of either ethnicity who have experienced brain damage and subsequent aphasia, could be justified.
Method
Participants
This study was approved by the Institutional Review Board of the University of South Alabama, and informed consent was obtained willingly from all participants. To create photographic stimulus items, six African American and five Caucasian American adults were recruited to be models. These individuals were paired for photographs based on gender, age, and race.
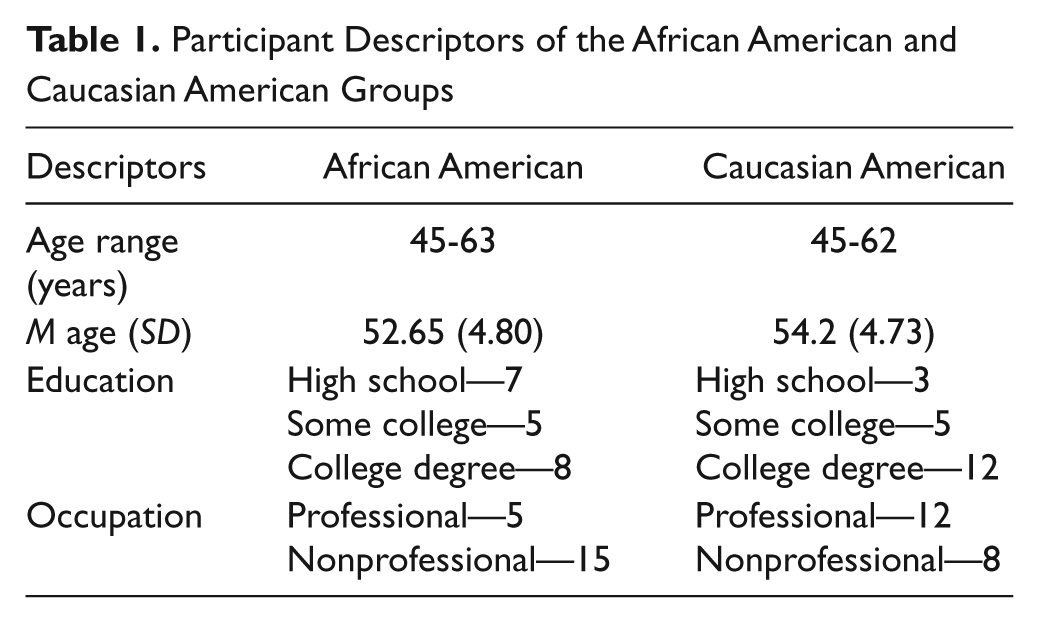
For the preference and discourse tasks, 40 adults who self-identified as speakers of American English were recruited. They were all in the age range from 45 to 65 years and could be considered baby boomers, a large portion of the population approaching increased incidence of stroke and subsequent aphasia. They consisted of 10 African American males, 10 African American females, 10 Caucasian American males, and 10 Caucasian American females and were considered a convenient sample from the Mobile, Alabama, area. Each participant completed consent and history forms. They had no history of speech, language, or hearing problems, and the four subgroups were broadly matched for educational background and occupation. Participants passed a near vision screening test (Sloan Letter Near Pocket Card, Good-Lite Co.) at the 20/50 level wearing corrective lens if needed. Participants also passed a pure tone, air conduction hearing screening test (0.5, 1.0, 2.0, and 4.0 kHz) at 25 dB HL in at least one ear. Participant characteristics are found in Table 1.
Participant Descriptors of the African American and Caucasian American Groups
Stimulus Preparation
Development of photographic stimuli was based on concepts of high-frequency words, familiarity of scenes, and contextual relevance as determined by a group of four speech-language pathologists (SLPs; two graduate students and two faculty members). This resulted in six common scenes designed to stimulate the production of common high-frequency words by participants. Stimuli consisted of six pairs of color photographs of domestic scenes: picnic, office, stadium, automobile, kitchen, and a card game. Each pair was identical except that one photograph had Caucasian American models, whereas the other had African American models. Two foils were added to each scene in an attempt to stimulate conversation. For example, the kitchen scene had an open flame on one burner and the faucet was running, and the car scene showed a convertible with the hood up and the convertible top appeared apparently stuck halfway up. The 12 stimulus photographs were divided into two nonrepeating sets. Each set contained three scenes with African American models and three with Caucasian American models. This resulted in two counterbalanced stimulus sets.
Procedures
Determination of content units
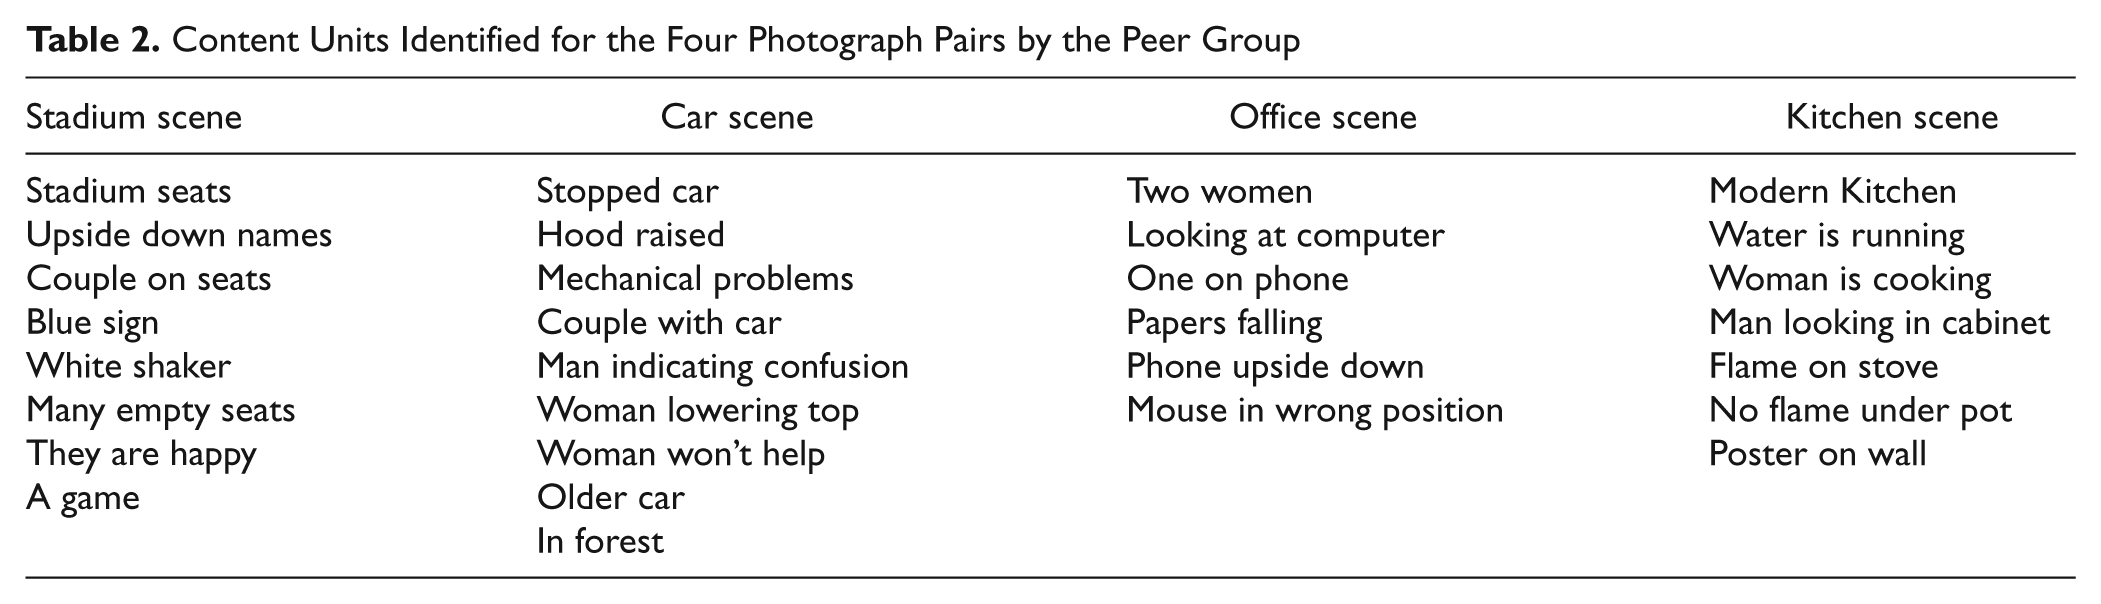
Content unit analysis was performed on the six photograph pairs but only four pairs were used. The selection of the four photographic pairs was based on the preference results. It was decided to maximize possible differences in discourse by analyzing the photographs that appeared ranked for preference as first, third, fourth, and sixth photographic pair. A peer group of six participants was recruited to determine content units for the four sets of photographs. The peer group consisted of two male Caucasian Americans, one male African American, two female African American, and one female Caucasian American. They ranged in age from 43 to 60 years, reported no speech, language, or hearing deficits and had attended some college minimally. Each participant was presented sequentially with one photograph from each scene. The photographs were presented randomly without repetition such that half the group viewed a scene with African American models, whereas the other half viewed the scene with Caucasian American models. Following procedures outlined by Yorkston and Beukelman (1980), participants viewed each photograph then responded to the written request “Identify the important features in this picture” by writing responses. Each identified feature was cataloged as a content unit in similar method to that used by Yorkston and Beukelman. Content units, as described by Yorkston and Beukelman, consist of commonly conveyed information, which is always expressed as a whole; examples of content units present in the cookie theft picture of the BDAE consists of “from the jar,” “cookies,” and “falling over.” Content units are presented in Table 2.
Content Units Identified for the Four Photograph Pairs by the Peer Group
Preference and discourse tasks
Participants were tested individually in a quiet area. They were randomly assigned to a stimulus set such that half of each group was presented with one set. Participants completed two tasks, a preference task and a discourse task. For the preference task, a set of photographs was placed in random order in a 2 × 3 array in front of the participant. The participant stacked the cards in order of preference with the most preferred photograph on top. The order of stacking was recorded with the top photograph being assigned “6” through the bottom photograph being assigned “1.”
For the discourse task, the same set of photographs was randomized and presented sequentially to the participant. Participants were requested to “describe what is happening in the photograph.” Responses were recorded using a microphone attached to a notebook computer using Andrea Audio Commander (V 4.0) software. Participants were recorded until they indicated that they finished their description. No participant exceeded 1 min of recording time.
The discourse recordings were orthographically transcribed by a graduate, SLP student, and 10% of recordings were transcribed again by a second SLP student for verification. The initial analyses consisted of tallying the number of words produced in each sample with contractions counted as separate words. Each sample was then examined for the number of content units by enumerating each response for appearance of the content units as previously determined.
Reliability
Interrater and intrarater reliabilities were computed for the discourse analysis task by reanalyzing the results of four participants (20% of the group). Percentage of agreement scores were 100% for intrarater reliability and 96.9% for interrater reliability.
Results
Preference Task Results
Average preference scores across the six African American scenes and six Caucasian American scenes for the two groups of participants are found in Figure 1. Responses appeared to be unique for each participant group. The African American group appeared to prefer all the African American scenes over the Caucasian American scenes. In contrast, the Caucasian American group appeared to prefer all Caucasian American scenes except for the car scene. Results were analyzed using a three-way (Group × Ethnicity of Models × Scene), mixed ANOVA with repeated measures for ethnicity of models and scene. Results indicated a significant difference for group, F(1, 18) = 7.5, p < .05, partial η2 = .296, and a significant difference for scene, F(5, 90) = 12.8, p < .05, partial η2 = .416, but ethnicity of models was not significant, F(1, 18) = .06, p > .05, partial η2 = .003. There was a significant Group × Ethnicity interaction, F(1, 18) = 12.4, p < .05, partial η2 = .408.
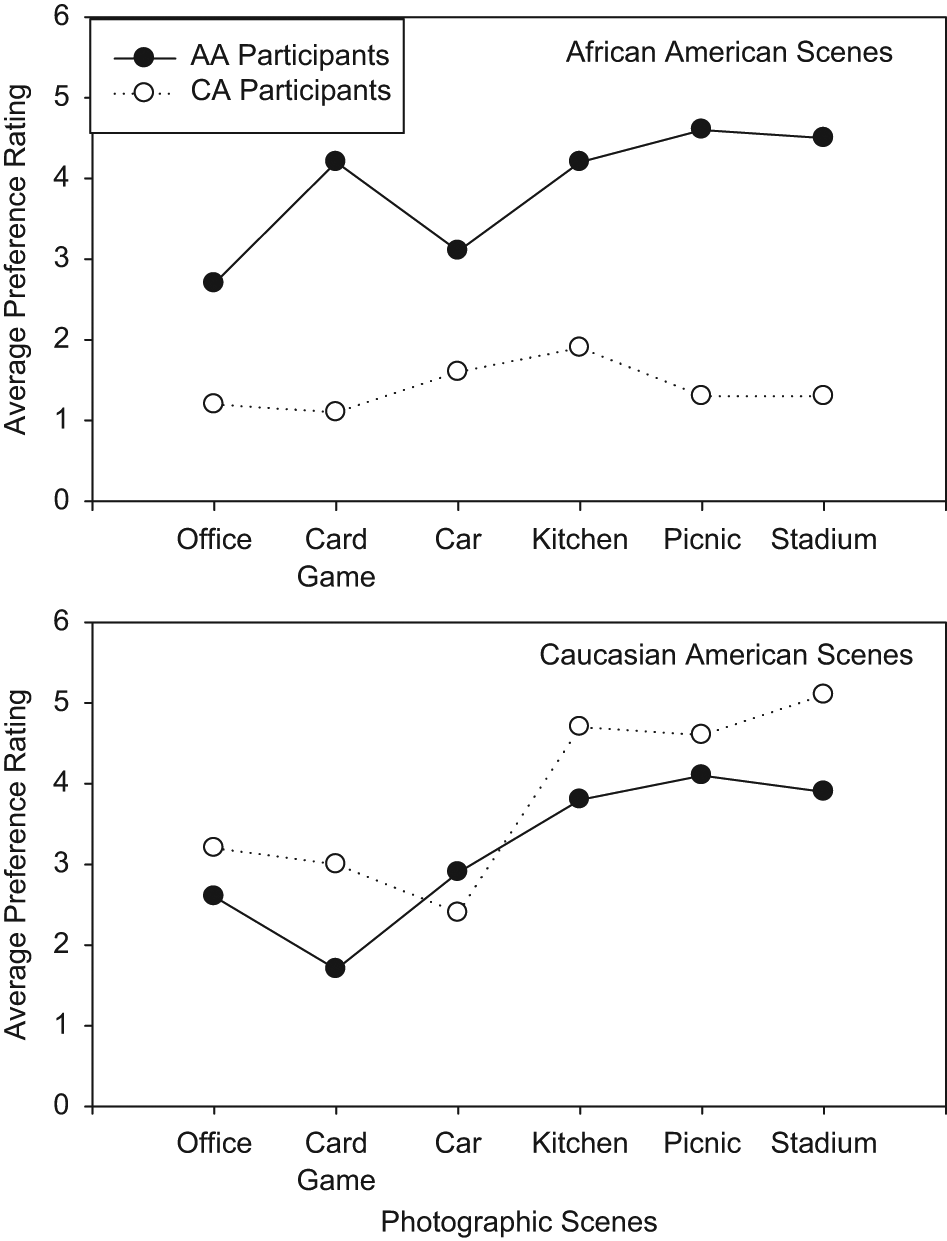
Average preference ratings by the AA and CA participants for the six pairs of photographs
Because of the interaction effect, analyses were completed for each group of participants using a two-way, repeated-measures ANOVA (Ethnicity of Model × Scene). For the African American group, there were significant results for ethnicity of models, F(1, 9) = 5.2, p < .05, partial η2 = .370, scene, F(5, 45) = 6.7, p < .05, partial η2 = .428, and the interaction, F(5, 45) = 2.6, p < .05, partial η2 = .229. Examination of means indicated that for ethnicity of models, there was a preference for African American scenes over Caucasian American scenes. Paired comparisons for the scenes indicated that picnic and stadium scenes were similar and both had significantly higher ratings than the office, card game, and car scenes (p < .05). The kitchen scene was not different from any of the other five scenes.
For the Caucasian American group, there were significant differences for ethnicity of models, F(1, 9) = 8.18, p < .05, partial η2 = .476, and for scene, F(5, 45) = 7.20, p < .05, partial η2 = .648. There was no interaction, F(5, 45) = 0.95, p > .05, partial η2 = .12. The Caucasian American participants preferred the scenes with the Caucasian American models. Paired comparisons revealed significantly higher preference scores (p < .05) for the kitchen, picnic, and stadium scenes, which did not differ among themselves over the office, cards, and car scenes, which also did not differ among themselves.
Word Count
Word count and content units were determined for four of the six scenes, namely, car, kitchen, office, and stadium scenes. Two scenes that were rated second and fifth in the preference task were eliminated to increase possible statistical differences across scene results. Means for the total word count for each participant group for the four Caucasian American and African American pairs of photographic scenes are shown in Figure 2. Generally, the Caucasian American group produced more words during picture description than the African American group. Furthermore, the Caucasian American group provided more words for the scenes with African American models rather than the scenes with Caucasian American models. In contrast, the word counts produced by the African American group were not similarly defined. They produced more words for two African American scenes and for two Caucasian American scenes.
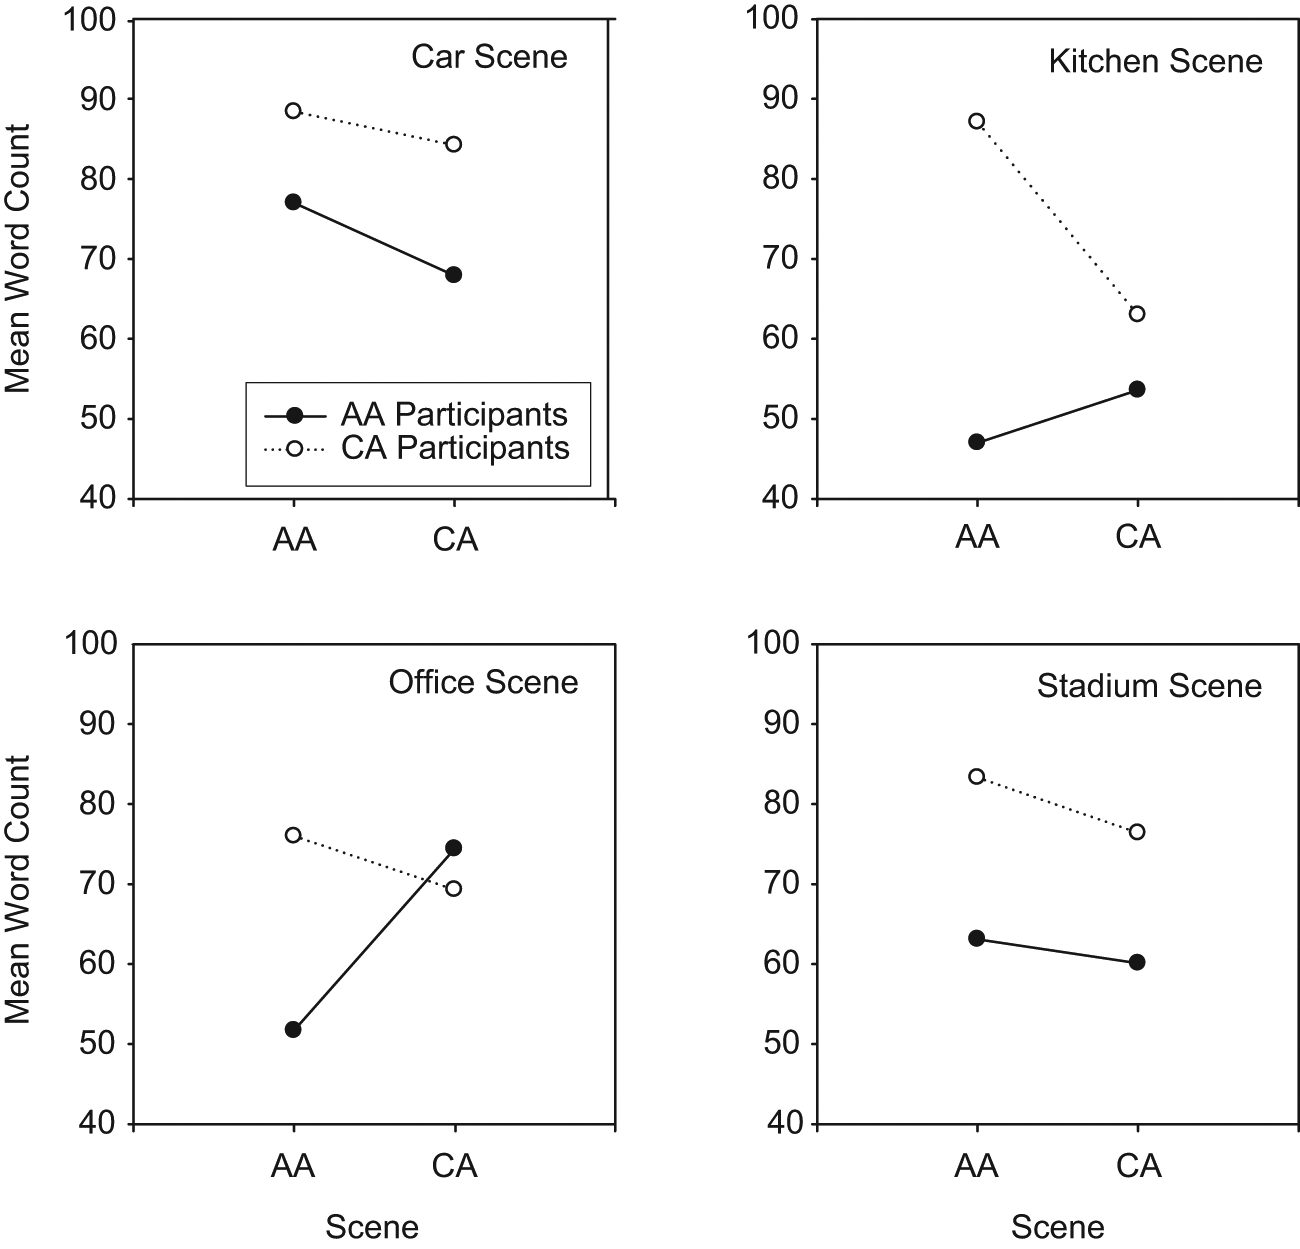
Mean word counts determined from the two groups of participants for the four pairs of photographic scenes that differed by ethnicity of models (AA or CA)
A three-way (Group × Scene × Ethnicity of Models), repeated-measures ANOVA (group was nonrepeating) was completed. There was a significant difference for scene, F(3, 54) = 2.77, p = .05, partial η2 = .131, but not ethnicity, F(1, 18) = .55, p > .05, partial η2 = .030, or group, F(1, 18) = 2.26, p > .05, partial η2 = .111. There were no significant two- or three-way interactions. Because of the obvious differences in results for each scene (see Figure 2) and the significant difference for scene, subsequent two-way ANOVAs were completed for each scene.
For the kitchen scene, there was no difference for ethnicity but a significant difference for group, F(1, 18) = 4.74, p < .05, partial η2 = .209. Comparison of means indicated that the Caucasian American group produced more words than the African American group. Independent t-test results for each ethnic scene indicated no difference between groups for the scene with Caucasian American models but a significant difference for the scene with African American models, t(18) = 2.26, p < .05, with the Caucasian American group producing significantly more words than the African American group.
For the office scene, there were no differences for ethnicity or group. Because of the large group differences for the scene with African American models, independent t tests were conducted for each ethnic scene. No differences were found. Finally, results for the car and stadium scenes indicated no differences for ethnicity of models or group.
As the mean number of words produced by the Caucasian American group was consistently higher across the four scenes, the data were collapsed across scenes and a two-way repeated-measures ANOVA analysis was completed. Results indicated no difference for ethnicity of scenes, F(1, 78) = 0.12, p > .05, partial η2 = .002, and a significant difference for group, F(1, 4.58), p < .05, partial η2 = .055. The interaction was insignificant. Comparison of means indicated that the Caucasian American group produced more words regardless of the ethnicity of scenes. Finally, the word count produced by the Caucasian American group for each ethnic scene was compared via dependent t test. Results indicated no difference between scenes.
Content Units
Mean content units for the four paired scenes by the two groups are displayed in Figure 3. Generally, the Caucasian American participants produced more content units regardless of scene. For three of the scenes (kitchen, office, and stadium), the Caucasian American group produced the most content when presented with the African American scenes. With regard to the African American group, they produced approximately the same amount of content regardless of the ethnicity of the models for the kitchen and stadium scenes. They produced more content for the car scene with African American models and the office scene with Caucasian American models.
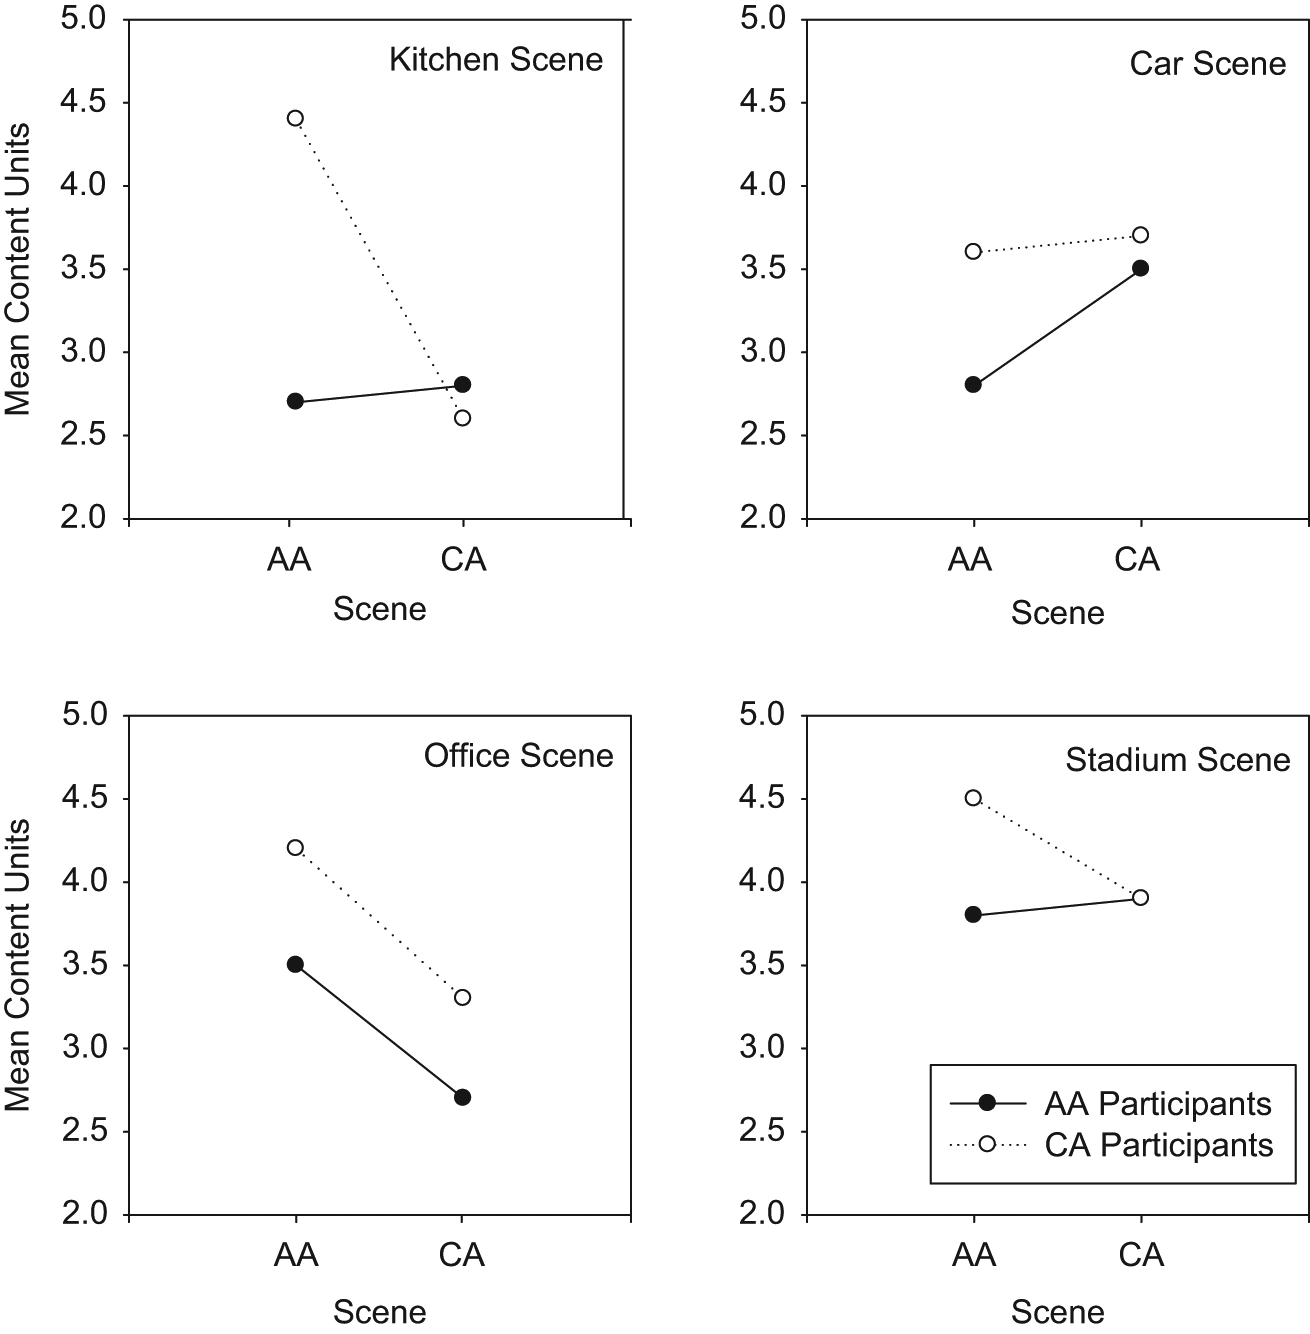
Mean content units produced by AA and CA participants for the four pairs of photographic scenes that differed by ethnicity of models (AA or CA)
A three-way (Group × Ethnicity of Models × Scene), repeated-measures ANOVA with repeated measures for ethnicity of models and scene was completed. There were significant differences for group, F(1, 18) = 5.63, p < .05, partial η2 = .238, ethnicity of models, F(1, 18) = 9.99, p < .05, partial η2 = .357, and scene, F(3, 54) = 4.36, p < .05, partial η2 = .195. There were no two-way or three-way interactions except for ethnicity of models × participants, F(1, 18) = 11.33, partial η2 = .386.
Subsequent analysis aimed at determining overall differences between levels of the main factors when accounting for the interaction effect. To determine differences between scenes, the data were collapsed across group and ethnicity of models and a one-way, repeated-measures ANOVA was completed. Results indicated a significant difference between scenes, F(1, 117) = 4.32, partial η2 = .10. Pairwise comparisons using Bonferroni correction indicated that the kitchen scene had a significantly lower number of content units compared with the stadium scene (p < .05). The number of content units for the car and office scenes did not differ from each other or the other two scenes.
Each scene was analyzed independently to determine differences for group and ethnicity of models using a two-way, repeated-measures ANOVA. For the kitchen scene, there was a significant difference between groups, F(1, 18) = 5.54, p < .05, partial η2 = .236, but not ethnicity of models, F(1, 18) = 4.29, p > .05, partial η2 = .193. There was a significant interaction, F(1, 17) = 5.37, partial η2 = .230. Pairwise comparison for group indicated that the Caucasian American group provided significantly more content units than the African American group.
For the office scene, there was no difference between groups, F(1, 18) = 2.61, p > .05, partial η2 = .127, but a significant difference for ethnicity of models, F(1, 18) = 2.77, p < .05, partial η2 = .210. The interaction was insignificant, F(1, 18) = .017, p > .05, partial η2 = .001. Comparison of means for the ethnicity of models indicated that more contents units were produced for the African American scene than the Caucasian American scene. ANOVA analysis for the car and stadium scenes indicated no differences for groups or for ethnicity of models.
As examination of Figure 3 suggested that Caucasian American group produced more content units across all four scenes, a final analysis was completed by collapsing the data across the four scenes and completing a two-way, repeated-measures ANOVA. Results indicated a significant difference for group, F(1, 78) = 8.17, p < .05, partial η2 = .095, but not ethnicity of models, F(1, 78) = 2.38, p > .05, partial η2 = .030. The interaction was also insignificant. Comparison of means indicated that the Caucasian American group produced significantly more content units, overall, than the African American group.
Discussion
The purpose of this study was to determine the effects of presenting ethnic-specific photographs (African American and Caucasian American) to participants who were either African American or Caucasian American and asking the participants to sort the photographs by preference and to state what was happening in the photographs. Three measures were reported; preference ratings, word count, and content units. Results for the preference task were clear; the African American group preferred photographs of African American models and the Caucasian American group preferred photographs of Caucasian American models. The Caucasian American group’s preference ratings were not as definitive as the African American group’s preference. This finding was expected from the tentative results of a pilot study (Ramkissoon et al., 2009). Furthermore, this finding may be specific to the population under investigation (adults aged 45-65 years from Mobile, Alabama). Other studies vary in outcomes. It has been shown that children (Bennett, Dewberry, & Yeeles, 1991) and young adult professionals (Long, Gomez, Asch, & Shea, 2004) have no photographic preferences based on ethnic appearance, but other young adults showed own-ethnicity, but not gender, preferences for computer-generated images (Cowell, 2002). Although further research is warranted, it would appear that presenting photographs that participants can identify with may increase their engagement in the task. This suggests that the use of the traditional middle-class Caucasian American photographs or drawings may result in a format or value bias (Wyatt, 2002) in that the non-Caucasian participants do not identify with the stimulus items and as a result make minimal responses.
With regard to the word counts and the content units, the Caucasian American participants obtained higher scores than the African American participants. There are several possible reasons for this result. Although research has primarily been based on children, it has been found that in the African American community, children are not expected to initiate conversation with adults and are expected to speak only when requested (Heath, 1982; Ward, 1971). This pattern of socialization might also play a role in the development of adult discourse skills, especially in this situation where the person collecting speech samples was a Caucasian American male. He could possibly have been seen as an authority figure. This could constitute a situational bias in the testing protocol (Wyatt, 2002).
Wyatt (1999) reported that in some minority communities, the adults tend not to talk about the obvious. It is possible that differences in word count and content units could be due to the “mundane” nature of the photographs. Furthermore, Caucasian Americans are trained from early ages on performance tasks such as picture descriptions in contrast to African Americans who are not. In this study, the African American group may have decided that the photographs represented normalness or naturalness that is self-evident and thus not worthy of commentary.
Group differences in content units may be due to ethnic differences in communication style. Olness et al. (2002) reported that discourse genre may be narrative (topic associating) or descriptive (topic centered). Review of the transcriptions revealed that the Caucasian American group engaged in descriptive discourse. In contrast, reviews of the transcripts produced by the African American group revealed that some participants engaged in narrative discourse, especially topic-associated discourse. As described by Terrell and Jackson (2002), topic-associated discourse is a progressive style, whereby speakers do not remain with a central topic (such as a photographic scene) but express ideas generated by the scene but not of the scene. For example, with the car scene, one of the African American female participants presented a scenario where she talked progressively about what would happen once the car was “fixed.” She stated that the couple would finish having a picnic then return to their home, which she predicted was a nice home due to the nature of the car they drove. As a result of these differences in communication style, the Caucasian American group would obtain higher scores as they described aspects of the scenes. The African American group, if they used a narrative style, would not describe the scene, per se, thus obtaining lower scores. Molrine and Pierce (2002) found similar differences between African American and Caucasian American adults when they completed expressive language subtests of three aphasia batteries. Although they did not find differences for grammatical or phonological features, they did find differences in discourse styles, specifically that the African American participants used topic- associated discourse.
This study was preliminary in nature and did not approach the initial concern, which is the development and use of ethnically appropriate stimulus materials for testing adults with acquired brain injuries, especially aphasia. Although there appear to be differences in ethnically based stimulus preferences for unimpaired adults, it needs to be determined whether these preferences are important to those with brain injuries. In addition, the health disparities in regards to stroke prevalence continue to support this line of research. Anecdotal reports by the current African American participants suggested that they appreciated the African American models, but the scenes themselves were unrealistic to the community. For example, members of the African American community would favor a large, party-style gathering rather than the small picnic scene with two individuals as depicted in the current stimulus set. Finally, although the current study did not show specific, ethnically based differences in communicative styles used (e.g., narrative vs. descriptive), it needs to be determined whether such differences are important when evaluating ethnically diverse adults with aphasia. A follow-up study investigating these issues is currently underway in our research laboratory.
Footnotes
Declaration of Conflicting Interests
The author(s) declared no potential conflicts of interests with respect to the authorship and/or publication of this article.
Funding
The author(s) received no financial support for the research and/or authorship of this article.