
Abstract
The article presents a method to elicit personal network data in Internet surveys, exploiting the renowned appeal of network visualizations to reduce respondent burden and risk of dropout. It is a participant-generated computer-based sociogram, an interactive graphical interface enabling participants to draw their own personal networks with simple and intuitive tools. In a study of users of websites on eating disorders, we have embedded the sociogram within a two-step approach aiming to first elicit the broad ego network of an individual and then to extract subsets of issue-specific support ties. We find this to be a promising tool to facilitate survey experience and adaptable to a wider range of network studies.
Introduction
Despite the growing popularity of web-based surveys, there is limited experience in using them to collect personal network data, which enables us to describe the local social environment of a sample of focal actors (in contrast to whole network studies that focus on the structure of some well-defined social group such as a school or workplace). The techniques traditionally used in personal network surveys combine name generator questions, aiming to elicit the names of persons (alters) to whom the respondent (ego) has ties, and name interpreters, which characterize these alters in terms of their ties to one another (if any), and other attributes such as gender, age, type of relationship, or frequency of contact with ego. The few examples of use of name generator and name interpreter questions in web surveys include Marin (2004), Lozar Manfreda et al. (2004), Coromina and Coenders (2006), and Vehovar et al. (2008).
Name-generating questions tend to be taxing for respondents, especially when the size of individual networks is large, and web surveys exacerbate this problem as they are not administered by an interviewer. As highlighted in Vehovar et al. (2008), respondents receive no additional help besides the instructions contained in the questionnaire and no feedback in case of a misunderstanding, and may have little motivation to complete the survey. Technical issues (compatibility with different browsers, settings, and versions) may arise; and framing effects (graphics, colors, and the intertwining of visual and textual elements) affect the quality of responses (Couper et al. 2007; Fielding et al. 2008). The quality of network data collected online may be lower due to respondents answering in a time-saving manner (Matzat and Snijders 2010). Overall, online data are less reliable and more dependent on usability issues.
Even so, survey methodologists have long emphasized the usefulness and potential impact of visual clues in web surveys, just as aural clues were crucial in phone surveys (Dillman and Smyth 2007). Strategic use of visualizations to improve survey experience and—indirectly—to enhance data quality is all the more likely to succeed in network studies, as the recent spectacular rise of online social media has familiarized large audiences with network graph structures.
This article proposes a visual solution to embed name generators and interpreters within a web survey in an effort to minimize respondent burden while maximizing the amount and quality of information retrieved. It is based on the use of a playful, user-friendly graphical interface that allows participants to draw their networks online. Our solution has potential to reduce respondent burden in two ways. First, it reduces the time needed to complete a survey as participants do not have to list the names and attributes of alters before obtaining a visual representation: They can draw their networks directly on the graphical interface without having to wait for a subsequent rendering of the image through some optimizing layout algorithm. Second, the graphical tool offers an immediate reward to participants through a global view of their networks.
This article outlines our implementation of such a solution in a specific project on the social networks of users of websites on eating disorders. Sometimes depreciatively referred to as “pro-ana,” this is a very particular population that had never been systematically surveyed before, although accounts of its existence can be traced back to the early 2000s (Casilli et al. 2012). Its members are heavy Internet users with a high degree of computer literacy, a major reason to use a web survey; however, the health risks and the stigma involved make them a sensitive and almost hidden group. Therefore, some aspects of our empirical approach, such as the recruitment strategy, may be unsuitable for other studies. But we believe that our graphical name generator can be easily generalized and that our experience may provide valuable insight and inspiration to other researchers who study personal networks in various settings. Accordingly, this article focuses exclusively on those aspects that are of general methodological interest, rather than on specificities of our own target population.
In what follows, we review essential theoretical elements and present our study. We then outline our graphical solution and how we have built it into our web survey. Finally, we discuss the lessons learned from our experience and outline possible future developments.
Theoretical Framework: A Two-stage, Context-based Approach
Since the pioneering work of Laumann (1973), Wellman (1979), and Fischer (1982), the use of name generators to collect social network data has spread widely, and several alternative versions have been proposed and tested. It would be outside the scope of this article to retrace this history or the methodological discussions that have accompanied it; interested readers can refer to Ferrand and de Federico de la Rua (2006) and special issues of Field Methods and Social Networks (Wellman 2007a, 2007b). Here, we briefly review some aspects that are relevant for implementation of this methodology in web surveys and discuss the choices that we have made.
There is a general consensus that any effort to reconstitute the exhaustive personal network of an individual would be illusory. In part, this is due to the sheer size of such networks and the definition and measure of ties (Bernard et al. 1990; Killworth et al. 1990); in part, this is also an effect of recollection biases and other cognitive limitations that may affect responses (McCarty, Killworth, et al. 2007). Therefore, a commonly adopted approach is to identify a restricted subset, whose definition depends on the research questions.
One option is to allow free recall within defined scope conditions (Wellman 1979). Within this approach, the set of relevant alters may be restricted to those with whom there have been contacts over a given time period, for example, the last day, week, month, or year (Milardo 1988:29). This provides a clear reference time frame for respondents, even though the period of time chosen may not be typical, and even though the recent occurrence or frequency of interactions may be uncorrelated with quality or importance of the relationship according to the respondent (Bidart and Charbonneau 2011:271–72; Marin and Hampton 2007:166–67). Variants that reduce the impact of rare events use diaries over a certain period of time (Fu 2007) or phone notebook data (Lonkila 2004). Alternatively, the scope conditions may restrict choice of alters to the core personal networks (Marsden 1987), the persons who are of greatest importance to respondents (Wellman 1979), or those with whom they feel particularly close. This is a commonly adopted approach, especially in surveys in which for time constraints or other reasons only one name generator can be implemented and the researcher can be content with strong ties. A well-known example is the name generator used in the American General Social Survey (GSS), asking people to name those with whom they “discuss important personal matters” (Burt 1984). This criterion can be combined with the former one (in the GSS, the time horizon is limited to the last 6 months), and with an upper limit to the total number of alters to be included (five in the GSS). Though widely used, this approach leaves out weak ties and a number of other alters who, in fact, may prove crucial in influencing behaviors or in providing support in particular circumstances (Marin and Hampton 2007:168).
A different option is to ask questions that define a range of potential or actually supportive alters, as was first attempted by Barrera (1980), Fischer (1982), and more recently Grossetti (2007). For example, respondents might have to name someone who has recently helped them (or would help them) with tasks around the home; someone from whom they could borrow some small thing like a tool or a cup of sugar; and who they would ask for help if they needed to borrow a large sum of money (Marin and Hampton 2007:171). Typically, each of these questions elicits different answers, suggesting that people can obtain support from different subsets of their social networks depending on the issue at stake. This approach is therefore useful to obtain information on the support networks of individuals but does not provide a complete picture of their sociability more generally.
A two-step combination of these two approaches is described in Bidart and Charbonneau (2011). The first stage aims to reconstitute the broadest network possible to obtain the most complete image of the respondent’s social surroundings; to achieve this, Bidart uses a free recall name generator in which respondents name alters they meet in various social contexts. As already shown in Marin (2004), reference to contexts works as a memory aid in that individuals tend to mention alters by association, clustering the names of those who belong to the same group or participate in the same common activities. Therefore, a name generator referring to contexts of interaction results in more accurate estimates of the size and properties of personal networks.
Bidart’s second stage aims to isolate, from these broad personal networks, the subsets of alters who provide specific help or support in particular matters—for example, who have helped in a job search. These lists of names are generated from the one coming from the first stage of the contextual network: Participants can refer to it and are allowed to add new names. With respect to other methods for eliciting support networks, this one has the advantage of being “more systematic and more likely to assist the memory as it reaches a comparatively broader array of fields and time spans” (Bidart and Charbonneau 2011:279).
There have been rare, though successful, attempts to include network visualizations in data collection. Hogan et al. (2007) report that their use of visual sociograms benefited their respondents by providing them with a more holistic and detailed view of their relationships than traditional name generators. McCarty, Molina, et al. (2007) show the interest of comparing the personal network as initially drawn by the participant, with the graph obtained by the researcher applying layout optimization algorithms. While these two studies were interviewer-assisted, paper-and-pencil ones, network visualization tools have also been used in self-administered computer-based surveys.
Software tools such as EgoNet and C-IKNOW require participants to list alters, their attributes, and their ties to one another; participants then apply an optimizing algorithm to render the network graph in quasi-real time. This approach has the advantage of providing quick feedback to participants by showing them the shape and structure of their networks and prompting them to make adjustments until they find the result satisfactory. McCarty and Govindaramanujam (2005) clearly explain why respondent burden declines: Relative to traditional studies in which respondents are forced to evaluate each alter pair and indicate whether or not there is a tie, graphical interfaces allow drawing ties only where they exist, thereby sparing respondents the task of evaluating all null ties. However, visual methods may also induce unmotivated respondents to neglect ties that are not null, thereby lowering data quality.
Our methodological solution combines the comprehensiveness of Bidart and Charbonneau’s two-stage approach with a burden-reducing graphical tool. Our approach to visualization implements in a computer-based graphical interface some of the lessons learned from studies that used offline visualization, notably Hogan et al. (2007). It differs from existing software solutions in that it lets respondents draw their social network as they see it, without imposing any predefined layout. Still, it retrieves the underlying data in edge list form, so that researchers can subsequently compare them with respondents’ own drawings, thereby obtaining rich information on both the actual and the perceived social surroundings of respondents as in McCarty, Molina, et al. (2007).
The Study
Data for this research have been collected as part of the project “Ana-mia Sociability: An Online/Offline Social Networks Approach to Eating Disorders” (ANAMIA). The study addresses the controversial websites, blogs, and online forums of persons with anorexia nervosa, bulimia nervosa (“ana” and “mia” in web parlance), and other eating disorders. Media narratives emphasize the claim of some of them that anorexia is a lifestyle choice rather than a disease and the danger that they might contribute to spreading and maintaining unhealthy eating practices. Yet, these websites also provide users with emotional and practical support and may mitigate the sense of isolation traditionally experienced by eating disorder sufferers. Through a social network study, we aim to shed light onto the consequences of using these online communication tools and to devise innovative solutions for health policy and information campaigns.
Because potential respondents are by definition Internet users, with a medium-to-high degree of computer literacy especially for those among them who are authors or administrators of blogs and forums, a web survey seems a most suitable tool. Our participant-generated sociogram drawing tool aims to facilitate respondents’ tasks, in the framework of the two-stage method of Bidart and Charbonneau (2011), which retrieves broad sets of social relationships first, and the smaller subsets of those who provide health-related support afterward. Our variant (which is due to our substantive research questions and may be unsuitable for extension to other studies) is that we define two sets of broad relationships instead of one: those face-to-face and those with whom interactions are primarily computer mediated.
The study was conducted in the French ana-mia online community in March–September 2011, obtaining 136 responses; and in the British one in November 2011–May 2012, with 148 responses. In follow-up phone interviews, we asked a subsample of 22 French and 15 British respondents to comment on their sociograms to gain deeper, qualitative insight into their relationships.
Overall Structure of the Online Survey
Because health risks and potential social stigma make our target population sensitive and difficult to reach, we have relied on purposive rather than representative sampling. A preliminary exploration of relevant websites, forums, and blogs has enabled us through snowballing to identify a set of potential respondents. Then, research assistants closer in age to those in the target population invited participation and accompanied respondents, in a language and style that could be understood and appreciated by them. Recruitment strategy is specific to the substantive issues addressed here, though, and we believe our graphical name generator method can be safely replicated in studies that adopt different sampling approaches.
The home page of the online survey briefly illustrates our research project and invites participation. A page “About” provides background information, while “Participate” opens the actual questionnaire interface. Respondents can access it after they confirm informed consent and age, in line with ethical requirements. They then view a set of seven tabs. Four of these tabs point to standard multiple-choice online questionnaire sections about, respectively: basic sociodemographic information; socioeconomic status; practices related to use of the Internet and social networking websites; and health, nutrition, body image, and eating disorder experience. All questions are posed in the first person (e.g., “The highest qualification I have is”). The majority of the questions are close ended and in most cases, all possible answers are identified, so that the respondent only has to tick the box corresponding to one of them (or more when relevant). This approach aims to reduce overall respondent burden and allow more time to complete the network drawing tabs (see below).
We have included among controls two questions to gauge the size of personal networks broadly interpreted, and two for the availability of social support through network ties, as perceived by respondents themselves. The questions on broad personal networks ask participants to provide a global estimate of the number of persons belonging to several relational categories—people whom they “talk to, and interact with,” respectively, in the workplace, school, family, leisure center, and via Internet, in forums and discussion groups, blogs, e-mail, MSN, and social networks (Facebook, Last.fm, etc.). The questions on support ask respondents to make a global estimate of how many people they can “talk to, and seek advice from” if they have, respectively, a small personal concern and a serious issue. Such questions are classically used to fine-tune estimates of the size of personal acquaintances networks and to check the reliability of responses to different name generators (Bernard et al. 1990). In social support studies, global estimates of network size have the additional advantage of providing an indicator of how connected people feel and how much they think they can rely on others.
Name Generators
Participant-aided Sociogram Drawing Tool to Elicit Broad Personal Networks
Two of the survey tabs include real-time visualization tools to elicit participants’ personal network ties. These sociograms are actually two graphical name generators—one for offline ties with family members, friends, schoolmates, colleagues and the like, and the other for online ties, defined as the alters with whom interactions occur solely or primarily through web-based services. The two tools, available in English and in French, are technically and visually identical, and the structure and scope of questions have been kept similar to ensure comparability. The only differences between them are in the wording of headings, instructions, and examples, to distinguish between the offline and online modes of interaction. Participants first complete the sociogram for their offline acquaintances, then the online one; they may include in the latter alters already featured in the former.
Apart from the offline/online distinction, the two name generators have been kept deliberately broad, to elicit a maximum number of nominations of people with whom respondents feel connected: Indeed, respondents are simply asked to include persons they “talked to (more than just saying hello) and/or interacted with.” This free recall approach is accompanied by a reference time frame (“in the last 6 months,” as in the GSS and other studies). As did Bidart and Charbonneau (2011), we refer to different social contexts of interaction to elicit responses, both because contexts are sociologically relevant and because recall by association may act as a memory aid. However, the risk that a long survey may weaken motivation and raise drop-out advises against asking a name generator question for each possible context. Thus, we have only provided examples in the general instructions, including, in the case of offline ties, school, workplace, family, and leisure center; and in the case of online ties, “discussion forums, blogs, e-mail, MSN, and social networks (Facebook, Last.fm, etc.).”
Upon accessing the network visualization tabs, participants are first presented with a pop-up window with instructions, including the name generator question itself. This part has been kept to a minimum because of the well-known tendency of Internet users to scan texts on screen rather than carefully read them. Participants then view the actual visualization tool (Figure 1). The screen displays a target at the center of which is a white dot representing ego; three concentric circles, of slightly different shades of color, are placed around it. They represent different degrees of closeness, so that respondents can place the closest alters in the inner circle and the less close ones in the outer circles. The concentric-circle metaphor has already been successfully used in several studies, among them Hogan et al. (2007), whose respondents found this structure and nesting straightforward and more appealing than traditional ways to distinguish degrees of closeness.
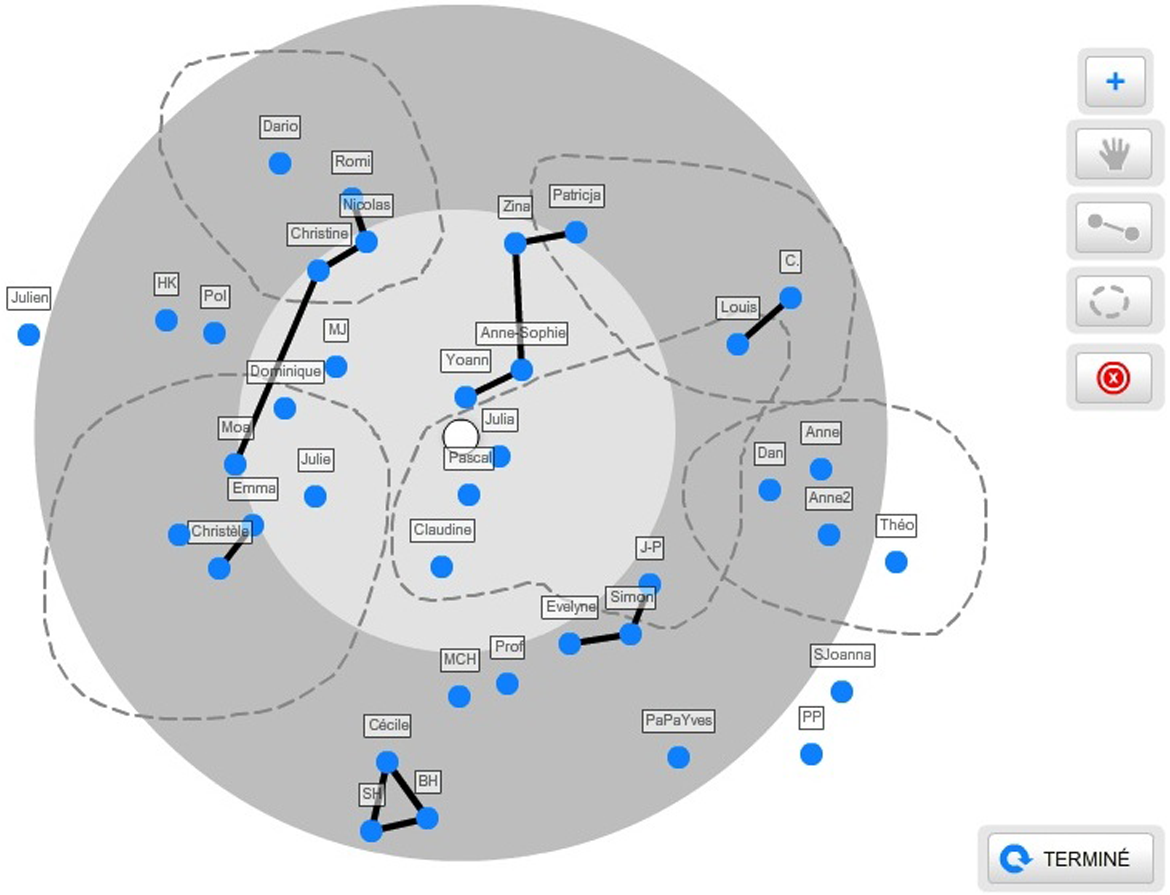
A graph as can be filled in by a participant (from a test). Blue dots represent alters and can be more or less close to ego. There can be ties and groups.
The buttons on the right-hand side allow participants to enter alters and arrange them on the target. The upper-right “+” button is to include a new person. When clicking on it, a new node in form of a blue circle appears, and the participant is presented with a window that asks basic information on this alter: name (to be inserted manually), gender (to choose from a menu), and type of relationship (also to choose from a menu, including boyfriend/girlfriend, partner, friend, family member, schoolmate, work colleague, tutor, health professional, and other). Indication of the type of tie is meant to reinforce the reference to contexts provided in general instructions. The applet places each new alter, by default, at the center bottom of the screen, and the participant can move it by simple drag. Verbal, in addition to just positional, indications of degree of closeness appear when the mouse is held over the alter node: “We are somewhat close,” “We are close,” “We are very close,” and “We are emotionally intimate.”
The other buttons can be used to, respectively, move alters around, draw ties between two alters, group several alters together, and delete alters, ties, or groups. A short description of each button appears on mouse-over. There is no limit to the total number of alters that can be entered, and participants are free to move and rearrange nodes, ties, and groups as many times as they see fit. Notice that a group in our implementation may or may not correspond to a network component strictly speaking: rather, it represents a context of interaction, whose definition is left to the respondent. Thus, we allow groups to overlap and ties within or between groups to be drawn. Figure 1 is from a test and illustrates a possible outcome.
When participants click the button “I’m done” (“Terminé” in the French version), the system records their answers and moves to the next screen. The information retrieved includes alters’ names, gender, type of relationship to ego, degree of closeness to ego, ties between alters, and group composition, and is saved in three formats: .xml (source file), .csv (for use with standard data analysis software), and .jpeg (a screenshot of the image drawn by the participant).
The Support Network: A Scenario Approach
The last tab of the online survey aims to extract, from these general personal networks, the names of alters that provide advice and support. We present respondents with the full list of alters they have previously entered, asking them to choose those among these alters whom they would seek for health-related support; if they think of someone else at this stage, they are allowed to enter one or more new names, with indication of gender and type of relationship as before (but not of their ties to other alters). Notice that the list respondents choose from includes alters mentioned both in offline and in online networks, thereby providing information on how much support comes from online connections relative to face-to-face sociability.
Different subsets of a personal network may be mobilized for different types of support; in the case of eating disorders, one may distinguish between minor, daily-life ailments and severe disturbances. To keep the survey short, we do not ask respondents to name whom they would consult in different possible matters. Rather, we assign them randomly to two groups, with a different scenario for each. One is faced with a relatively mundane issue, the other with a more critical situation (see Appendix).
Although random assignment to different scenarios does not allow comparing the extent to which the same individual may activate different types of ties in critical and in noncritical situations, it can reveal more general trends among the population observed. Specifically, we expect more strong ties (closer alters) to be mobilized in case of a serious problem than in case of a daily-life issue. In our study, we also aim to detect whether there is any tendency for support networks to be subsets of the offline rather than online personal networks, and whether any such tendencies exhibit correlation with other variables such as type of disorder. Random assignment is meant to eliminate any selection effects and ensure that comparisons are done with all other things equal.
Description of Results
Predictably, given the well-known gender bias of eating disorders, an overwhelming majority of respondents are women. They are 22 years old on average and about two-thirds of them are students. As expected, most of them are heavy Internet users, with 60% being connected more than 15 hours a week. About 90% report some eating disorder. Those among them who were also interviewed indicate that it took 20–30 minutes to complete the online survey.
The personal networks of our respondents (a subset of which is represented in Figure 2) are smallish, with an offline average size of 11.3 for France and 9.6 for the United Kingdom, and an online average of 6 for France and 5.9 for the United Kingdom; 8% of all alters are named both offline and online. The size of personal networks elicited with name generators is strongly dependent on the specific question asked (Bernard et al. 1990), and our focus on relationships that are “more than just saying hallo” over a delimited time period tends to restrict choice to significant alters. Thus, comparing the size of our networks to the size of networks elicited with similar name generators, as summarized in Bernard et al. (1990:188) and in Bidart and Charbonneau (2011:281), indicates that they are broadly in line, although these previous studies did not distinguish between online and offline ties. It follows that relative to interviewer-assisted methods, our self-administered instrument does not systematically induce underreporting of alters.
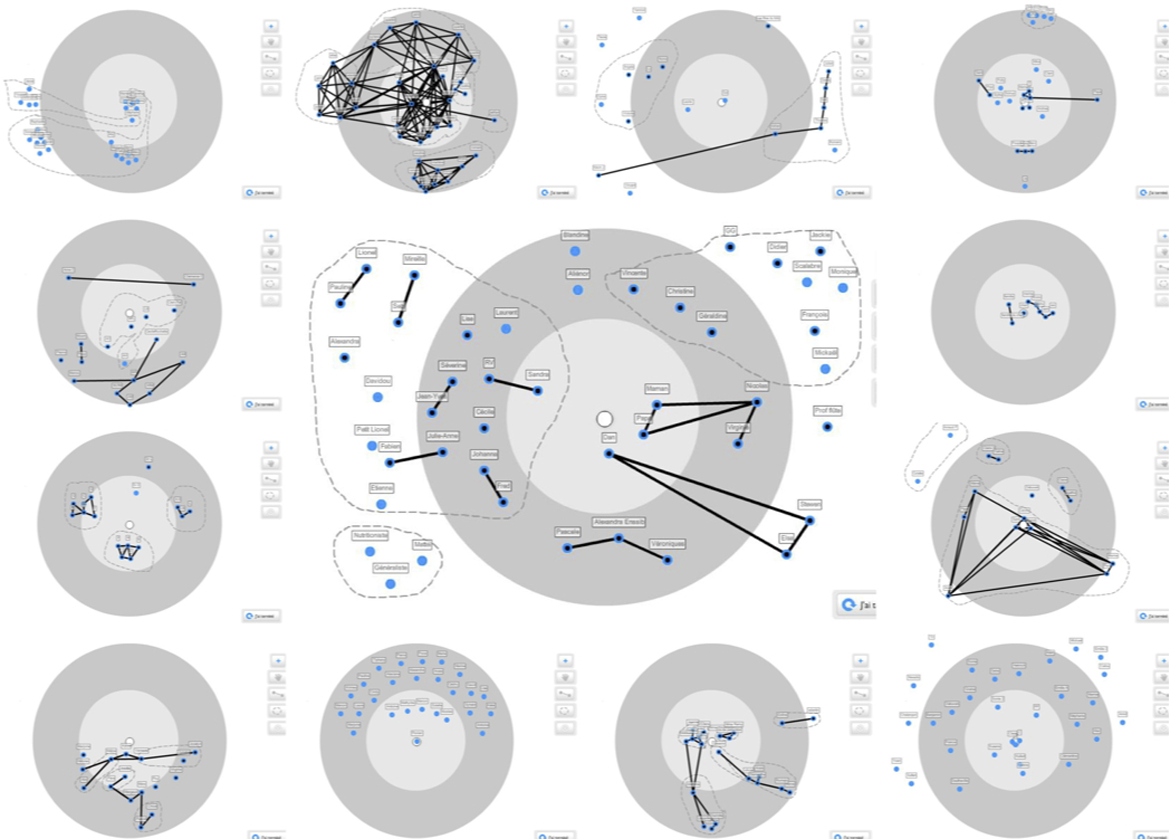
A sample of graphical personal networks as drawn by respondents.
It may seem surprising, though, that our graphically drawn online networks are smaller than offline ones, while respondents’ global estimates of network size are higher for online than for offline networks. Insight from interviews suggests that this is due to some respondents counting all of their online contacts in their global estimate, but then interpreting the second (online) graphical name generator only as a prompt—a request to think again about their relationships with focus on their computer-mediated social contexts of interaction. As a result, they have named alters they meet mostly on the web, leaving out offline contacts with whom they have minimal, though not null, computer-mediated interactions (e.g., schoolmates who are also Facebook friends, but with whom communication occurs mainly at school).
As expected from survey design, support networks elicited through scenario questions are smaller than broader personal networks: for major health problems, 4.6 and 3.5, respectively for France and the United Kingdom, while the corresponding averages for minor issues are 3.3 and 3. Interestingly enough, respondents’ global estimates of the size of their offline and online networks exceeded the number of alters elicited through the two graphical name generators, while estimates of the size of their support networks for both major and minor issues were consistent overall with the number of alters mentioned in the scenario questions. People seem better at assessing the extent to which they can rely on others for support than their sociability more generally, a finding that may be interesting to cross-check in studies with different populations.
The densities of our networks are low, with an average of 0.20 offline and 0.25 online, and there are about two–three cliques per network. While this may suggest underreporting of structural information as discussed in McCarty and Govindaramanujam (2005), our respondents have also extensively used the grouping button of the graphical interface (structurally meaningful but not included in density and clique-count calculations) to bundle together alters who share a given context of interaction: About 34% of alters were included in such groups. Qualitative interviews indicate that respondents understood very well the meaning of groups, precisely recollecting which context (e.g., school class) a group represented. This suggests that the grouping tool has further facilitated the task of respondents by providing a quicker and easy-to-memorize way to report structural information than drawing individual ties between all alters, when alters share some context of interaction. Thus, this solution may be worth reusing in other studies to counter risks of tie underreporting.
The notion of closeness implicit in our concentric-circles approach provides another important clue as to the usefulness of the method. Overall, intimate and very close alters are more frequently found offline, while close and somewhat close ones are more often online. This outcome is consistent with insight from Internet research that weak ties (taking this notion to broadly indicate relationships that are less frequently activated, or are emotionally less intense) are prevalent on the social web and that one effect of the rise of social media has been precisely to increase the number of weak ties of individuals (Ellison et al. 2007). We also find, as expected, that intimate and very close alters are more numerous (two-thirds of all alters) in support networks for serious issues, while this tendency is slightly weaker in minor issue networks, especially in the U.K. sample. These findings, and feedback from interviewees, suggest that respondents clearly understood the differences that concentric circles represent and made active use of them.
Conclusion
We have presented a participant-generated web-based sociogram, an interactive graphical interface enabling participants to draw their own personal networks with simple and intuitive tools. Written instructions are minimal and the visual structure is as self-explanatory as possible. Although drawing on previous experiences of using graphs in fieldwork, our approach is innovative in that it is the first time participants to a web survey can draw their own sociogram online, without first entering lists of alters’ names, attributes, and ties to one another. We have integrated our graphical interface within a two-step approach aiming to first elicit social ties in general and then to extract subsets of issue-specific support ties as in Bidart and Charbonneau (2011).
Our work confirms that the visual nature of the procedure is generally welcomed, and easily understood, by respondents. The survey design itself was complex—targeting a difficult-to-reach population and including not one, but two graphical name generators. Nevertheless, results indicate that the graphical name generator has been understood by all, with few signs of remaining burden.
The sheer number of responses obtained from a population that is highly sensitive and had never been surveyed before signals potential to generalize this method to other data collection projects. We expect it to be particularly useful in other studies of Internet communities, where the computer literacy of the targeted population can be taken for granted. Our experience shows that it is suitable for hidden or sensitive populations for whom a web survey has the distinctive advantage of being less intrusive than face-to-face or phone questionnaires. Potential future applications include information repositories and discussion groups on anything like self-harm, infectious, and venereal diseases or chronic conditions.
We have used our graphical name generator in a mixed-method framework, with online questionnaires for all participants and in-depth interviews for a subsample of them. The qualitative part of the study has provided additional insight by letting respondents “tell the story” of the alters they had drawn on the sociogram. This solution is in line with our choice of targeting a special community, requiring purposive sampling; yet, we believe that in principle, our graphical solution could fit with both quantitative and mixed methods, subject to proper adaptation to the context and aims of each study.
The major limitation of our contribution is that it is does not systematically compare our graphical tool with alternatives, such as face-to-face or phone modes of enquiry, in terms of unit response rate, validity, reliability, data quality, and item nonresponse. Because we targeted a special population and used purposive sampling, we cannot provide any generalizable evidence as to whether our solution would be better than, or equivalent to, more traditional name generator questions. We simply enrich the potential spectrum of means available to find the web format that would be equivalent to established name generators, and leave the question of comparison to future research. Studies with a simpler design (e.g., with only one name generator, or directed at more standard populations) would be particularly well suited to provide further insight into the general capacity of graphical solutions to improve web surveys in social network analysis.
Footnotes
Appendix
Global estimates of network size:
Today, I have … persons whom I talk to and /or interact with in my school, workplace, family, leisure center, etc.). Today, I have … persons whom I talk to and /or interact with on the Internet, forums and discussion groups, blogs, email, MSN, social networks (Facebook, Last.fm, etc.). If I have a small personal concern, I have … persons whom I can talk to, and seek advice from. If I have a serious issue, I have … persons whom I can talk to, and seek advice from.
Name generator–offline social network:
I am now going to draw my network of contacts. These are people whom I have talked to (more than just saying hello) and/or interacted with in the last six months, and whom I interact with, for example, at school, in the workplace, with my family, or at my leisure centre, etc. I am the dot at the center of the target. I shall place the others (blue dots) around me, with those closest to me towards the centre and the others further away. I can call them by their first name, last name, initials, etc.—provided I can recognize them later. If two persons share the same name, I can distinguish them by adding a number or a letter.
Name generator–online social network:
I am now going to name my Internet contacts. These are people whom I have talked to and/or interacted with in the last six months, and whom I interact with, for example, on discussion forums, blogs, email, MSN, and social networks (Facebook, Last.fm etc.). I can name the same persons as before, and/or others. I am the dot at the center of the target. I shall place the others (blue dots) around me, with those closest to me towards the centre and the others further away. I shall reuse the same name for the persons I have already mentioned before. I can call all other persons by their first name, last name, initials, etc.— provided I can recognize them later.
Name generator–support networks:
Small concern: What follows is the list of all persons I have named as my contacts, both online and offline. Let’s now imagine a small concern: I have recently noticed substantial hair loss and I am looking for a treatment. In this list, are there any persons whom I could talk to, and who could advise me? If there are any other persons I would like to talk to, but who are not in the list, I can add their names below.
Serious issue: What follows is the list of all persons I have named as my contacts, both online and offline. Let’s now imagine that I am unwell and my doctor, who is worried, is considering inpatient hospital treatment. In this list, are there any persons whom I could talk to, and who could advise me? If there are any other persons I would like to talk to, but who are not in the list, I can add their names below.
ANAMIA EGOCENTER: How to draw social networks of friends and contacts https://www.youtube.com/watch?v=AAlSaDdAaC0
Acknowledgments
We acknowledge the important contributions to the fieldwork of the ANAMIA project team members and research assistants, and we thank Beat and Doctissimo.fr for advertising our study on their websites. We are grateful to Alexis Ferrand, Bernie Hogan, Tom A. B. Snijders, and three anonymous referees of Field Methods for valuable comments and suggestions on preliminary drafts of this article.
Authors’ Note
This article is part of the research project “Ana-Mia Sociability: An Online/Offline Social Networks Approach to Eating Disorders” (ANAMIA). Approvals have been obtained from the Commission National de l’Informatique et des Libertés (CNIL) and the Research Ethics Committee of École des Hautes Études en Sciences Sociales, Paris. The web-based application has been developed in collaboration with Eranos, Paris, and the source code can be accessed at: http://www.anamia.fr/Enquetes/source/cible/source.zip. Anamia Egocentered Network Flash Application for Anamia ANR is licensed under a Creative Commons Attribution—Noncommercial 3.0 Unported License (http://creativecommons.org/licenses/by-nc/3.0/).
Declaration of Conflicting Interests
The authors declared no potential conflicts of interest with respect to the research, authorship, and/or publication of this article.
Funding
The authors disclosed receipt of the following financial support for the research, authorship, and/or publication of this article: The French Agence Nationale de la Recherche, ANR (grant number ANR-09-ALIA-001).