
Abstract
This article compares pile sort data from frequently occurring items in a cultural domain with pile sort data on infrequently occurring items in that same cultural domain. Common practice in free-list analysis has a researcher discard infrequently occurring list items. This article confirms this practice and suggests that there is an underlying structure to both frequently and infrequently occurring list items.
Humans and Lists
Social scientists have long been interested with the fact that humans categorize knowledge (e.g., Bousfield 1953; Bousefield and Barclay 1950; Henley 1969). There has been an equally long-standing recognition that cultural importance can lead categories to proliferate and become increasingly specific (Berlin et al. 1966) and, contrastingly, that categories are informed by natural or prototypical categories (Rosch 1973; Rosch et al. 1976) as well as the morphological and distributional attributes of the objects existing in the world (Boster 1988). Running through some of these and many other studies is both a concern with frequency and clustering of items (these being the empirical gateway to categorization) and the request that informants make lists.
Free listing is a common method of gathering the items in a “cultural domain” (Borgatti 1994), an area of shared, relational knowledge (e.g., Quinlan 2005; see also Weller 2014) or a shared schematic outline of how to sort domains of knowledge. Free lists consist of asking people to list all the items they can think of in a given domain. They have been used to study a variety of topics in the social sciences, such as color categories (Smith and Borgatti 1998; Smith et al. 1995), racial categories (Gravlee 2005), stereotype-based humor (Caparoso and Collins 2015), and romantic love (de Munck and Kronenfeld 2016). Generally, a researcher gathers multiple free lists from people in the same culture group, aggregates those lists, and then takes the most frequently occurring items or the items occurring nearest to the top of people’s lists as a heuristic for the contents of a given cultural domain (Borgatti 1998). After gathering frequently occurring list items, the researcher discards those that occur infrequently according to the standards of inclusiveness on a given project. This article seeks to make a contribution to this larger literature by reporting on a comparison of frequently occurring and infrequently occurring items within a common cultural domain and suggesting both a validation of common research practices (discarding infrequently occurring items is common) and to what use we might put those often neglected infrequently occurring items (infrequently occurring list items may help us identify things coming into and going out of a cultural domain, as well as explain things that people have trouble talking about for one reason or another).
Through the methodological literature, there’s been a steady attention to free lists. Robbins and Nolan (2000) observed that as people make lists, they cluster items in categories. Ryan et al. (2000) have shown that free-list items can be good recursive catalysts for generating more free lists and other cultural data. Brewer (2002) says that people often don’t give an exhaustive account of all the items that they know and are usually limited by memory or researcher instructions (but there are ways to ameliorate this). Schrauf and Sanchez (2010) suggest that, in a given cultural domains, age seems to have little effect on limiting or advantaging people producing free lists. And, while often an end in and of themselves, free lists can be part of a larger cycle of data gathering and analysis (Weller 2014).
Free lists often provide more information than a researcher uses. The items that come up once or twice frequently fall out of analysis (see Weller and Romney 1988:16–20). This process of culling and aggregating, or “cleaning” free-list data, results in leaving behind items that occur below a frequency cutoff, usually at the elbow of a scree or distribution plot of listed items, but this can be adjusted depending on how much variance a researcher would like to retain (Quinlan 2005:226). Sutrop (2001) suggests that “the terms that are listed only by a single informant or by very few subjects must be considered as accidental/occasional terms” (p. 264). Similarly, when comparing free lists of the same domain across different groups of people, Thompson and Zhang (2006:407) note that what similarities they find in free lists tend to go away as more less-frequently occurring terms are included in their analysis. Furlow (2003) observes that, even intraculturally, with a highly coherent cultural domain, there can be low informant consensus about key areas of knowledge. While I won’t be advancing Furlow’s concern with cultural consensus, I think scrutinizing low-frequency items in a cultural domain can offer some insight as to what may be going on in a case like Furlow’s, where shared knowledge is variable but the larger structure of the cultural domain is widely understood.
What I suggest is that the infrequently occurring bits of free-list elicitation are not simply accidental or occasional terms. Rather, they have some systematic relationship to the larger logic of the cultural domain in which they were elicited. This hypothesis is axiomatic of a theory of culture emergent from cultural domain analysis: Because culture, in this view, is a web of related knowledge, we would expect people to place even the most infrequently occurring items, and we might even expect some sort of relationship between singleton items and frequently occurring ones. To my knowledge, though, this axiomatic hypothesis has yet to be confirmed empirically. Also, Sutrop’s (2001), Thompson and Zhang’s (2006), and Furlow’s (2003) above-noted observations about low-frequency list items suggest that this axiomatic assumption is not universally shared. This article brings one empirical case to bear demonstrating a relationship between infrequently occurring list items and their more frequently occurring counterparts in a cultural domain. To do this, I elicited free lists on “what college students do for fun” and used item appearance frequency as my measure of salience. In turn, I conducted a pile sort analysis of free-list items, using both frequently occurring and the least occurring list items concurrently in a parallel analysis. I wanted to test whether pile sorting with low-frequency list items from a cultural domain produces a similar understanding of a cultural domain’s structure as a pile sort of high-frequency list items. Ultimately, there were similar dimensional categories used to sort both common and uncommon list items.
Methods and Results
I collected free lists of things college students do for fun from 42 students in a large, general lecture class I taught in the Fall of 2016 at Brandeis University. After cleaning the free-list data, I ended up with 289 discrete items, which allowed me to produce a typical scree chart. Cleaning consisted of consolidating grammatical forms (e.g., dropping gerund [“-ing”] endings of present participles), as well as condensing similar ideas into one list item (e.g., “alcohol,” “drink alcohol,” and “drink” all became “drink”).
I then generated two decks for comparative pile sort analysis—one of common items, one of one-off singleton items. The common items set had 32 items that seven or more people listed (Figure 1). I picked a seven-item-occurrence cutoff because it was where the elbow or bend in the scree chart was (Quinlan 2005:226). The list of singleton items ended up being longer (Figure 2). I took about a quarter of 193 items that only appear once via a random sample and generated a parallel list of 50 singleton items. Though I had no formal rationale, 50 items or around a quarter, chosen at random, seemed to capture an acceptable representative sense of the infrequently occurring items and kept the pile sort deck to a manageable size. One further note, following Bernard et al. (2009), I added one item from the singleton list that only appears once in free-list responses, “pranks,” to the common list to see if it got sorted similarly.
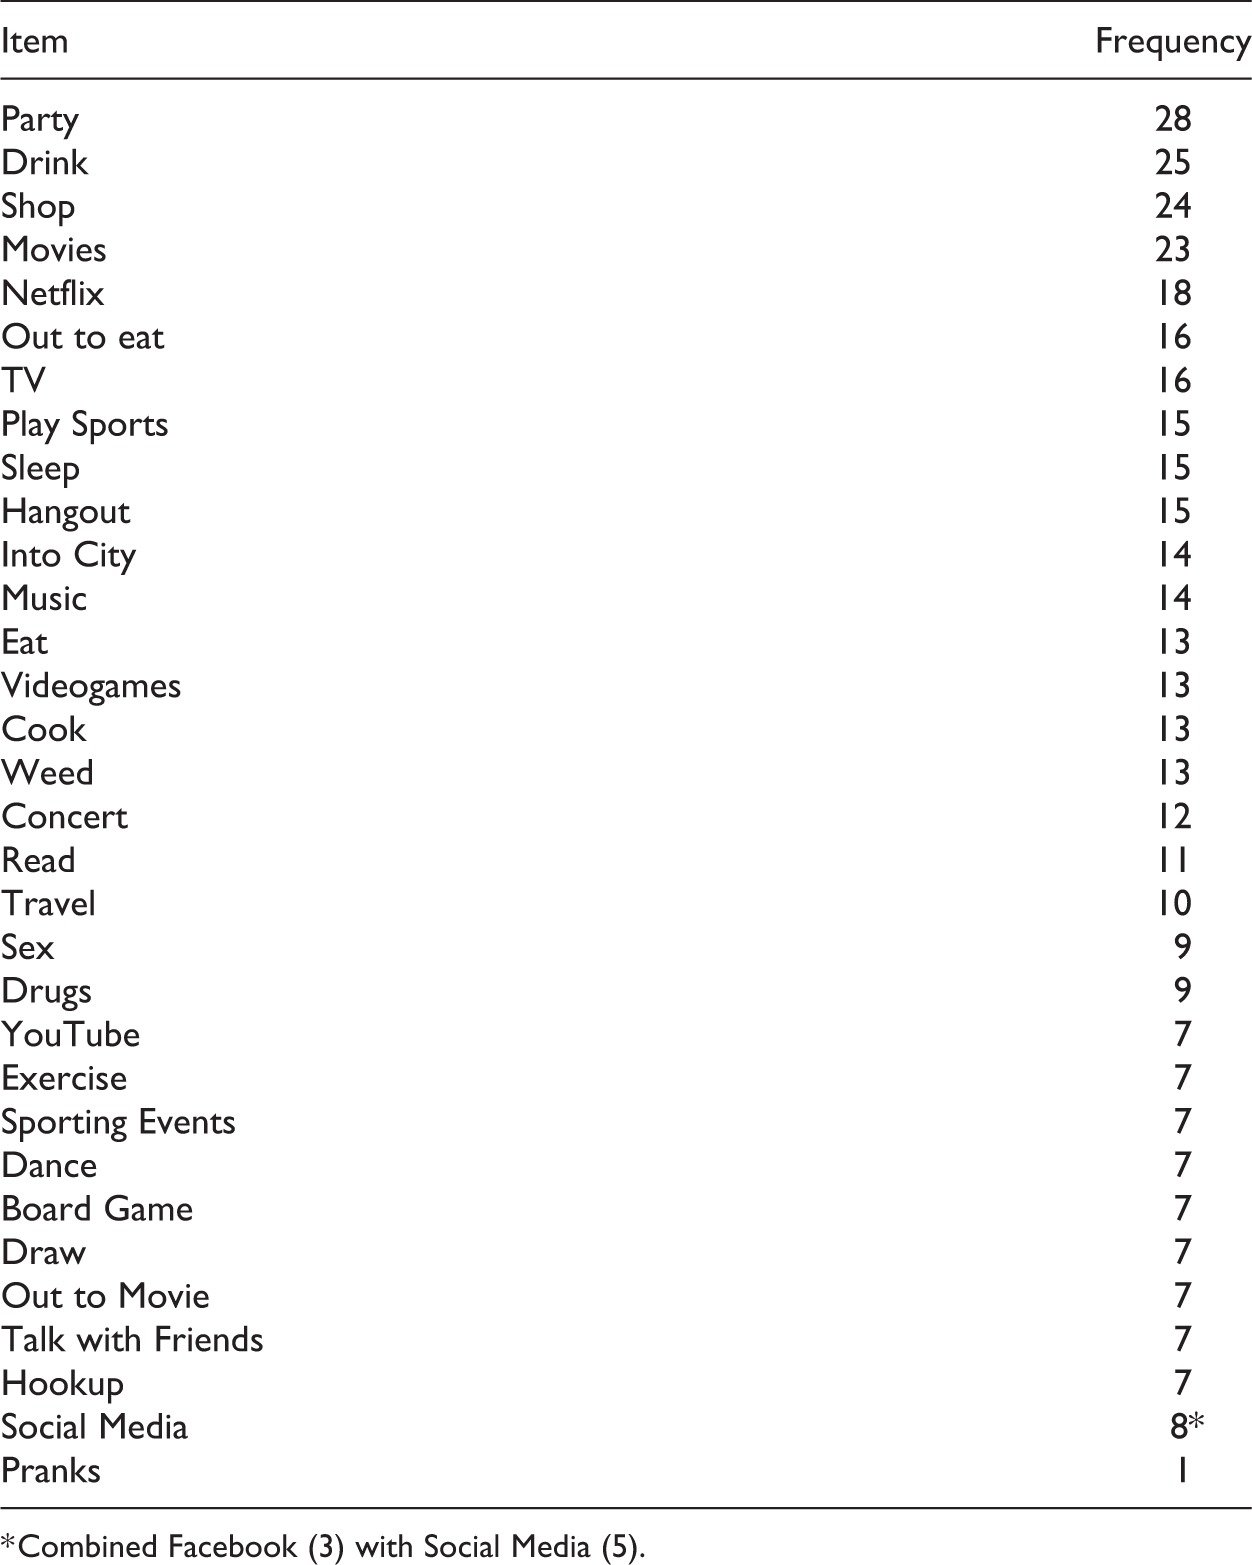
Common list items.

Singleton list items.
After defining the content of the two domain sets, I asked a new sample of different undergraduate students do a pile sort (Weller and Romney 1988:20ff), 30 students for the common deck and 30 for the singleton deck, for 60 students in total. Once participants completed sorting, I asked them to explain their piles.
To analyze the pile sort data, I conducted a nonmetric multidimensional scaling and then an average–distance cluster analysis, all using Borgatti’s (1992) program, Anthropac. I ended up having to run the scale in three dimensions to get the stress of the visual representation below .15 (Sturrock and Rocha 2000). The analysis seemed noisy and pockets and clusters did not seem obvious. For X Y and Y Z scatter charts of the multidimensional scaling, see Figures 3 –6. Following Kruskal and Wish (1978:40), I’ve plotted x and y and y and z for the common and the singleton charts to flatten out the three dimensions. Whereas in a well-defined cultural domain, you might expect tight clusters with plenty of space between them (Kruskal and Wish 1978:16; Weller and Romney 1988:19), things seemed hazier. So, I examined the cluster analyses.
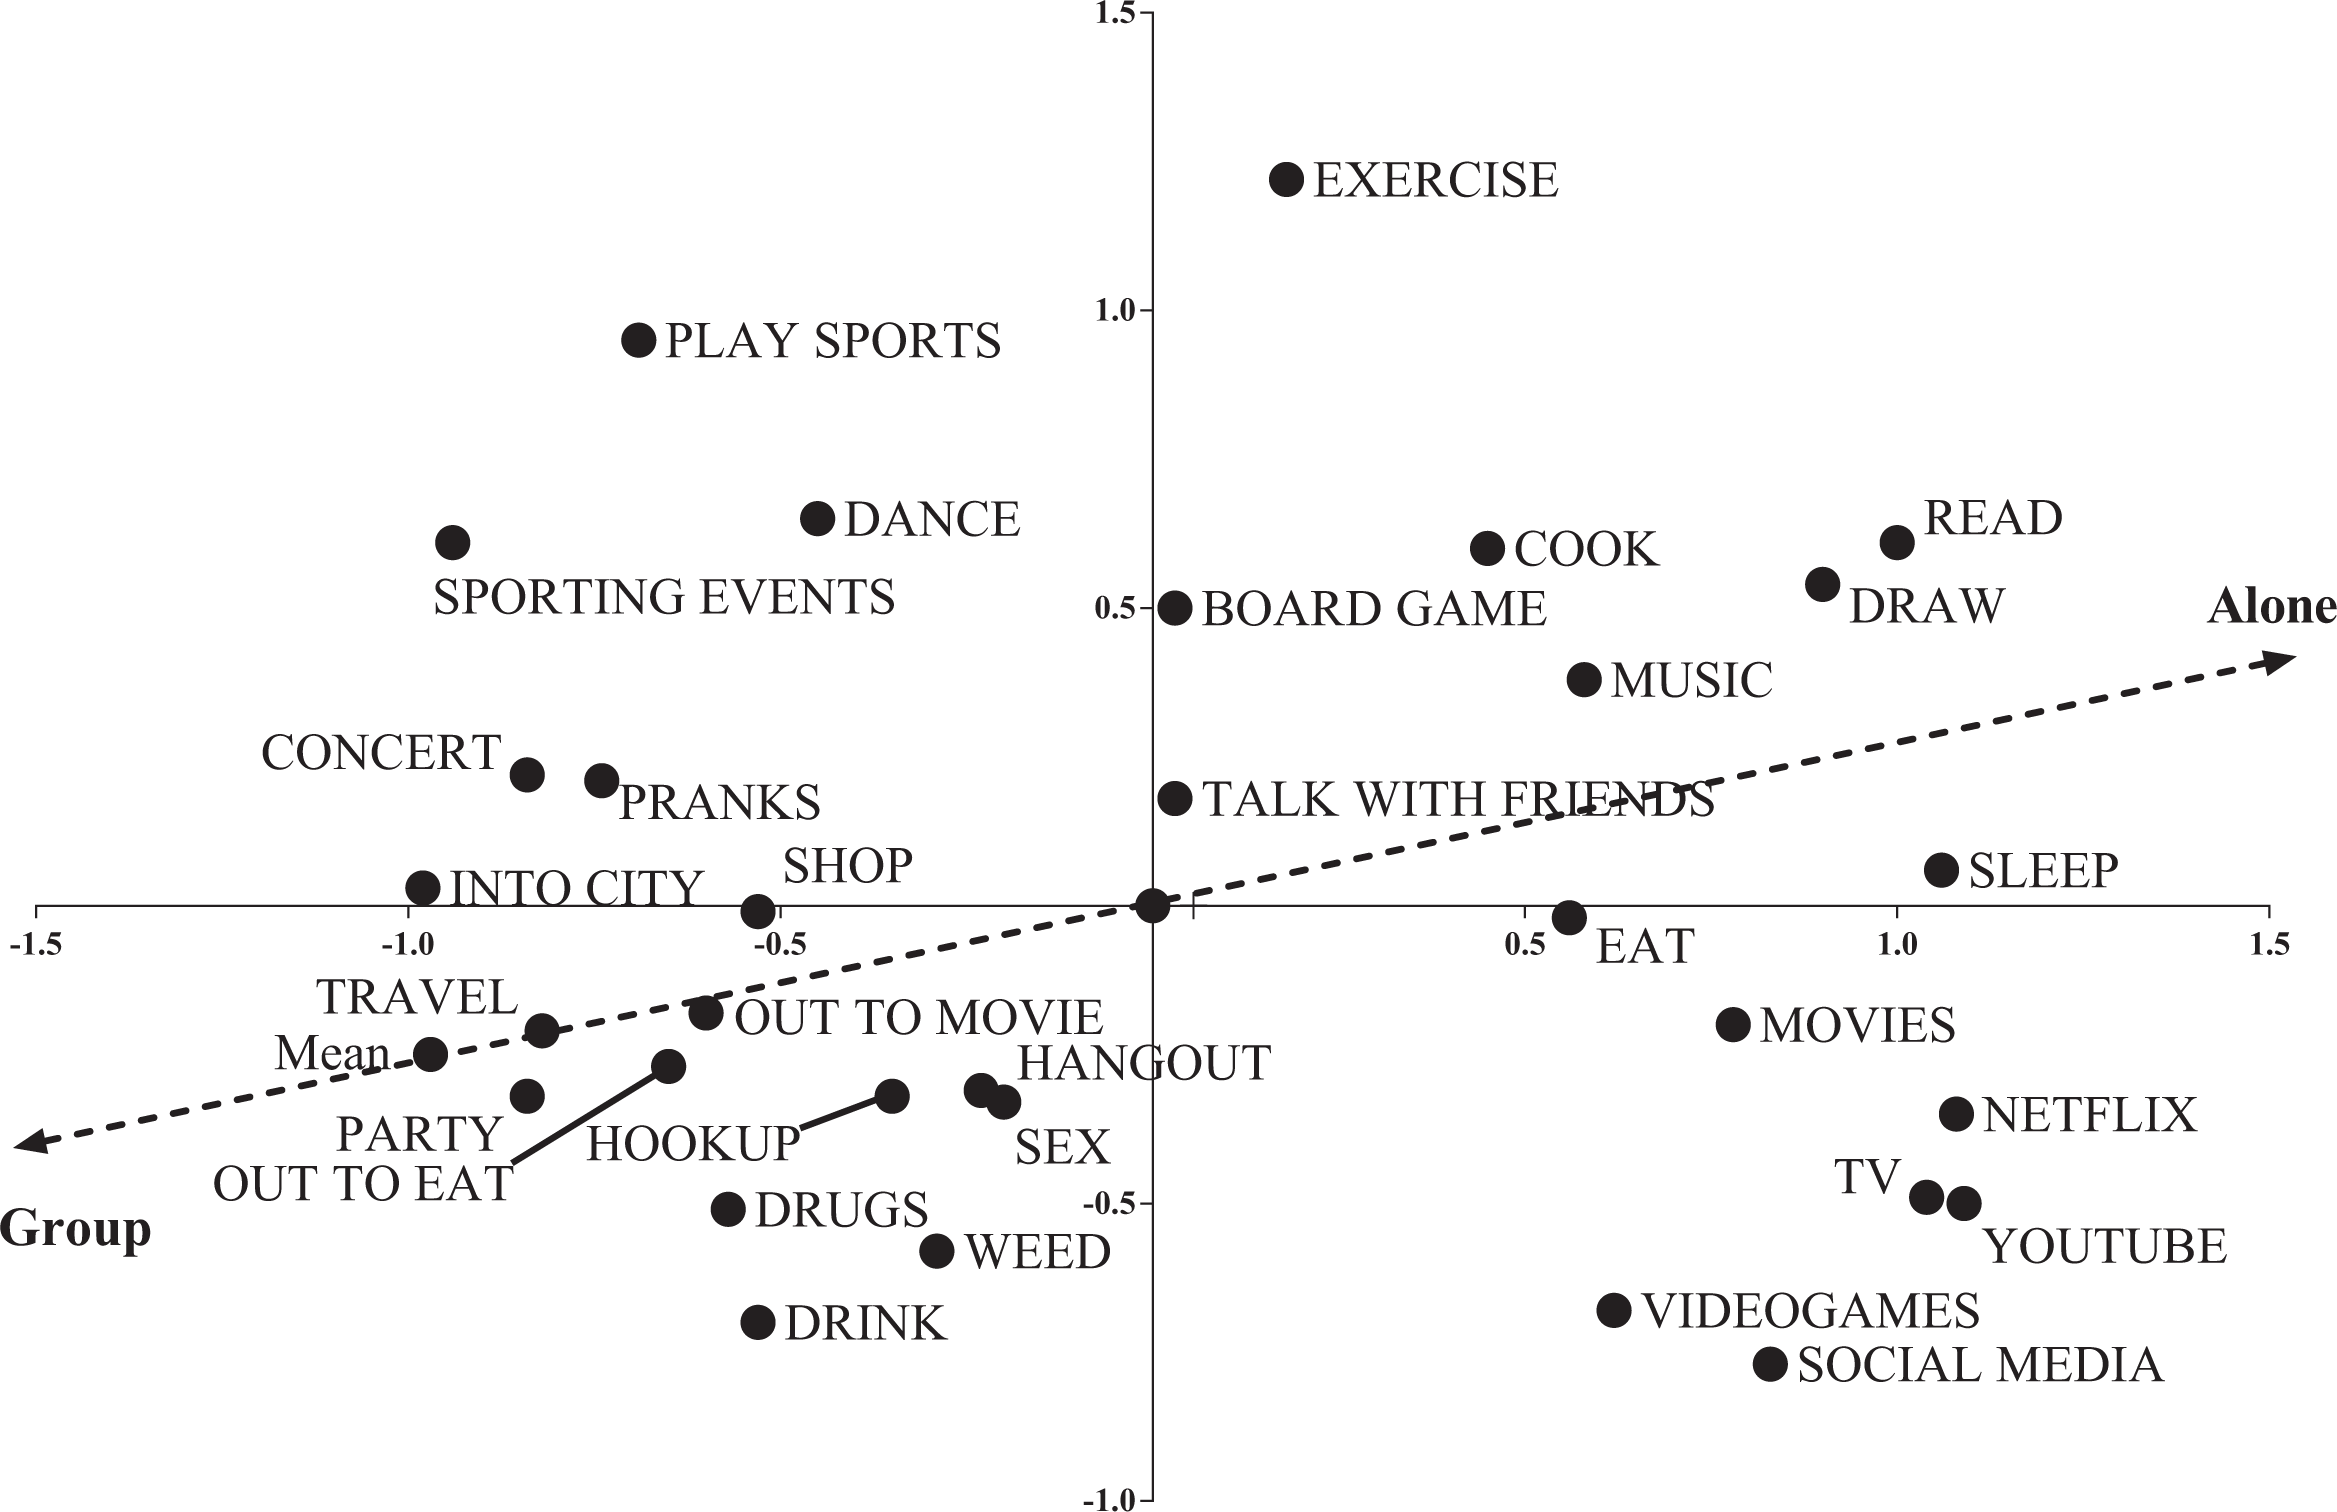
Common items, X Y with property fitting line.
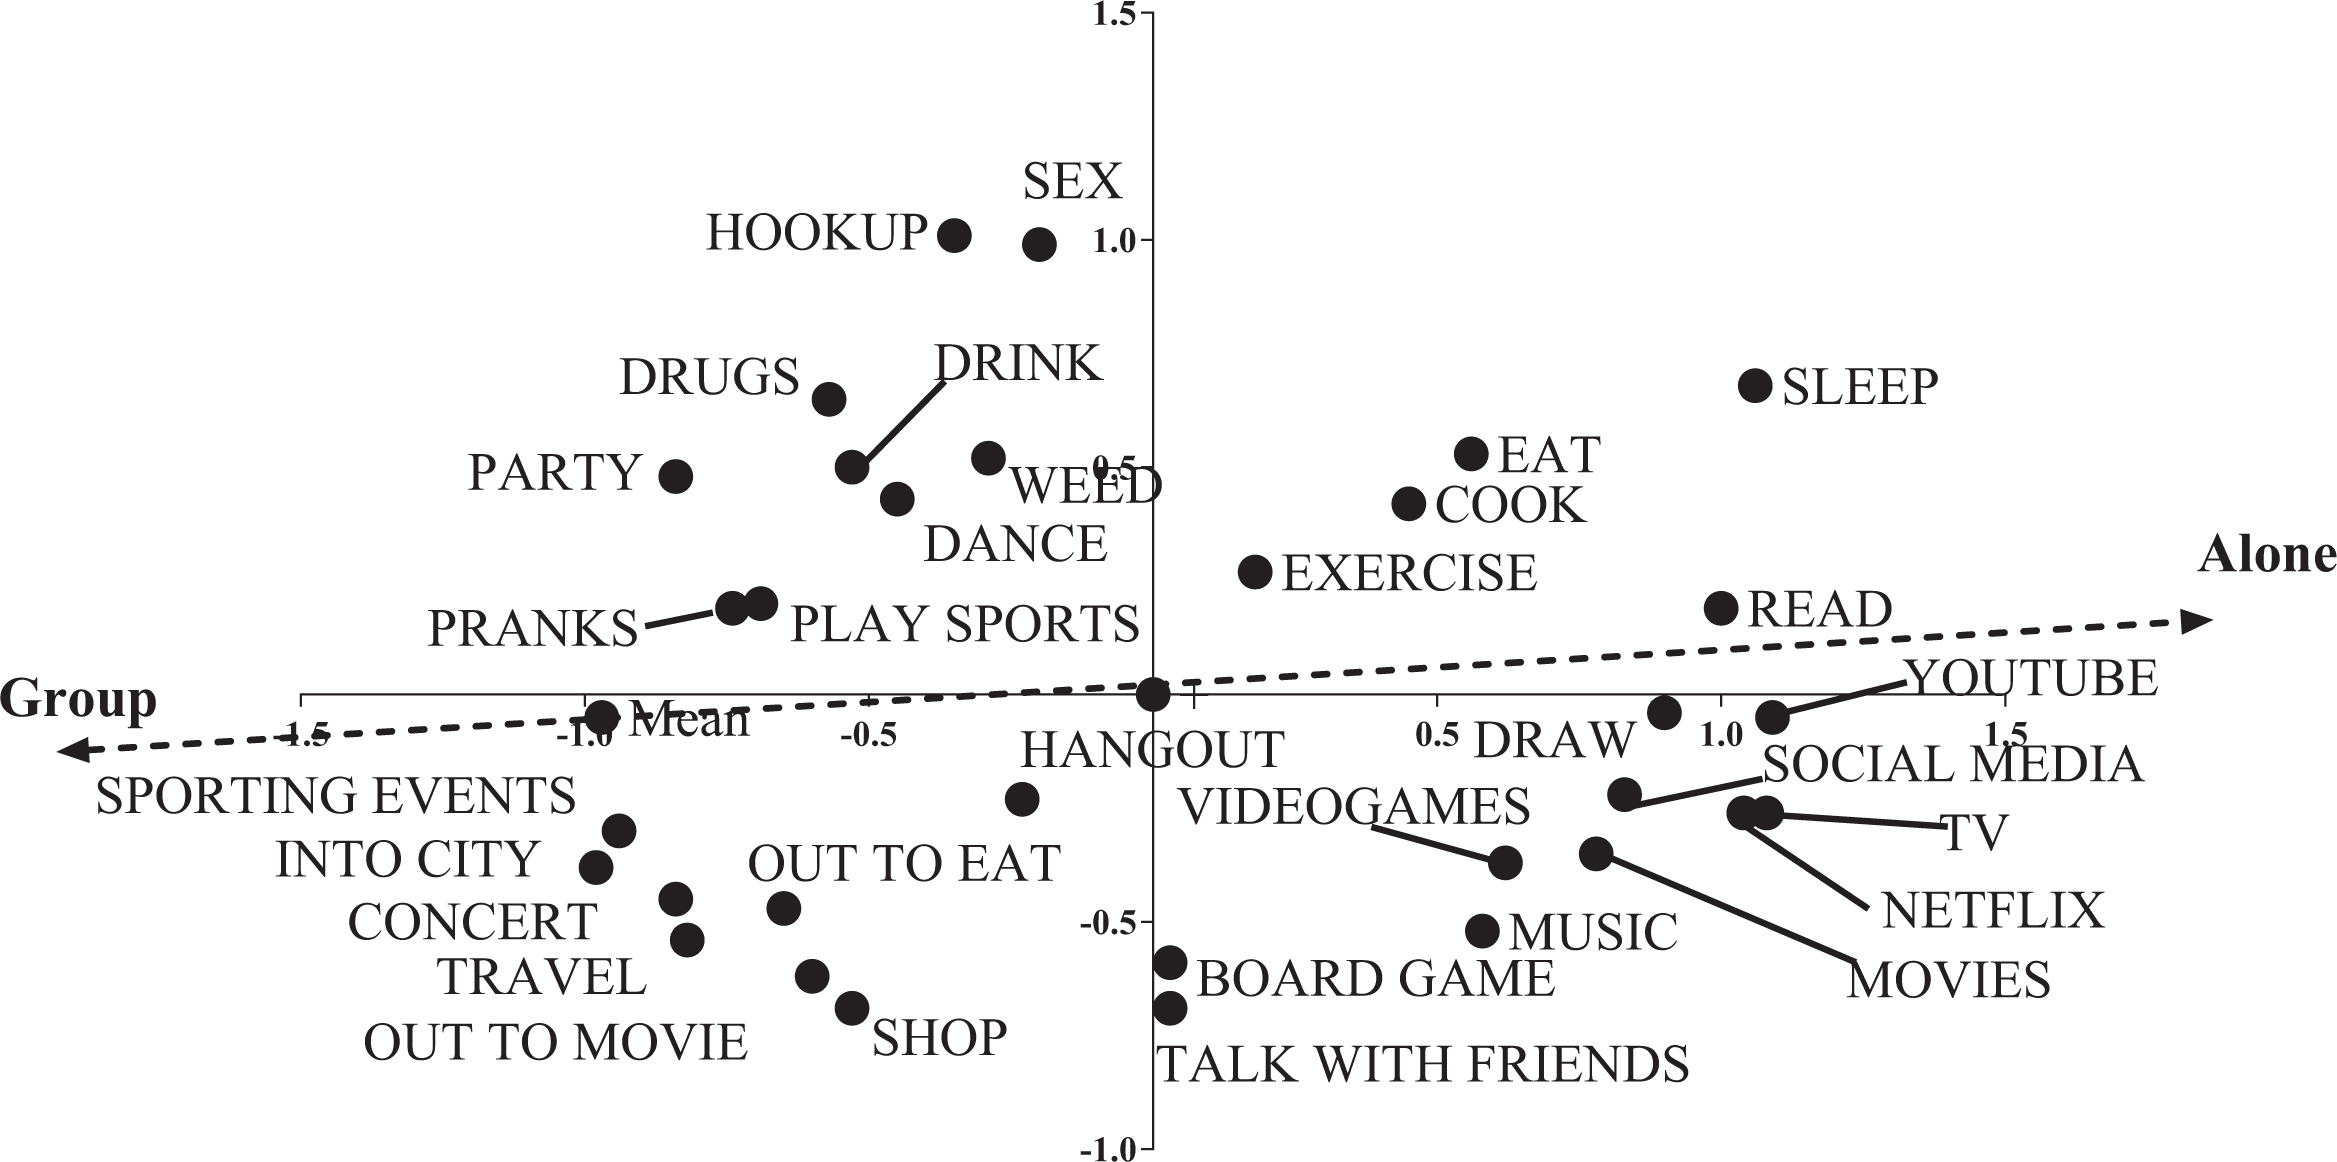
Common items, Y Z with property fitting line.
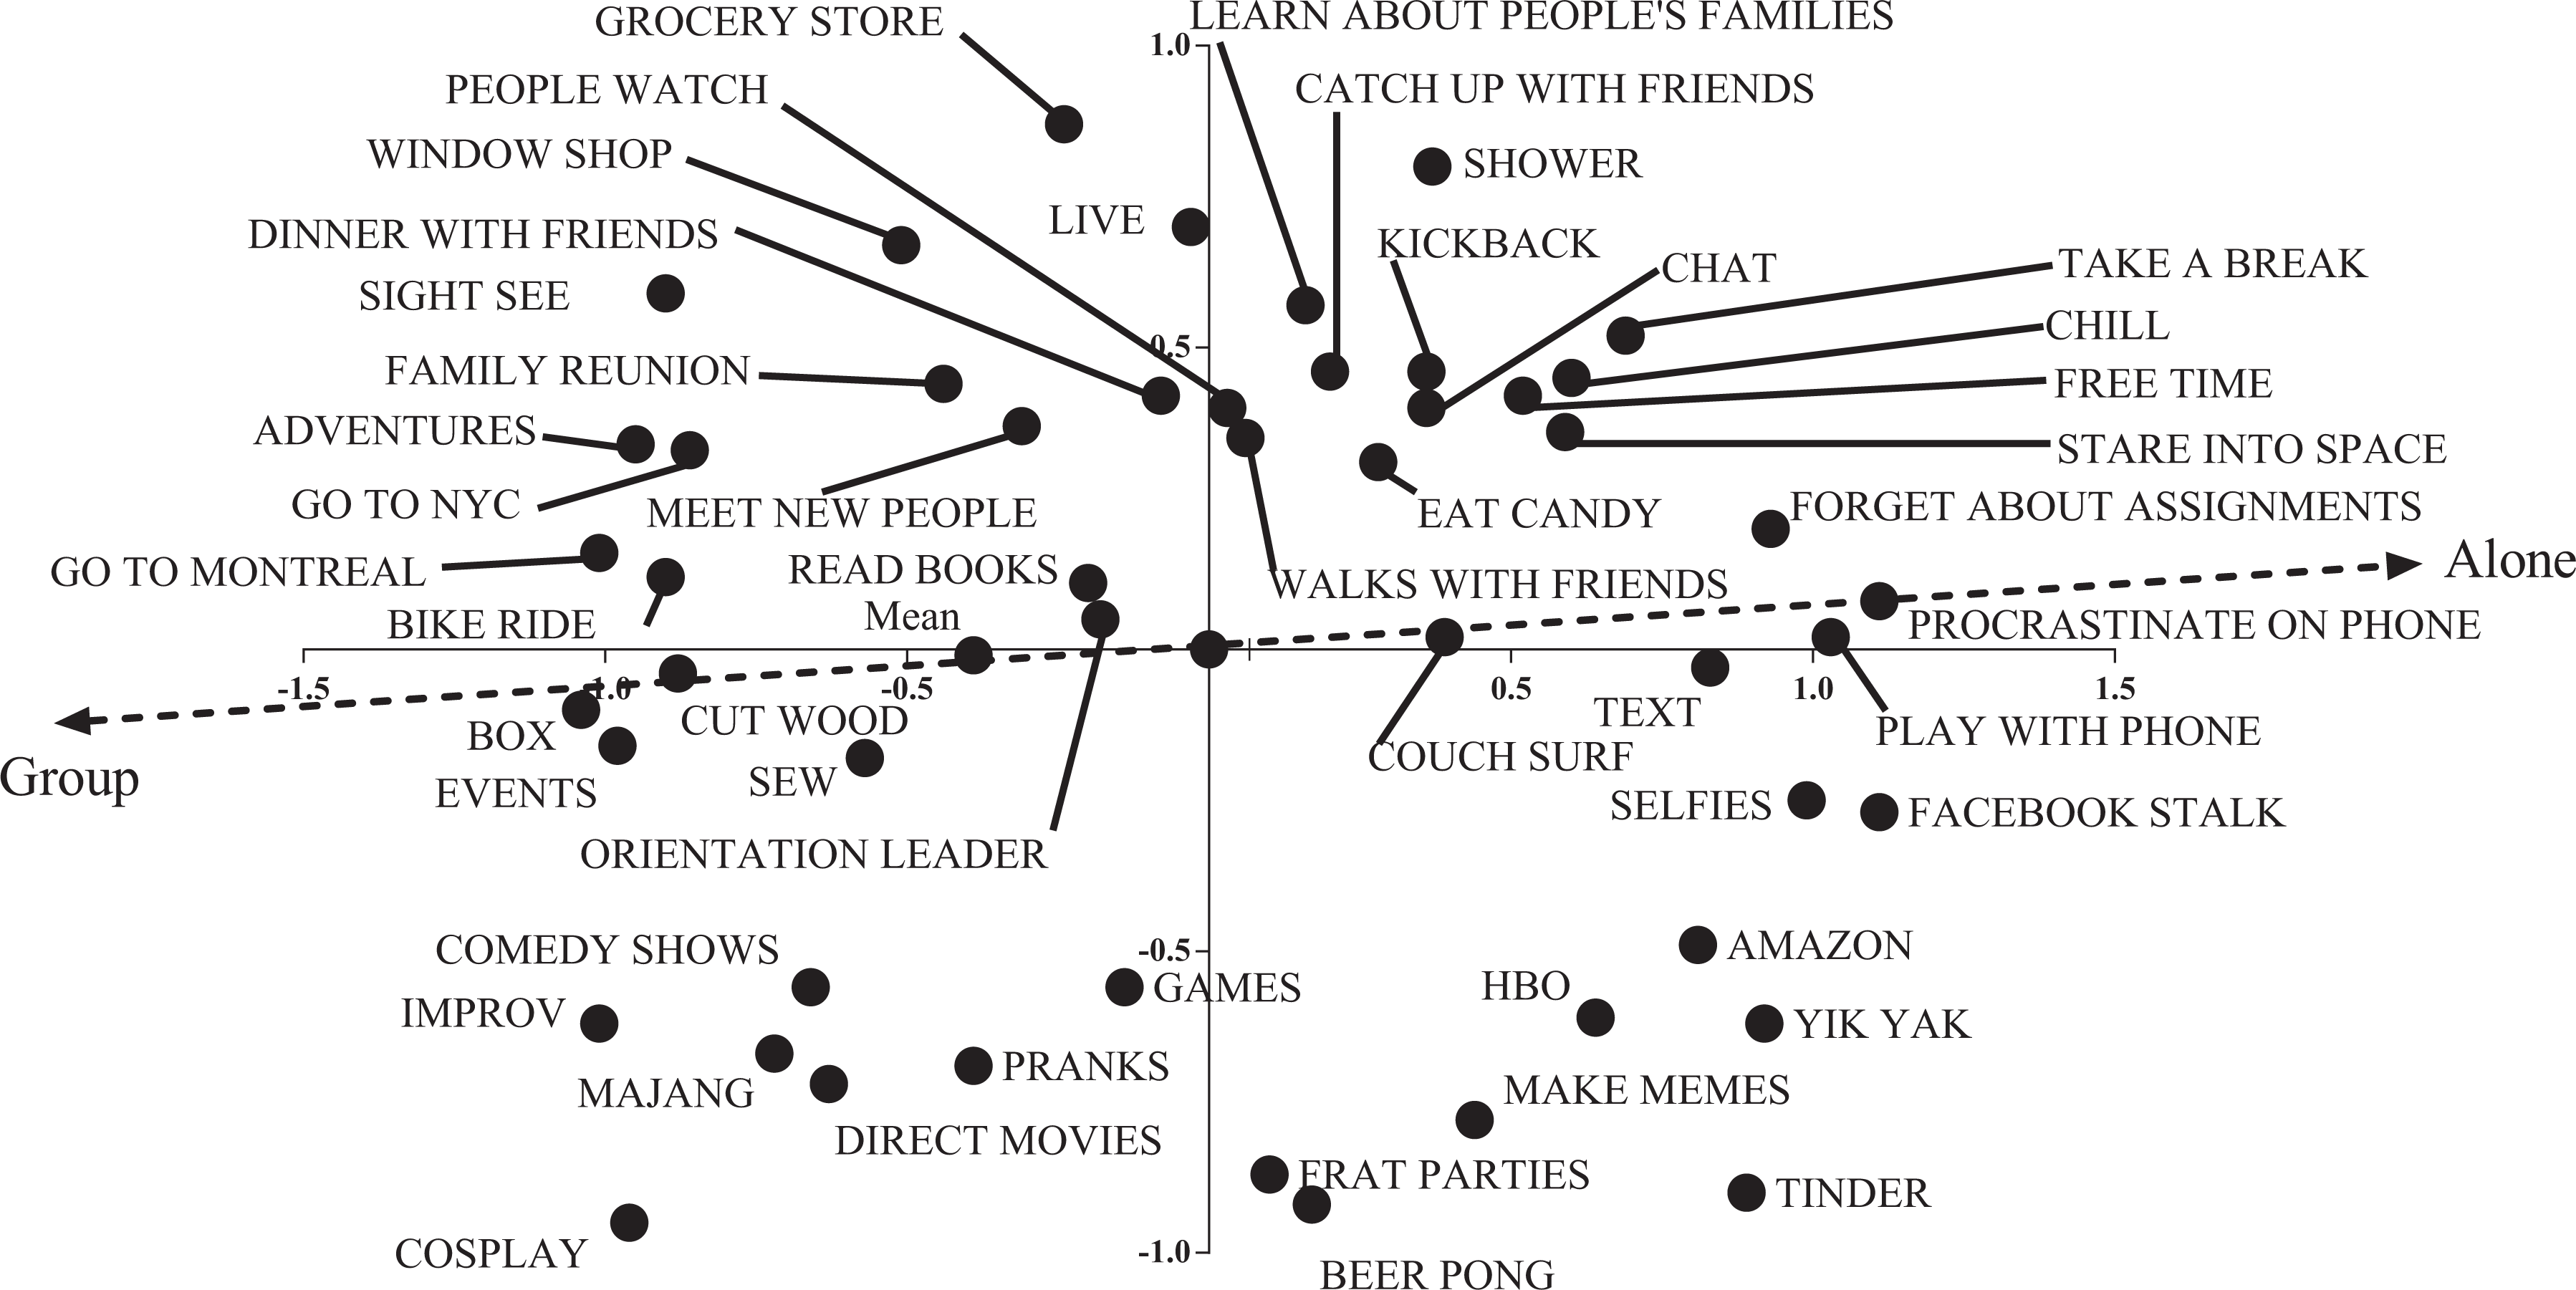
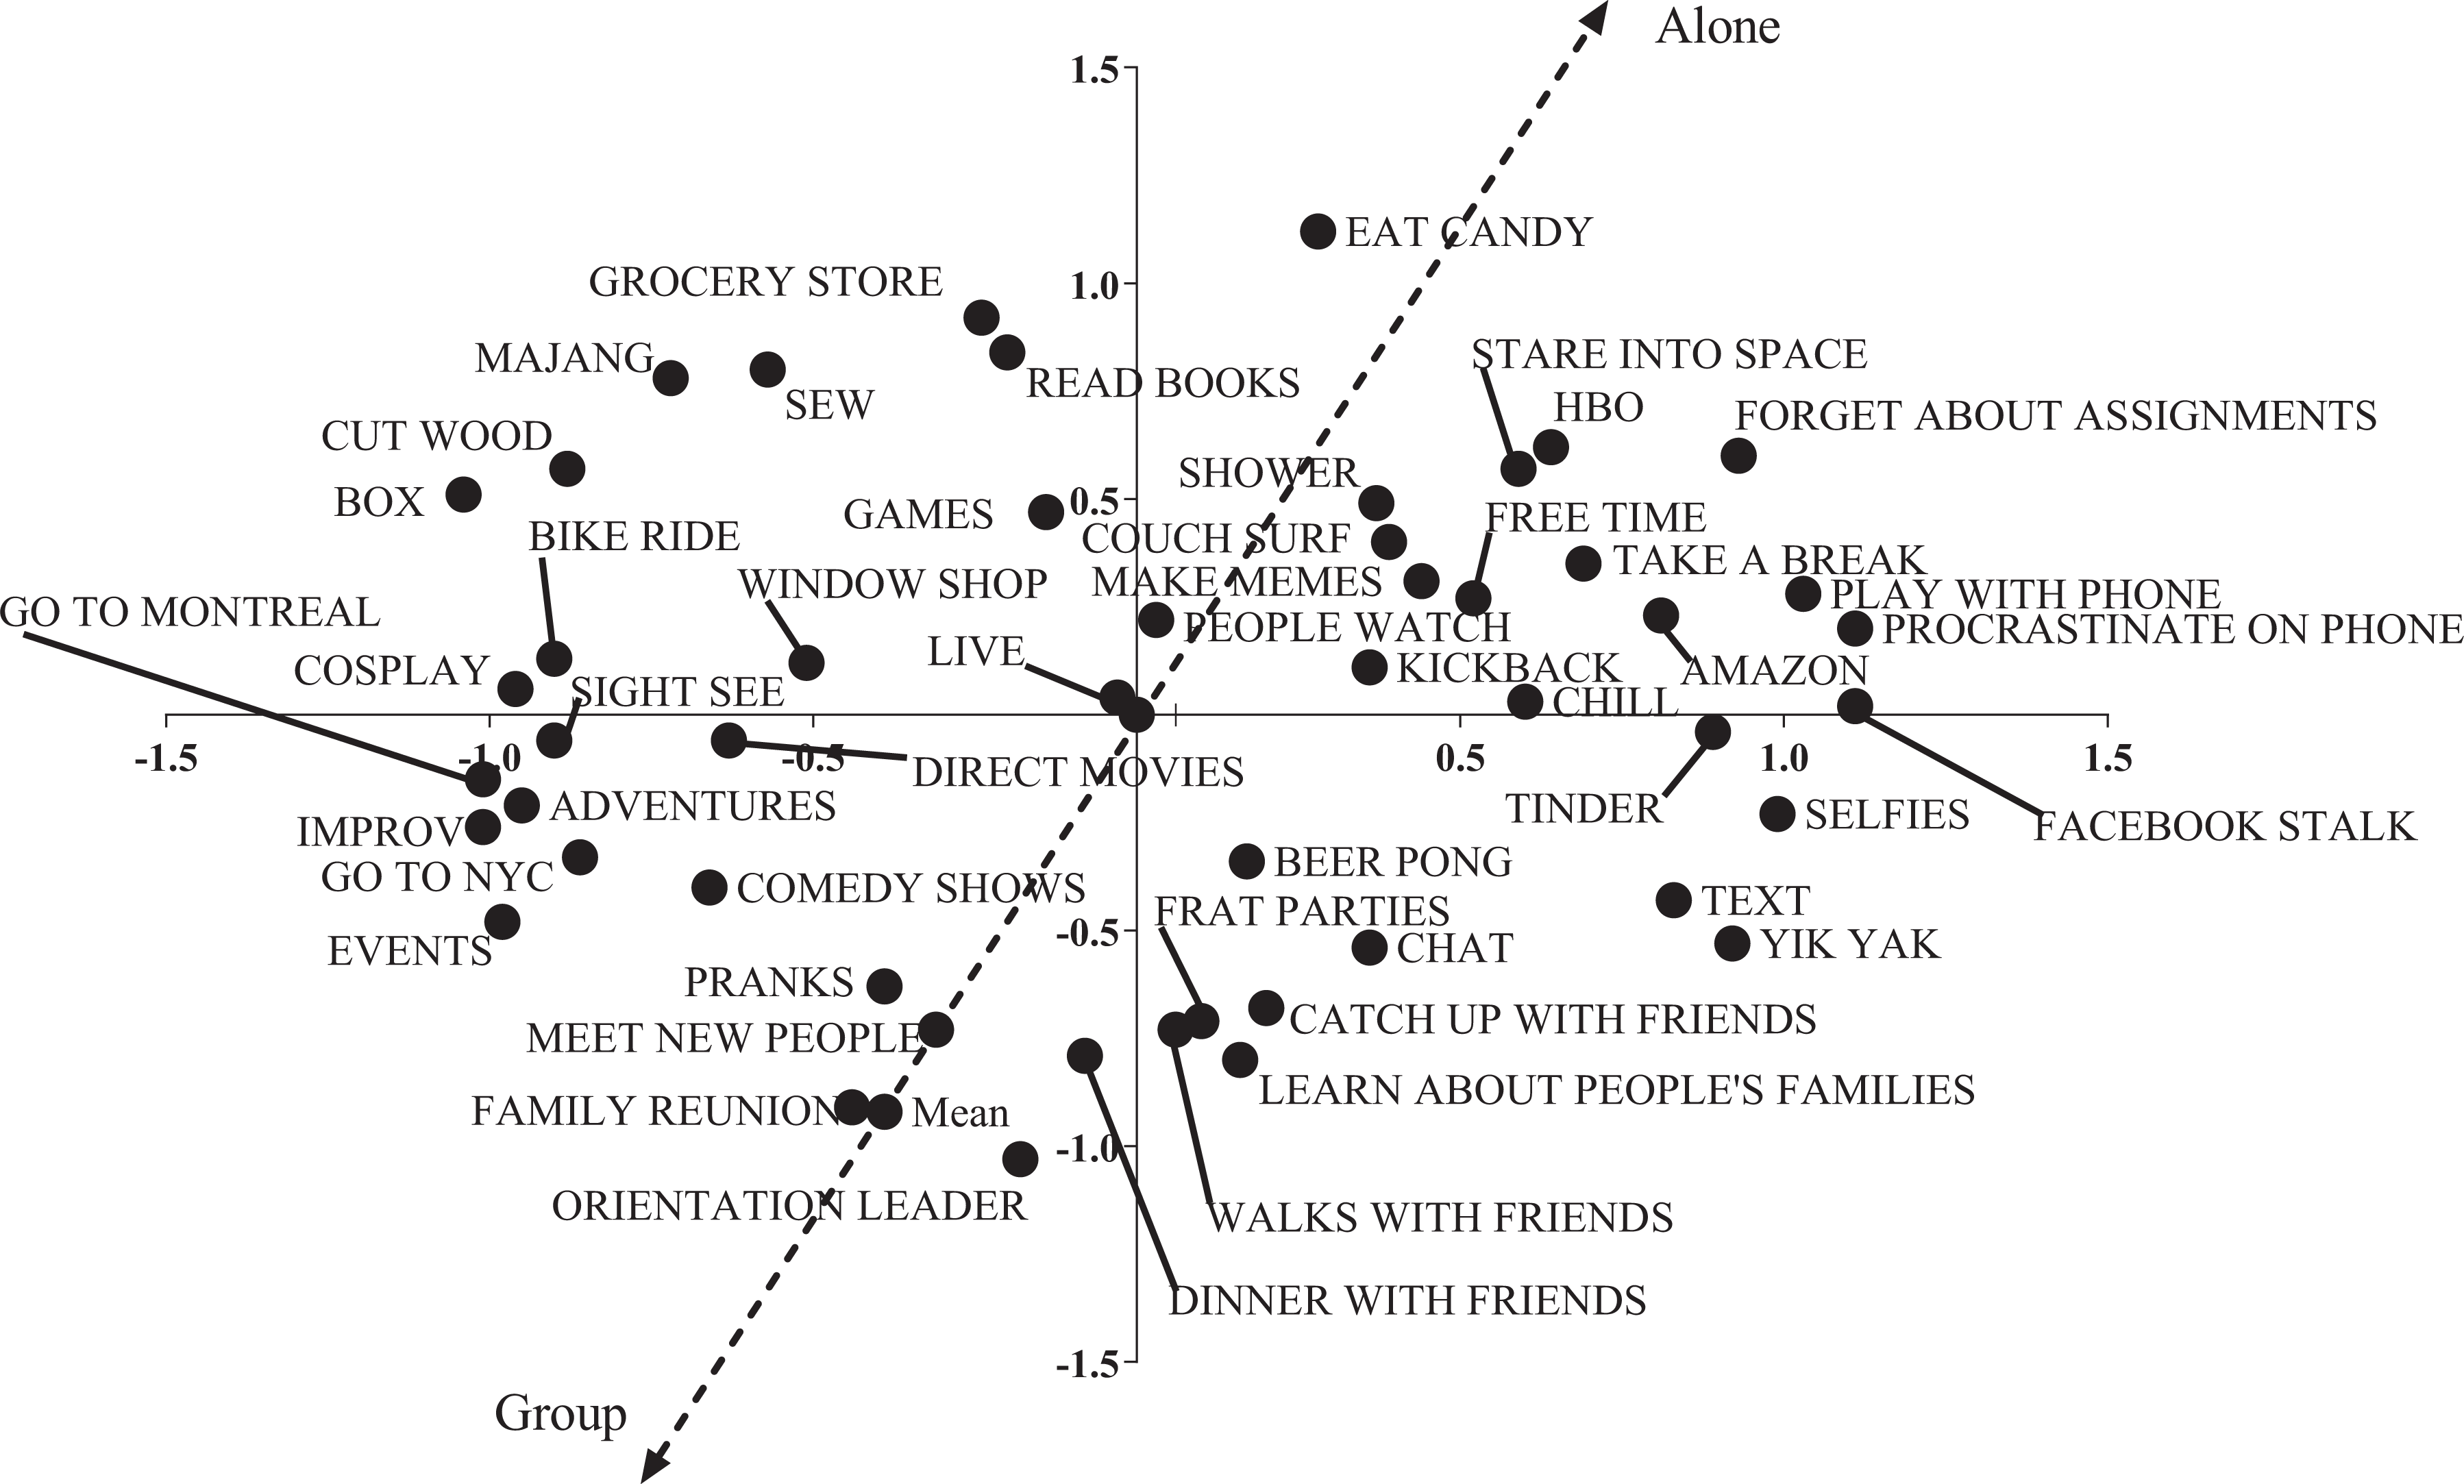
Singleton items, X Y with property fitting line.
Singleton items, Y Z with property fitting line.
There seemed to be similar clusters: in the common cluster, there was a grouping around, “party, drink, weed, drugs, hookup, and sex”; in the singleton cluster, there was a grouping around, “beer pong and parties,” both gesturing to the fratty side of college life. However, the canary term, “pranks,” was sorted in a different way. In the singleton pile sorts, “pranks” went in a cluster with, “frat parties and beer pong,” but in the common pile sort, pranks went with, “board games, hangout, and talk with friends,” not with the party pile. It should be noted too that in the singleton clustering, there was an analogous “friend” cluster, with, “learn about people, meet new people, catch up with friends, walk with friends, dinner with friends, and chat,” all clustering and with no pranks. So, though there are similar clusters forming, there may not be a straightforward relationship between where people will integrate a particular term.
In interviews about their pile sorts, most respondents mentioned the quantity of people with whom people did a particular activity and often explicitly invoked a spectrum of size. Rather than discrete categories, this suggests a clinal relationship between various terms. This led me to conduct a property fitting (PROFIT) analysis of the multidimensional scale I generated from the pile sorts.
Fifty students (25 each for the common and singleton set) rated each item on a four-point scale, suggesting whether it was done alone or in a group (see Gravlee 2005). The common PROFIT analysis produced an R2 of .686 with a p of .001, meaning that about 68% of the variance in how people are sorting things college students do for fun in the common pile is explained by whether or not they understand that activity as a solo or group activity. The singleton PROFIT analysis produced an R2 of .586 with a p of .001, suggesting that about 58% of the variance in how people are sorting the singleton pile is explained by whether or not people see the activity as a solo or joint activity. In both the common and singleton cases, respondents were using whether or not an activity was lonely or social as a criterion for sorting things that college students do for fun. Moreover, they were able to make the same type of evaluation whether or not the terms were frequently occurring or singletons.
Discussion
In this case, pile sorting with low-frequency items in a cultural domain produces a similar understanding of a cultural domain’s structure as pile sorts of items with a high frequency. This suggests that we are justified, in our general use of free lists and, in the normal course of cultural domain analysis, in discarding infrequently occurring list items. Since they point toward the same structure as high-frequency items, we don’t seem to lose much in our analysis by ignoring them. Conversely, given that we may expect people to sort low-frequency items according to the same logic as high-frequency items, there are occasions when analyzing low-frequency items could help analysts. Taboo items, overly-obvious-go-without-saying items, oddly specific items, and even new or old items should fit along the more general structure and dimensions of a given cultural domain, even if most people don’t put it in their free lists. Given all this, it may be of future benefit for anthropologists to take seriously infrequently occurring items. Though, should they like to understand how there is some direction to whether these infrequently occurring items are waxing or waning in the culture, it may require sequential free listing over time.
Footnotes
Declaration of Conflicting Interests
The author(s) declared no potential conflicts of interest with respect to the research, authorship, and/or publication of this article.
Funding
The author(s) received no financial support for the research, authorship, and/or publication of this article.