
Abstract
We investigated fluctuations of well-being by using a smartphone-based mobile experience sampling method (real-time and multiple time point measurements in the field using smartphones). Moreover, temperature, longitude, latitude, altitude, wind speed, rainfall, and further environment-based indicators were included as predictors either from smartphone sensors or from open-access Internet databases. Overall, a total of 213 participants reported on their well-being (over 14 days; three measurements per day; 8,000+ well-being judgments). We were able to replicate and refine past research about the dynamics of well-being fluctuations during the day (low in the morning, high in the evening) and over the course of a week (low just before the beginning of the week, highest near the end of the week). We also show what kind of benefits empirical researchers can gain for their research using smartphones and their built-in sensors by combining these measures with data from open-access databases.
Subjective well-being is a concept within the field of positive psychology and has accumulated a large body of research (for a review, see Diener et al. 1999). Subjective well-being (in contrast to objective well-being) refers to how well an individual feels about his or her life, as usually measured by self-assessments that encompass other concepts such as life satisfaction, positive, and negative well-being (Diener 1984). Subjective well-being itself can again be divided into a stable trait-like component and a fluctuating state-like component.
The measurement of state well-being is usually cumbersome because it requires a longitudinal design in which individuals provide ongoing self-assessments of their everyday experiences. But this so-called experience sampling method (ESM; for reviews, see Csikszentmihalyi and Larson 1987; Stone and Shiffman 1994) design has the big advantage of high ecological validity (which supports generalizability of the results) and is more accurate than retrospective self-report data (e.g., Conner et al. 2009). Several studies have utilized such methods to explore environmental effects on measures of well-being. For example, MacKerron and Mourato (2013) could show that environmental factors do influence the way we feel during our everyday life. They found that happiness is greater in marine and coastal areas compared to other types such as woodland or suburban/rural grounds. They also made use of weather data. Happiness is greater on a sunny day (compared to rain and fog) with higher outside temperatures but is reduced if the wind speed rises (for a similar study with global data, see Peng et al. 2016).
In general, ESM studies can be roughly divided into the following designs: time-contingent sampling, event-contingent sampling, interval-contingent sampling, and mixtures of these designs (e.g., Shiffman et al. 2008). With time-contingent sampling (also called signal-contingent sampling), participants are prompted by signals/beeps (i.e., sent externally or produced internally, e.g., by smartphone apps [applications] using in-app reminders) to fill in questions either at fixed times or random times, sometimes within predefined time frames. With event-contingent sampling, participants are requested to fill in questions when a certain event appears in their everyday life such as smoking a cigarette or drinking alcohol. This design is frequently used in clinical psychology (e.g., binge eating; see Haedt-Matt and Keel 2011). Interval-contingent sampling asks participants to fill in the questionnaire, after a certain interval of time has passed (e.g., to do the ratings at the end of the day and to judge not only the current situation but the whole past day). Furthermore, there are mixtures of these designs (e.g., event-contingent sampling can be used to find out at what time participants are smoking and what their well-being is, in combination with a time-contingent sampling to know their well-being when not smoking; for an overview, see Shiffman et al. 2008).
The field of ESM has been experiencing a boost in the last couple of years (see Davidson et al. 2017; Hamaker and Wichers 2017). The development is in part driven by the possibility to realize ESM designs via smartphones and/or wearables (mobile ESM; e.g., Dufau et al. 2011; Harari et al. 2016; Miller 2012). Smartphones greatly reduce the burden of implementing ESM designs. Most participants already own a smartphone; electronic questionnaires can be transmitted easily by using smartphone apps; the administration of the study can be easily achieved due to the fully Internet-based workflow of the study itself (e.g., no printed paper–pencil questionnaires, central storage of data on a web server); and the time accuracy of measurements can be controlled for by assessing time stamps (see Stone et al. 2002). Further, smartphones have many built-in sensors, which can also be used for scientific research (e.g., GPS, gyroscope, accelerometer, temperature sensors; Dufau et al. 2011; Miller 2012). For example, within the field of environmental psychology, MacKerron and Mourato (2013) used the GPS sensor to assess happiness in natural environments. Additional studies used the Bluetooth sensor to measure the Bluetooth device density as a proxy for the number of people nearby (Do and Gatica-Perez 2014) or used the smartphone’s microphone as an emotion recognition device (Rachuri et al. 2010). To sum up, sensor data from smartphones seem to successfully complement classical data collections of self-assessed questionnaires.
Although sensor data are increasingly used for scientific research, little is known about their accuracy of measurement (for exceptions on GPS, see Wolf et al. 2013). A recent study by Stisen and colleagues (2015) found a large heterogeneity between 13 different mobile device models (i.e., smartphones, smartwatches, tablets) from four different manufacturers regarding their accelerometer sensors’ accuracy. Even when the devices were not moving, the authors found a deviation of 8% between devices (which represents a difference between standing still and the acceleration of a fast train). Therefore, it seems important to also analyze smartphone sensors’ accuracy.
In the present study, we continue this line of research by using the GPS sensor and analyzing its accuracy. We present data from a smartphone app project, in which we apply an ESM design. We assess subjective well-being three times a day for two weeks. Additionally, we assess the longitude and latitude of the smartphone position using the GPS sensor.
We address the following research questions: How reliably can the GPS sensor of smartphones be used for behavioral research? We investigate this question by comparing the GPS data (altitude) from the smartphone sensor with data from Google Maps. It has been frequently found that well-being and happiness fluctuate during the day (low in the morning, high in the evening) and week. Akay and Martinsson (2009) proposed a “blue Sunday” effect. They found that well-being is lowest on Sunday compared to the other days of the week. Other studies found different effects such as lowest scores on Monday and/or Tuesday (e.g., Csikszentmihalyi and Hunter 2003; Larsen and Kasimatis 1990) or Wednesday (Mihalcea and Liu 2006) by using diverse approaches (e.g., ESM, panel data, linguistic–ethnographic approach). Interestingly, it seems that both effects—day and week effects—have never been analyzed in conjunction.
Therefore, we ask: To what extent is subjective well-being influenced by environmental conditions and by time (i.e., time of the day, day of the week)? We answer the question using data from the smartphone’s GPS module and data from open-source databases (e.g., weather, altitude).
Method
Participants
The sample was recruited by word of mouth from a community in southern Germany through friends, relatives, and friends of friends of several research assistants following a convenience sampling approach and resulted in a sample size of N = 213 (39% men, 58% women, 3% undisclosed). Reported participant age ranged from 16 to 59 years (M = 24.5, SD = 8.4).
Smartphone App
A smartphone app called Well-being Science App was designed for this project and made freely available through the Google App Store. Participants could download the app directly onto their smartphones anonymously. Back-end server software was programmed to handle the communication with the app (i.e., provide participants with personal statistical charts; e.g., overall well-being score; weekly statistic) and store the data.
After installation and prior to the study’s start, participants had to provide informed consent and were asked basic demographics (age, sex, and country of origin). Additionally, participants were asked to state their general well-being (“How is your well-being in general?”) again using a visual slider scale (0–100). The first three screens up to here were only presented once, during the first administration. After this initial stage, the main screen appeared showing the item asking for the present well-being using a visual slider scale. This measurement constituted the longitudinal part of the study. On the main screen, participants had the possibility to request personal statistics in a graphic format (for screenshots as well as additional analysis, see Online Supplement).
Further, the app assessed the geolocation by either using the GPS module or, if an exact position was not ascertainable (e.g., in buildings), the known positions of GSM cellphone towers the smartphone was signed into. Participants were instructed through informed consent that GPS position was being assessed.
Measures
Subjective well-being is usually assessed by measuring satisfaction with life, positive, and negative affect (Diener 1984). In experience sampling approaches, participants have to fill in questions several times a day. To reduce participants’ burden and to maintain a high motivation to participate during the data collection phase, we decided to measure subjective well-being only on a global level by using a single item (for similar reasoning, see Diener et al. 2009; Killingsworth and Gilbert 2010). Subjective well-being was assessed by asking “how is your current well-being?” Respondents answered on a visual slider scale ranging from 0 to 100. The slider scale was chosen because it is more intuitive and easier to use with small screens than scales using discrete options (e.g., Funke and Reips 2012). A posttest questionnaire was designed to assess further psychological concepts.
Procedure
During the recruitment process, participants were asked to agree to an informed consent and had to state their e-mail address (to get in contact with them) and mobile phone number (to send them the signals). Then participants were sent an e-mail with additional information and the link to the app store to install the app. After successful installation of the Well-being Science App from the app store, participants actively responded to the well-being question via the smartphone app, while in their natural surroundings. During the installation process, the app created an anonymous participants code, which was the only personally connecting information stored with the data. This procedure not only ensured anonymity for participants (i.e., it was not possible to connect questionnaire data with the data provided in the consent form) but also made it possible to connect the data from the longitudinal part with the data from the final posttest online questionnaire (see below).
To remind participants to do their ratings, we sent signals three times a day for a period of two weeks using short text messages via phone service or WhatsApp. Participants were instructed to fill in the questions as soon as possible. Signals were sent out at random times within three time frames (morning: 8:00–9:30 a.m., noon: 12:00–4:00 p.m., and evening: 7:00–11:00 p.m.). Participants had no time restrictions in reacting to the signal and filling the questionnaire. After completion of the longitudinal part of the study, an Internet-based posttest questionnaire was administered. Participation was remunerated by optional entry to a raffle (Amazon gift card of 20€). The entire study was run in German.
Results and Discussion
Number of ratings per participant ranged from 3 to 55 (M = 38.4) and 87.3% of signals resulted in a valid response (i.e., participants filled in the questionnaire). The mean well-being score of the well-being item in the longitudinal part was 69.2 (SD = 21.9). All in all, participants produced 8,474 data points. In 3,599 (42.5%) cases, a geolocation could be determined (longitude, latitude), and in 947 (10.8%) cases, an altitude could be determined (for a geographical overview, see Figure S1 in the Online Supplement). In 979 cases, the geolocation was established directly through the GPS module, and in 2,620 cases, this was only possible through the network (e.g., triangulation of wireless local area network spots). The accuracy of geolocation measurement strongly depended on the method used, GPS versus network. The accuracy of the GPS module was on average 38.3 m (median = 24.0 m) and for the network determination the mean was 570.9 m (median = 46.6 m).
Research Question 1: How Reliably Can the Sensors of Smartphones Be Used for Behavioral Research?
The correlation between smartphone GPS measurement of altitudes and Google Maps measurement of altitudes was high, r(946) = .975, p < .001. The intraclass coefficient (ICC; two-way mixed-effects model with absolute-agreement definition) was lower than 1, with a value of .936 (confidence interval: .349, .980), which suggests that there is a mean difference between both measures. Indeed, calculating a dependent t-test, we found a significant difference of small-to-medium effect size, t(945) = 40.77, p < .001, d = .30, mean difference = 52.2 m. So where does this difference come from?
Google Maps is using many different providers to get very accurate altitude measures (see https://groups.google.com/forum/#!topic/google-maps-js-api-v3/KcjkS-U36dE). If there is no altitude for a certain geolocation, Google is interpolating between the nearest altitude measures. The Google API additionally provides a resolution value for each request, which states the maximum distance between the data points that were used for interpolation (see https://developers.google.com/maps/documentation/elevation/intro). In the present study, the resolution of the requested altitude measures from the Google Elevation API was 93.8 m (SD = 68.31, median = 152.7), which is very accurate when we consider that this value represents the maximum distance between the measures of heights (i.e., some of the points were probably closer to each other).
On the other hand, smartphones can only calculate altitudes when the GPS module is used (and not the network triangulation) and a contact has been established to at least four satellites. Furthermore, GPS modules use multiple models of the Earth (so-called datums). One of the most frequently used models is the World Geodetic System, which was established in 1984 (WGS84). This model defines the Earth as a perfect ellipsoid. Usually, this is a very good approximation, but the Earth is not a perfect ellipsoid—that is, the real Earth ellipsoid has humps and bumps (−100 m up to +70 m; see http://www.xcmag.com/2011/07/gps-versus-barometric-altitude-the-definitive-answer/). In fact, Europe is on average about +50 m above the theoretical (WGS84) model used by most GPS modules of smartphones. This is almost exactly what we found in our data (52.2 m) and speaks for the accuracy of data derived from the smartphones’ GPS modules. To sum up, GPS sensors of smartphones cannot only give reliable and valid measures of longitude and latitude (e.g., Wolf et al. 2013), they also can provide valid measures of altitude, but one should keep in mind that smartphone GPS sensors use theoretical models, which assume that the earth is a perfect ellipsoid. Referring to research question 1, this does not influence the results because analyses were correlational. Nevertheless, if mean differences are the focus of an investigation (especially across large areas of world), using altitude measures from smartphone GPS sensors could produce biases.
Research Question 2: To What Extent Is Subjective Well-being Influenced by Environmental Condition and Time Conditions?
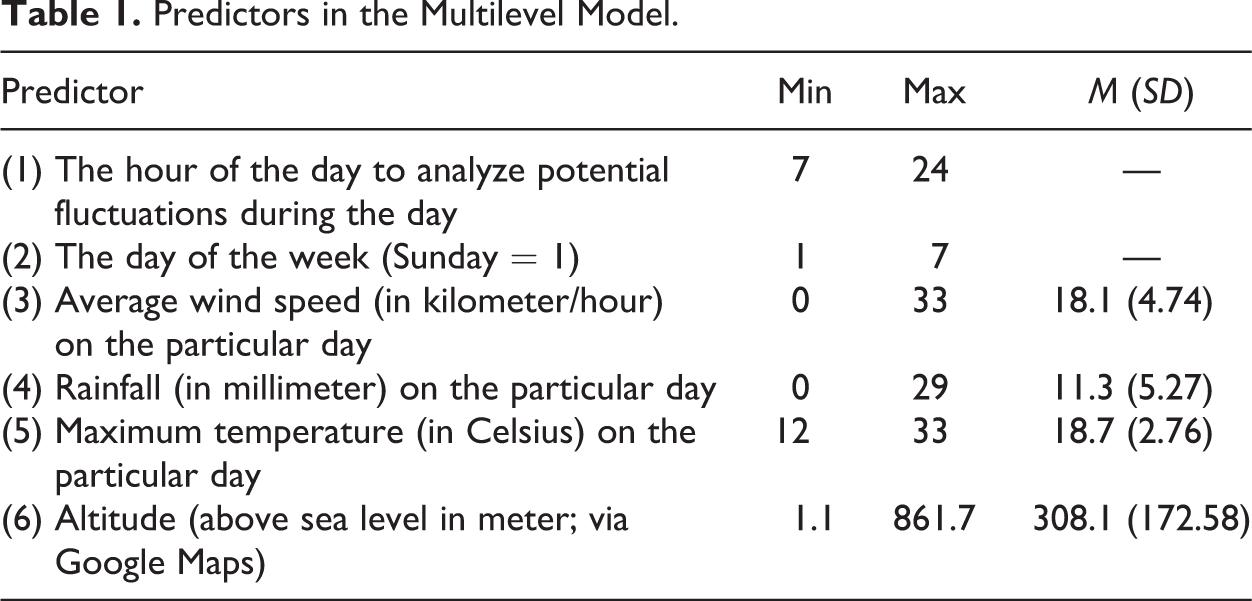
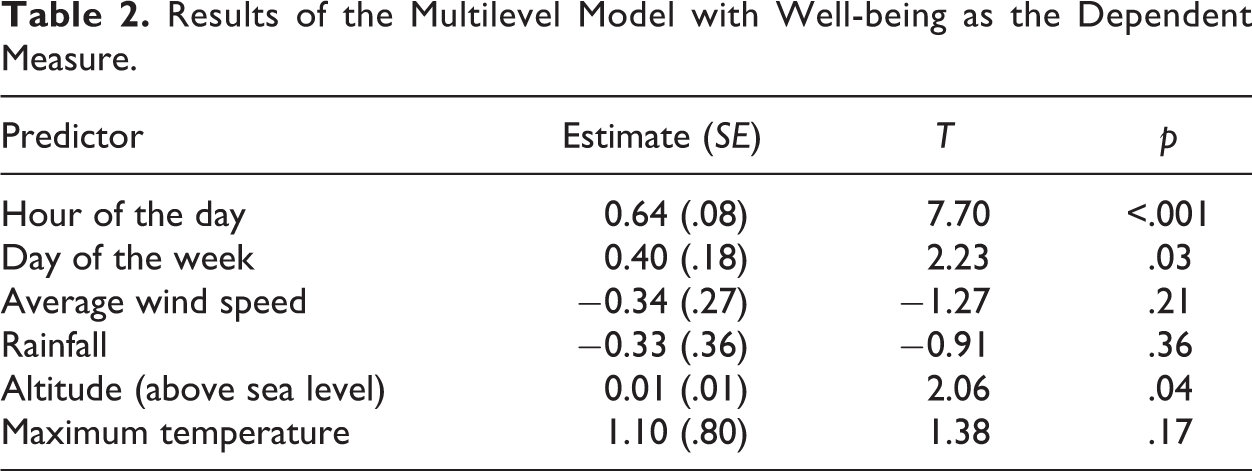
We calculated a random intercept—random slope model with the user’s participant number as the grouping (i.e., level 2) variable and the well-being score as the dependent measure (i.e., level 1 variable; see Online Supplement for more details about the statistical analyses, for descriptives; see Table 1). The ICC was 28.87%, which indicates that a little more than one-fourth of the total variance in well-being can be explained by between person differences. Hour of the day and the day of the week were the strongest predictors. The altitude also had some effect on participants’ well-being (see Table 2).
Predictors in the Multilevel Model.
Results of the Multilevel Model with Well-being as the Dependent Measure.
As can be seen in Figure 1 (upper panel), during the day, well-being begins at a lower than average level and constantly increases during the day, reaching its highest level at evening/night (r
sp = .161). Looking at the days of the week, well-being is lower than average on Sunday through Wednesday, but it is higher than average on the remaining days of the week (Thursday to Saturday; see Figure 1, lower panel; r
sp = .053). Although past research also found day-of-the-week effects (Akay and Martinsson 2009; Helliwell and Wang 2014; Taylor 2006), the current design is more fine grained in using a longitudinal design with three measurements per participant for each day of the week. Akay and Martinsson (2009) proposed a blue Sunday effect. The present data show that not the whole Sunday is “blue” (see Figure 1, upper panel). Ratings in the morning and noon follow the same pattern as on all the other days (morning lowest and constantly rising until evening). Only the mean rating on Sunday evening is significantly lower than on all the other weekdays’ evenings, M
Sunday, evening = 0.31, M
rest, evening = 4.53; F(6, 2876) = 3.19, p = .004,
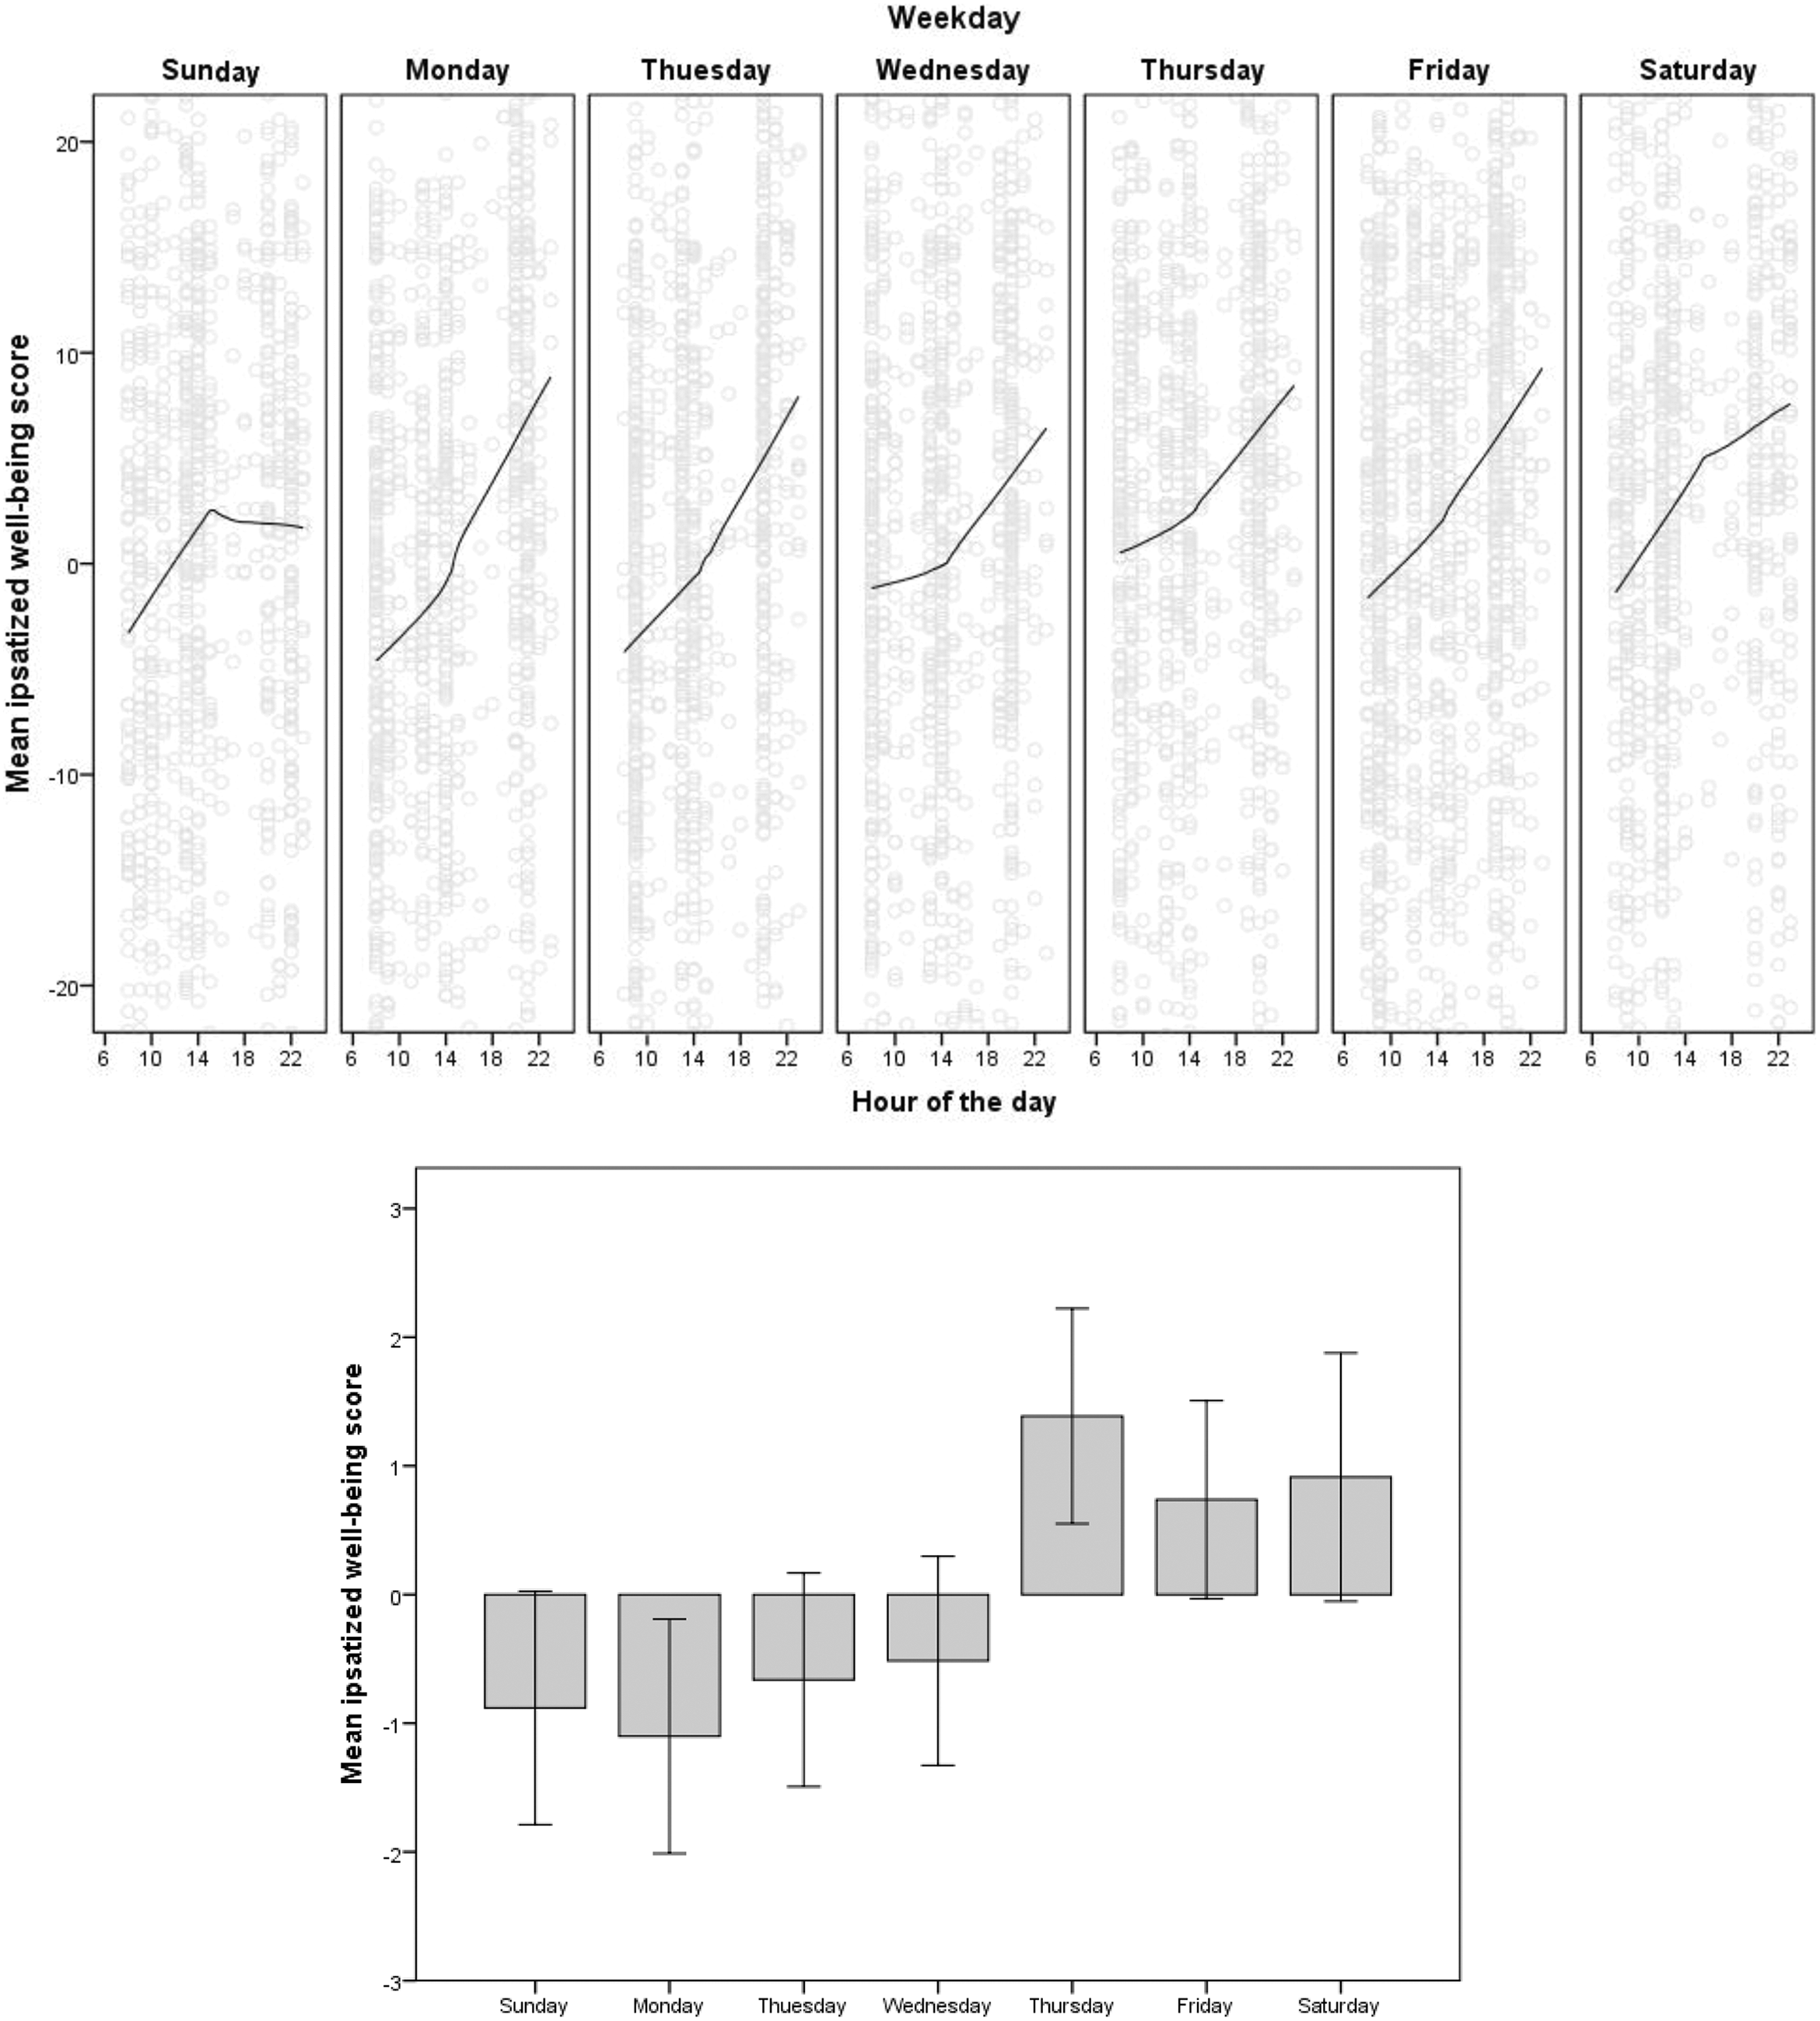
Well-being during the day per weekday (upper panel) and during the week (mean level; lower panel). For visualization purposes, we also ipsatized the well-being scores to better show lower-than-average and higher-than-average effects.
Altitude had an effect on participants’ well-being. Some previous research also found higher well-being (operationalized as happiness) for participants in higher geographical areas, but these results were found on a global cross-cultural level that lacked exact geolocations of participants (e.g., Peng et al. [2016] used geolocations of cities where data collection took place). To analyze altitude effects in more detail, we plotted the well-being score to the ipsatized altitude score (see Figure 2). An ipsatized altitude score of zero means that this is the altitude a participant usually resides at during his or her everyday life (e.g., altitude of a participant’s home and/or work place). To account for a possible nonlinear effect, we added a loess line (Epanechnikov kernel density function 99%).
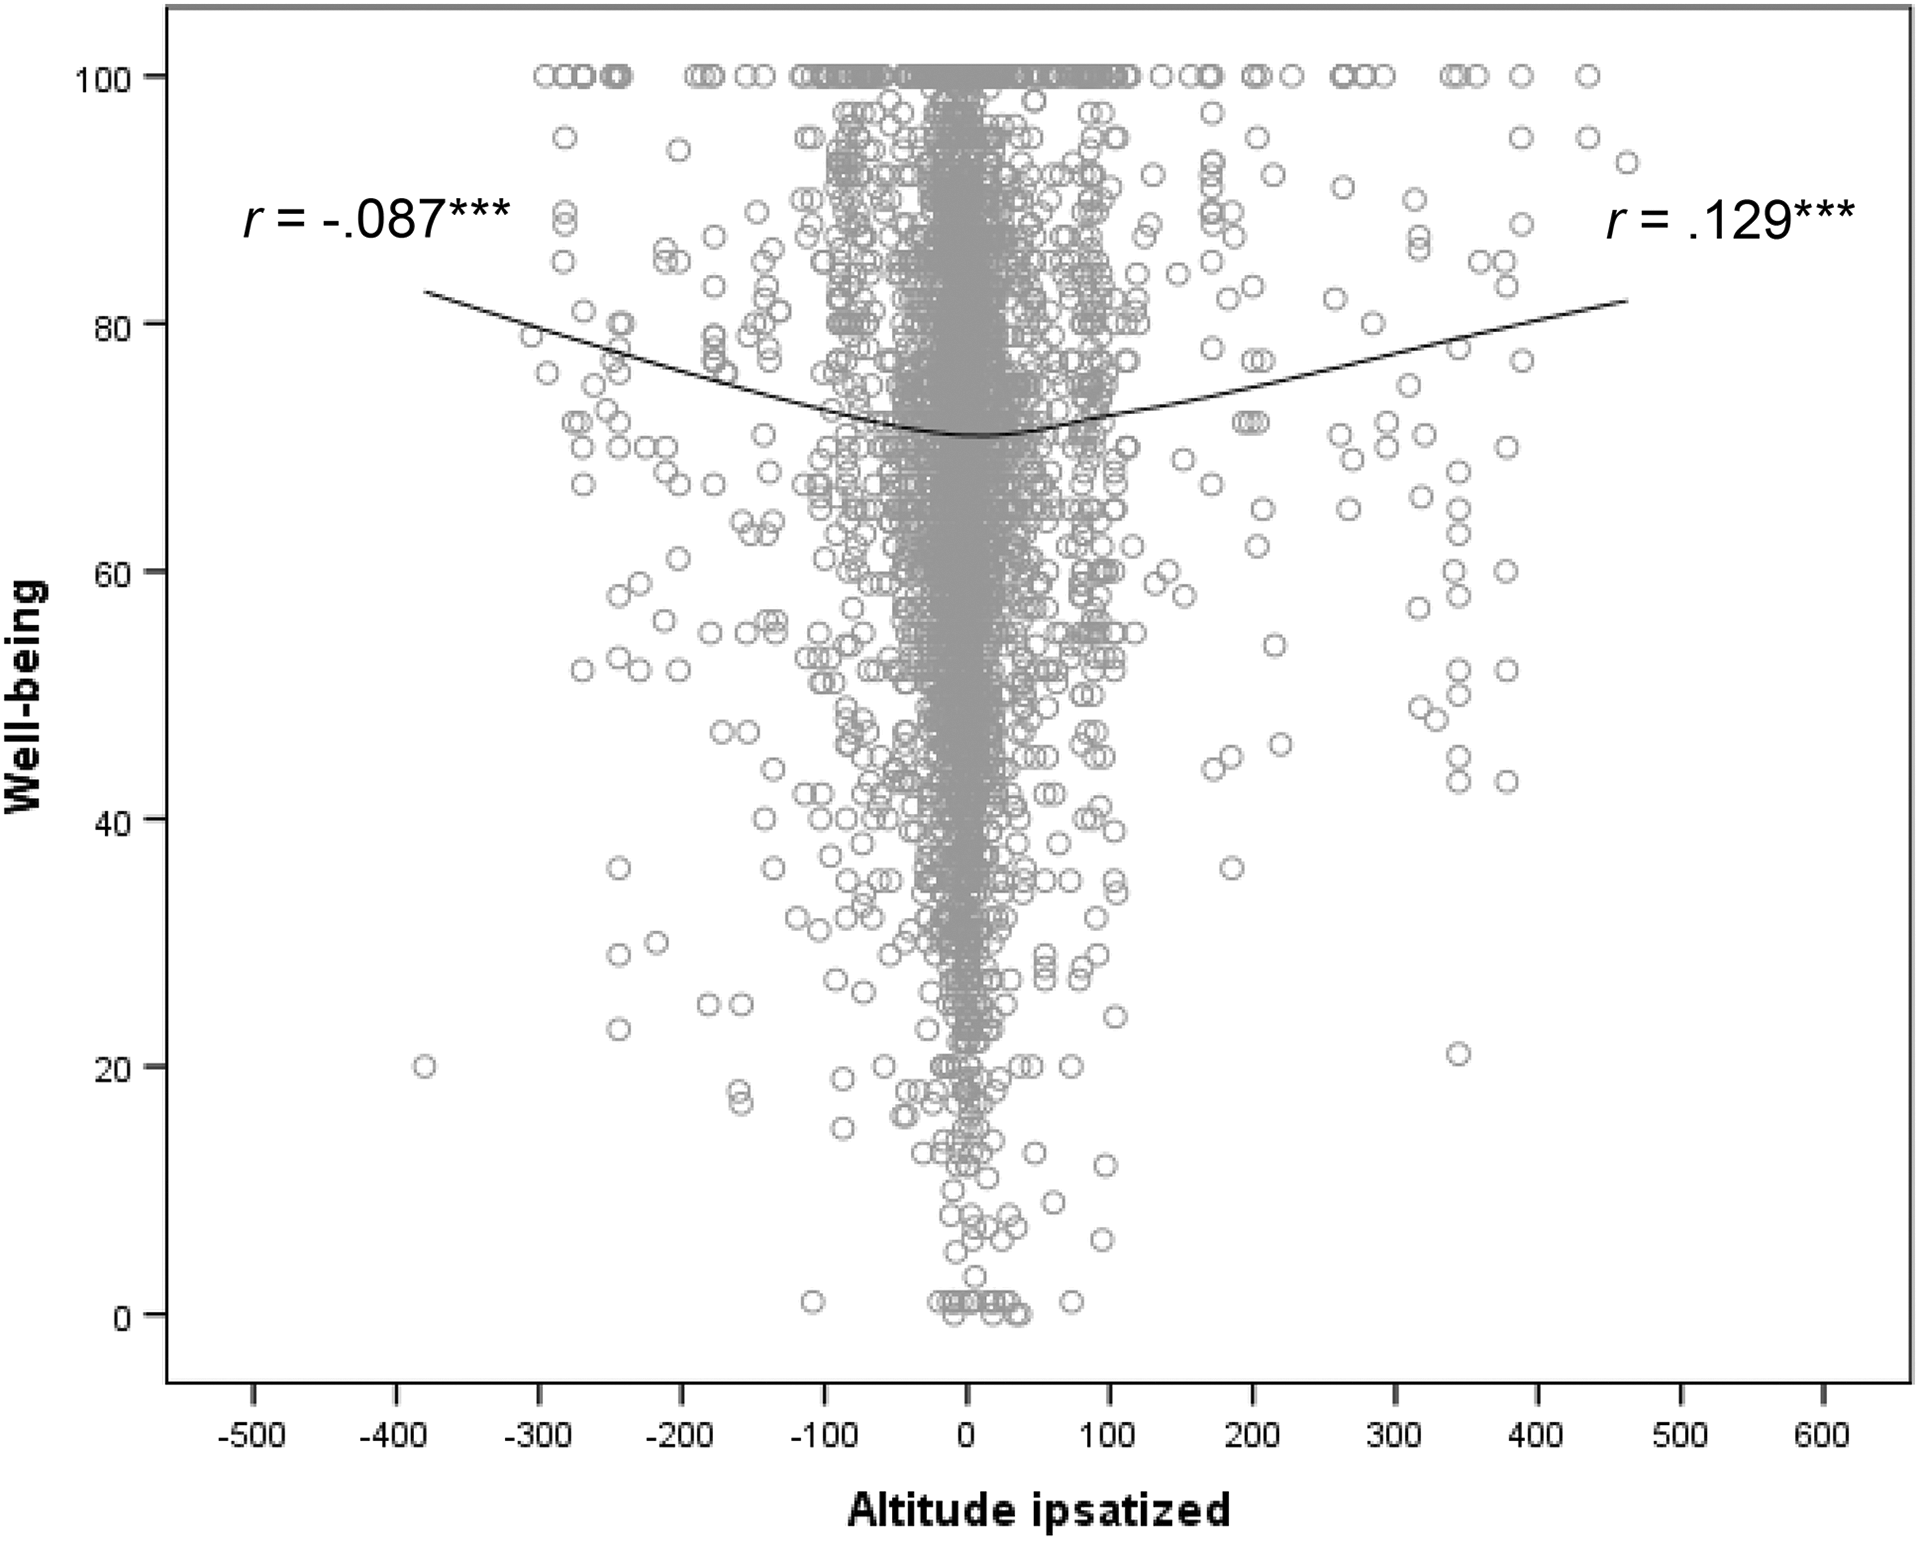
The correlation between well-being and altitude (ipsatized).
As can be seen from Figure 2, the more the altitude deviates from zero (place of everyday life), the higher the well-being, no matter if the participant is on a higher or lower altitude. This effect remains (but is slightly reduced) for the ipsatized longitude and latitude, that is, the more a participant’s current place (i.e., longitude, latitude) deviates from the place of everyday life, the higher is well-being (|r|s = .049–.089, all ps < .05). Well-being depending on altitude has never been investigated as fine-grained as in the present study, except for some studies analyzing well-being in high altitudes as part of extreme habitats (e.g., Suedfeld and Steel 2000) or using global cross-cultural data (Peng et al. 2016). One possible explanation for the observed effect could be that often when the altitude (and also longitude and latitude) deviates from the everyday life place, participants may be in a place of recreation and may be enjoying leisure time, so their well-being is enhanced by the occasion and not by altitude. This rationale is underlined by a study by Frank and colleagues (2013), who analyzed 37 million geotagged tweets. They also found that happiness (assessed via a sentiment analysis known as the hedonometer) increased with distance from an individual’s average location. More research is needed to investigate underlying causes of this effect.
To sum up, time variables (hour of the day, day of the week) had a much higher influence on well-being than environmental variables (e.g., weather conditions). This is in line with MacKerron and Mourato (2013), who also found on average a lower impact of natural environment (e.g., weather, land cover type) compared with, for example, self-selected activities (e.g., sports, gardening, walking) or companionship (e.g., friends, family, partner). Furthermore, we could show that well-being is enhanced when participant’s current place (i.e., longitude, latitude, altitude) deviates from the place of everyday life.
Limitations
Although smartphones come with many advantages, there are, of course, also limitations. Smartphone apps need to be programmed. Because we used only smartphones with an Android operating system, our results can basically not be generalized to participants owning a smartphone with a different operating system. Presently, three major systems are prevalent—Google’s Android, Apple’s iPhone, and Windows Phones. These systems are basically not compatible with each other (i.e., apps have to be developed separately). This might introduce not only a bias because of certain people preferring certain operating systems (but see Götz et al. 2017) but also because certain devices having different biases when communicating with their sensors (e.g., Stisen et al. 2015).
In the future, there might be a reintroduction of web-based (i.e., cross-platform) solutions (e.g., following the World Wide Web consortium’s efforts toward the open web) to circumvent this extra burden. Within the philosophy of web services, there is hope for cross-platform solutions such as HTML5 and JavaScript, but currently the development of apps for smartphones needs strong programming skills of proprietary languages. Therefore, research would greatly profit from future studies that systematically compare data collected via different devices.
Our results are also limited by the fact that we did not use a response window (i.e., participants have to respond to the signal within a predefined time window, e.g., five minutes). Although we think that both procedures (i.e., with and without a response window) have their advantages and disadvantages, using a response window might have produced slightly different results because of a lower influence from a possible recall bias.
Conclusion
In the present study, we could successfully replicate past research about well-being fluctuations over time (e.g., Akay and Martinsson 2009). We not only presented results about well-being from a longitudinal ESM design, we also analyzed the GPS sensors’ accuracy regarding altitude by comparing the results with data from external databases finding that GPS sensors used by smartphones do produce valid assessments of altitude.
We also showed what kind of benefits empirical researchers could gain for their research from using smartphones with built-in sensors. Programming smartphone apps for science is becoming an easy task; systems for easy app design are beginning to appear. ESM studies can be conducted very easily and on a relatively low budget. On top of built-in sensors, several external sensors are available, which can be easily connected to smartphones using Bluetooth technology (e.g., sensors for gas, humidity, color, pressure, proximity). In general, the trend of implementing further sensors is unbroken. Examples include gesture sensors, which can recognize gestures from arms, hands, head, and face (Oh et al. 2013). New photonics developments make it possible to embed sensors in the glass display to easily perform biomedical tasks such as assessing blood sugar levels or taking body temperatures (Lapointe et al. 2014). New sensors are quickly adopted by app developers, and smartphone users seem to largely embrace the new options as well. All in all, future smartphones will be part of our daily lives, making them especially interesting for empirical sciences like psychology.
Supplemental Material
Supplemental Material, steiger.reips.online_supplement.rev - Well-being, Smartphone Sensors, and Data from Open-access Databases: A Mobile Experience Sampling Study
Supplemental Material, steiger.reips.online_supplement.rev for Well-being, Smartphone Sensors, and Data from Open-access Databases: A Mobile Experience Sampling Study by Stefan Stieger and Ulf-Dietrich Reips in Field Methods
Footnotes
Declaration of Conflicting Interests
The author(s) declared no potential conflicts of interest with respect to the research, authorship, and/or publication of this article.
Funding
The author(s) received no financial support for the research, authorship, and/or publication of this article.
Supplemental Material
Supplemental material for this article is available online.
References
Supplementary Material
Please find the following supplemental material available below.
For Open Access articles published under a Creative Commons License, all supplemental material carries the same license as the article it is associated with.
For non-Open Access articles published, all supplemental material carries a non-exclusive license, and permission requests for re-use of supplemental material or any part of supplemental material shall be sent directly to the copyright owner as specified in the copyright notice associated with the article.