
Abstract
The proportion of web survey responses submitted from mobile devices such as smartphones is increasing steadily. This trend presents new methodological challenges because mobile responses are often associated with increased breakoffs, which, in turn, can increase nonresponse bias. Using data from a survey of college students with more than 20,000 respondents, response patterns are examined to identify which days and times the survey invitation and reminder emails were most likely to produce nonmobile responses. The findings provide guidance on the optimal timing for recruiting college student sample members via email to reduce their likelihood of responding from a mobile device, and potentially, breaking off.
Background
The proportion of survey responses submitted via mobile devices, such as smartphones or tablets, has risen in recent years. For instance, the National Survey of Student Engagement (NSSE) found mobile response grew rapidly from 4% in 2011 to 27% in 2015 (Sarraf et al. 2015) and continued growing to 50% in 2019 (Sarraf, pers. comm., April 15, 2020). Across other surveys, researchers report as many as 30% of web responses are now mobile (Peterson et al. 2017). This is noteworthy because numerous studies have found higher breakoff rates among mobile respondents (Antoun 2015; Mavletova 2013; Mavletova and Couper 2013; Sommer et al. 2016), even on mobile-optimized surveys (Wells et al. 2014). A meta-analysis by Mavletova and Couper (2015) found the average breakoff rate across 14 studies was 2.8 times higher when the survey was accessed on a mobile device compared to a PC. Further, the odds of mobile respondents breaking off were lower in surveys that were mobile optimized, used email (vs. SMS) invitations, sent more reminders, and were shorter, while the odds of mobile breakoffs were higher in surveys with complex designs (e.g., grids, slider bars). These findings emphasize the importance of mobile optimization and data collection designs that can minimize breakoffs.
Researchers seek to minimize breakoffs for multiple reasons. Breakoffs result in less data being collected about individual respondents, which reduces the sample size and statistical power, limiting analysis potential. Additionally, the risk of nonresponse bias increases if breakoffs are systematic (Peytchev 2011). That is, nonresponse bias is likelier if those breaking off differ from other respondents on variables of interest, as they sometimes do (Peytchev 2009). This is probable with mobile breakoffs since certain types of individuals may choose to participate via mobile device (Peterson et al. 2017).
This raises the question of whether additional survey design and data collection decisions could be made to decrease mobile breakoff rates. One option is to block participation via mobile devices. However, this can discourage responding altogether and negatively impact response rates (Buskirk and Andrus 2012), while also affecting coverage due to demographic differences in mobile preference and nonmobile web access (Couper et al. 2017; Peterson et al. 2017). Another approach is to allow, but discourage, mobile response by telling sample members the survey would be easiest to complete on a PC, but Peterson et al. (2017) found this actually increased mobile response and concluded that “efforts to influence the device used to participate in web surveys might not be useful.” However, their conclusion is based on using messaging to discourage mobile response; other approaches may be more effective, such as carefully timing email contacts.
Dillman and colleagues (2014) emphasize that all contacts should be strategically timed with the survey’s population in mind, but optimal timing varies across studies and populations. Lindgren et al. (2020) suggest that email timing is important because invitations received at an inopportune time are easily forgotten or ignored. Unfortunately, relatively little recently published research examines optimal timing of web survey invitations and findings are mixed. Callegaro et al. (2015) describe unpublished observational research on 561,000 survey responses from a web panel that found responses came in most quickly to email invitations sent on Sundays or Mondays.
Similarly, in an observational study of 140,000 survey responses, Survey Monkey (n.d.) found that invitations sent on Mondays produced the highest response and Fridays the lowest. Looking at individual surveys, Lewis and Hess (2017) found that Tuesday morning was the most effective time to send invitations and reminder emails for a survey of U.S. federal employees, while Faught et al. (2004) found that Wednesday was best for emailing invitations to individuals sampled from U.S. manufacturing firms. Similarly, in a survey of Swedish panel members, Lindgren et al. (2020) found that emailing on Wednesdays produced the highest participation rates after 24 hours and Saturdays and Sundays the lowest; however, after six days, there were no significant differences in participation rates by email send day. Conversely, in a survey of 24,000 scientists and engineers, Sauermann and Roach (2013) found no significant effect of email day. However, emails sent on the weekend produced a significantly slower response (consistent with Lindgren et al. 2020).
Findings for the optimal time of day to email sample members are also mixed. Lewis and Hess (2017) found that emails sent in the morning were likelier to trigger a response. Similarly, Lindgren et al. (2020) found that participation rates after 24 hours were highest when invitations were sent at 12:20 PM and lowest when sent at 9:00 PM, but the differences were no longer statistically significant after six days of data collection. Additionally, sample members age 30+ were less responsive to surveys sent at 9:00 PM compared to earlier in the day, but differences were marginal and mostly nonsignificant; sample members age 16–29 showed no indications of timing effects. Similarly, Sauermann and Roach (2013) found no significant differences in response rates across invitations sent at various times of day. However, they found that responses to emails sent in the evening were slower compared to other times of the day: evening emails had a median response delay of 12 hours compared to only three to four hours for other times.
The timing of web survey invitation and reminder emails is notable because—unlike mail surveys—web survey messaging arrives nearly instantly or at a specified future time (Dillman et al. 2014). This does not guarantee recipients will read communications at the delivery time, but it does influence when these messages are more likely to be read. A related point is that web surveys typically generate survey responses at a faster pace than other survey modes, with responses arriving quickly after invitation or reminder emails are sent (Dillman et al. 2014). Most completed surveys are submitted the same day sample members are emailed, with responses arriving rapidly after email delivery and tapering off shortly after the initial flood of responses (Callegaro et al. 2015). For example, Sauermann and Roach (2013) found that 50% of responses were received within four hours of sending an email to sample members and 90% within 66 hours. Considering together, the near-instant delivery of survey messaging plus the rapid response to web surveys, a unique aspect of this mode is that the day and time email invitations/reminders are sent can influence when and how respondents complete the survey. This is especially true because mobile devices provide most sample members near-constant access to email and web surveys.
It follows that if sample members are contacted with a survey request when they are using or have access to a computer, they may be more likely to respond via computer rather than mobile device. Conversely, if they are contacted while away from home, work, or other places where they typically use a computer, they may be likelier to respond via mobile device. Thus, certain populations, such as students or office workers, may demonstrate patterns in their mobile response proclivity across various times of day and days of the week.
For instance, college students presumably have greater access to computers when completing coursework and less access when occupied by classes or social activities. It may be possible to shift some students’ responses from mobile to nonmobile devices by emailing recruitment messages when they are more likely at or near a computer (e.g., in the evenings when they tend to study or complete coursework).
This research investigates whether there are patterns in the timing of mobile response and breakoffs that suggest optimal times to email college students to participate in a survey, with the goal of shifting some responses from mobile to nonmobile devices. Using data from a web survey of over 20,000 college students, response patterns were examined to identify which days and times the survey invitation and reminder emails were most likely to produce a greater proportion of nonmobile versus mobile responses, and by extension, fewer breakoffs. The following hypotheses were tested:
Method
The data are from the Campus Climate Survey Validation Study Pilot Test, which was fielded for 57 days between March and May 2015 (Krebs et al. 2016). The study’s purpose was to develop a methodology for surveying college students and develop accurate measures of the rates and characteristics of unwanted sexual contact and campus climate related to sexual harassment and assault. The survey included questions measuring rates of sexual victimization and harassment, as well as campus climate related to sexual harassment and assault.
The initial sample included about 50,000 students from nine U.S. colleges and universities. Approximately 23,000 students responded to the 15-minute, 63-question, mobile-optimized survey. The survey questions were mainly closed-ended, including several multi-item grid questions, and it followed a page design (i.e., one question per page).
Across all schools, the average response rate was 54% for females and 40% for males. Response rates at individual schools ranged from 43% to 71% (females) and 30% to 60% (males) (AAPOR RR3 [AAPOR 2016]).
One school was excluded from analysis because it required students to have a tablet for academic purposes; not surprisingly, mobile response rates were considerably higher at this school than the others. Including this school would have confounded the comparison of mobile and nonmobile responses because email times were not experimentally varied across schools. At the other eight schools, all students who provided informed consent (n = 20,079) were included in the analysis for Hypothesis 3. Since the goal of this research was to gain insight into email timing strategies that could ultimately reduce breakoffs, 491 cases that broke off before completing the entire survey were excluded from analysis when addressing Hypotheses 1 and 2.
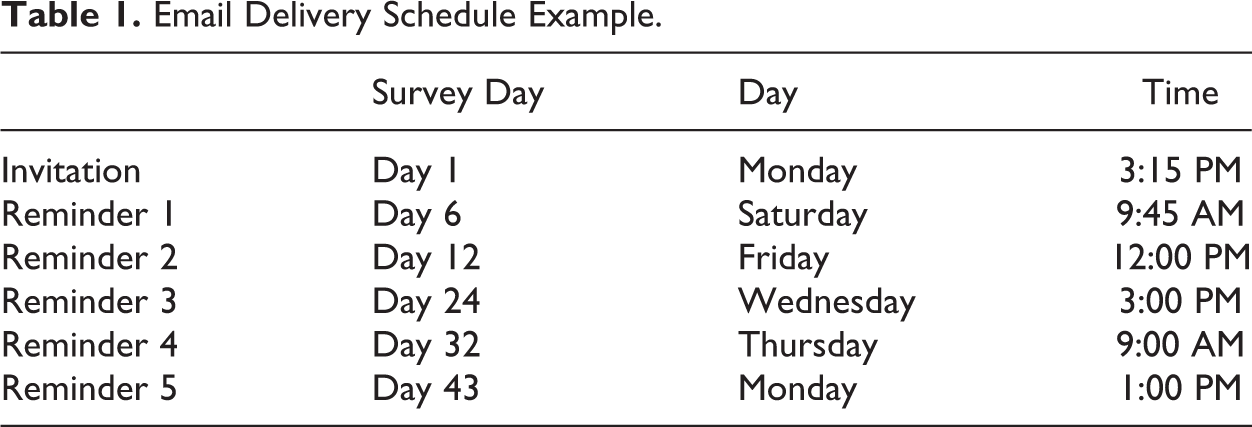
Sample members received one invitation email and up to five reminder emails if they had not yet completed the survey. The send day and time were purposely varied so each sample member received emails at a variety of days/times. Due to varying schedule considerations across and within schools, each student’s emails followed one of 15 schedules. Email timing was not intentionally manipulated through a controlled experiment—this was not feasible given other planned experiments (Krebs et al. 2016). However, email timing varied naturally due to the 15 email schedules and deliberate variation within each. Table 1 is an example of one of the 15 email schedules.
Email Delivery Schedule Example.
To further illustrate the variation in email schedules, the day and time of the 15 schedules is plotted in Figure 1. Each schedule was similar in that the invitation was sent early in the week (mainly on Monday with a few groups receiving it on Tuesday or Wednesday) and reminders were sent any day. The emails were sent on a variety of days within each email schedule. The send times ranged from 7:00 AM to 6:45 PM (in the sample member’s time zone) and varied within each email schedule.
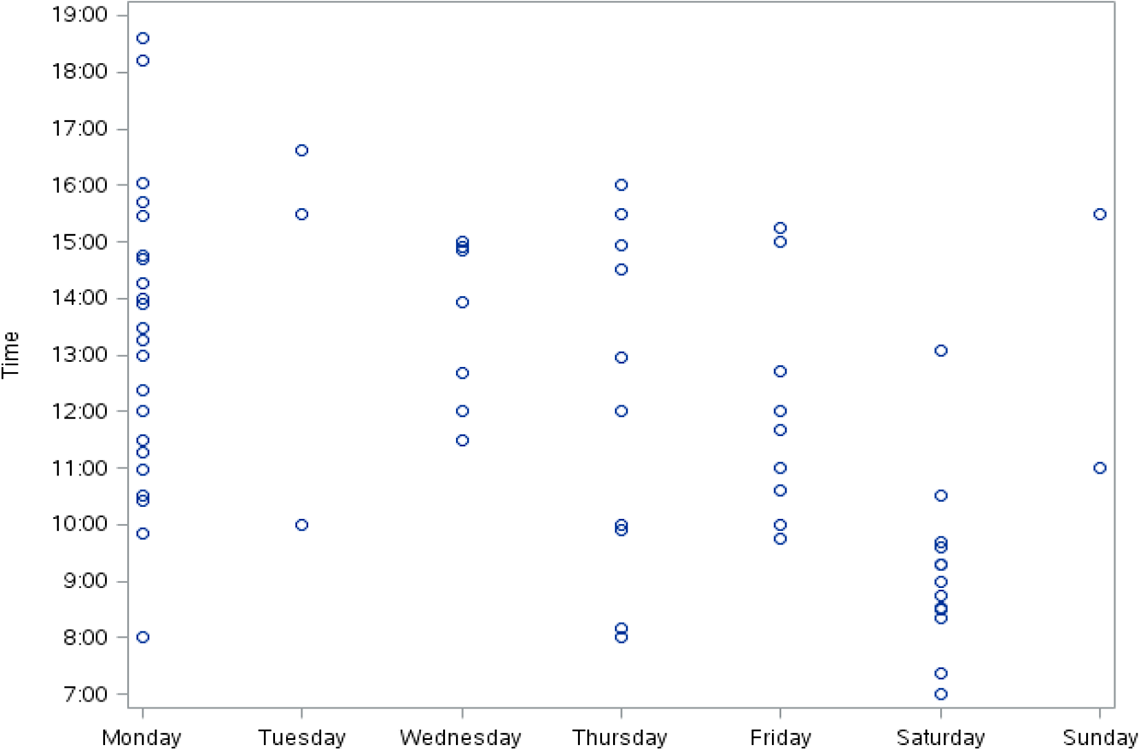
Days and times of sent emails (across the 15 schedules).
Results
Mobile responses were common, representing 26.1% of respondents. Nearly all mobile respondents used a smartphone (90.6%) rather than tablet (9.4%). Among all respondents, 86.0% completed the survey in one session, 11.3% in two sessions, and 2.7% in three or more.
Hypothesis 1: Response Latency
The first step was to examine response latency, or the elapsed time between when each respondent was last sent an email and when they responded to the survey. To account for respondents who completed the survey in multiple sessions, the time of survey response was considered to be the time at which the respondent last logged into the survey. Response latency calculations considered the respondent’s time zone, ensuring that the latency was the true elapsed time even if the researchers and respondent were in different time zones.
Like most web surveys, responses came in quickly after invitation or reminder emails were sent: 27.5% of respondents completed the survey within four hours of receiving any of the emails and responses tapered off soon after. Consistent with Hypothesis 1, mobile respondents took the survey sooner than nonmobile respondents (see Figure 2). Specifically, 36.0% of mobile respondents participated within four hours of being emailed compared to 24.5% of nonmobile respondents, a statistically significant difference (χ2 = 253.4 df = 1, p < 0.0001).
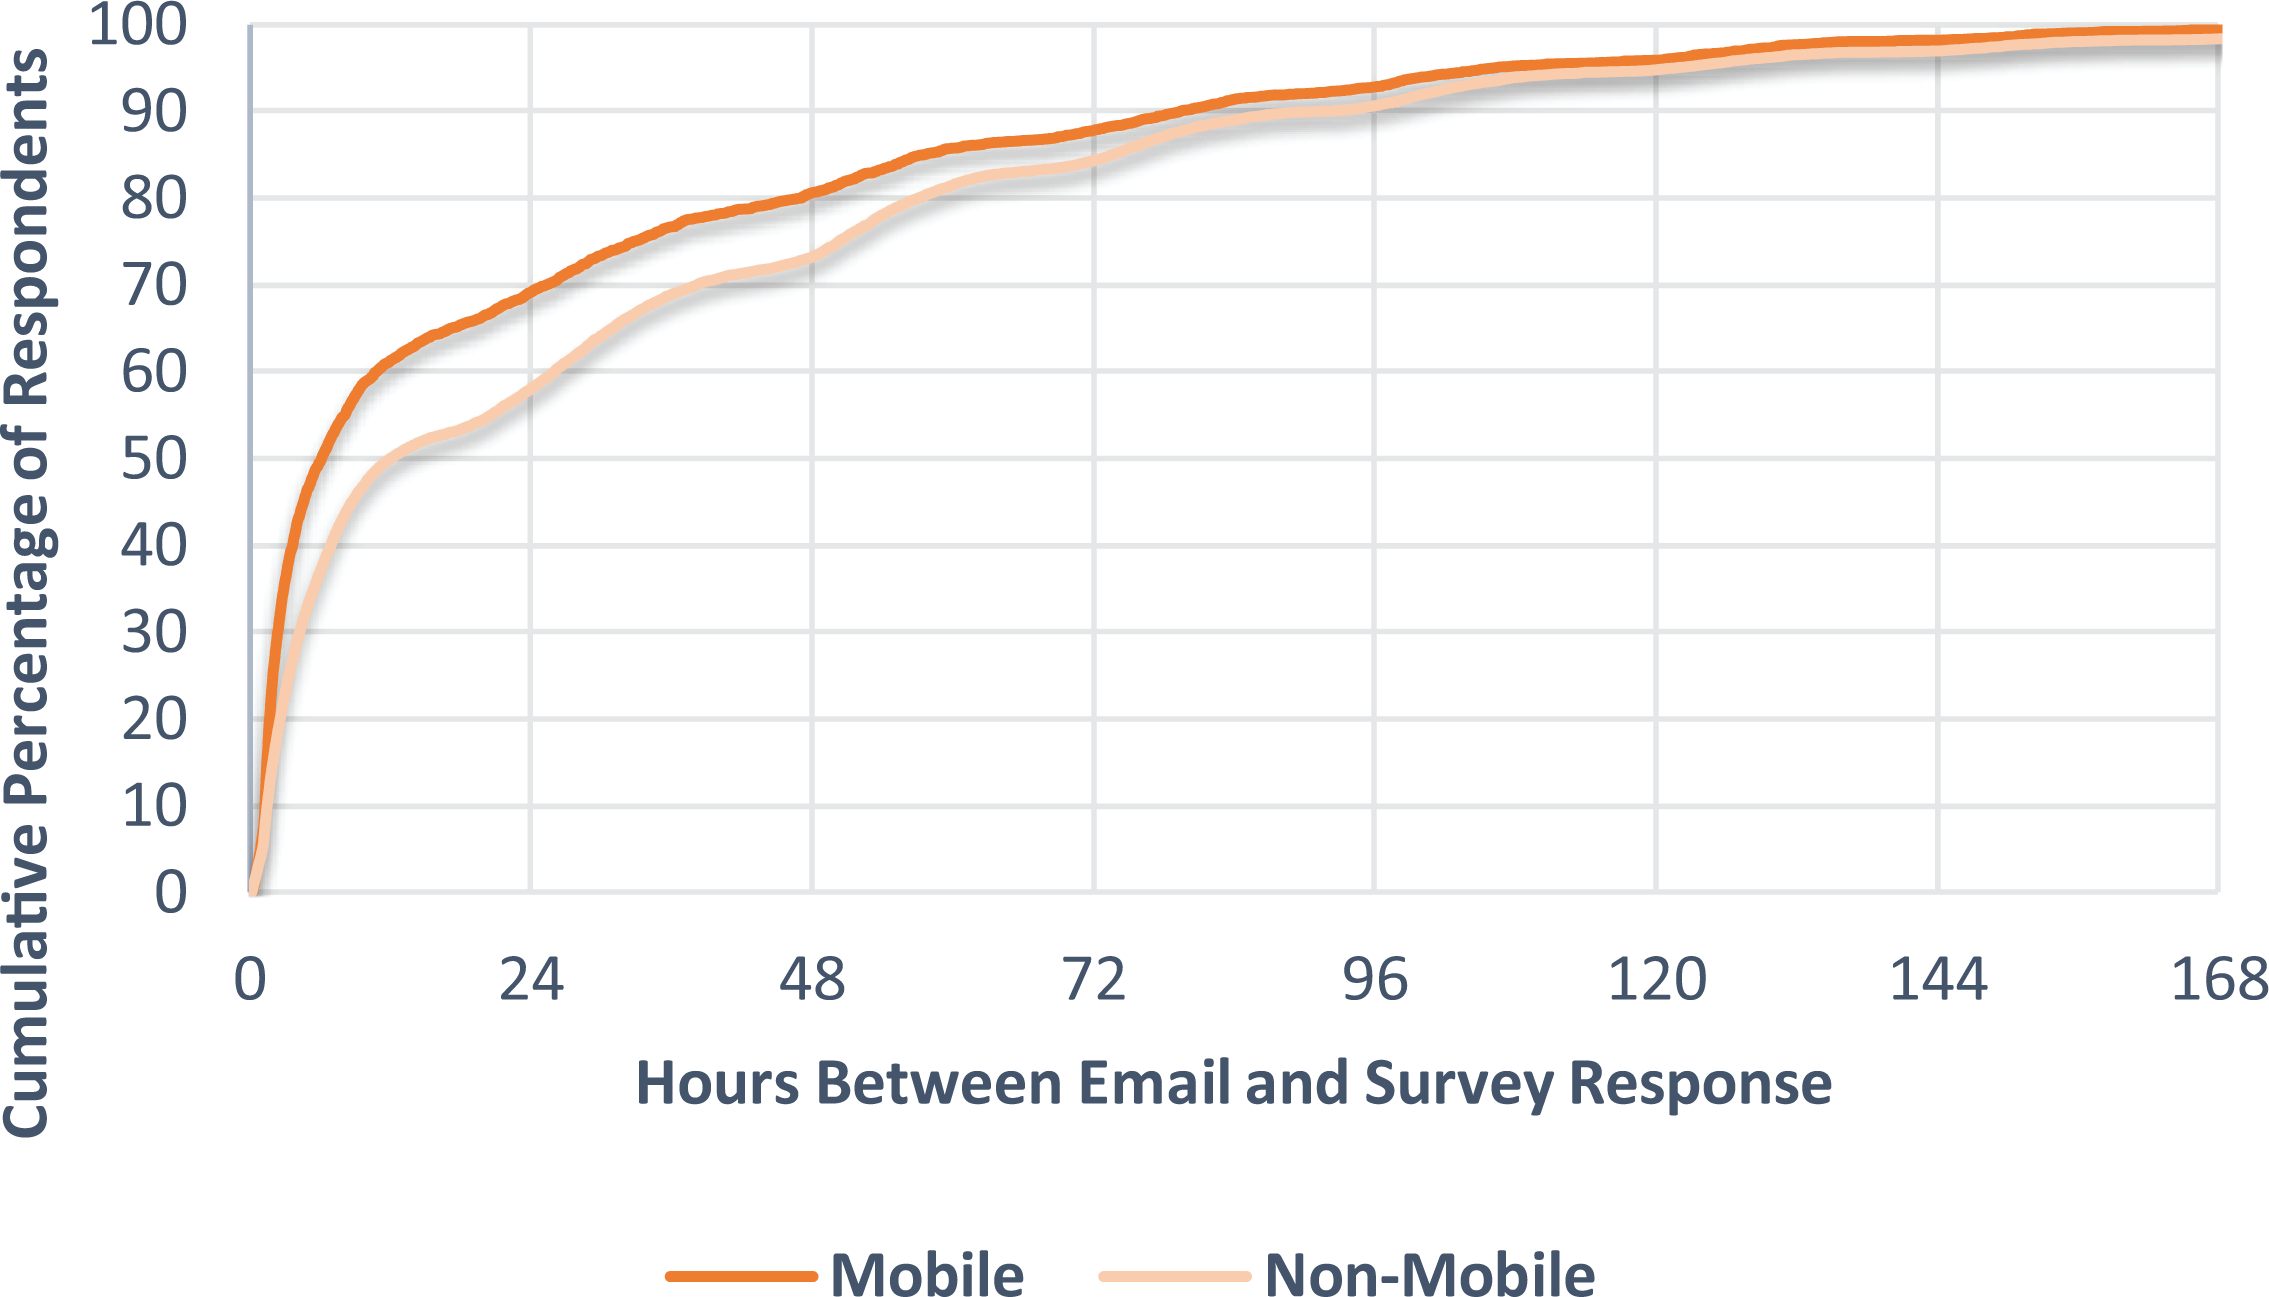
Hours between most recent email and survey completion.
Because response latency could differ in response to the invitation versus subsequent reminders, response latency was also examined separately for respondents who completed the survey after receiving the invitation versus those receiving one or more reminders. For each email type, mobile respondents were significantly more likely to complete the survey within four hours of being emailed: 44.2% of mobile versus 36.4% of nonmobile responses to the invitation came within four hours, and 31.9% of mobile versus 17.6% of nonmobile responses to reminders came within four hours. Both differences were statistically significant (Invitation: χ2 = 33.6 df = 1, p < 0.0001; Reminders: χ2 = 306.3 df = 1, p < 0.0001).
Hypothesis 2: Day and Time of Response
The second objective was to determine if the distribution of mobile versus nonmobile responses differed by time of day and day of the week. Monday was the most, and Sunday the least, common day to take the survey—however, these findings are likely due to the survey’s email schedule, which favored sending emails on Mondays over Sundays.
Because most (73.9%) responses were nonmobile, the proportion of all responses that were nonmobile exceeded that of mobile responses at all times of day. Thus, a more useful comparison for examining Hypothesis 2 is the proportion of mobile responses received at a particular time of day versus the proportion of nonmobile responses received at that same time of day. In other words, two different denominators are used for these comparisons—the number of responses from each type of device (mobile or nonmobile)—rather than the total number of all responses (both mobile and nonmobile).
As Figure 3 shows, the proportion of responses via mobile versus nonmobile devices was significantly different by time of day (χ2 = 165.488 df = 5, p9 < 0.0001). More specifically, a greater proportion of students who responded via mobile device responded during the morning or lunch hours (6:00 AM–12:59 PM) and a lesser proportion responded in the evening or night hours (5:00 PM–11:59 PM) compared to the proportion of students who responded via nonmobile devices; these differences are statistically significant and consistent with Hypothesis 2. As suggested previously, these differences may be attributed to the fact that college students’ access to nonmobile devices likely fluctuates according to their class schedule, schoolwork patterns, and overall student lifestyle.
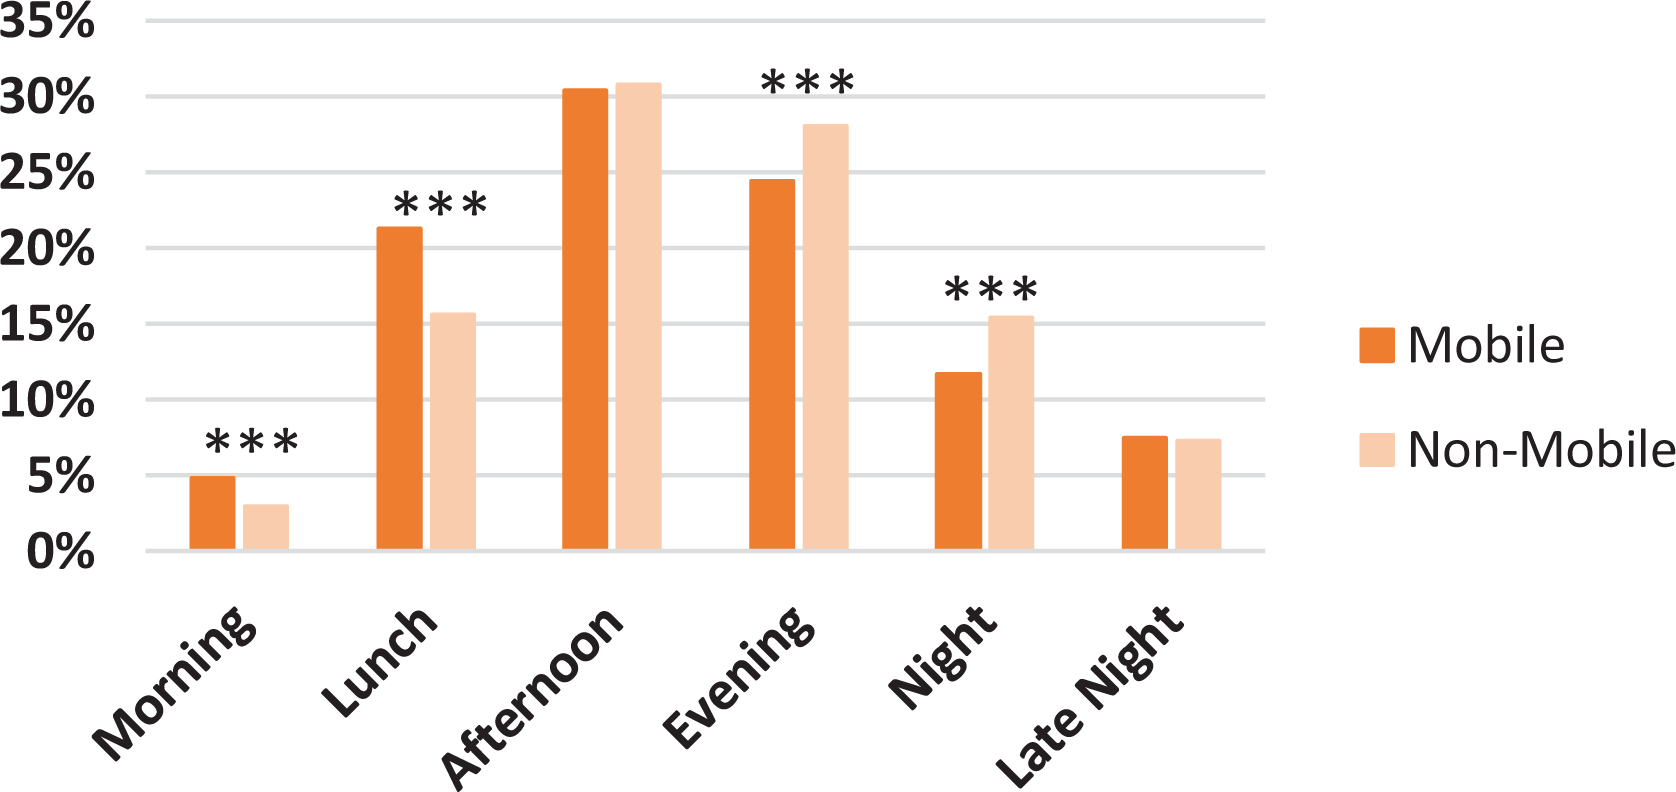
Percentage of mobile and nonmobile responses by time of response. ***p < .001. Note: Morning = 6:00 AM–9:59 AM, Lunch = 10:00 AM–12:59 PM, Afternoon = 1:00 PM–4:59 PM, Evening = 5:00 PM–8:59 PM, Night = 9:00 PM–11:59 PM, Late Night = 12:00 AM–5:59 AM.
Similarly, the proportion of mobile responses received on a particular day of the week was compared to the proportion of nonmobile responses received on that day (i.e., separate denominators are again used for mobile and nonmobile responses—the respective denominators are the total numbers of mobile or nonmobile responses, rather than all responses). It was hypothesized that students’ schedules would impact the days of the week on which they were least likely to respond via mobile device, with nonmobile responses more likely on the days students were doing schoolwork (and more likely to be using a personal computer).
Consistent with the hypothesis, the distribution of mobile versus nonmobile responses was significantly different across days of the week (see Figure 4) (χ2 = 325.24 df = 6, p < 0.0001). A greater proportion of students who responded via mobile device took the survey Thursday through Saturday and a lesser proportion Sunday through Wednesday compared to the proportion of students who responded via nonmobile device.
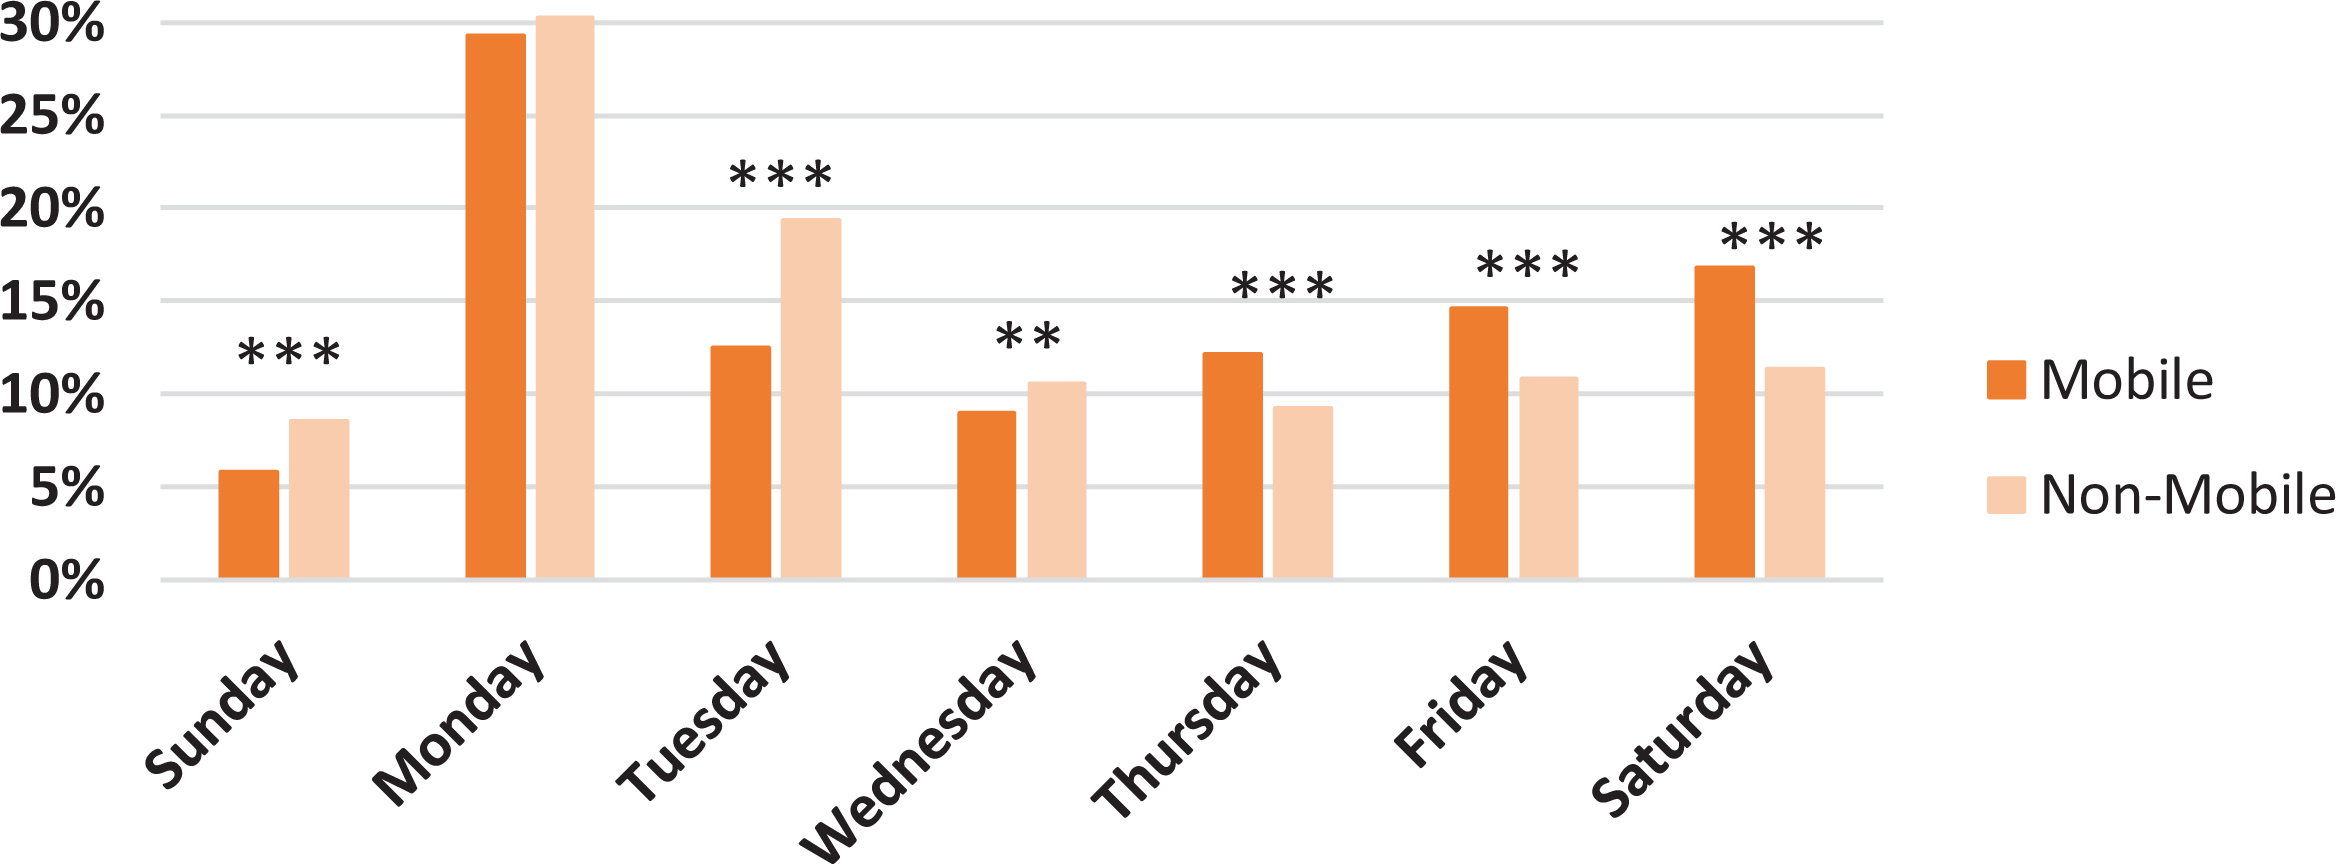
Percentage of mobile and nonmobile responses by day of response. ***p < .001, **p < .01.
Hypothesis 3: Breakoffs
Next, breakoff rates were examined for differences by device type. Consistent with prior research and Hypothesis 3, mobile respondents were significantly more likely to break off than nonmobile respondents (3.7% vs. 2.8%) (χ2 = 9.39 df = 1, p = 0.0022).
Mobile and nonmobile breakoff rates were compared across different times of day. Mobile respondents were significantly more likely to break off during the afternoon (1:00 PM–4:59 PM) (χ2 = 6.95 df = 1, p = 0.0084) (see Figure 5). No other times had significantly different breakoff rates. This could be related to how mobile respondents themselves were at those times. For instance, the fewest mobile breakoffs occurred at nighttime, when students are presumably more likely to be home. In contrast, the afternoon, which is likely the busiest time with classes and other school-related obligations, had the highest mobile breakoff rate. Breakoffs by day of the week were also examined, but there were no clear trends like those observed for time of day.
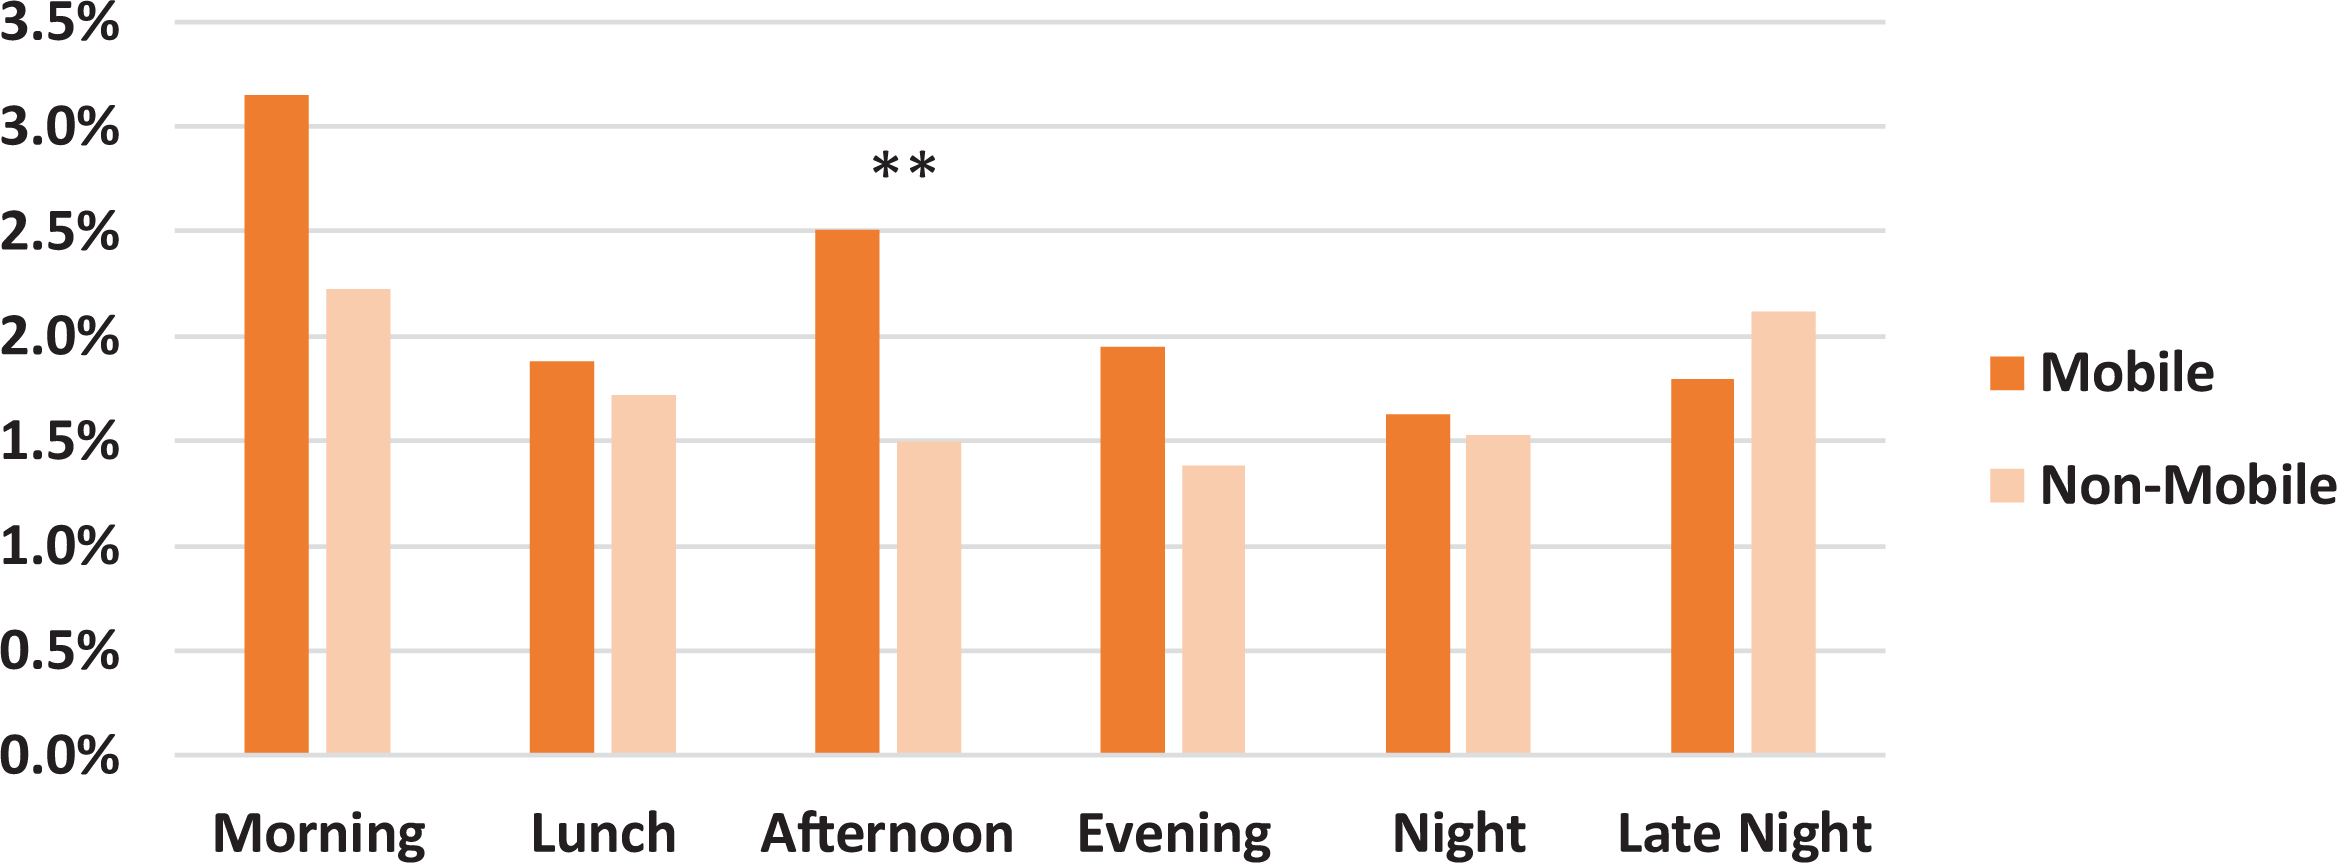
Breakoff rates by device and time of day. ** Mobile and nonmobile rates are significantly different at the 0.01 level.
Discussion
This observational study informs understanding of how the timing of survey emails could decrease the likelihood of mobile response among a college student sample. This is important because of the greater potential for breakoffs among mobile respondents, which could result in nonresponse bias.
The first hypothesis was that the elapsed time between when a survey email is sent and when respondents complete the survey would be shorter for mobile respondents. Consistent with this hypothesis, mobile respondents completed the survey sooner after being emailed than nonmobile respondents. Specifically, 36.0% of mobile respondents completed the survey within four hours of receiving an invitation or reminder email compared to 24.5% of nonmobile respondents, a statistically significant difference.
The second hypothesis was that, relative to nonmobile responses on other days/times, the proportion of nonmobile responses would be greater when students are likely to be doing schoolwork, such as weekday evenings. As hypothesized, a greater proportion of nonmobile responses were received in the evening and on weekdays than nonmobile responses received at other days/times. In contrast, more mobile responses were received between 6:00 AM and 12:59 PM and later in the week (Thursdays through Saturdays) than at other days/times. These findings suggest that, with respect to minimizing mobile response, evening and nighttime hours (5:00 PM–11:59 PM) early in the week (Sunday through Wednesday) appear optimal for emailing this population, as a greater proportion of students who completed the survey via nonmobile device did so at these times compared to the proportion of nonmobile respondents at other times.
The third hypothesis was that mobile respondents would break off at a higher rate than nonmobile respondents, and that mobile versus nonmobile breakoff rates would vary by time and day. Mobile respondents were 1.3 times more likely to break off (3.7% compared to 2.8% for nonmobile respondents). This difference was statistically significant but lower than the increased likelihood (2.8 times) found by Mavletova and Couper’s meta-analysis (2015). Regarding time and day variations in breakoff rates, mobile respondents were significantly more likely to break off in the afternoon but there were no differences across days.
Taken together, the findings suggest that morning and afternoon hours may be suboptimal for emailing this population, as mobile response and breakoffs were likelier during these hours. However, further research would be beneficial to study response patterns more generally when emailing college students. For instance, how might overall response rates change if college students were sent invitations/reminders in the evening?
This study’s aim was to inform email timing strategies that could result in a lower proportion of participants responding via mobile devices by examining the impact of email timing on response behaviors of a specific population, college students. This population differs from the general population with respect to several characteristics, including their daily schedules and patterns of mobile device usage, so these findings are likely not generalizable to other populations. However, the findings suggest that for other types of specific populations (e.g., office workers) or even the general public, mobile response proclivity may be related to patterns in the sample’s typical schedule. Determining schedule patterns that impact mobile response proclivity may be difficult for many populations. However, if this can be accomplished in future research, survey emails could potentially be timed to reduce mobile response among that population and ultimately reduce breakoffs.
Even within the college student population, further research is needed to compare findings across additional schools. These results may be confounded by email schedule variation across schools and other school-specific factors (e.g., student demographics, class schedules). Future research with additional schools would be informative. Additionally, research on email timing strategies more generally (i.e., not related to mobile response) would be informative, as the small number of studies published on this topic in the last decade are inconclusive and few studied the general population.
Another limitation of this research is that the survey software captured only the time of the respondent’s last connection to the survey. Most respondents completed the survey in one session, so this variable provides a good indication of when these respondents initially accessed the survey. However, for the small number of respondents who broke off before returning and completing the survey later, the date/time at which they initially accessed the survey was not captured; such a variable would provide additional insight into the impact of email timing.
An additional technical limitation is that the precise time of email delivery is unknown—e.g., differences across email systems could have delayed delivery. However, any such differences are likely small and negligible. Employing more detailed email and web paradata in future research (e.g., tracking when emails are opened) could provide further insight into these sorts of differences.
Despite these limitations, these findings provide insight into when college students may be most and least likely to respond to a survey request via a mobile device. These findings pave the way for future research, such as an experimental comparison of the impact of email timing on mobile response. For instance, sample members could be randomly assigned to be emailed only at times expected to maximize or minimize mobile response, with a control group being emailed at random times. Future research on this topic could also expand to additional populations besides college students. These initial findings are promising—they suggest that it may be possible to reduce mobile response through carefully timed emails, which could ultimately reduce breakoffs.
Footnotes
Acknowledgments
The authors would like to thank Jessica Stroop with the Bureau of Justice Statistics (BJS) and Michael Planty and Lynn Langton with RTI International. The authors would also like to thank BJS and the Office on Violence against Women (OVW) for sponsoring this research. Note the views expressed in this article are those of the authors and do not reflect the views or position of BJS, OVW, or the Department of Justice. NVSSP cooperative Agreement Number: 2011-NV-CX-K068.
Declaration of Conflicting Interests
The author(s) declared no potential conflicts of interest with respect to the research, authorship, and/or publication of this article.
Funding
The author(s) received no financial support for the research, authorship, and/or publication of this article.