
Abstract
Web surveys are popular in social sciences for reaching a large audience at a low cost and in a short period. However, response rates and nonresponse bias are still issues of concern. Using a factorial randomized control trial design, this study explores whether different communication emails affect response rates, representativeness, and response bias in a web survey of doctoral students enrolled in a U.S. university. A total of 5,539 doctoral students were stratified and randomly assigned to one of six groups. Results showed that none of the interventions increased the overall response rate. Moreover, interventions affect the representativeness of the sample and are associated with response bias.
The use of the web to administer surveys has transformed the way social scientists approach their subjects of study as it allows them to reach a very large audience at a low cost and in short periods (Cook et al. 2000). Although the delivery mode has changed, response rates and nonresponse bias are still issues of concern (Cook et al. 2000; Daikeler et al. 2020; Pedersen and Nielsen 2016). In a recent meta-analysis study of response rates among different delivery methods, Daikeler and colleagues (2020) estimated that web surveys yield approximately 12 percentage points (pp) lower response rates compared to other modes, this difference being slightly lower for a student population (8 pp). A low response rate is problematic because it could result in an underpowered sample (i.e., the sample size is not big enough to perform desire analyses) and/or bias due to nonresponse (i.e., the sample is not representative of the population as nonresponse is not random; Daikeler et al. 2020; Groves and Peytcheva 2008).
One set of interventions targeted by researchers to increase response rates and representativeness is manipulation of various elements related to communications with participants. In general, there is evidence that personalized contacts, the number of contacts with the participant, and the use of reminders increase response rates in the general and student populations (Cook et al. 2000; Heerwegh 2005; Sammut et al. 2021). The effect of pre-notifications, the content of the reminders, and incentives is mixed and depends on the mode of delivery, content, and timing (Cook et al. 2000; Daikeler et al. 2020; Porter and Whitcomb 2005; Sammut et al. 2021; Van Mol 2017; Zhang et al. 2017). In a student population, the use of pre-notifications has been found to increase response rates (Kaplowitz et al. 2004). Regarding the representativeness of respondents, some research points out that the use of specific images on the survey invitation and the reminders influence the sample composition (Liu and Inchausti 2017; Van Mol 2017).
Although survey methodology literature provides evidence of some elements that increase response rates in web surveys, there is less research about the effect of persuasive technologies, defined as “any interactive computing system designed to change people’s attitudes or behavior” (Fogg 2003:1) on response rates, representativeness of the sample, and response bias.
An example of a persuasive technology is pop-up windows from digital calendars that alert people of upcoming meetings or tasks. In this context, researchers have found that embedding the first survey question in the invitation email or the first reminder may have positive effects on response rates (Liu and Inchausti 2017; Moore and Varghese 2021). Others indicate that the number of respondents on the reminder has no effect (Van Mol 2017), and state that the average actual time to respond the survey in the reminders has mixed effects on response rates (Trouteaud 2004; Van Mol 2017).
Online surveys offer tremendous possibilities to include persuasive technologies in the invitation or data collection process, which effects are still unknown. The purpose of this study is to contribute to this emergent literature by evaluating the effect on response rates, representativeness of the sample, and responses of three interventions: (1) embedding a digital calendar invite with; (2) without the survey link in the pre-notification; and (3) providing information about respondents in the first reminder. In a context of declining response rates to surveys in general (Fosnacht et al. 2017; Zhang et al. 2017) and email fatigue (Grevet et al. 2014), understanding how technology can be used and its effects on response rates, nonresponse bias, and participants’ responses can help social scientists become aware of the implications of their communication strategy and improve its design when collecting data through the web.
Hypotheses and Interventions
We draw on the theory of planned behavior (Ajzen 1985, 1991; Bosnjak et al. 2005) to propose the following interventions and hypotheses. The theory of planned behavior posits that a first step to do something, such as responding a survey, is the intention to do it. Intentions indicate a plan of action where individuals evaluate (1) the consequences of the behavior forming favorable or unfavorable attitudes toward it (behavioral beliefs); (2) the perceived normative expectations of others or social pressure (normative beliefs); (3) their moral obligation (i.e., internalized moral rules); and (4) the factors that enhance or make it difficult to perform the behavior in question (i.e., control beliefs). In each situation, individuals decide to perform a behavior or not perform a behavior based on the beliefs accessible to their cognitive process (Ajzen and Fishbein 2000). Based on this theory, we put forth the following hypotheses.
Pre-notification
Participants may have a favorable attitude about responding to the survey, but struggle to find the time to take it (control belief). Evidence of implementation intention research has found that developing a plan detailing the when, where, and how of goal achievement increases attainment of the goal in the future (Gollwitzer and Sheeran 2006). Therefore, including a digital calendar invite in a pre-notification email (see Figure 1), which allows participants to develop a plan by scheduling to take the survey when they have time, will increase response rates compared to receiving a pre-notification without the digital calendar invite.
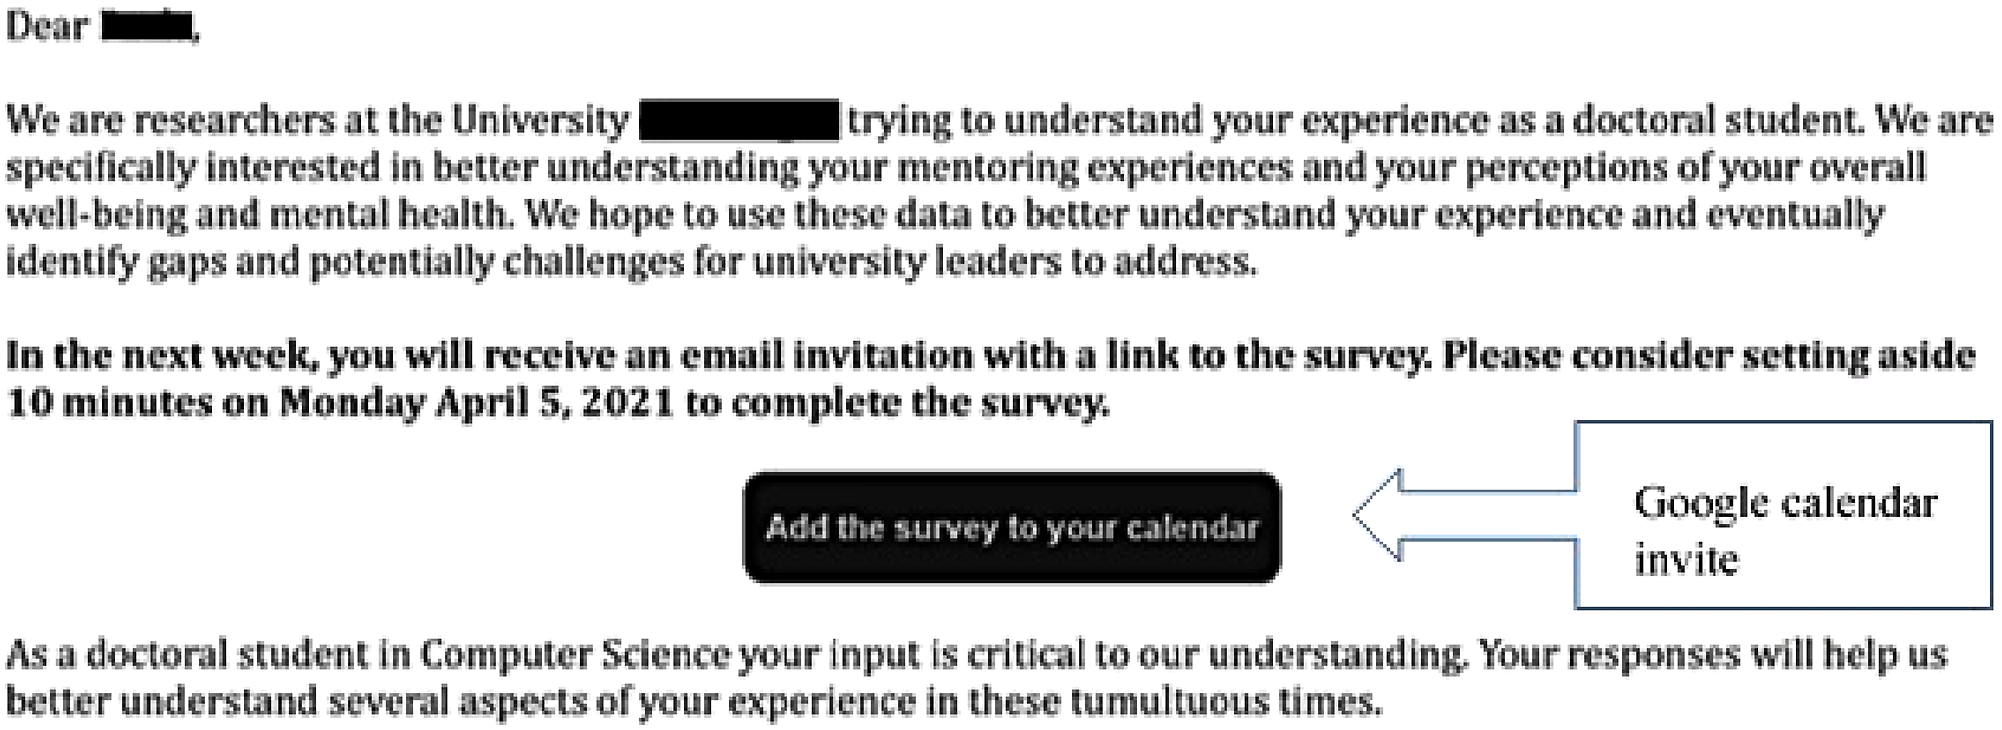
Pre-notification email with Google calendar invite.
Participants with intentions to take the survey who develop a plan to take it by using the google calendar invite may fail to take it because they may consider that finding the invitation email with the link to the survey requires too much effort (a control belief), increasing the perceived difficulty to take the survey. Therefore, including a digital calendar invite with a direct link to the survey in the pre-notification email (see Figure 2) will increase the response rate. It will also affect the representativeness of the sample, compared to receiving a simple pre-notification, by attracting non-respondents who are motivated but find they have to put a lot of effort to take the survey (find the right time to take it and then find the link).
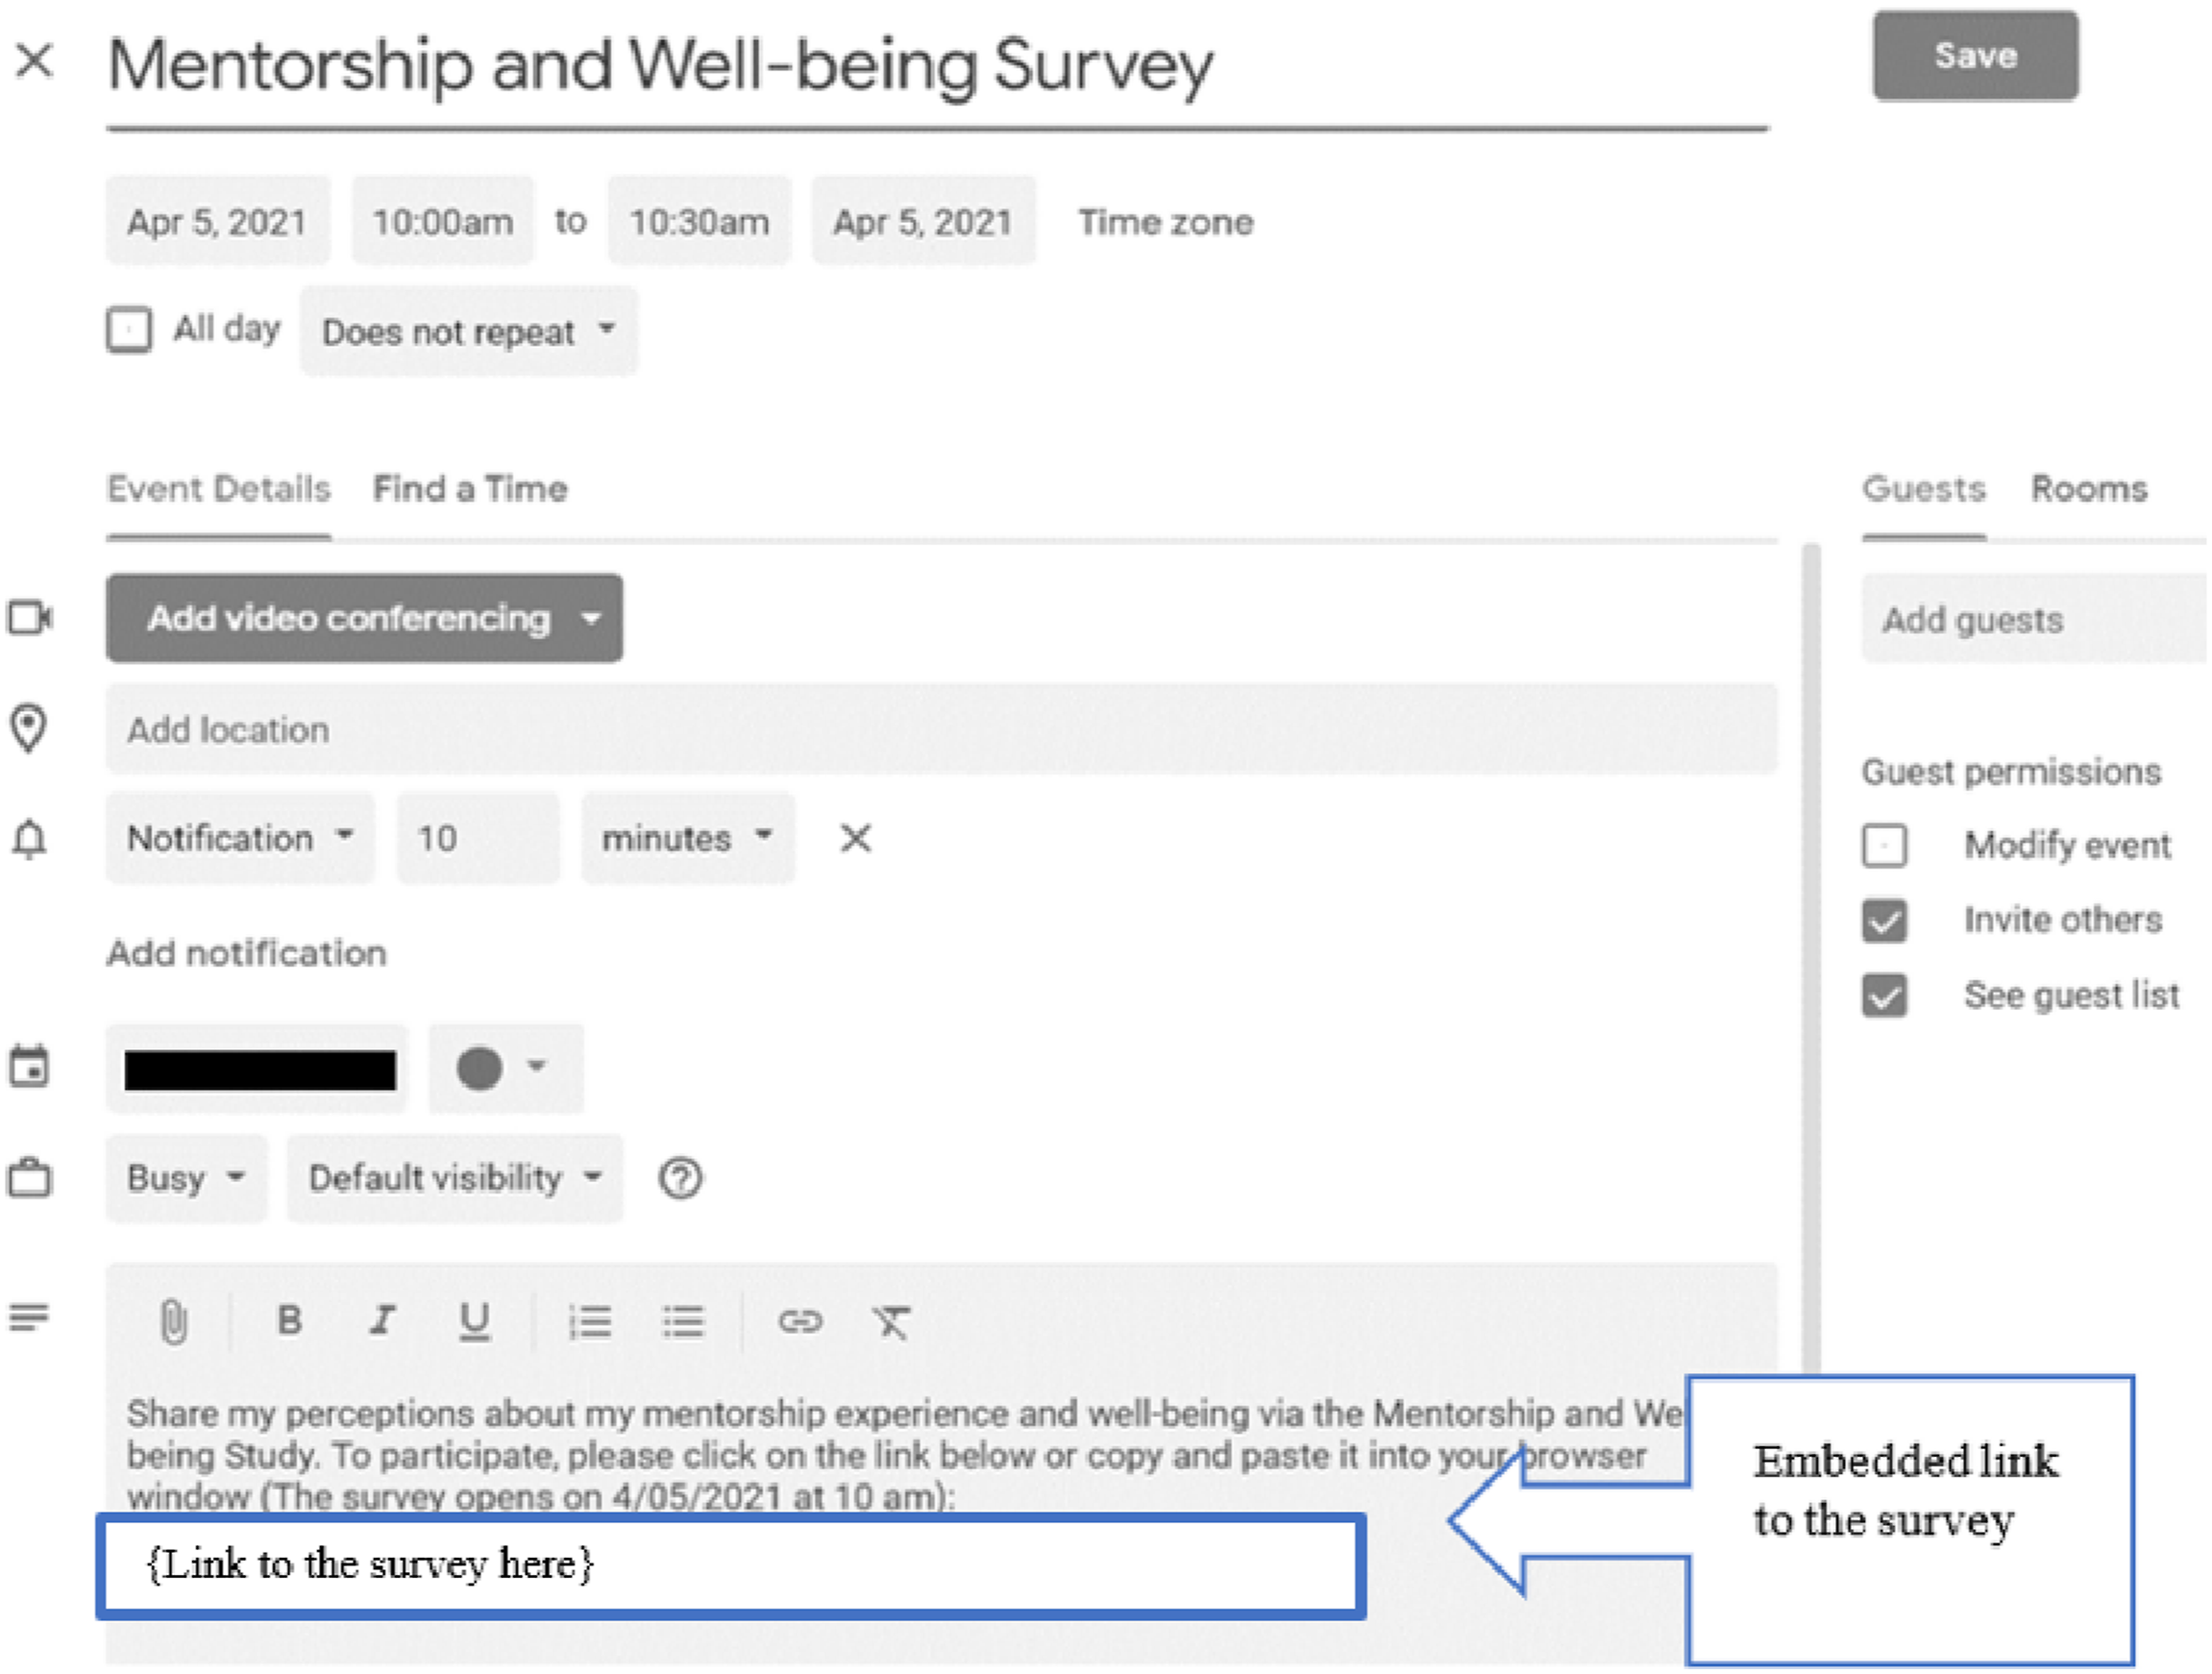
Pre-notification with Google calendar invite and a link to the survey.
Reminders
A reminder that contains specific wording referencing the percentage of students who already responded (i.e., >40%; see Figure 3) will increase the response rate compared to a simple reminder. By explicitly stating a considerable percentage of peers who already responded, this intervention will highlight the social pressure making this normative belief more accessible to the participant’s cognitive process when reevaluating whether to take or not the survey (Ajzen and Fishbein 2000).
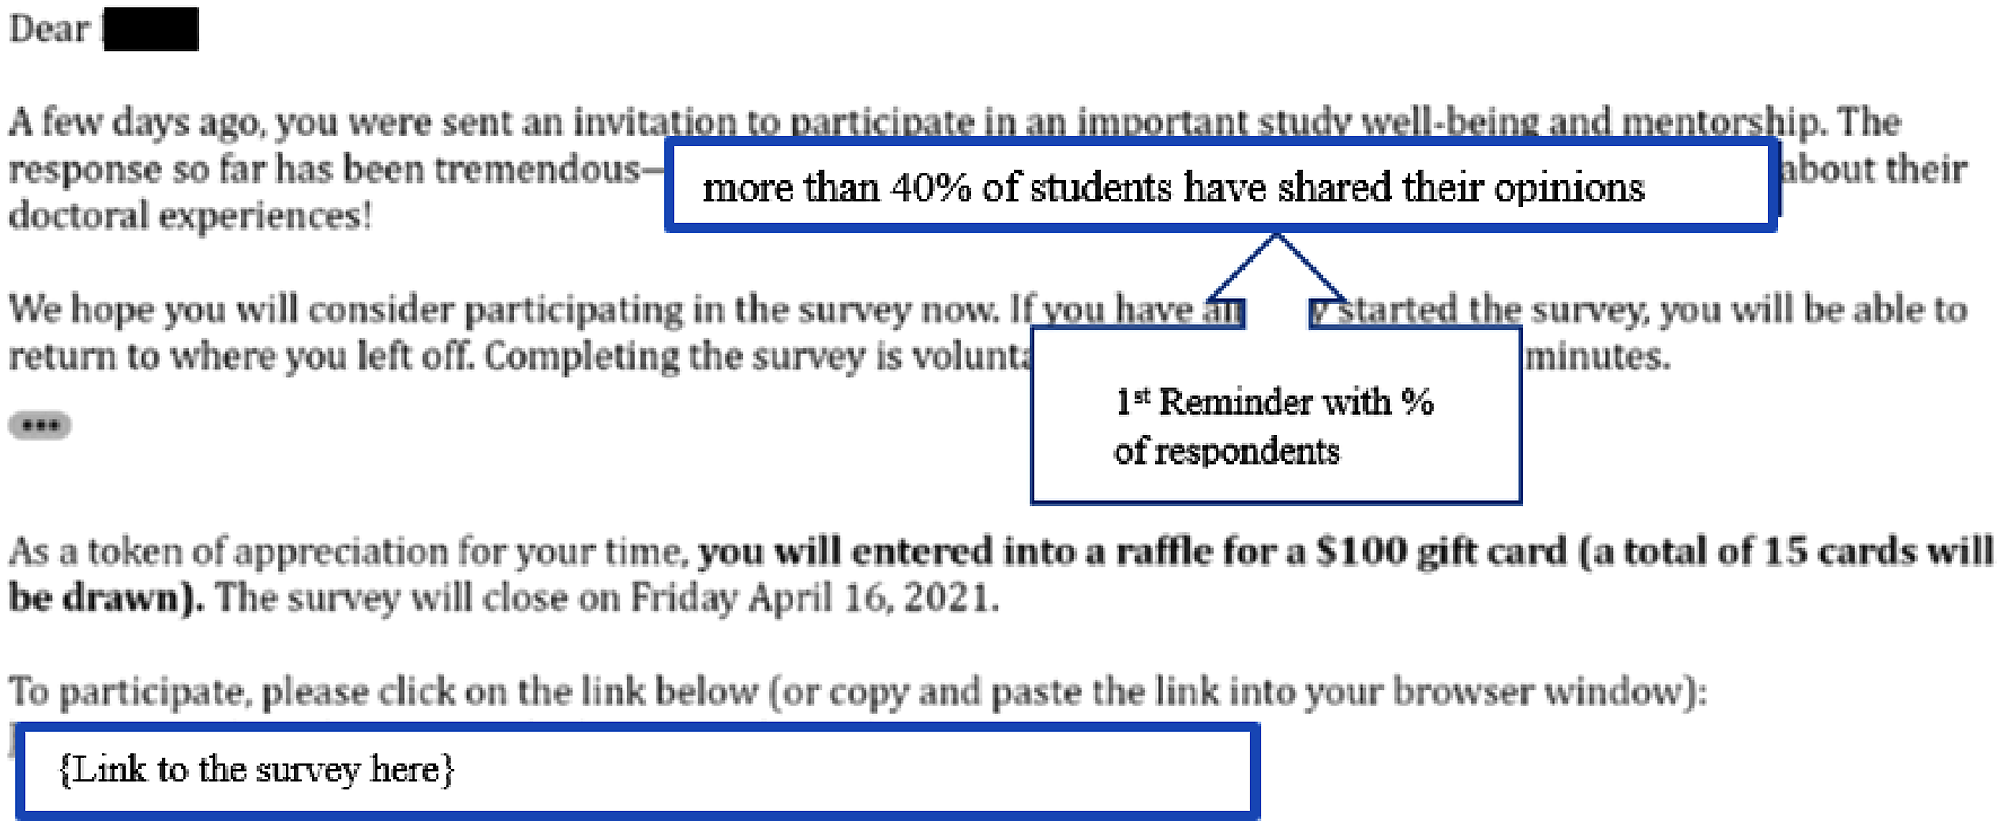
First reminder with the percentage of participants that already responded.
Effect on Response Bias
Beyond response rates, there is limited literature that has examined the effect of the survey invitations on the actual responses to the survey questions. An example is Liu et al. (2016), who find that the use of different images on the survey invitation lead to a difference in respondents’ composition and bias in the survey results. This evidence suggests that nonresponse is not entirely random and that elements in the invitation that attract non-respondents may result in response bias. Leverage-salience theory (Groves et al. 2000) posits that the causes of survey response vary for different people and that the saliency of certain elements on the survey introduction will affect differently the propensity to answer. This is a problem when the unobserved characteristics of usual non-respondents are correlated with their survey answers resulting in response bias (Groves and Peytcheva 2008). We explore this possibility by analyzing whether the actual responses differ by type of intervention.
Methodology and Experimental Design
Sample Composition, Communication Strategy, and Questionnaire
The sample used in this study was composed of 5,539 doctoral students enrolled during the 2021 Winter term in a major research-intensive university in the United States. Of those, 46% were female, 66% were doctoral candidates, 14% were domestic under-represented minority students (URM, including those who self-identify as Black, Hispanic/Latinx, and/or Native American), 51% were domestic no-URM students, and 35% were international students. Thirty-four percent were in their first two years in their program and 33% have been enrolled for more than five years.
All students were invited to participate in the study. The communication strategy consisted of one pre-notification email sent three days before the survey launch, one invitation to participate in the study, and three reminders sent to non-respondents during the lapse of two weeks separated by three or four days between reminders. The survey closed two weeks after opening and a thank-you email was sent to the respondents one week after closing. Each email was personalized addressing the student by their name and their program of study. The email platform and the digital calendar was Google. The email address used to send the communications contains the study name and the university domain. All communications were signed by the study team.
The questionnaire applied contained 76 closed-ended questions and two open-ended questions about mentorship experiences and well-being. After piloting the survey duration, the estimated average time to take the survey was 10 minutes and was mentioned in each communication. We also used a lottery incentive of 15 gift cards for $100 each.
Experimental Treatments
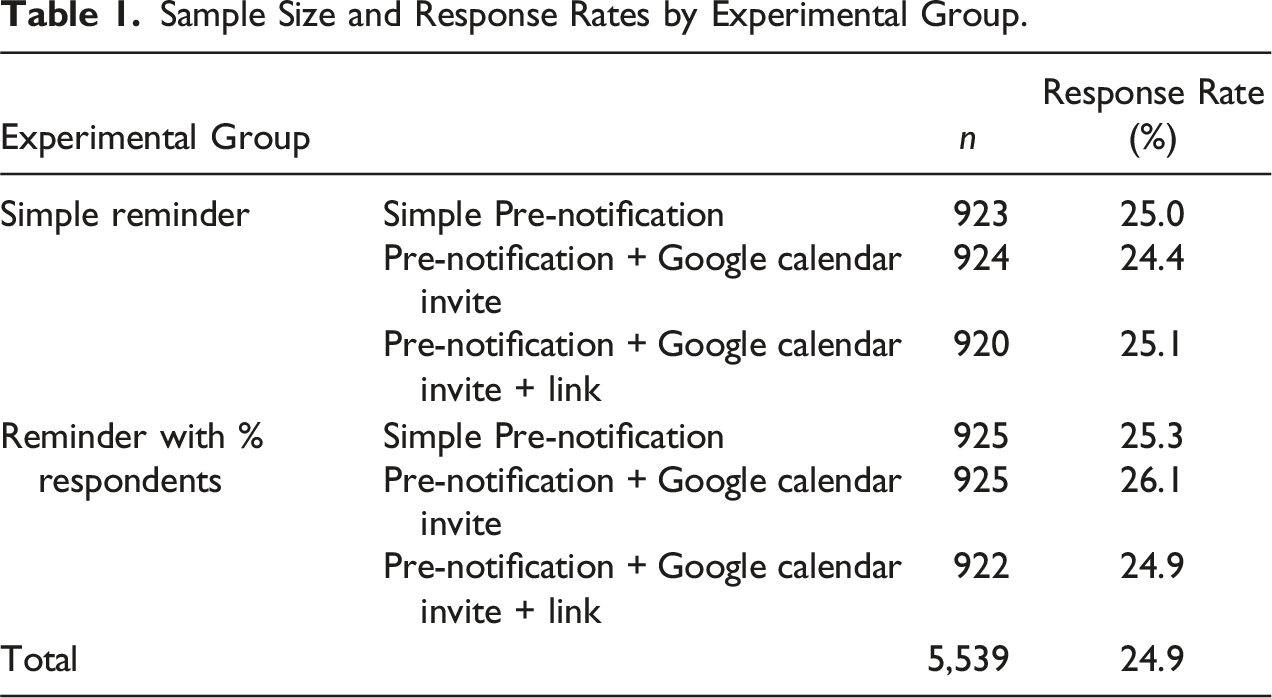
Sample Size and Response Rates by Experimental Group.
Analytical Strategy
We used a linear probability model to estimate the effect of the interventions on the probability of response (Gomila 2021). The dependent variable is whether the participant responded to the survey (1) or not (0). Participants were counted as respondents if they answered at least one question. We included, as independent variables, the type of pre-notification received, the type of reminder received, and an interaction between both. As control variables, we included sex, URM/international status, academic field, the cohort of first enrollment, and candidacy status. We also explored heterogeneity effects on response rates by URM/International student status and sex. A similar approach was used to explore the effect of the intervention on the survey responses using the indices measured in the survey as dependent variables. To assess the effect of the interventions on the sample representativeness, we performed a one-sample t-test comparing the proportion of respondents by each demographic characteristic (sex and URM/International student) in each group and the proportion in the population.
Results
Response Rates
The overall response rate was 24.9%. For the experimental groups, and as shown in Table 1, response rates vary between 24.4% for the group that received a Google calendar invite embedded in the pre-notification and 26.1%, for the group that received the Google calendar invite and the percentage of respondents in the first reminder.
Effect of Interventions on Overall Response Rates and Heterogeneity Effects by Demographic Characteristics.
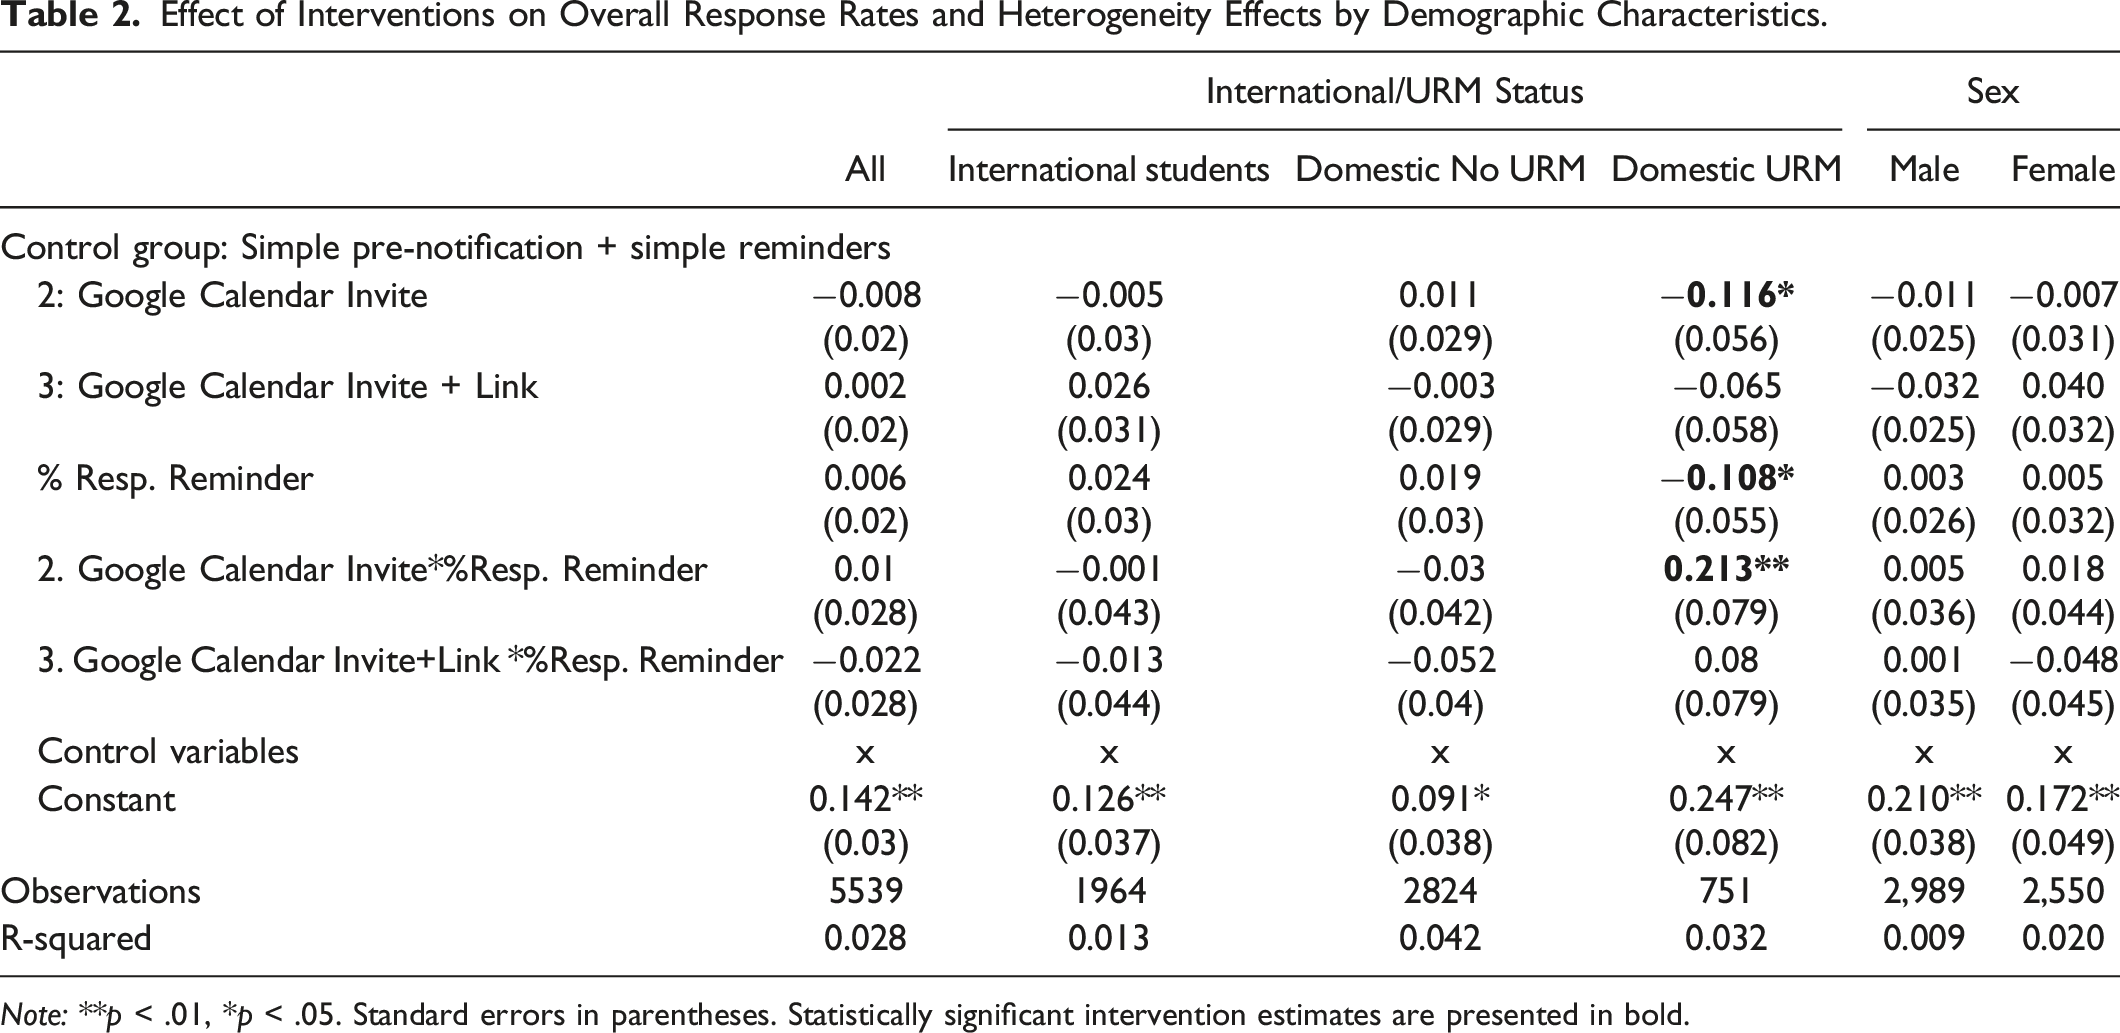
Note: **p < .01, *p < .05. Standard errors in parentheses. Statistically significant intervention estimates are presented in bold.
Figure 4 presents the demographic characteristics of the population and the respondents for each intervention group. We found evidence that the interventions or the lack of them affect the representativeness of some groups. For instance, sending a simple pre-notification and a simple reminder resulted in an over-representation of URM respondents compared to the overall population, while using any intervention maintained their representation at the same level as the population. For domestic non-URM respondents, we found that sending a Google calendar invite in the pre-notification resulted in an over-representation of the group compared to the population. International respondents tended to be under-represented in the control and intervention groups except for the group that received a Google calendar invite with a link to the survey and the intervention in the reminder, where their proportion tends to be similar to the population. Finally, females tend to be overrepresented in all the groups compared to the population. Respondents’ demographic characteristics. Note: **p < .01, *p < .05 based on a t-test comparing the proportion of each group with the population proportion.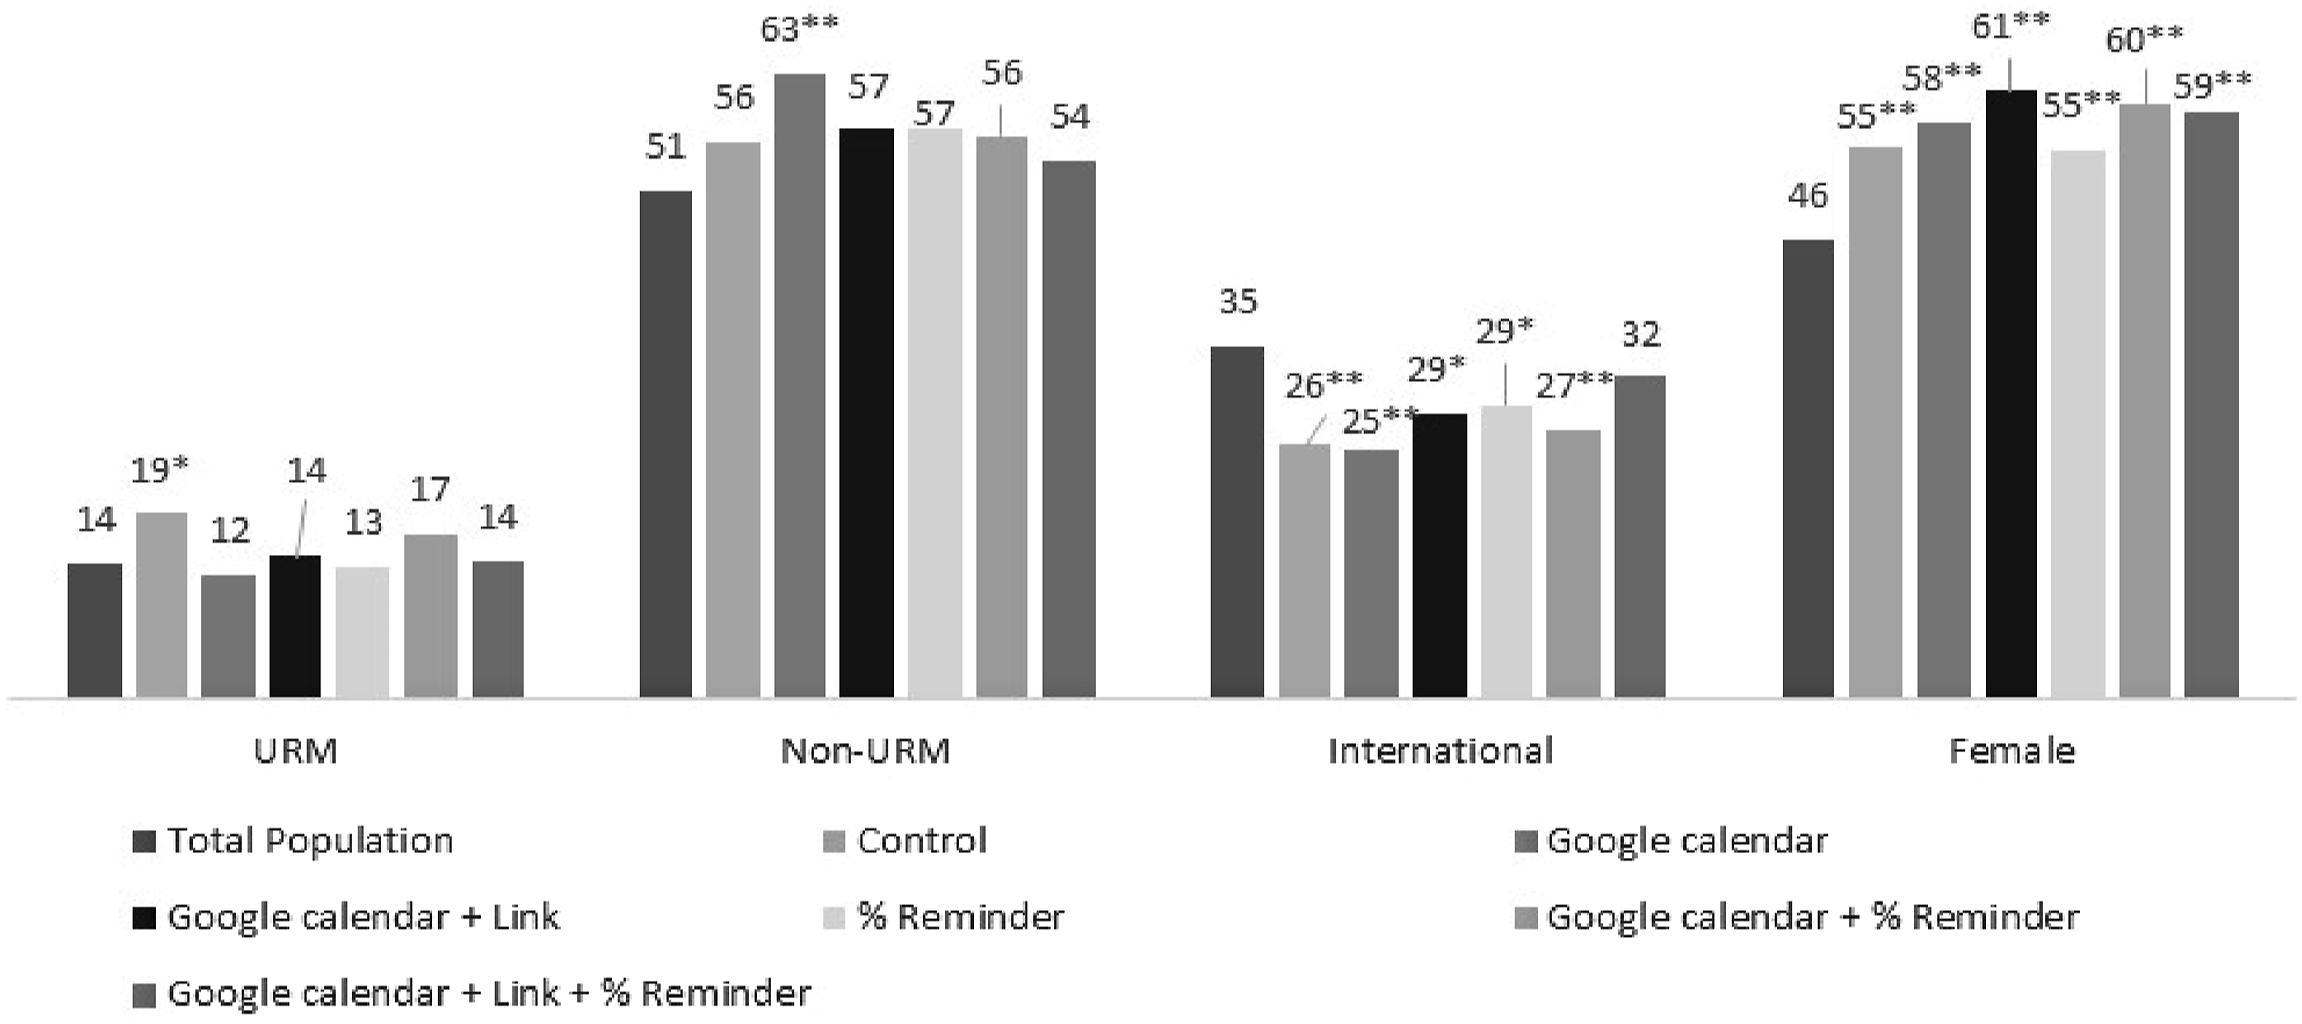
Response Bias
Response Bias of Interventions on Survey Questions.
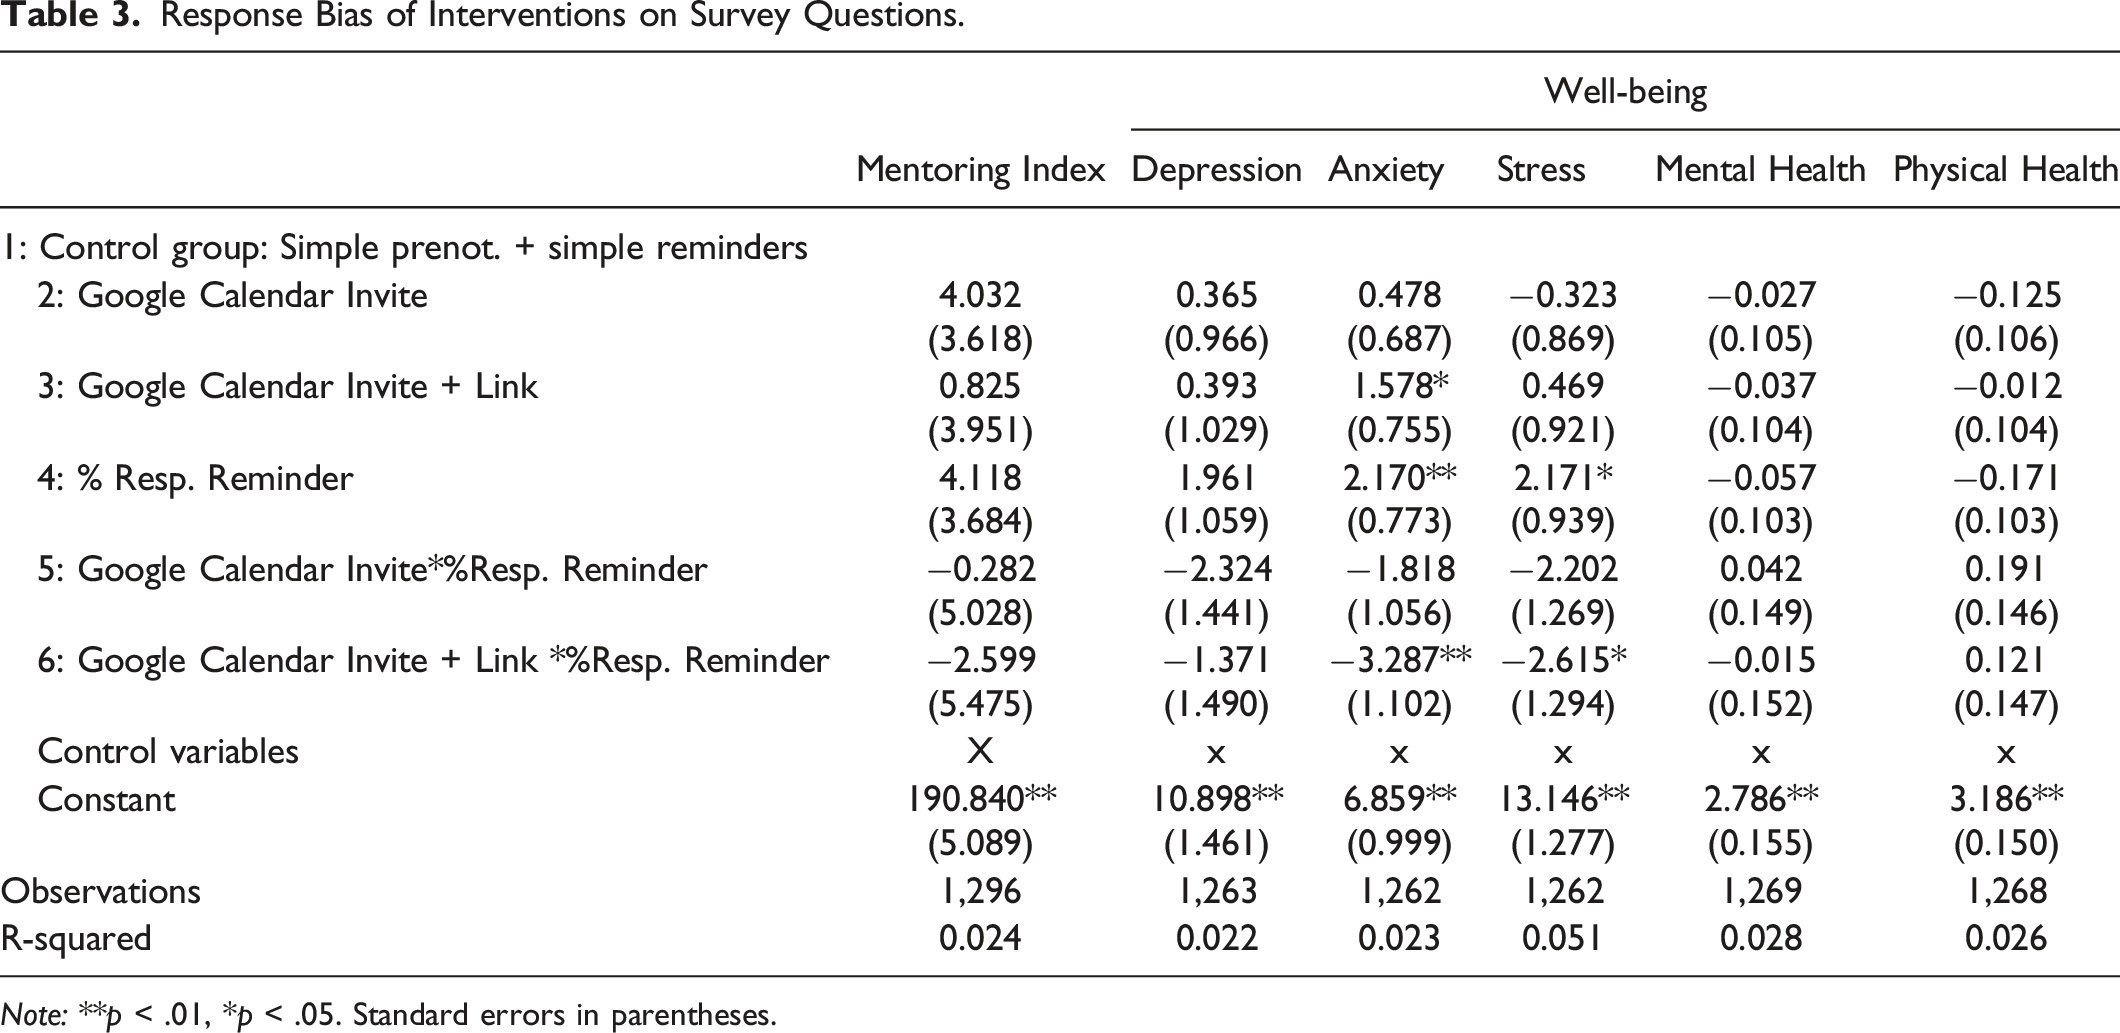
Note: **p < .01, *p < .05. Standard errors in parentheses.
Discussion
In this study, we tested the effect of potentially persuasive technologies, such as Google calendar invites and percentage of students who already responded, embedded in communication emails on a web-survey response rate, representativeness, and response bias. Overall, we did not find any effect of the pre-notification or reminder interventions on the response rates. Therefore, our study shows that, at least in a doctoral student population, including a digital calendar invite is not an effective tool to increase the control beliefs and lead subjects to take the survey. Regarding the reminder intervention, we agree with Van Mol (2017), who did not find any effect of using the percentage of participants who already responded on the response rate in a Belgium student population. It seems that providing a relatively high percentage of earlier respondents does not motivate behavior by bringing attention to a normative belief.
Although we found heterogeneity effects of the interventions on URM participants, we call for attention on these results as the sample size for this group was relatively small. By examining these results along with the effects on the sample representativeness, we observed that the control group has an over-representation of URM participants and the groups with an intervention have a URM representation similar to the population. Because the sample size is relatively small, small differences in the number of URM students who responded to the survey represent a substantial increase in their response rate. More research is needed with a bigger URM sample size to fully understand this phenomenon. We also found effects of the interventions on non-URM domestic and international participants. However, no effect was in line with our hypothesis 2, which suggests that making the survey easy to find by providing a link to it in a digital calendar invite does not affect control beliefs.
Lastly, we also found that the interventions are related to response bias as those respondents who received an intervention in the reminder have higher levels of anxiety and stress and those who received a digital calendar invite with the link to the survey also had higher levels of anxiety. However, these results should not be interpreted as causal effects of the interventions on the responses. It is possible that the intervention may be salient to usual non-respondents who already have high anxiety or stress levels, as suggested by the leverage-salience theory (Groves et al. 2000). As Liu et al. (2016) also found some effects of the interventions in the responses, we call on researchers to include this type of analysis when assessing different interventions in response rates. Including this type of analysis is especially important when assessing interventions on a web-survey mode as this type of data collection tend to have low response rates and any intervention may change the sample composition beyond observable characteristics.
This study, although rigorous in its methodology, has some limitations. The intervention was tested on a population that is highly educated and used to the interaction with digital platforms (college graduate student). It is possible that, as this population is used to receiving emails and digital calendar invites, the interventions used in this study were not useful for triggering the expected behaviors. Populations less exposed to digital platforms in their daily life might find the digital calendar invite more useful and perform the behavior when scheduling the invitation to answer the survey. More studies are needed in populations with different levels of exposure to digital platforms to fully understand the effect of this kind of persuasive technology on web-based survey response rates and representativeness.
Overall, the main conclusion for survey designers is that the use of persuasive technologies, such as digital calendar invites or percentage of respondents in the first reminder, may not be effective in increasing response rates. Therefore, a simpler set of communications, which required less effort from the survey designers, might be the still the more cost-effective option. In addition, possible effects of the interventions on the sample composition beyond observable characteristics should be looked at. Researchers who use web surveys as their data collection method should include response bias analysis when testing interventions as it is possible that interventions do not increase the overall response rate but change the sample composition.
Footnotes
Acknowledgments
The authors gratefully acknowledge the Rackham Graduate School for their generous funding and support of this study. Any opinions, findings, conclusions, or recommendations expressed in this article are those of the authors. We are grateful for the support of Conroy Baltzell on the implementation stage of this study.
Declaration of conflicting interests
The author(s) declared no potential conflicts of interest with respect to the research, authorship, and/or publication of this article.
Funding
The author(s) disclosed receipt of the following financial support for the research, authorship, and/or publication of this article: This study received financial support from the Rackham Graduate School, University of Michigan.
Data Availability Statement
Data used in this study have restricted use and cannot be released to other researchers per IRB requirements (ID: HUM00193868, University of Michigan Institutional Review Board).