





Abstract
Keywords
Introduction
Endovascular aneurysm sealing (EVAS) with the Nellix endosystem (Endologix, Irvine, CA, USA) is a newer technique to exclude abdominal aortic aneurysms (AAAs). 1 Contrary to endovascular aneurysm repair (EVAR) with modular devices, the Nellix endosystem does not use suprarenal fixation with anchoring pins or hooks and has no radial force but relies on the apposition of the polymer-filled endobags in the infrarenal neck, common iliac arteries (CIAs), and aortic aneurysm, including the intraluminal aortic thrombus. In particular, the seal between the thrombus and the endobags might be crucial for long-term success as this is the largest contact surface between the endobags and aortic tissue.
A variety of definitions for post-EVAR migration have been reported.2–5 The 2 most commonly used are an increase >5 mm between the top of the fabric relative to anatomical landmarks [eg, the superior mesenteric artery (SMA)] or any migration leading to symptoms or requiring therapy. Post-EVAR migration can easily be detected at follow-up computed tomography angiography (CTA) due to the radiopaque proximal markers of most of the available modular endografts.
The Nellix sac anchoring endosystem with endobags precludes the use of proximal markers. Moreover, after 1 year, postimplantation visualization of the boundaries of the endobags can be difficult with standard CTA due to a decline in the radiodensity of the endobags. 6 Additionally, unilateral displacement of one of the endosystems can occur due to the lack of mechanical connection between the stent frames. 7 Therefore, post-EVAS imaging focusing on endosystem displacement should enable precise 3-dimensional (3D) determination of the stent frames. It is accepted that change in the stent frame position will lead to change in the endobag position, which may precipitate seal deficiencies. This study presents a new methodology to quantify and visualize 3D displacement of the Nellix stent frames in relation to the aortoiliac anatomy.
Methods
CTA Imaging Protocol
CTA images post-EVAS were acquired with a 256-slice CT scanner (Philips Healthcare, Eindhoven, the Netherlands). Patients received breath-hold instructions to minimize motion artifacts during scanning. The scan acquisition parameters were tube potential 120 kV, tube current 200 mA∙s, 0.9-mm pitch, 128×0.625-mm collimation, and 1.5-mm slice thickness. Intravenous contrast (Xenetix 300; Guerbet, France) at a volume of 60 mL per acquisition was administered at a rate of 4 mL/s. An arterial phase scan protocol was used with bolus triggering at a threshold of 150 HU. Follow-up imaging was performed at 30 days and 1 year after EVAS and yearly thereafter.
Displacement Determination
Determination of stent frame displacement between 2 CT scans consists of 3 steps. First, 3D coordinates of 5 anatomical landmarks are manually measured on a 3D workstation. Second, the measured coordinates of the landmarks are automatically aligned via a rigid transformation by the software. Third, displacement is determined automatically with the stent frames in the same coordinate system on both scans by calculating the distance between the stent frames.
Measurements were performed on a 3Mensio vascular workstation (version V8.1; Pie Medical, Maastricht, the Netherlands). Two center lumen lines (CLLs) were drawn semiautomatically through the centers of the 2 Nellix stent frames, covering the trajectory from the SMA to the right and left iliac artery bifurcations. Each center point of the CLLs could be adjusted manually using coronal, axial, and sagittal CT scan reconstructions and the stretched vessel view (Figure 1).

Drawing of the central luminal line in a stent frame in the coronal, sagittal, axial, and stretched vessel views.
Five anatomical landmarks on each post-EVAS CT scan were utilized to define the 3D coordinates of the aortoiliac trajectory: the SMA orifice, the left and right renal artery orifices, and the left and right internal iliac artery orifices. The landmarks were placed on the center of the arteries in axial view and at the inferior border on the sagittal view (Figure 2). The proximal stent end (PSE) and distal stent end (DSE) of the stent frames were marked with three 3D reference markers (Figure 3). Another 3D reference marker was placed at the aortic bifurcation to define the aortic and iliac trajectories of the stent frames.

Placement of a landmark at the orifice of the superior mesenteric artery (SMA). The landmark is positioned at the most caudal perpendicular slice that shows an interruption between the flow lumen of the aorta and the SMA. (A) Perpendicular view, (B) stretched vessel view.

Three markers are placed on the proximal stent end.
Dedicated proprietary software was developed with MATLAB 2016b (The MathWorks, Natick, MA, USA) to perform alignment of the consecutive CT scans and to visualize and calculate the displacement parameters. The stent frame positions on the 30-day CT were used as a baseline. Stent frame positions on consecutive follow-up CT scans were compared with the baseline stent positions.
Using the 3D coordinates of the 5 anatomical landmarks for each of the follow-up scans the algorithm automatically determined the optimal transformation by translation and rotation, which created a uniform 3D CT coordinate system of the aortoiliac trajectory. After the alignment, the 3D coordinates of the stent frames during follow-up were compared with the position at baseline. Displacement of the stent frames was defined as a position change relative to the uniform aortoiliac coordinate system.
Accuracy of the alignment depends on the measurement accuracy of the anatomical landmarks. The error of measuring the anatomical landmarks is defined by the root mean square error (RMSE) between the individual measurements of each landmark by 2 observers. The RMSE also was used to define the total alignment error resulting from the measurement errors, the quality differences of the registered CTA datasets, changes in anatomy, and the registration process for each registration.
Displacement Parameters
Three main types of displacement may be expected after EVAS. First, the entire stent frame may displace distally, either unilaterally or bilaterally (Figure 4A). Second, buckling or bowing of one or both stent frames may occur, which may lead to displacement of the proximal or distal stent ends (Figure 4B). Third, the stent frames may displace simultaneously in a lateral direction without buckling (Figure 4C).

Three different types of displacement of the stent frames: (A) unilateral caudal migration of one of the stent frames, (B) buckling of both stent frames in opposite directions, and (C) lateral displacement of the proximal part of both stent frames.
Migration of the proximal and distal ends of the stent frames can be measured in the same way as with EVAR by measuring the position change in the proximal and distal stent ends relative to the SMA and internal iliac artery orifices, respectively. Buckling or bowing of the stent frames and lateral displacement were assessed by the change in position of the stent frames measured in 1-mm intervals over the length of the stent frames. The position of the aortic bifurcation marker was used to differentiate between the aortic and the iliac trajectory of each stent frame. The stent frame displacement is calculated over the length of the individual stent frames. An example with anterior displacement is shown in Figure 5. The mean and maximum displacements between follow-up CT scans were calculated over the length of the stent frames. When both stent frames bowed in opposite directions, the stent to stent distance increased. Stent to stent distance was calculated between the 3D coordinates of the left and right CLLs over the trajectory between the PSE and the aortic bifurcation in 1-mm intervals. The average and maximum stent to stent distances from the baseline scan were compared with consecutive follow-up CT scans.

Example of 3-dimensional (3D) stent frame visualization from a patient with subtle displacement of the stent frame position at 12-month follow-up (red) compared with baseline at 29 days (gray). Sagittal views of the (A) left and (B) right stent frame positions with caudal and anterior displacement of the proximal and middle part of the stents. (C) Coronal view of both the left and right stent frames. The graphs show the displacement of the (D) left and (E) right stent frames at 12 months compared with baseline over the central lumen line (CCL) from the proximal to distal stent ends. (F) The 3D distance measured between the left and right stent frames from the proximal stent end to the aortic bifurcation at 29 days in gray and at the 12-month follow-up in red plotted against the CLL distance from the superior mesenteric artery.
Validation
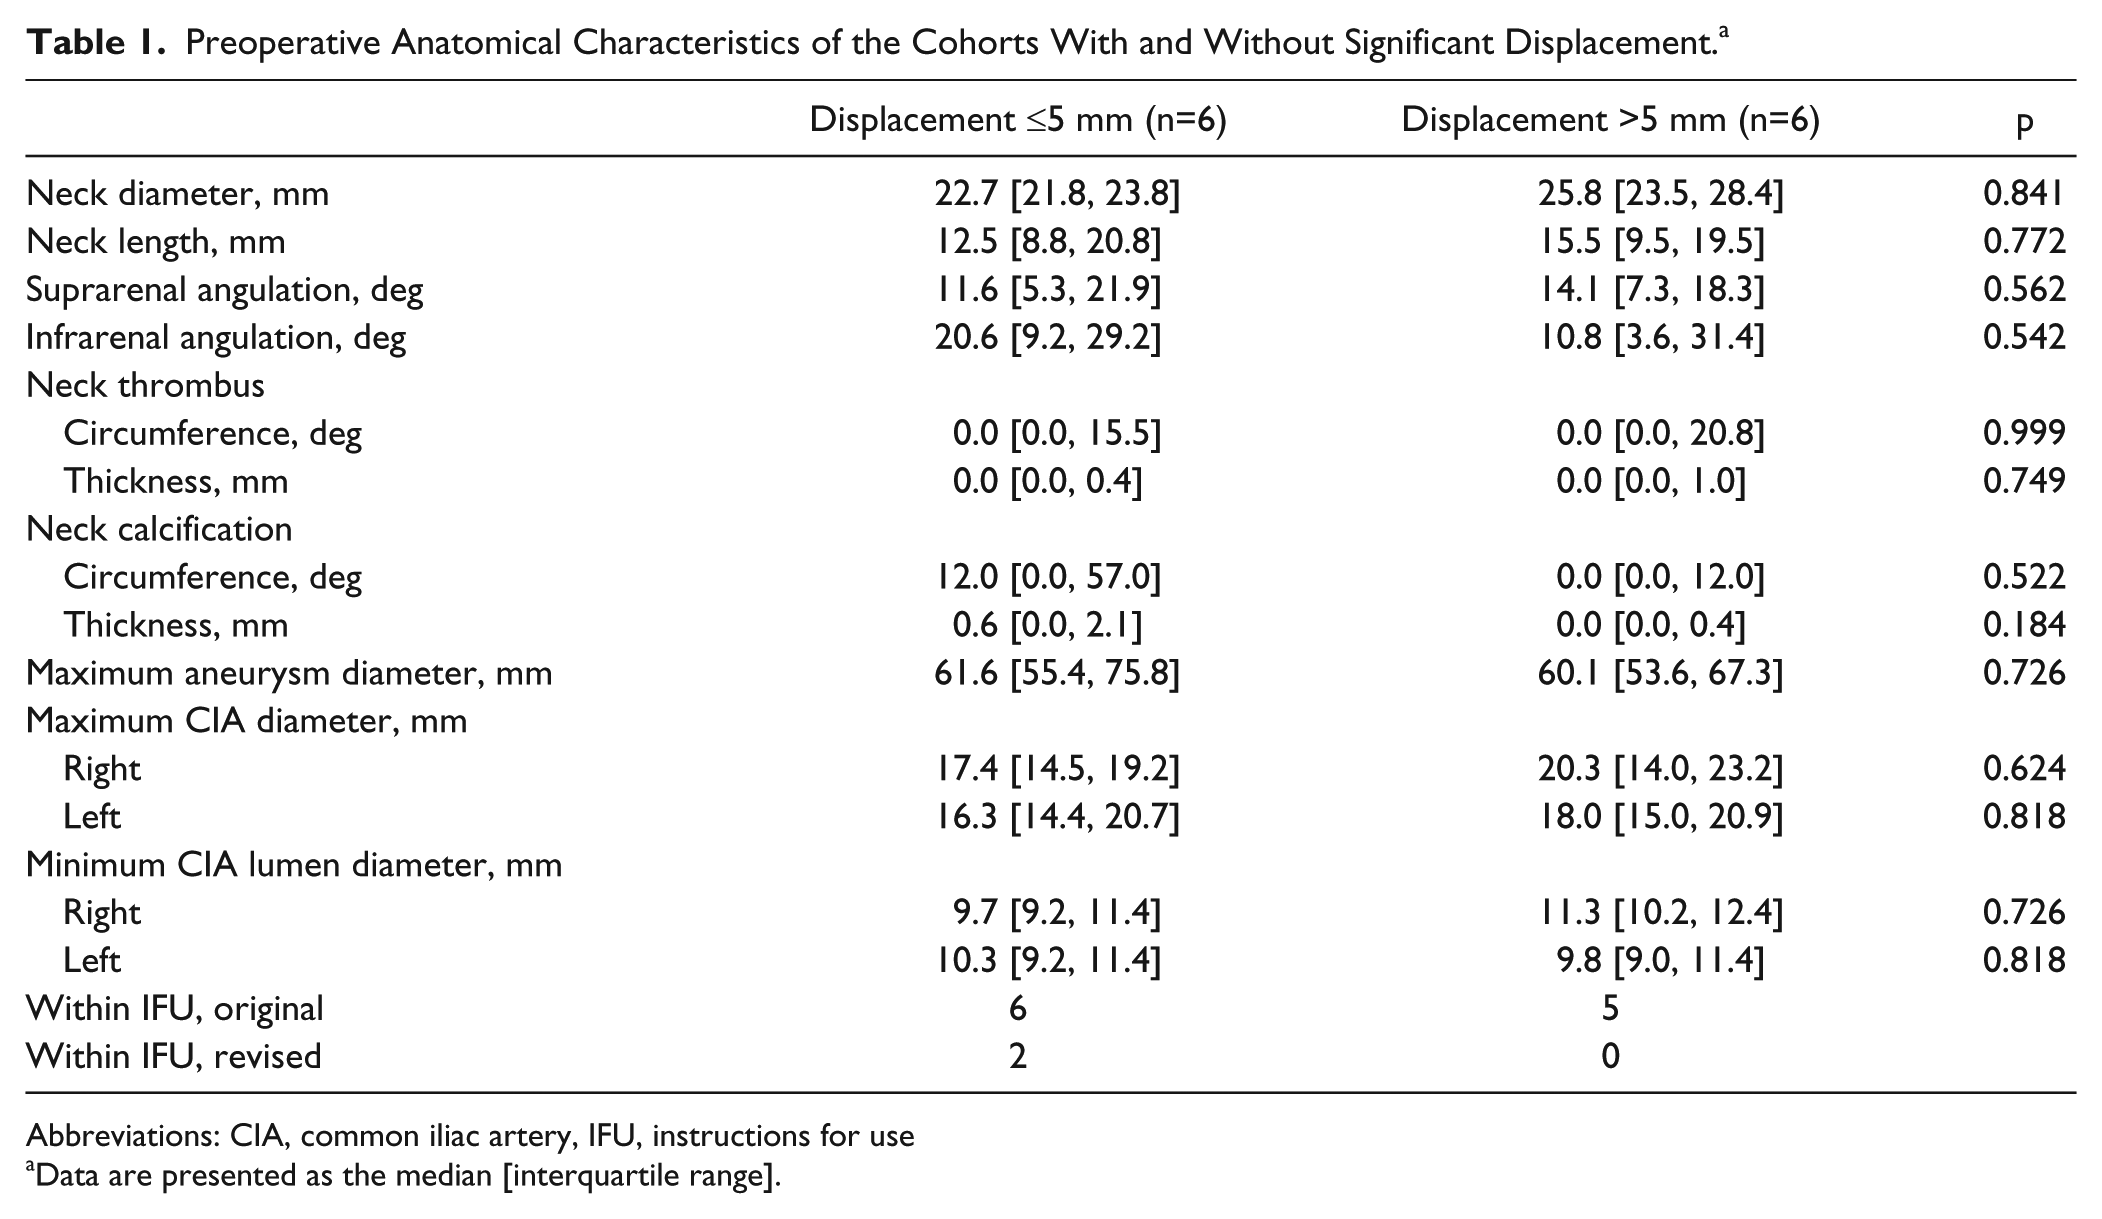
Of 54 patients treated electively with a Nellix endosystem between February 2013 and October 2014, 12 male patients [median age 76.5 years (IQR 72.4, 80.8)] with a minimum 1-year follow-up and at least 2 follow-up CT scans without reported migration were selected for the study. Completion angiography in all cases showed successful sealing without signs of endoleaks. Six patients appeared to have displacement >5 mm at 1 year according to our methodology and served as the test group. Six other anatomically matched patients without displacement >5 mm were randomly selected from the remaining 48 patients. The preoperative anatomical characteristics for the 2 groups are compared in Table 1, the groups did not differ significantly in any preoperative anatomical characteristic. The majority of patients had been treated in compliance with the anatomical characteristics specified in the original instructions for use (IFU); 1 patient with significant displacement (>5 mm) was treated outside the original IFU. In retrospect, 2 control group patients were treated within the revised IFU (Endologix, 2016); all other patients were treated outside the revised IFU.
Preoperative Anatomical Characteristics of the Cohorts With and Without Significant Displacement. a
Abbreviations: CIA, common iliac artery, IFU, instructions for use
Data are presented as the median [interquartile range].
The preoperative anatomical neck characteristics were measured on the centerline reconstructions of the CT scans, including the aortic neck diameter, infrarenal neck length, suprarenal and infrarenal angulation, mural neck thrombus, neck calcification, maximum aneurysm diameter, and maximum and minimum CIA diameters. The baseline was located at the most caudal edge of the lowest renal artery orifice on the reconstructed slice perpendicular to the centerline. Neck diameter reflected the average diameter of 2 orthogonal measurements from adventitia to adventitia at baseline. Neck length referred to the centerline distance from baseline to the first orthogonal slice in which the diameter exceeded 10% of the diameter at baseline.
Aortic angulation was measured as the angle between 3 anatomical landmarks. 8 Suprarenal angulation was measured between the coordinates on the centerline located 20 mm above the baseline, the renal artery baseline itself, and the distal end of the aortic neck. Infrarenal angulation was measured between the coordinates of the lowest renal artery baseline, the distal end of the neck, and 40 mm below the distal end of the aortic neck.
Mural neck thrombus was defined as the circumference of the neck that was covered by >1 mm of thrombus 5 mm below baseline and the average thickness of the coverage. Calcification circumference and thickness were measured similarly to mural neck thrombus. The maximum aneurysm and CIA diameters were measured from the outer wall to outer wall on the centerline reconstruction of the CT scan, while the minimum lumen diameters were measured from inner wall to inner wall.
Statistical Analysis
The data are presented as the mean (range) or medians with the interquartile range (IQR; Q1, Q3) of the 6 patients with displacement and the 6 controls. Anatomical characteristics and displacement parameters of the groups were compared with the Mann-Whitney U test. Interobserver agreement was determined for the displacement parameters. Measurements on each CT scan were performed by 2 experienced observers (R.V. and K.N.). Agreements were calculated with the intraclass correlation coefficient (ICC). The ICC was tested with a 2-way mixed model by absolute agreement. ICC values were interpreted in levels of agreement ranging from poor (0–0.20), fair (0.21–0.40), moderate (0.41–0.60), good (0.61–0.80), to perfect (0.81–1). All tests were 2-tailed; The threshold of statistical significance was p<0.05. Statistical analysis was performed with SPSS software (version 23; IBM Corp, Armonk, NY, USA).
Results
Good interobserver agreement was found for measurement of the maximum change in stent to stent distance (ICC 0.750, p<0.05), with a median absolute difference of 0.5 mm (IQR 0.3, 0.7). Perfect interobserver agreement was achieved for all other displacement parameters (ICC 0.877–0.958; Table 2). The median absolute difference ranged from 0.2 to 0.7 mm. The median RMSEs of the alignment in left-right, anteroposterior, and craniocaudal directions were 0.77 mm (IQR 0.55, 0.97), 0.52 mm (IQR 0.31, 0.63), and 1.18 mm (IQR 0.86, 1.44), respectively. The median RMSEs for measuring the coordinates of the anatomical landmarks were 0.6 mm (IQR 0.3, 0.9), 0.8 mm (IQR 0.3, 1.3), 0.8 mm (IQR 0.5, 1.1), 1.0 mm (IQR 0.6, 1.3), and 1.1 mm (IQR 0.6, 1.7) for the SMA, right and left renal arteries, and right and left CIA bifurcations, respectively.
Comparison of the Displacement Parameters Measured by the 2 Observers. a

Abbreviation: ICC, intraclass correlation coefficient.
Data are presented as the median [interquartile range].
At the 1-year follow-up, the 6 test patients had a mean maximum stent frame displacement of 7.0 mm (range 5.0–9.0) for one or both stent frames; 4 of these patients had proximal stent end displacement >5 mm (mean 5.2 mm, range 0.6–7.0; Figure 6). Five of 6 patients had additional CT follow-up [median 27.4 months (IQR 19.6, 30.4)]. At the latest follow-up, the maximum stent frame displacement (mean 16.2 mm, range 5.2–33.6) and the proximal stent frame displacement (mean 14.9 mm, range 1.6–32.8) increased. Two patients had developed a type Ia endoleak, and 2 patients had developed >15-mm displacement without an endoleak over the course of follow-up.

(A) Displacement parameters for all 12 patients at 1-year follow-up and (B) at last follow-up compared with the 1-month baseline imaging. Patients 1–6 have <5-mm displacement in all parameters, while patients 7–12 have at least 1 parameter >5 mm. *Patients who developed stent occlusion. **Patients who developed a type Ia endoleak. ***Last follow-up is at 1 year for this patient. Disp, displacement; R, concerning the right stent frame; L, concerning the left stent frame.
The 6 control patients (Figure 6, patients 1–6) had a mean maximum stent frame displacement of 2.8 mm (range 2.1–3.4), with a mean proximal stent end displacement of 2.0 mm (range 1.0–3.2) at 1 year. These patients all had additional CT follow-up [median 27.9 months (IQR 24.4, 30.5)]. During follow-up, the maximum stent frame displacement (mean 4.2 mm, range 2.9–6.1) slightly increased, along with the proximal stent frame displacement (mean 3.2 mm, range 2.2–6.1). Two of these patients developed graft occlusion; none of the patients had evidence of an endoleak.
An example of a patient with subtle displacement after 12 months is presented in Figure 5. The displacement is seen in all 3 parameters (Figure 7): Left and right proximal stent ends are displaced by 5.7 and 7.4 mm and left and right distal stent ends by 2.7 and 3.0 mm, respectively. The maximum and average displacements were 4.8 and 6.7 mm, respectively, for the left stent frame and 5.5 and 8.2 mm, respectively, for the right stent frame. There was a maximum 2.3-mm increase (mean 1.2 mm) in the distances between the left and right stent frames. The displacement was most pronounced in the proximal and middle part of the stent frames, located within the neck and the aneurysm, without displacement of the stent frames in the CIAs. This displacement was not reported on the standard radiology examination.

Visualization of the displacement of the right stent frame at 29 days (gray), 12 months (red), 24 months (green), and 34 months (blue).
Analysis of later follow-up CT scans of the same patient showed increased displacement, especially the right stent frame (Figure 6). The maximum stent frame displacement continued to increase steadily during follow-up. The right maximum displacements at 12, 24, and 42 months were 8.2, 15.1, and 33.6 mm, respectively; the left maximum displacements were 6.7, 10.7, and 10.8 mm at the same time points. This resulted in a large type Ia endoleak visible on the 42-month follow-up scan. No signs of migration were reported until the 42-month scan, after which open surgical removal of the Nellix endosystem and aortobi-iliac repair was performed.
Discussion
Because the Nellix endosystem lacks active proximal fixation, successful treatment with EVAS depends on the stability of the endobags and stent frames in the aortoiliac trajectory. Not only hostile neck morphology but also changes in aneurysm sac morphology may be risk factors for failure of sealing and fixation of the endosystems. The morphology of intraluminal thrombus may change over time and might cause loss of seal and displacement along the Nellix endosystem trajectories. A small aneurysm lumen diameter may impair sufficient filling of the endobags, which may lead to insufficient support of the stent frames and higher risk of buckling or bowing. Therefore, in addition to regular follow-up of sealing failures, such as migration, endoleak, and sac growth, it is essential to evaluate the stability of the endobags and stent frames during follow-up.
Contrary to conventional modular bifurcated EVAR devices, the endobags of the Nellix endosystems are not interconnected. Therefore, 3D displacement of each of the stent frames may occur. Displacement should therefore always be assessed for both stent frames separately, as well as the stent to stent distance.
In clinical practice, stent migration is often assessed as the increased distance relative to an anatomical landmark on sagittal and coronal views. However, the Nellix endograft may displace in a lateral direction, without any change in distance between the proximal stent end and the anatomical landmark, so assessment of craniocaudal migration alone is not sufficient. Among the 6 patients who were identified with >5 mm maximum stent frame displacement after 1 year, 2 patients went on to develop a type Ia endoleak and 2 patients showed substantial increase in displacement during further follow-up without sign of an endoleak. On the contrary, the patients with <5-mm displacement after 1 year had smaller increases in displacement and did not develop proximal seal failure. Standard CTA assessment could not differentiate between these patients, but the presented 3D method did identify patients with displacement more accurately and at an earlier stage.
Dorweiler and coworkers 7 have also analyzed the 3D stability of the EVAS system by determining the shape of the stent frames during follow-up, regardless of the aortoiliac anatomy. Both buckling of the stent frames within the aneurysm sac and ventral displacement of the stent frames were described, which is in line with our findings. Additionally, the methodology presented here relates the 3D position of the stent frames to the aortoiliac anatomy, which enables quantification and visualization of lateral or craniocaudal displacement and buckling of the stent frames in opposite directions.
Since the commercial release of the Nellix, 4 retrospective and 2 company-initiated prospective studies have been published.9–15 Böckler and coworkers 9 studied 171 patients from 7 hospitals with a technical success of 99%. During short-term follow-up (median 5 months), 3% of patients suffered a type Ia endoleak and 2% a type Ib endoleak. The EVAS Forward US IDE trial included 150 patients.11,12 At 1-year follow-up, 4 (3.1%) patients had an endoleak (one type Ib and 3 type II). Migration >10 mm occurred in 3 patients. In the EVAS Forward Global Registry, 13 277 patients were enrolled to treat an unruptured AAA. Fourteen endoleaks were detected at 30-day follow-up: 8 type Ia, 1 type Ib, and 5 type II. Between 30 days and 1-year follow-up, 4 new type Ia endoleaks were detected; all were treated. Freedom from reinterventions was associated with anatomical criteria; in the patient cohort treated within the (original) IFU, the 1-year reintervention rate was 2% vs 14% in the patient cohort treated outside the IFU. In our own experience during the time frame of this study, 2 (3.7%) type Ia endoleaks and no type II endoleaks were seen in the 54 patients.
No robust data with long-term follow-up are available yet for the Nellix endosystem. Therefore, careful follow-up is mandatory, and the use of this new methodology can assist early detection of possible failure, especially displacement of the stent frames with consequences for migration and seal failure.
Limitations
This study was designed to validate a methodology for determining displacement of the Nellix endosystem in 2 small patient cohorts, one with and one without significant displacement. One limitation of the current methodology is that misplacement of the anatomical landmarks may result in poor alignment of the aortoiliac anatomy. Additionally, changes of the aortoiliac anatomy in the follow-up period may cause misalignment of the anatomical references. This misalignment is detected with an increased RMSE of the landmark measurements. However, the RMSE of the alignment was <2 mm for the measurements in this study. The limited number of patients in this study makes it difficult to determine cutoff values for the displacement parameters. Also, identifying the association between displacement and preoperative anatomical characteristics, such as iliac tortuosity, is not valid with the presented data.
The proprietary software is still an investigational product and is therefore not yet available for daily clinical practice. Further development and a large clinical validation trial will be performed soon. However, physicians should be aware that displacement of the Nellix endosystem is not limited to distal migration alone, and patients should be followed accordingly. A large clinical validation study with consecutively treated patients should be performed to determine the incidence of displacement and the predictive value of each of the displacement parameters for failure of effective seal.
Conclusion
Post-EVAS displacement of the Nellix stent frames is not limited to distal migration. The presented software identified craniocaudal displacement as well as lateral displacement and buckling of the stent frames over the length of the Nellix stent frames. 3D assessment of positional changes of the stent frames is essential to detect early failures of the sac anchoring and sealing mechanisms of the Nellix endosystem.
Footnotes
Declaration of Conflicting Interests
The author(s) declared no potential conflicts of interest with respect to the research, authorship, and/or publication of this article.
Funding
The author(s) received no financial support for the research, authorship, and/or publication of this article.