






Abstract
Keywords
Introduction
As abdominal aortic aneurysms (AAAs) grow in size, the turbulent blood flow in the aneurysm sac creates conditions that promote intraluminal thrombus (ILT) formation by platelet deposition.1–3 As a consequence, AAAs frequently develop ILT, which is known to have multiple biochemical and biomechanical implications.1–3 Biomechanically, AAA growth and rupture occur when the circulatory stress that acts on the vessel wall exceeds aortic wall strength.4,5 Infiltration of inflammatory leucocytes, neovascularization, and activation of proteolytic enzymes in the aneurysm wall are all involved in degradation of the extracellular matrix, resulting in aneurysm wall weakening.4,5 From this perspective, the presence of ILT can play a significant role in the evolution of AAAs because it can alter wall stress6–8 and the inflammatory composition of the vessel wall.9,10
The ILT has a minor role in open surgical or conventional endovascular repair planning, but since the advent of endovascular aneurysm sealing (EVAS), the amount of ILT has assumed more importance in the treatment of AAAs.11,12 According to the updated instructions for use (IFU) of the Nellix EVAS System (Endologix Inc, Irvine, CA, USA), the ratio of maximum aortic diameter to the maximum aortic blood lumen volume should be <1.4. 13 This means that if the volume of ILT is too excessive, this ratio could potentially exceed this threshold. Notably, in EVAS planning, the ILT volume plays an important role in the amount of endobag filling required to provide stability to the seal.11,12
There is limited literature regarding the temporal change of the ILT in AAAs. Previous research from our group showed potential changes (shrinkage) in the volume of aortic thrombus post EVAS. 13 The aim of this study was to quantify and further characterize the temporal changes in aortic, lumen, and ILT volumes over time and the potential relevance that may have on the suitability for EVAS.
Methods
Study Design and Patient Sample
The department’s database was interrogated to identify all AAA patients who had undergone 2 serial preoperative computed tomography angiograms (CTAs) from 1 to 18 months prior to endovascular aneurysm intervention. Most standard EVAR/EVAS procedures are based on a single CTA; however, fenestrated devices often incur a time delay for planning and manufacture that may necessitate a second CTA to ensure no morphological change. This group of patients was therefore chosen to provide a cohort for the study. Excluded were patients whose AAA contained no thrombus (thickness <5 mm at all points within the AAA on cross section), whose second CT was performed for a ruptured AAA, and in whom the time interval between the CTAs exceeded 18 months. The search identified 51 patients (mean age 76±7.1 years; 36 men) with AAAs measuring a median 62 mm treated between November 2008 and April 2015. The reasons for having 2 preoperative CTAs were significant delays between referral and treatment due to planning and manufacture delays (eg, late arrival of ordered devices/grafts) or unforeseen admissions for different pathologies (eg, myocardial infarction).
CTA Measurements
All CTA measurements were obtained by an experienced radiologist and a vascular surgeon using Carestream software (version 11.4.1.1011; Carestream Health Inc, Rochester, NY, USA). The volume-measuring techniques and the interobserver variability were described in a previous report. 12
Data Analysis
The primary outcome measure was the change in ILT, lumen, and AAA volumes between the 2 preoperative scans. The secondary outcome measures were the relationships among volume changes and the association of volume changes with the time interval between the 2 preoperative CTAs.
All distributions were assessed for normality with the Kolmogorov-Smirnov test. As most variables (and their differences) were not normally distributed, they were described with medians (interquartile range, IQR) and compared with the Wilcoxon rank sum test. Correlations were expressed with the Spearman rank correlation coefficient (rs). The threshold of statistical significance was p<0.05. Statistical analysis was performed using SPSS software (version 22.0; IBM Corporation, Armonk, NY, USA).
Results
The changes in AAA, ILT, and lumen volume are shown in Table 1 and Figure 1. A strip chart describing the follow-up intervals is seen in Figure 2. Between the 2 CTAs, 46 (90%) of 51 AAAs increased in volume; of these, 44 also had an increase in ILT volume. In 2 patients, the AAA expanded but the ILT volume decreased. Five patients had an aneurysm that did not change in volume between the 2 CTAs; of these, 3 had an increase in ILT volume. Lumen volume increased in 31 patients and decreased in 20.
Abdominal Aortic Aneurysm, Intraluminal Thrombus, and Lumen Volume Changes Between the 2 Serial Computed Tomography Angiograms. a
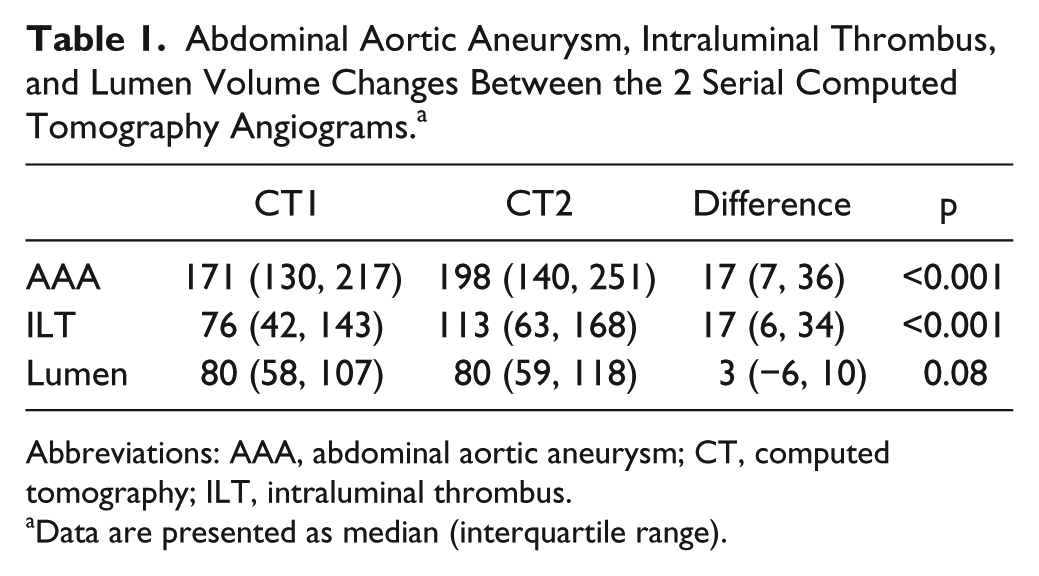
Abbreviations: AAA, abdominal aortic aneurysm; CT, computed tomography; ILT, intraluminal thrombus.
Data are presented as median (interquartile range).

Changes in abdominal aortic aneurysm, intraluminal thrombus, and lumen volumes. The boxes represent the interquartile range, the line is the median, the error bars display ranges, and dots represent outliers.

Chart showing the time intervals between the 2 computed tomography angiograms in the cohort.
Over the median 7-month interval (IQR 4, 10) between the scans, there was a median 17-mL (10%) increase in the AAA volume across the entire cohort. There was a strong correlation between changes in AAA volume and ILT volume (rs=0.859; p<0.001; Figure 3), which remained significant after adjustment for initial volumes (rs=0.815; p<0.001). There was no correlation between AAA volume and lumen volume growth (rs=0.222, p=0.117) or between lumen and ILT volume growth (rs=−0.252, p=0.074) adjusted for initial size. There was no correlation between the time interval between the 2 CTAs and changes in AAA volume (rs=0.115; p=0.421), changes in ILT volume (rs=0.084; p=0.599), or changes in lumen volume (rs=0.060; p=0.676). These correlations remained nonsignificant after adjustment for the initial volumes (rs=0.108, rs=0.130, and rs=0.224, respectively).

Relationship between changes in abdominal aortic aneurysm and intraluminal thrombus volumes (Spearman coefficient rs=0.859; p<0.001).
Between the 2 scans, 12 (24%) of the 51 AAAs crossed the new Nellix maximum sac/lumen diameter ratio of 1.4. 14 Of these, 11 AAAs had an initial ratio <1.4 in the first scan, while they had a ratio >1.4 in the second scan. The 12th AAA had an initial ratio >1.4, which became <1.4 in the second scan. Finally, another AAA had an initial ratio of 1.25 in the first scan and a ratio of 1.4 in the second scan. The median ratio for all 51 AAAs was 1.37 (IQR 1.02, 2.2) in the first scan, which increased to 1.46 (IQR 1.0, 2.29) at the second scan.
Discussion
This study demonstrates that the increase in AAA volume over time is largely occupied by additional ILT. In the interval between the 2 serial CTA scans, the AAAs increased in volume by ~10%. However, although the median lumen volume remained static, the proportion of AAAs filled by ILT rose from 44% to 57%. These results have important implications. First, although the median lumen volume remained unchanged, the individual lumen volumes changed in all patients (increased in 31 and decreased in 20). So not only does the maximum AAA diameter change, but the ILT and lumen volumes also change with time. Thus, any significant delays between AAA repair planning and the procedure itself could render the preoperative measurements out of date. Second, these observations imply that the additional ILT within the AAA is freshly deposited, which has implications for EVAS, particularly with regard to planning and device deployment.
According to the revised IFU for the Nellix, the maximum sac to aortic lumen diameter ratio should be <1.4. 13 If the interval between planning and endograft implantation is long enough to allow AAA growth, then the maximum diameter ratio will increase. This may cause some patients to reach or cross this new Nellix threshold, as happened to a quarter of the patients in our study. Another potential problem that a delay between planning and the EVAS procedure may cause is related to deployment. The volume of polymer required to fill the endobags is based on the aortic lumen volume calculation from the preoperative CTA. It is our strong recommendation that a duplex scan should be performed prior to EVAS if the procedure has been delayed. This will confirm the presence or absence of volume changes and determine if a new CTA should be done.
On the other hand, the significant increase of ILT volume without concomitant lumen change indicates that the new ILT deposited on the medial and luminal layers may change the mechanical properties of the compressed ILT. In fact, the abluminal layer of ILT has a higher compressive stiffness compared to the luminal layer. 14 Moreover, thrombus compressibility during the cardiac cycle can vary significantly among patients, irrespective of thrombus volume and pulse pressure. 15 A study from the Netherlands showed that AAAs with high ILT signal intensity at T1-weighted magnetic resonance imaging demonstrated 8-fold higher AAA growth rates compared to AAAs without ILT (p=0.004). 16 These results suggest that the prefill (during which the ILT is compressed) may alter the structure of the ILT. These alterations in ILT structure could be different according to the proportion of lumen, medial, and abluminal thrombus and therefore have implications in terms of volume calculation and EVAS outcome. Finally, the polymer-filled endobags cause compression of the ILT, which reduces the ILT volume while slightly increasing the AAA volume directly following EVAS.11,12 This may be different in fresh thrombus.
Among the factors involved in AAA growth rate (eg, smoking history, initial aortic diameter, etc 17 ), the size of the ILT has a positive association with AAA growth rate. 18 Although our study did not identify a correlation between growth rate and the volume of initial thrombus, one must consider the small cohort and relatively short time frame involved. Our study does not challenge the association between time, ILT volume, and AAA growth rate, but rather it quantifies the changes in thrombus volume in keeping with AAA changes.
CTA produces static images of the aorta. The size of the aorta varies during the cardiac cycle, reaching maximum diameter in systole.19,20 As much of the cardiac cycle is spent in diastole, most CTA images are acquired when the aortic diameter is smallest.19,20 With modern fast scanners, the entire AAA may be imaged in this phase. Aortic thrombus is a dynamic entity, which has also been shown to change with the cardiac cycle. 16 CTA scan definition of the lumen-thrombus interface depends on the timing of image acquisition with the contrast bolus: poor definition of this interface may lead to measurement errors.19,20 Growth rates between CTAs taken with an interval of <6 months seem unreliable and highly sensitive to interobserver and interimaging variation.
Limitations
Our study has some limitations, such as the relatively small sample size, the retrospective design, the potential error related to our method of measurement, and the limitation of CTA in producing aortic images of sufficient quality to allow accurate measurements.19,20 Because of the retrospective nature of our study, preoperative CTA protocols were not standardized. As our unit is a tertiary referral center, the CTAs were performed in 7 different regional hospitals (although all scans were judged of sufficient quality for planning purposes). Another limitation of our study was that patient demographics were not available.
Conclusion
The current study demonstrates that as AAAs grow the increase in aortic volume is largely occupied by additional ILT formation. With deposition of ILT over time, the ratio of thrombus to lumen (as well as the ratio of maximum sac diameter to maximum lumen diameter) may increase. These findings may have implications for EVAS planning and device deployment, so it is recommended that a duplex scan be performed prior to EVAS if the procedure has been delayed to determine the need for a new CTA.
Footnotes
Declaration of Conflicting Interests
The author(s) declared the following potential conflicts of interest with respect to the research, authorship, and/or publication of this article: Richard G. McWilliams has received a research grant from Endologix. Francesco Torella and Robert K. Fisher have received honoraria and research grants and are compensated proctors for Endologix.
Funding
The author(s) received no financial support for the research, authorship, and/or publication of this article.
