
Abstract
Keywords
Introduction
Thoracic endovascular aortic repair (TEVAR) is a widespread treatment for exclusion of descending thoracic aortic aneurysms. Type I endoleak (1.4%–19.6%) and endograft migration (0.7%–3.9%) can occur during follow-up, especially in challenging morphology, as a result of complex hemodynamic forces in the thoracic aorta.1–3 In the literature, type I endoleaks after TEVAR are often not differentiated between type Ia and Ib, although there are substantial differences in causes and treatment strategies.2,4–8
To prevent proximal and distal type I endoleak and device migration, effective seal and fixation are required in the proximal and distal landing zones. The prototype Vascular Image Analysis (VIA) software (Endovascular Diagnostics B.V., Utrecht, the Netherlands) has been developed to assess apposition, dilatation, and position of endografts in the aorta on standard computed tomography angiography (CTA) scans. Our group has demonstrated that this software can assess these endograft dimensions in the infrarenal neck after endovascular aneurysm repair (EVAR) more accurately than standard follow-up CTA scans alone. 9 Decreasing apposition between the endograft fabric and the aortic wall, increasing endograft dilatation, and increasing distance between fabric and renal arteries preceded proximal type I endoleak and migration in a previous study in the abdominal aorta.10,11
This study sought to validate the VIA software for assessing apposition, dilatation, and position of the endograft in the proximal and distal landing zones after TEVAR for descending thoracic aortic aneurysms. Two patient cases are included to illustrate the added value of this software compared with standard CTA reports in TEVAR follow-up.
Materials and Methods
In previous studies, VIA software was designed and validated to assess apposition, dilatation, and position of the endograft in the infrarenal neck after EVAR.9,10 To apply this software in the descending thoracic aorta, a few adjustments have been made to ensure that the software is applicable. These adjustments include additional calculations at the distal landing zone, boundary calculations from 2 anatomical landmarks [left subclavian artery (LSA) and celiac trunk (CT) with TEVAR vs renal arteries with EVAR], and a few methodological changes to cope with the curve of the aortic arch (see Supplement A; available in the online version of the article). Moreover, due to the steeper curve in the thoracic aorta compared with the abdominal aorta, further study was needed to investigate whether the measurements were accurate.
For validation of the adjusted methodology, TEVAR patients were selected from a vascular database (St Antonius Hospital) according to the following inclusion criteria: (1) the patient was electively treated for a degenerative aneurysm in the descending thoracic aorta without overstenting of the LSA or CT; (2) no adjunctive implants had been used, such as cuffs, chimney grafts, or bare metal stents; (3) at least 1 postoperative (<60 days after TEVAR) CTA scan was available with sufficient quality (slice thickness ≤3 mm and arterial contrast phase). Based on these criteria, 22 patients (median age 75.5 years; 11 men) who underwent elective TEVAR for treatment of a degenerative descending thoracic aortic aneurysm were included in the study. The Valiant Captivia endograft (Medtronic, Santa Rosa, CA, USA) was used to treat 19 patients, of whom 7, 5, and 7 patients received 1, 2, and 3 endograft components, respectively. The cTAG (W. L. Gore & Associates, Inc, Flagstaff, AZ, USA) was used to treat 2 patients, and a Relay endograft (Bolton Medical, Sunrise, FL, USA) was used in 1 patient. The first postoperative CTA showed 1 patient had a type Ia endoleak and 2 patients had a type Ib endoleak.
CTA Scan Protocol
In the selected patients, CTA images had been acquired on a 256-slice CTA scanner (Brilliance ICT; Philips Healthcare, Best, the Netherlands). Scan parameters were 120-kV tube voltage, 170-mA tube current time product, 0.45-mm increment, 0.27-second rotation time, and 128×0.625-mm collimation. Slice thickness ranged from 0.9 to 3 mm. Scanning was performed with electrocardiogram triggering in 7 to 12 cycles, with reconstructions at 78% of the scanning phase. A total of 80 mL Xenetix 300 (Guerbet, Villepinte, France) was administered intravenously with a rate of 4 mL/s.
Measurement Protocol
Measurements were performed independently by 2 experienced observers (K.N. and R.S.) on a 3Mensio Vascular workstation (version 9.1; Pie Medical, Maastricht, the Netherlands). A center lumen line (CLL) was drawn semiautomatically by both observers through the flow lumen of the aorta between the ascending aorta proximal of the LSA and the abdominal aorta distal to the CT. Proximal and distal aortic neck diameters were measured from adventitia to adventitia at the level of the orifices of the LSA and the CT, respectively.
On preoperative CTA scans, the end of the proximal landing zone was determined as the position where there was a 15% increase in aortic diameter compared with the aortic diameter at the level of the LSA. 12 The end of the distal landing zone was determined as the location proximal to the CT orifice where there was a 15% increase in aortic diameter compared with the aortic diameter at the level of the CT (Figure 1A). On postoperative CTA scans, the ends of the proximal and distal apposition (Figure 1B) were determined as the location where circumferential apposition of the endograft with the aortic wall was lost.
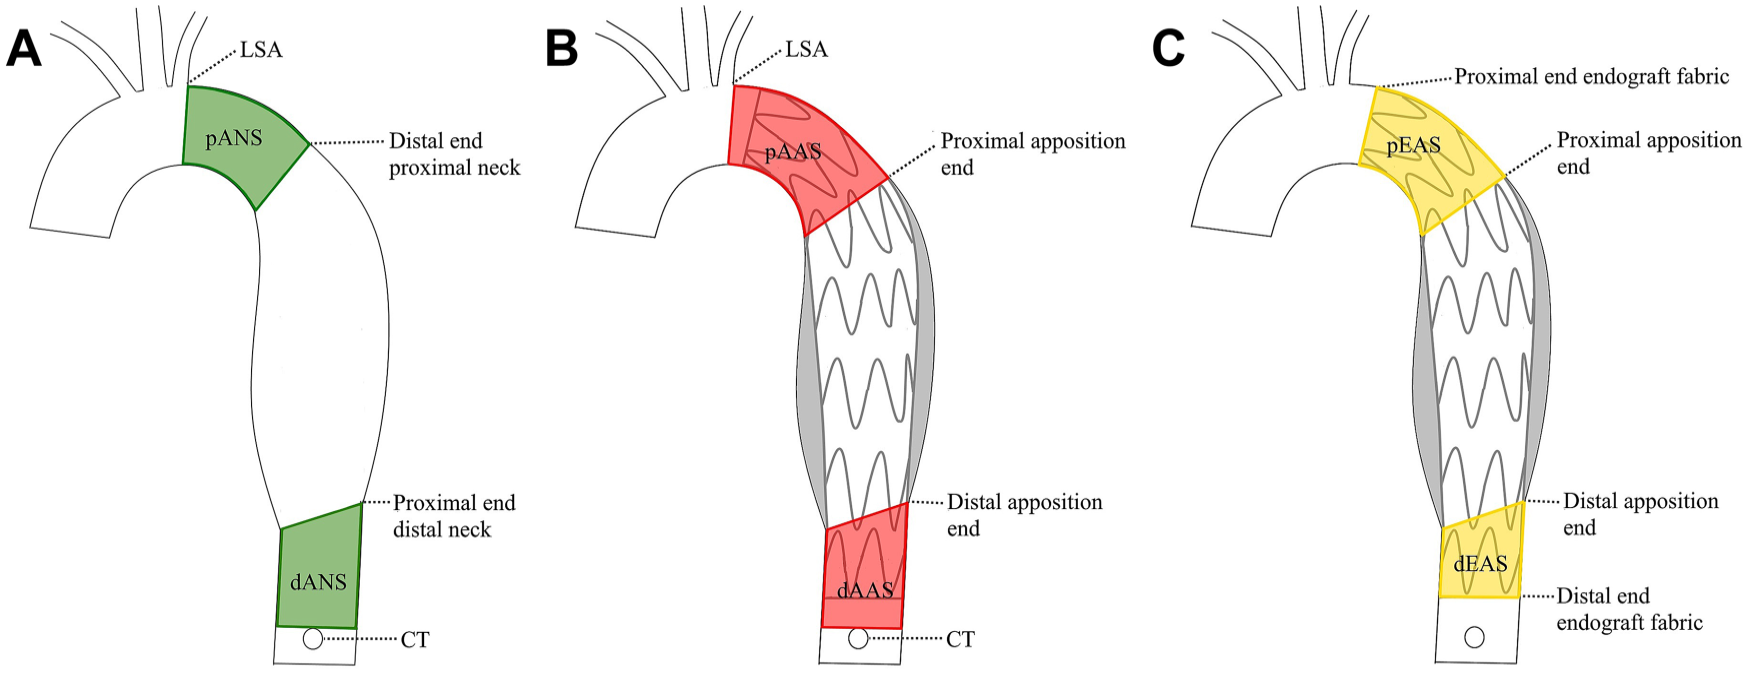
The thoracic aorta (A) before and (B, C) after thoracic endovascular aortic repair (TEVAR). (A) The pre-TEVAR boundaries of the proximal aortic neck surface (pANS) are (1) the intersection plane on the aortic mesh orthogonally to the center lumen line (CLL) at the position of the left subclavian artery (LSA) orifice and (2) the end of the proximal neck (the intersection plane on the aortic mesh orthogonally to the CLL at the position where there is 15% increase in neck diameter compared to the neck diameter at the LSA). The boundaries of the distal aortic neck surface (dANS) are (1) the end of the distal neck [the intersection plane of the aortic mesh orthogonally to the CLL proximal to the celiac trunk (CT) where there is a 15% increase in neck diameter compared with the neck diameter at the CT] and (2) the intersection plane on the aortic mesh orthogonally to the CLL located at the proximal border of the CT orifice. (B) The post-TEVAR proximal and distal boundaries of the available apposition surface (pAAS and dAAS) are, respectively, the LSA and CT, and the location where circumferential apposition (red line) with the aortic wall is lost. (C) The proximal and distal endograft apposition surfaces (pEAS and dEAS) are located between the proximal and distal ends of the endograft fabric and the end of the apposition (where circumferential apposition between the endograft and aortic wall is lost).
Three-dimensional (3D) coordinates were obtained at the distal orifice of the LSA, proximal orifice of the CT, and locations of the proximal and distal necks or apposition ends. Four coordinate markers were positioned circumferentially at the proximal and distal ends of the endograft fabric on the postoperative CTA scans. The coordinates, CLL, and a mesh of the aortic flow lumen were exported from 3Mensio into the VIA software.
Endograft Apposition
Proximal and distal aortic surfaces were determined over the aortic lumen mesh between proximal and distal boundaries. They were calculated as the preoperative aortic neck surface (ANS), which was the surface that could initially be used for sealing in the preoperative neck (Figure 1A), and the postoperative available proximal (p) and distal (d) apposition surfaces (AAS), which were the surfaces between the LSA (for pAAS) and the CT (for dAAS) and the position where circumferential apposition between the endograft and aortic wall was lost (Figure 1B). The boundaries were defined as the intersection plane over the aortic mesh orthogonally to the CLL at the location of the boundary coordinates. The calculated neck surface areas are reported in mm2.
The proximal and distal endograft apposition surfaces (pEAS and dEAS) were defined as the surfaces where there is 360° contact between the endograft and aortic wall. These surfaces are located between the ends of the endograft fabric and the position where circumferential apposition is lost (Figure 1C). The apposition surface areas were defined in mm2 and as the percentage of the AAS that was covered by fabric. When tilting of the endograft resulted in coverage beyond the LSA/CT baseline, EAS was limited to 100% coverage of the AAS. The shortest apposition length (pSAL and dSAL) was calculated as the shortest distance between the apposition boundaries over the curve of the aorta (Figure 2). The SAL determines the minimum length of seal between the endograft and aortic wall. This is the shortest link in the apposition and not visible on a conventional CTA.
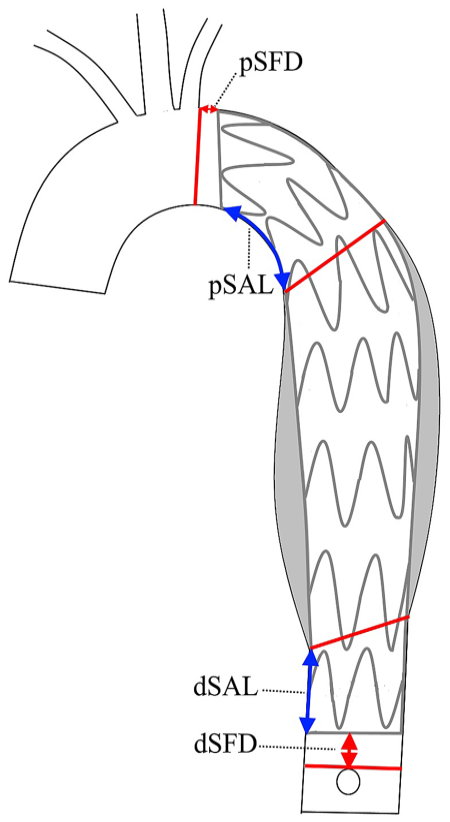
The shortest apposition lengths (SALs) are calculated as the shortest distances between the circumferential endograft fabric and the circumferential apposition boundaries [proximal SAL (pSAL) and distal SAL (dSAL); blue arrows]. The shortest fabric distances are calculated as the shortest lengths between the intersection plane of the left subclavian artery orthogonally to the center lumen line and the intersection plane of the celiac trunk orthogonally to the center lumen line and the circumferential endograft fabric [proximal shortest fabric distance (pSFD) and distal SFD (dSFD); red arrows].
Endograft Position and Dilatation
The proximal shortest fabric distance (pSFD) is the shortest distance over the curve of the aorta between the LSA and the proximal end of the endograft fabric (Figure 2). The distal shortest fabric distance (dSFD) is calculated similarly between the distal end of the endograft fabric and the CT. The SFD reflects the accuracy of landing the endograft near the LSA and CT orifices.
The endograft inflow and outflow diameters were defined as the average diameters at the proximal and distal ends of the endograft fabric. These were calculated from the circumference over the aortic mesh in the plane of the 4 endograft marker coordinates. The inflow and outflow diameters were also calculated as the percentage of the diameters of the proximal and distal ends of the implanted thoracic endograft.
Statistical Analysis
Normality of the data could not be assumed because of small numbers and skewed distribution; thus, the data are presented as medians with interquartile range (IQR: Q1, Q3). The interclass correlation coefficient (ICC) between the 2 observers was determined for position, dilatation, and apposition parameters to test the interobserver variability. The ICC was tested with a 2-way mixed model by absolute agreement. ICC values range from poor (0–0.20), fair (0.21–0.40), moderate (0.41–0.60), good (0.61–0.80) to excellent (0.81–1) agreement. The repeatability coefficient was calculated as 1.96 times the standard deviation of the difference between the measurements of the 2 observers. Ninety-five percent of the differences between the pair measurements are within the repeatability coefficient. 13 P values were considered significant at a 2-tailed α of <0.05. Statistical analysis was performed using SPSS software (version 23; IBM Corp, Armonk, NY, USA).
Results
In the 22 study patients, the median interval until the first postoperative CTA scan was 2 days (IQR 2, 3). Maximum aortic aneurysm diameter was 65.8 mm (IQR 58.9, 75.6). Median length of the thoracic aorta from the LSA to the CT was 293.8 mm (IQR 263.8, 326.6). Median aortic diameters at the level of the LSA and CT were 32.0 mm (IQR 29.3, 33.5) and 32.2 mm (IQR 27.4, 35.1), respectively.
Excellent agreement was found for all variability measurements between the 2 observers, with an ICC between 0.821 and 0.995 (Table 1). The distal measurements showed larger differences compared with the proximal measurements for surface and shortest apposition length calculations (mean difference was 10% vs 2% of the mean for AAS, 12% vs 5% for EAS, and 16% vs 8% for SAL, respectively). Inflow and outflow diameters of the endografts showed low variability, with a mean difference of 0.1 mm; 95% of the interobserver difference was within 1.8 mm. Proximal and distal shortest fabric distances were similar, with mean lengths of 40.6 and 40.2 mm, respectively, with mean differences of 1.0 and 0.9 mm (both mean differences were 2% of the mean), respectively.
Interobserver Variability for Measuring Apposition and Position Parameters of the Proximal and Distal Sealing Surfaces.
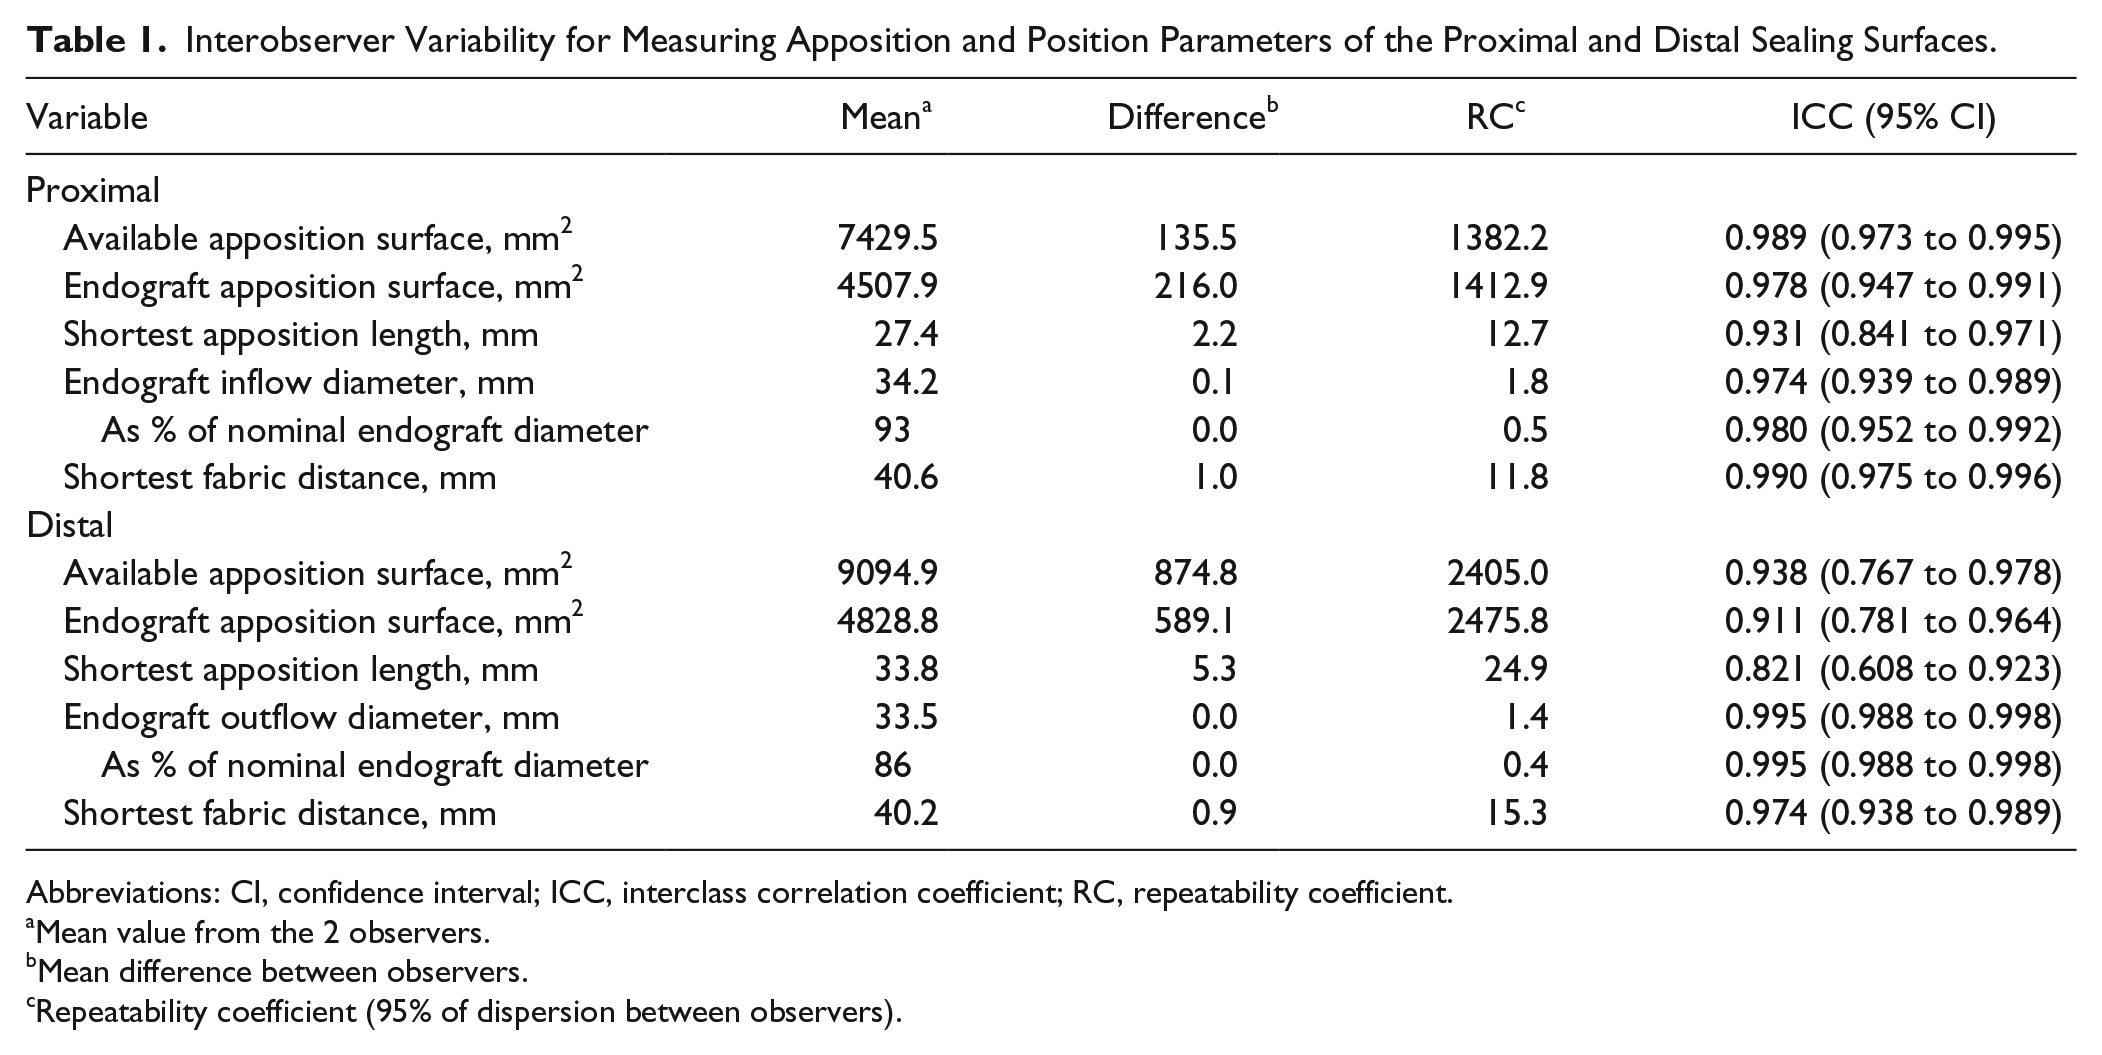
Abbreviations: CI, confidence interval; ICC, interclass correlation coefficient; RC, repeatability coefficient.
Mean value from the 2 observers.
Mean difference between observers.
Repeatability coefficient (95% of dispersion between observers).
Case 1: Type Ia Endoleak During Follow-up
Figure 3 and Table 2 show a patient who underwent TEVAR in 2006. The patient was treated with 3 Valiant endograft components having a proximal diameter of 36 mm and a distal diameter of 44 mm. Additional CTA imaging at 3 months showed a type II endoleak, which was resolved at 33 months. At 70 months after TEVAR, a type Ia endoleak was reported. The VIA software, however, revealed a decrease in proximal endograft apposition and full dilatation of the endograft fabric during the first 18 months, which indicated failure of the proximal seal. This was not detected on regular CTA imaging. Distally, the endograft diameters reached full dilatation and the dSFD increased slightly during the first 18 months, yet coverage remained stable. The type II endoleak could have persisted as an undetected low-flow endoleak, which may explain the decrease of the proximal landing zone from the distal edge during follow-up.
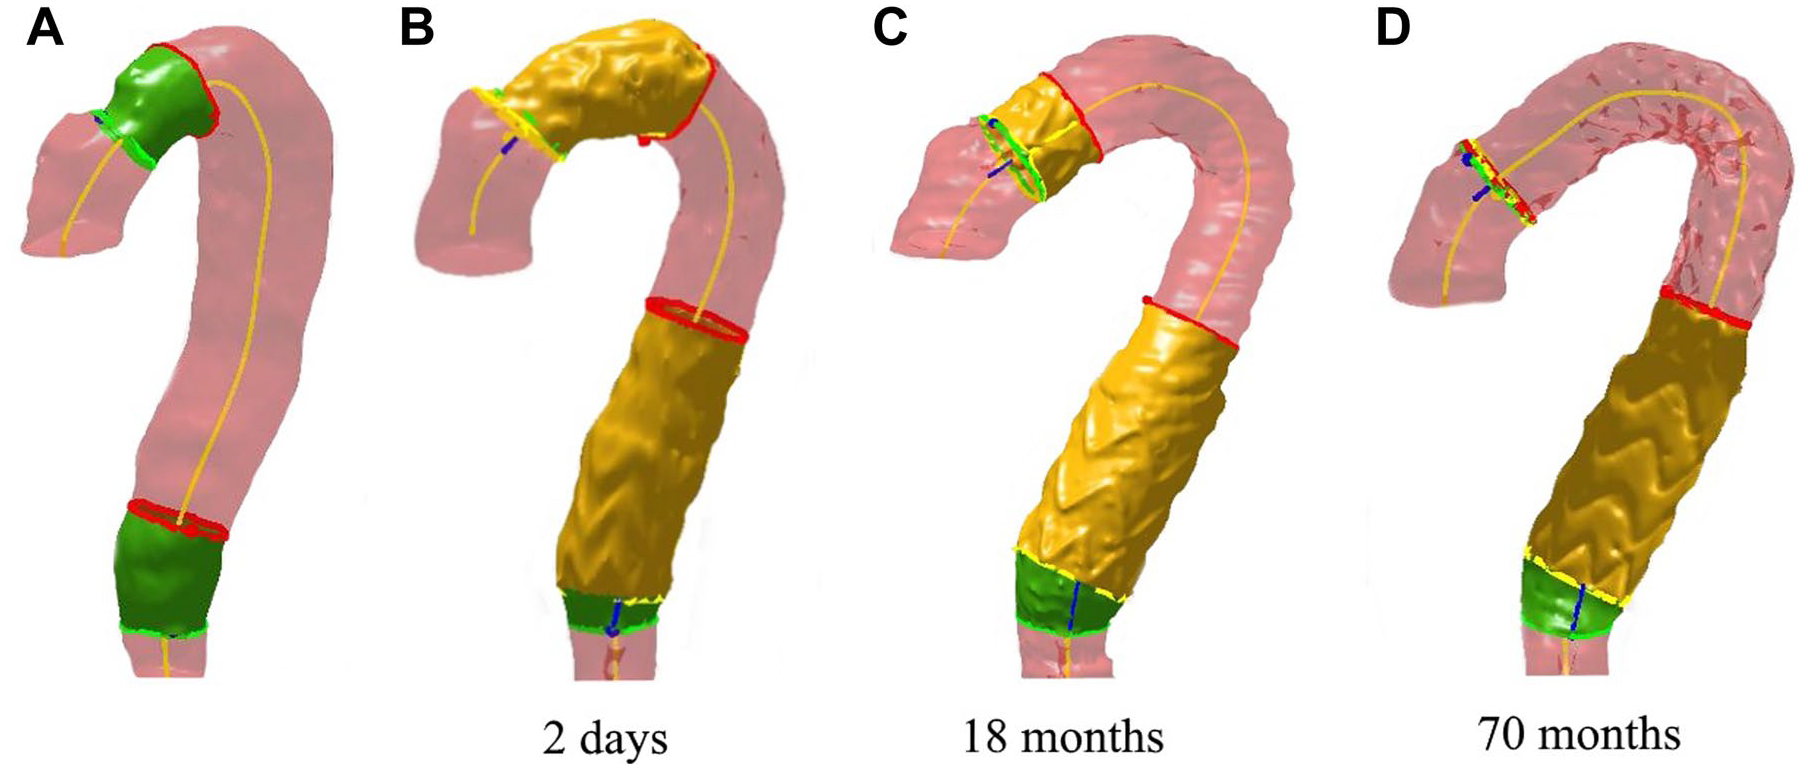
Apposition and position measurements of case 1. (A) Preoperative apposition characteristics show short proximal and distal landing zones (green surfaces). (B-D) Proximal apposition (yellow surfaces) decreased during follow-up, resulting in type Ia endoleak. The red rings mark the boundaries where 360° apposition is lost.
VIA Measurements Before and After TEVAR in Case 1 (Figure 3).
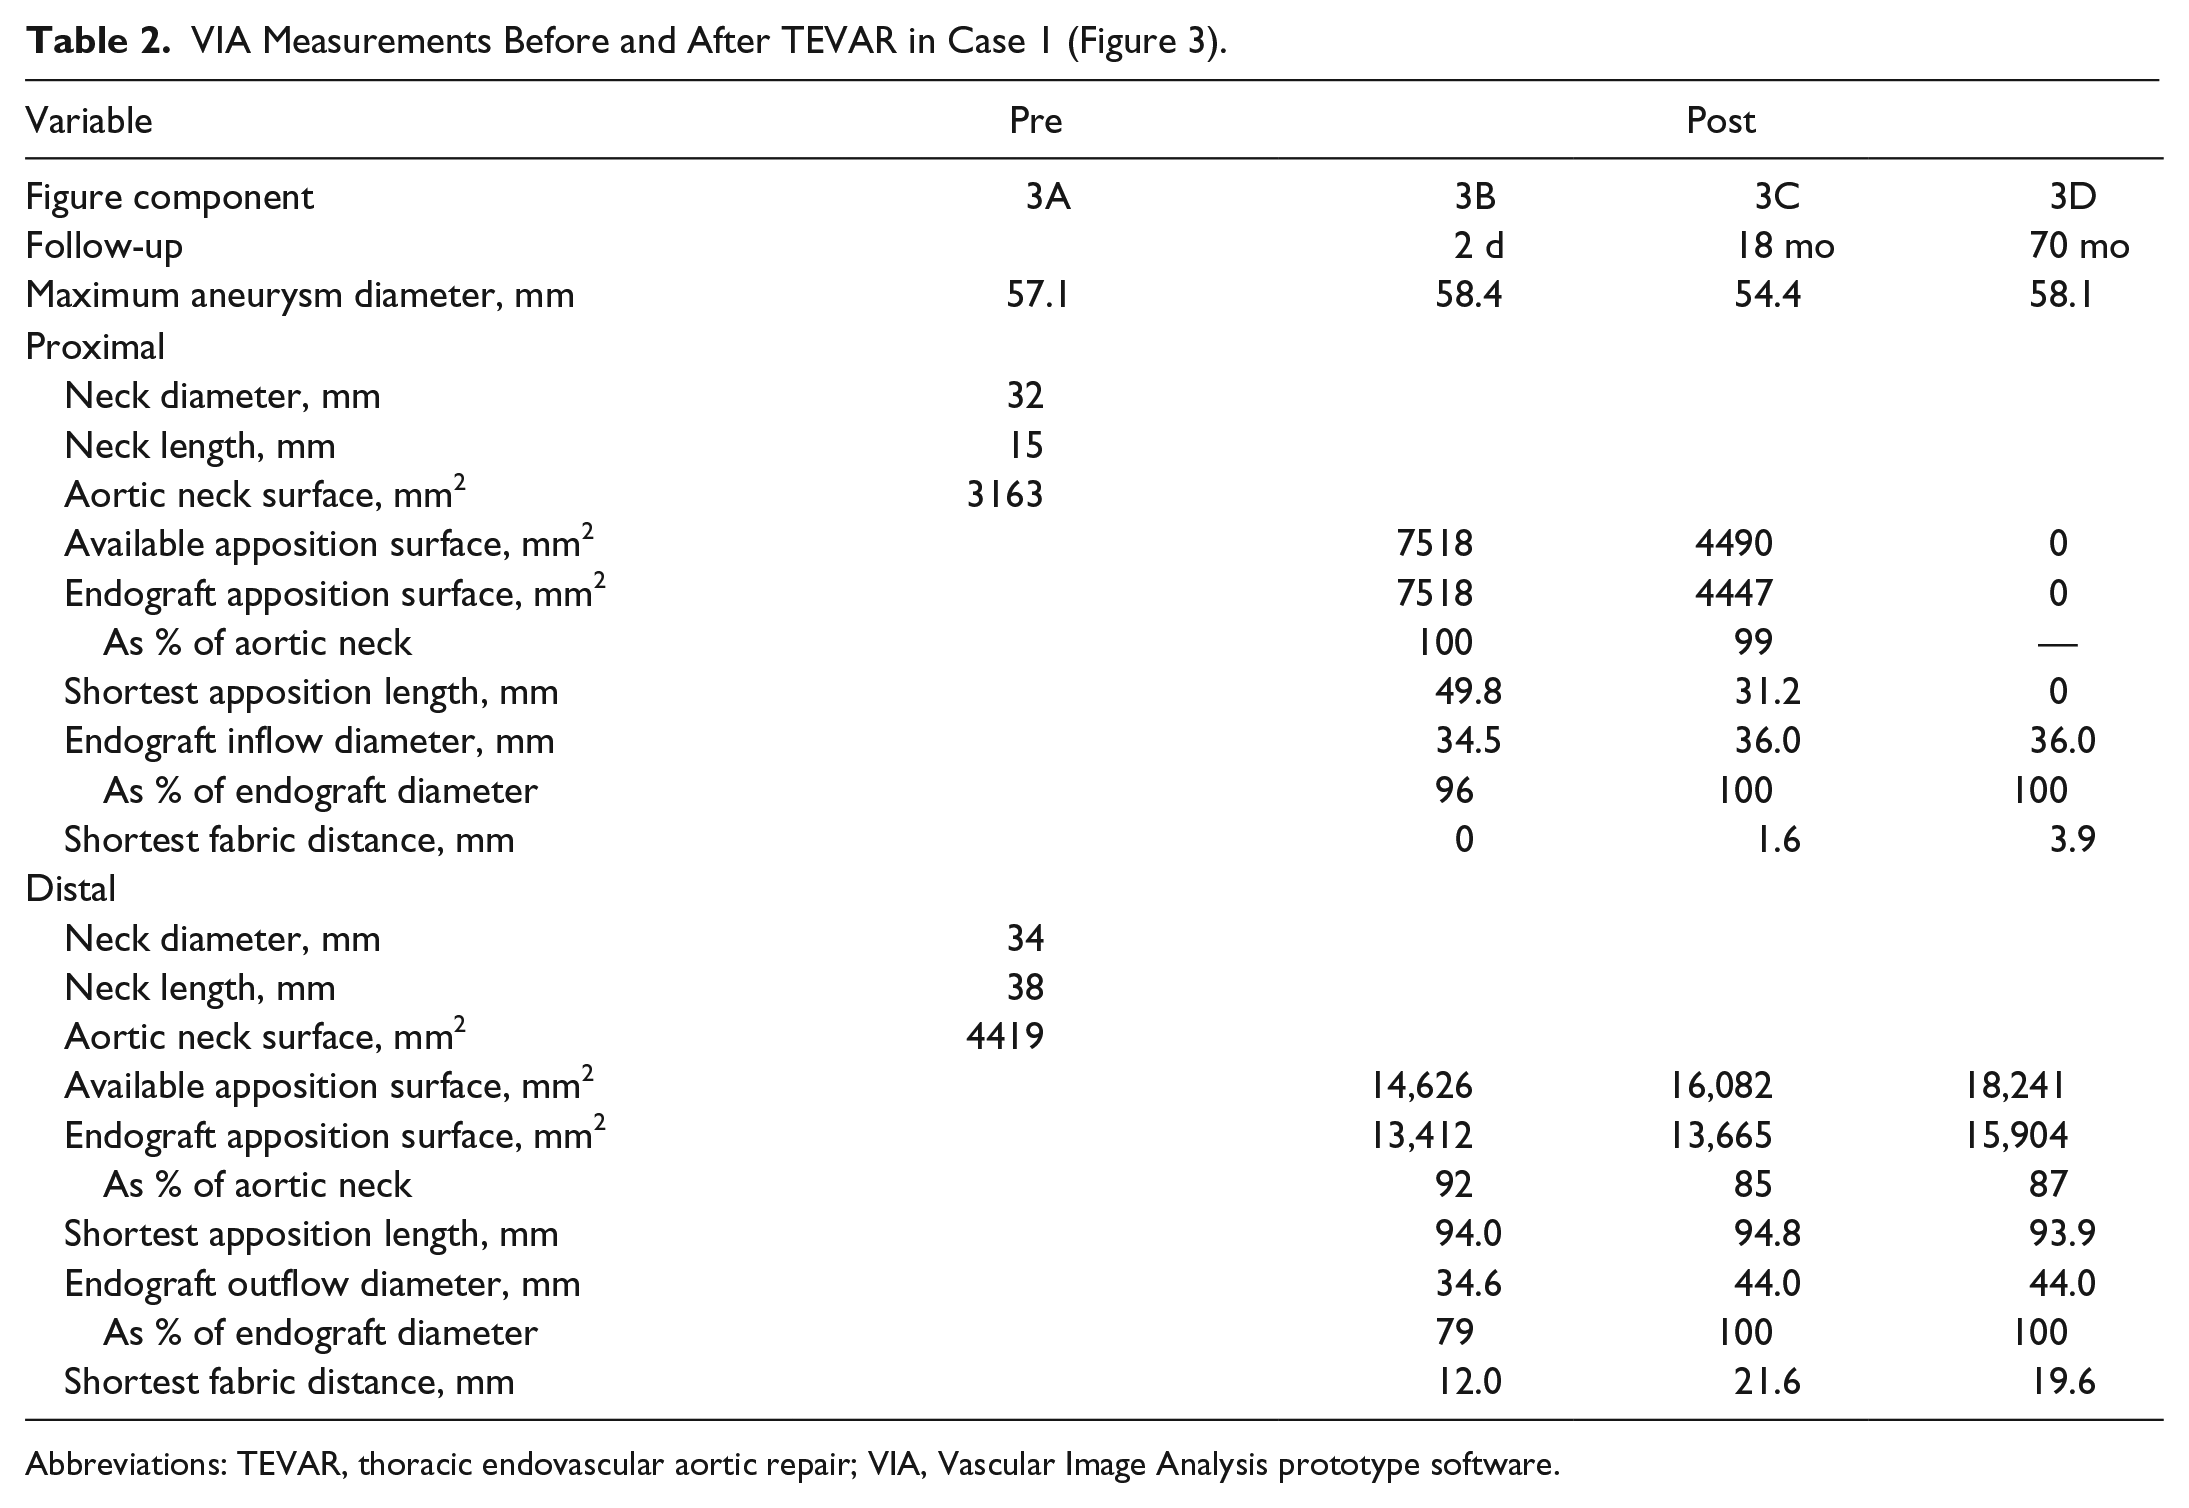
Abbreviations: TEVAR, thoracic endovascular aortic repair; VIA, Vascular Image Analysis prototype software.
Case 2: Increased Aneurysm Diameter and Loss of Seal After TEVAR
Figure 4 and Table 3 show the sequential CTAs of a patient with a mid-segment descending thoracic aortic aneurysm. The patient was treated with a Valiant Captiva in 2014 with proximal and distal diameters of 34 mm. A type II endoleak was observed 2 days postoperatively, which resolved over time. Progression of the aortic aneurysm diameter was noted despite good proximal and distal apposition; a persistent type II endoleak may have been the cause. It is known that not all type II endoleaks can be determined on static CTA images. Due to intentional low positioning, only 22% of the large pAAS was covered by endograft fabric. The distal neck was fully covered by fabric, which remained constant during follow-up. At 25 months, proximal apposition decreased from 22% to 18%, and the endograft expanded to its maximum fabric diameter. On this scan, significant aneurysm growth and an endoleak were observed. The origin of the endoleak was unclear (radiology report suggested types II and IV), but based on the full endograft dilatation and decreasing apposition, type Ia endoleak seems obvious with the VIA software.
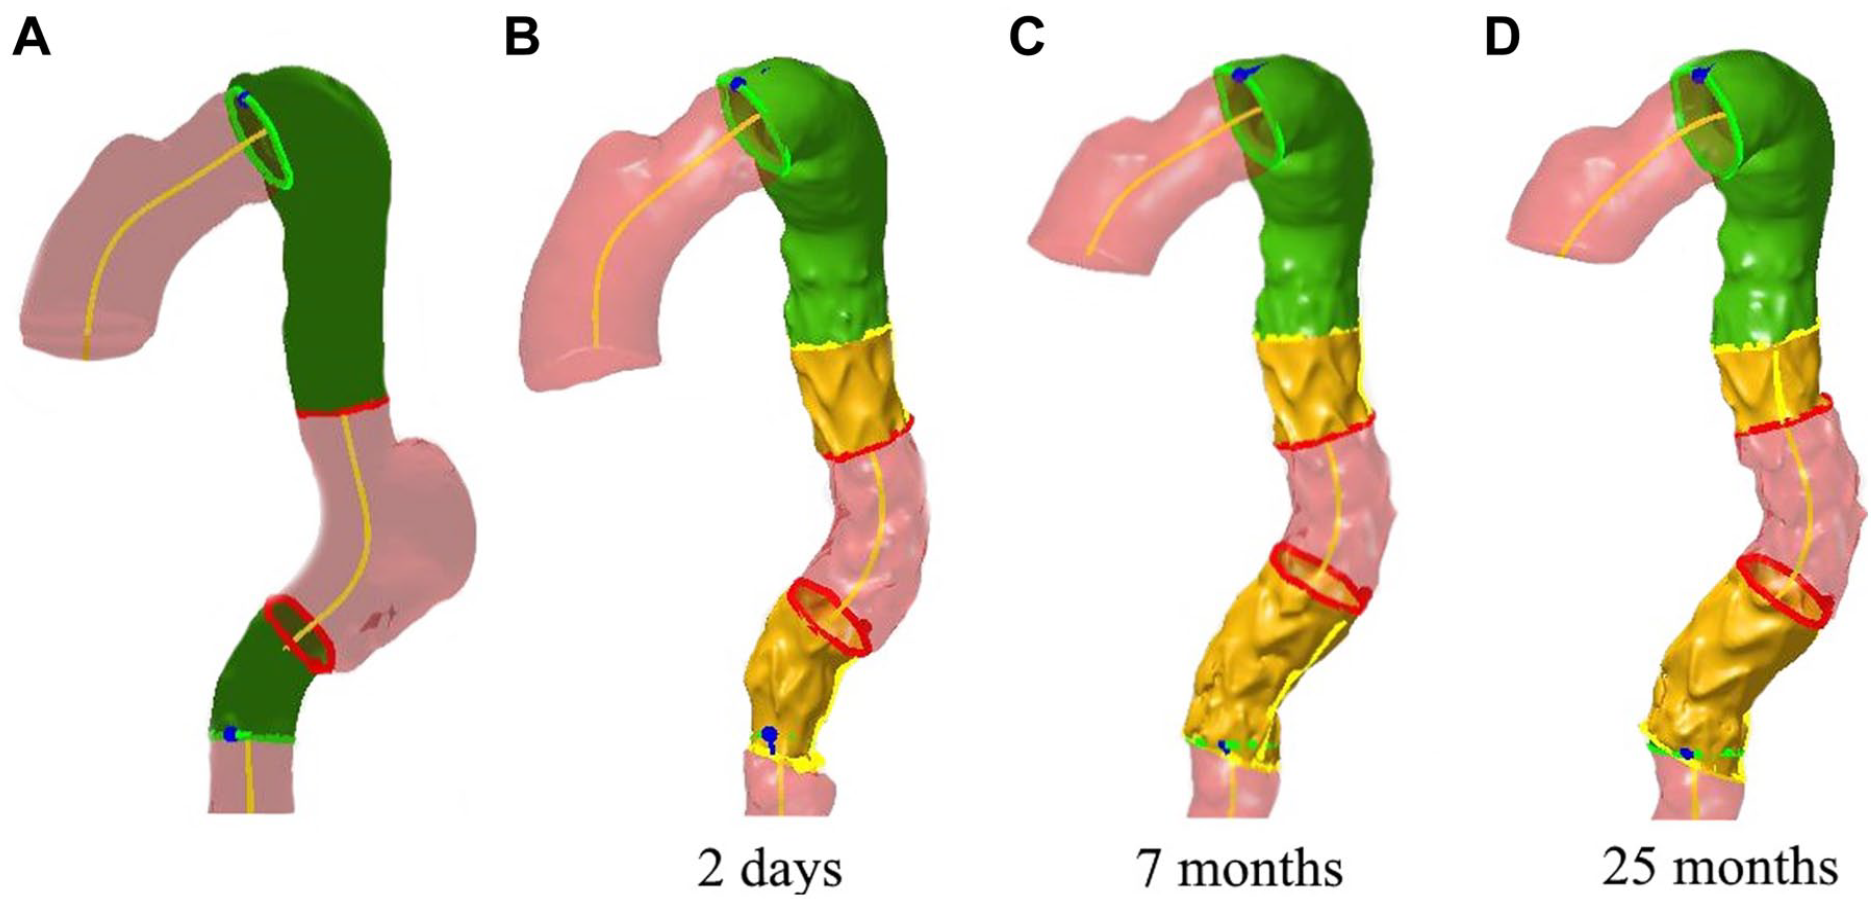
Apposition and position measurements of case 2. (A) Preoperative apposition characteristics show a large proximal landing zone (green surface). (B-D) Proximal apposition (yellow surface) decreased during follow-up (7–25 months), and the endograft fully expanded. At 25 months, the aneurysm had grown significantly, and an endoleak was observed, the origin of which was unclear. Distal apposition remained constant. The red rings mark the boundaries where 360° apposition is lost.
VIA Measurements Before and After TEVAR Case 2 (Figure 4).
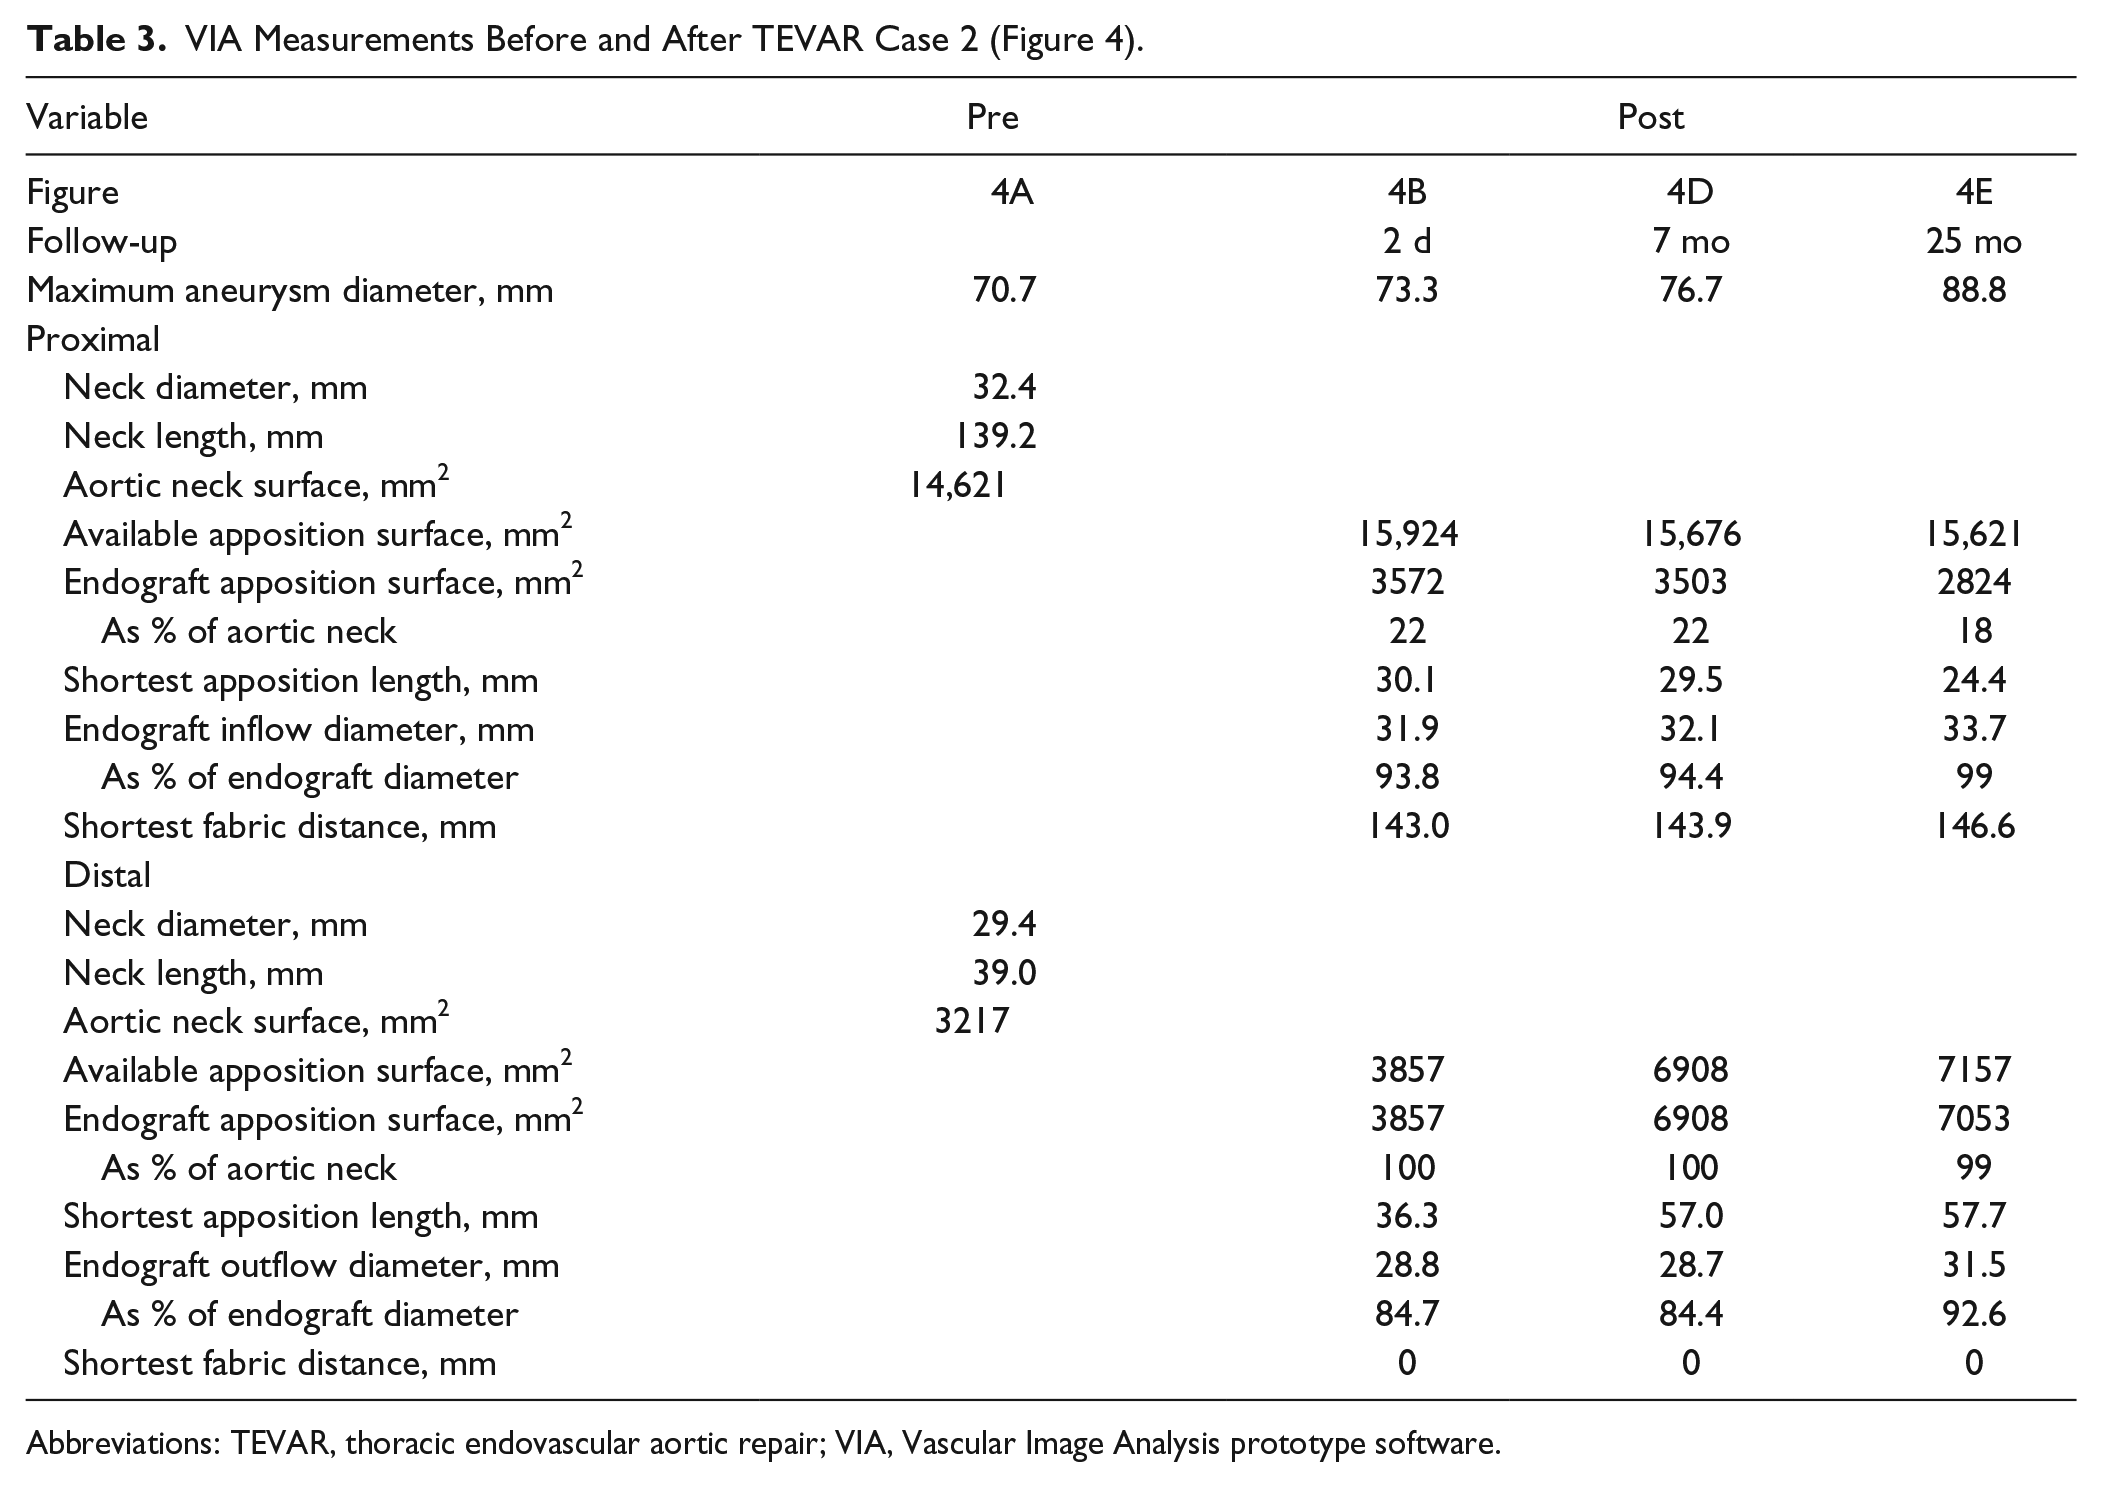
Abbreviations: TEVAR, thoracic endovascular aortic repair; VIA, Vascular Image Analysis prototype software.
Discussion
This study validates VIA software for assessing endograft apposition, dilatation, and position after TEVAR. Interobserver agreement was excellent for each parameter calculated by the software. Variability in calculations of apposition length, inflow and outflow diameters, and fabric distance were comparable to CLL and diameter measurements in the literature.14,15
Various warning signs for the development of type Ia endoleak have been described with the VIA software in endografts after EVAR, which also may apply to the proximal and distal landing zones in the thoracic aorta. 11 These signs include a decrease in apposition (both surface and length), an increase in fabric distance, and dilatation of the endograft toward its original diameter. When the endograft is fully expanded, the radial forces that have to keep the endograft in place are significantly reduced, and blood may leak along the fabric during peak systole when the diameter of the aorta is at its maximum. The latter may be undetectable on static CTA scans.
The CTA scans were ECG-triggered at mid-diastole, where the endograft would be less expanded as compared with peak-systole. The reconstruction phase was similar between scans, so gradual dilatation of the endograft over time could be assessed. Dynamic endograft expansion during the cardiac cycle could not be verified, as dynamic imaging was not available for these patients. It is known that the aortic diameter and length change during the cardiac cycle due to cardiac output and the longitudinal changes of the aorta.16–19 Dynamic scans may also reveal changes in apposition, position, and endograft expansion during the cardiac cycle, which should be investigated in future studies.
The first case shows a 50% decrease in proximal apposition after 18 months, compared with the first postoperative CTA scan, resulting in type Ia endoleak at 70 months. The endograft did not displace significantly from the LSA baseline but did expand to its full diameter. These warning signs at 18 months were not detected on regular CTA reports.
Decreasing apposition was also observed in the second case. Progression of the aortic aneurysm diameter was noted despite good proximal and distal apposition; a persistent type II endoleak may have been the cause. It is known that not all type II endoleaks can be determined on static CTA images. Due to progression of the aortic diameter, subtle changes in apposition (both surface and length) occur, which, combined with full endograft dilatation, may well explain a type Ia endoleak with further significant growth of the aneurysm. These subtle changes in apposition could not be detected during regular CTA assessment, but the warning signs (decreasing apposition and full endograft dilatation) were detectable with the VIA software. Variability in apposition calculation was larger for TEVAR compared with EVAR. The mean interobserver differences as a percentage of the average surface area for TEVAR proximal and distal and EVAR were 5% and 12% vs 0.7%, respectively. 9 The larger variance in the proximal part compared to EVAR may be explained by the difficulty in assessing the end of endograft apposition in the aortic arch due to distortion of the centerline reconstruction. In the distal part, irregularity and wall thickening of the degenerative descending thoracic aorta increase the difficulty of assigning the end of the aneurysm. Variability in fabric distance and diameter calculations were comparable to EVAR. 9
When a major decrease in apposition is detected, especially in combination with endograft dilatation (eg, the first case) or continuous displacement, adequate follow-up or options for reintervention should be discussed in the team, similar to when such findings would be detected on regular CTA assessment. The VIA software may increase the detectability of these issues. The choice for intervention should include the patient’s comorbidity and treatment options.
Further research with a large patient cohort is needed to investigate relevant cutoffs for changes in position, apposition, and dilatation to predict later failure.
Limitations
The software is validated for patients with degenerative descending thoracic aortas. Dissections or aneurysms including the main aortic arch branches are not included. Another limitation is the extra time required for post-TEVAR CTA analysis. Centerline reconstruction and measurements take ~15 minutes, which is comparable to preoperative sizing time.
Furthermore, the VIA software is currently limited to static CTA scans, whereas dynamic scans may reveal change in apposition, endograft expansion, and intermittent endoleaks during the cardiac cycle, increasing the value of accurate assessment of endograft dimensions within the thoracic aorta. Dynamic analysis is possible but time consuming with the current VIA software.
The VIA software is in prototype phase and is not yet commercially available or licensed for medical use; therefore, it cannot yet be used in clinical practice. A large clinical study is required to determine relevant cutoff values predictive for type Ia and Ib endoleak and migration in the thoracic aorta before potential preventive actions can be discussed based on changing apposition values.
Conclusion
Secure assessment of apposition, dilatation, and position of the proximal and the distal parts of an endograft in the descending thoracic aorta is feasible after TEVAR with the VIA software. Interobserver agreement for all measured parameters was excellent for the proximal and distal landing zones. The new method allows detection of subtle changes during follow-up. However, a larger study is needed to quantify how parameters change over time in both complicated and uncomplicated TEVAR cases and to define the real added value of the new methodology.
Supplemental Material
19-0097_Supplement_A – Supplemental material for A New Methodology to Determine Apposition, Dilatation, and Position of Endografts in the Descending Thoracic Aorta After Thoracic Endovascular Aortic Repair
Supplemental material, 19-0097_Supplement_A for A New Methodology to Determine Apposition, Dilatation, and Position of Endografts in the Descending Thoracic Aorta After Thoracic Endovascular Aortic Repair by Kim van Noort, Richte C. L. Schuurmann, Gersom Post Hospers, Emma van der Weijde, Hans G. Smeenk, Robin H. Heijmen and Jean-Paul P. M. de Vries in Journal of Endovascular Therapy
Footnotes
Declaration of Conflicting Interests
The author(s) declared the following potential conflicts of interest with respect to the research, authorship, and/or publication of this article: Jean-Paul de Vries and Richte Schuurmann are co-founders of Endovascular Diagnostics B.V., which holds patent rights to the VIA software used to determine endograft position, dilatation, and apposition.
Funding
The author(s) received no financial support for the research, authorship, and/or publication of this article.
References
Supplementary Material
Please find the following supplemental material available below.
For Open Access articles published under a Creative Commons License, all supplemental material carries the same license as the article it is associated with.
For non-Open Access articles published, all supplemental material carries a non-exclusive license, and permission requests for re-use of supplemental material or any part of supplemental material shall be sent directly to the copyright owner as specified in the copyright notice associated with the article.