






Abstract
Purpose:
Duplex ultrasound (DUS)-measured peak systolic velocity ratios (PSVRs) are commonly used to evaluate arterial stenosis in lower extremity artery disease (LEAD). However, these measurement methods have not yet been standardized. This study aimed to reveal the influence of measuring methods on PSVR values.
Methods:
A 132 femoropopliteal lesions with PSVR ranging from 1.5 to 3.5 evaluated using method A (angle correction 60°, the direction of blood flow, the no or few atherosclerotic changes closest to the lesion proximal side was defined as the nonstenotic area) were included. The following 4 different methods were then compared with method A: method B, angle correction 45°; method C, angle correction 60° measured along the vessel wall; D, angle correction 60°, with the nonstenotic area the lowest peak systolic velocity area; and E, angle correction 60°, with the reference point fixed at 2 cm proximal to the target lesion area. The difference in PSVR values was analyzed using the Bland-Altman method.
Results:
The mean PSVR value measured by method A was 2.27±0.51, those measured by methods B, C, D, and E were 2.21±0.55, 2.31±0.66, 2.34±0.63, and 2.11±0.63, respectively. The 95% prediction intervals of the differences in PSVR measurements versus A were -0.64 to +0.53 for method B, −0.59 to +0.68 for method C, −0.77 to +0.91 for method D, and −1.12 to +0.79 for method E.
Conclusion:
PSVR values considerably differed between measuring methods. PSVR values by DUS are largely dependent on the measurement methods, which could considerably affect the judgment of LEAD.
Clinical Impact:
Due to differences in several DUS measurement methods, the PSVR results could be changed. Therefore, to need further investigations and unification of measurement method.
Keywords
Introduction
Duplex ultrasonography (DUS) is a noninvasive and therefore clinically important diagnostic modality for lower extremity arteriosclerosis disease (LEAD). 1 DUS is also used to evaluate the performance of endovascular devices such as nitinol stents (drug or bare metal), heparin-bonded stent-grafts, and drug-coated balloons (DCB) in approved clinical trials and post-marketing surveillance (PMS).2–5 A key index for the DUS evaluation is the peak systolic velocity ratio (PSVR), being calculated as the peak systolic velocity (PSV) in the stenotic area divided by that in the nonstenotic area. PSVR enables to quantitatively assess the degree of arterial stenosis, and has been widely used in clinical studies and in clinical practice as well. Ranke et al. 6 reported that a PSVR value of 2.4 or higher indicates stenosis of 50% or more on angiography. The American Society of Echocardiography and the Society of Vascular Medicine and Biology published guidelines for vascular ultrasound examination in 2006. 7 This cutoff value has been now highly cited and frequently used, but the measuring method of PSVR is not always in accordance with the guideline; PSVR is often measured using a method different from that recommended in the guideline. 7
This is because, during clinical trials and postmarketing surveillance, different methods are often presented.
DUS-evaluated PSVR values would be potentially affected by several factors. First, PSVR values could be influenced by the correction angle. The blood flow volume measured by Doppler often requires the angle correction, particularly in the lower extremity arteries. The Doppler angle is sometimes kept at 60° or smaller and,6,7 while other times, it is fixed at 60°. 8 However, the influence of the degree of the Doppler angle on PSVR measurements remained unrevealed. Furthermore, whether the angle correction is set along the direction of blood flow or the vessel wall could also affect the measurements. Another factor that will potentially affect PSVR values is the determination of nonstenotic area. Multiple determinations have been proposed, but the influence on PSVR values has never been systemically investigated. This prospective multicenter study aimed to reveal the influence of the following 3 methodological factors on PSVR values: the degree of the angle correction, the direction along which the angle was corrected, and the determination of nonstenotic area.
Materials and Methods
This prospective, observational study, named the quantitative technique of ultrasonography in the assessment of femoropopliteal atherosclerotic lesions using PSVR (turn-up) study, enrolled 132 patients with LEAD who had femoropopliteal lesions at 7 cardiovascular centers in Japan between March and December 2021. The inclusion criteria were patients who met the following DUS criteria with a diagnosis of LEAD: (1) an ankle-brachial index (ABI) was less than 1.0 and (2) a PSVR value measured by the standardized method 6 (named method A; see below) was ranged from 1.5 to 3.5. Additional measurements were taken as registration when applicable.
Also patients were included in the study regardless of the previous revascularization. Patients with obstructive lesions between the abdominal aorta and the popliteal artery; femoral artery bifurcation lesions (within 2 cm after bifurcation); lesions in the femoral–popliteal artery proximal to the target lesion; cases with clearly irregular R-R intervals due to atrial fibrillation, atrial flutter, and severe atrioventricular block; patients with highly calcified or lesions with unclear delineation due to depth; and patients lesions with unclear pulsed Doppler waveforms that would affect PSV measurements were excluded from the study. For example, the following cases, the pulsed Doppler waveform itself is unclear, the waveform edges are not smooth.
This study was conducted in accordance with the Declaration of Helsinki and approved by the ethics committees of our hospital and each participating institution. All participants provided informed consent.
PSVR Measurement
Experienced sonographers at each facility performed the DUS. The standardized method for the PSVR measurement (named method A) was as follows (Figure 1). 6 (1) the angle correction value was fixed at 60° and set along the direction of blood flow; (2) the nonstenotic area was defined as the area with no or few atherosclerotic changes closest to the target lesion on the proximal side of the tomographic ultrasound image; and (3) in the case of multiple lesions, the lesion on the most proximal side of the femoropopliteal artery was considered the target lesion. The measurement method in the guidelines cited above 6 is similar to method A. However, angle correction and other factors are not clearly specified.
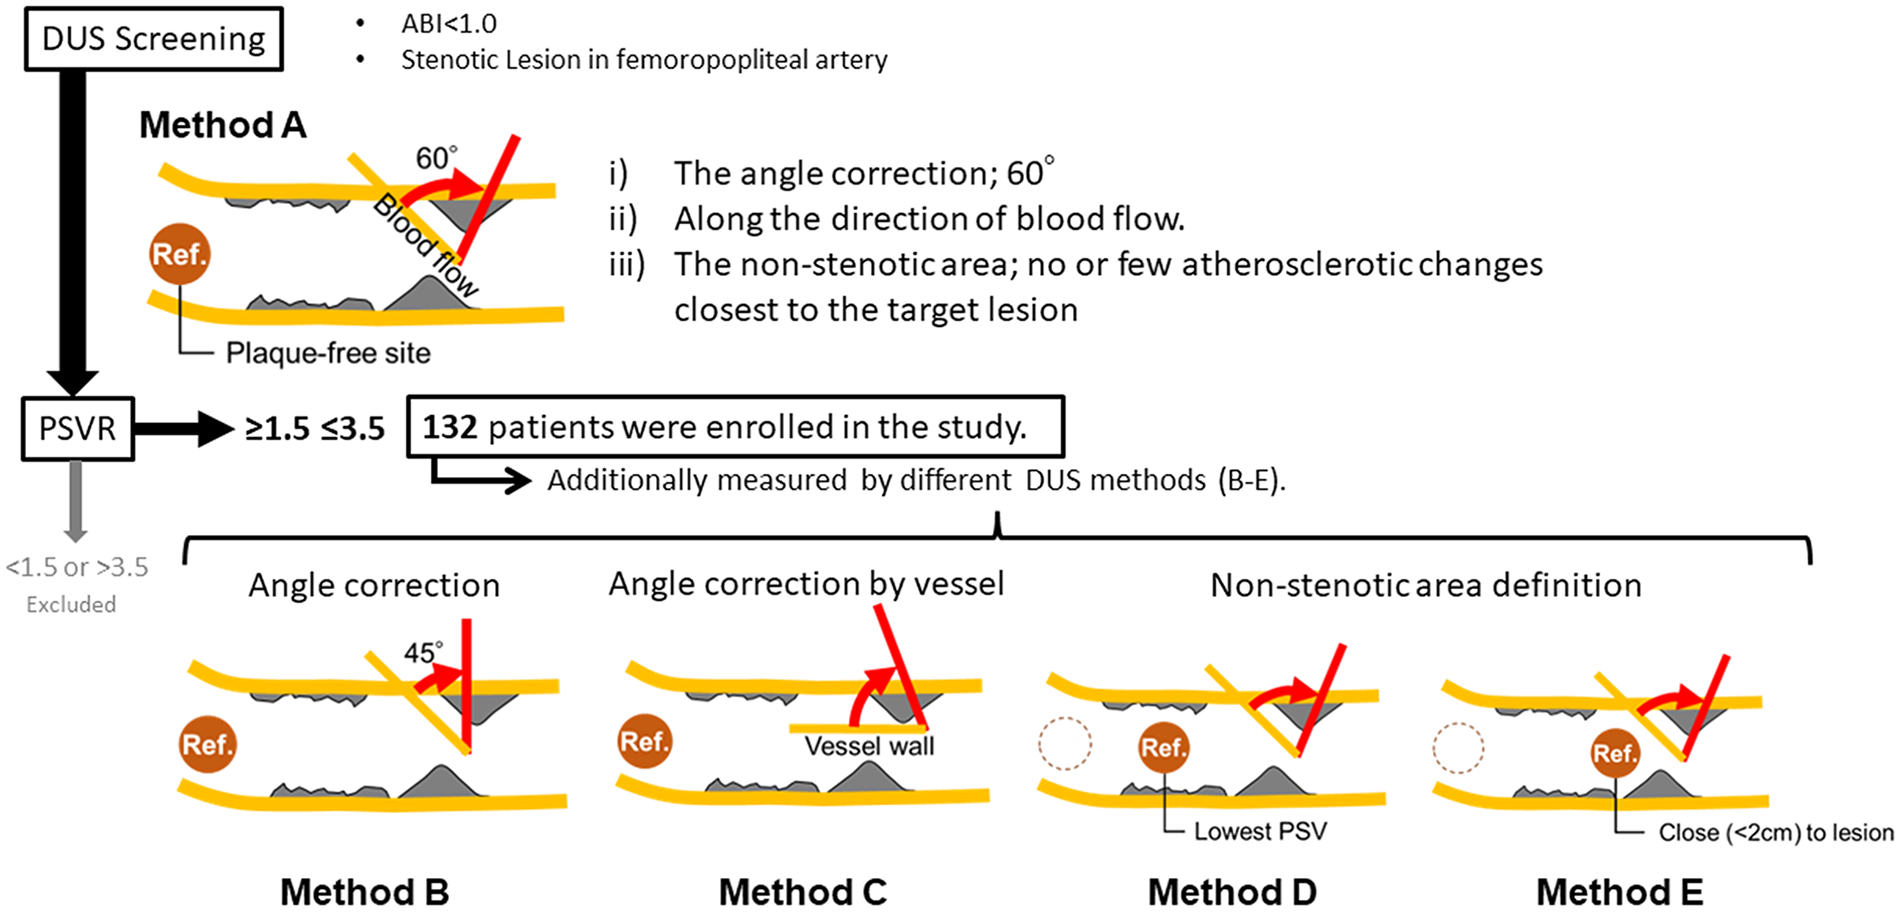
Study scheme and PSVR measurement method. A total of 132 patients who met the screening requirements of method A were enrolled. These were examined with methods B to E. Method A: The angle correction value was fixed at 60° and set along the direction of the blood flow. The nonstenotic area was the target lesion on the proximal side, with no or few atherosclerotic changes. Methods B to E are additional measurement methods: B: angle correction value is set at 45° (B), angle correction setting is set along the direction of blood flow (C), nonstenotic site is set at the lowest PSV centrally within 5 cm from the registered lesion in the popliteal artery (D), and the nonstenotic area is set at 2 cm proximal to the target lesion (E).
PSVR values were additionally measured using the following 4 methods (methods B, C, D, and E) (Figure 1), according to the guidelines, 7 reports to date,6,8 and past clinical trials and PMSs.
Method B was the same as method A, except for the degree of the correction angle, which was set to 45° for both stenotic and nonstenotic areas. Method C was the same as method A, except that the angle was corrected based on the direction of the vessel wall. Methods D and E were the same as method A, except for the determination of nonstenotic area. In method D, the nonstenotic area was determined as the lowest PSV site in the femoropopliteal artery within 5 cm from the target lesion, proximally. In method E, nonstenotic area was set at 2 cm proximal to the lesion. .
During the PSVR measurement using every method, linear-type probes were used, the sample volume was at least half of the vessel diameter, and the oblique function was set to the optimal setting for each lesion. In this study, the same sonographer performed measurements on the same lesion using all measurement methods (types A–E).
Statistical Analysis
Data are presented as mean values and standard deviations for continuous variables and frequencies and percentages for discrete variables. The agreement between the different measuring techniques was evaluated using the Bland–Altman analysis. In brief, the differences in PSVR values between 2 different measuring methods (ie, method A and another method) were calculated, and the means and standard deviations were derived. The 95% limits of agreement (ie, 95% prediction intervals of the differences or errors) were obtained from the means and standard deviations. The data were also graphically demonstrated using a Bland–Altman plot, with the average PSVR values between the 2 measuring methods on the x-axis and the difference on the y-axis. All statistical analyses were performed using R version 4.1.1 (R Development Core Team, Vienna, Austria).
Results
The patient and lesion backgrounds are shown in Table 1. The mean age was 76±7 years, 70% were males, and 68.9% and 61.3% had hypertension and diabetes, respectively. The mean ABI value was 0.8±0.1 mm, and the mean lesion length was 21±3 mm. Of the 132 lesions, 26 had >50% calcification, as determined by DUS.
Characteristics of Study Patients and Lesions.

Data are presented as the mean±standard deviation or count (percentage).
Abbreviations: DCB, drug-coated balloon; FA, femoral artery; ISR, in stent restenosis; PopA, popliteal artery.
The PSV and PSVR values for each method are listed in Table 2. In method A, the mean PSV of the stenotic area was 202.3±66.6 cm/s, the mean PSV of the nonstenotic site was 91.1±28.8 cm/s, and the mean PSVR was 2.27±0.51. However, the mean PSVR values measured by methods B, C, D, and E were 2.21±0.55, 2.31±0.66, 2.34±0.63, and 2.11±0.63, respectively.
Results for Each Method.

Data are presented as the mean±standard deviation.
Abbreviations: PSV, peak systolic velocity; PSVR, peak systolic velocity ratio.

Bland–Altman plot of PSVR values for methods B and E compared with method A. The X-axis shows the mean PSVR values for the 2 measurement methods, and the Y-axis shows the difference in PSVR between the 2 measurement methods. The red line shows the mean difference between the methods, the blue line shows the 95% prediction interval (PI), and the bright red shading and bright blue shading indicate the respective 95% confidence intervals (CI).
Discussion
We prospectively enrolled 132 patients in the present study and compared 5 different PSVR measurement methods. In all comparisons, the 95% PI showed variation affecting the stenosis assessment. The results of the current study show that the maximum 95% PI for the difference in measurements between methods (ie, the upper/lower limits of the 95% PI) ranges from 0.5 to 1.0 (Figure 2). This was well above the range considered clinically acceptable, and the values varied considerably among the methods.
PSVR is widely used as the most objective measure to define the success of various devices and treatments, and has been compared with the success or failure of various treatment methods. However, to date, some reports use PSVR as the definition of patency but use different measurement methods.6,8 Although this issue has been presented in the past, no report has examined in detail the impact of each measurement method on PSVR.
In this study, we extracted the measurement definitions provided by the guidelines and previous reports6–8 and core laboratories, and examined the extent to which the differences in these measurement methods affected PSVR values.
First, we compared methods A and B and examined the differences in the angle correction values. Generally, it is considered acceptable to keep the angle correction value within 60° for blood flow measurement using the Doppler method of DUS. 7 However, there is minimal possibility of error in the angular correction function caused by this technique and principle. 9 The degree of this error differs for each angle correction value, and the larger the angle correction value, the larger the error. 9 Therefore, when the angle correction values are different between 45° and 60°, the degree of error is also different. The PSVR values may vary between the 2 groups.
Next, we examined the differences in the setting methods for angle correction by comparing methods A and C. The guidelines indicated that in the case of normal vessels, the angle correction should be set according to the direction of blood flow and vessel wall. 7 However, in the case of stenosis, if the angle correction is set to match the vessel wall, the angle correction may be slightly different from the actual angle of incidence in the direction of blood flow owing to the stenosis morphology. We inferred that the PSVR value is affected by this error.
Differences in the settings of nonstenotic areas were also examined. Even though the lesions in this study had little or no stenosis at the proximal site of the target lesion within the femoral-popliteal artery, PSVR values varied in both studies.
The lack of consistency in the criteria for the nonstenotic setting, such as anatomic and hemodynamic conditions, and specific location, was considered a possible reason for the different PSV values in the nonstenotic area, thereby affecting the PSVR values.
Other measurement methods exist besides these methods. One of them is to use the distal part of the lesion as a reference. Since this is not a common method at the participating centers, it was not included in the measurement methods for this study. The use of proximal and distal references may affect PSVR and requires further investigation.
The results of this study indicated that the measured values vary considerably depending on the measurement method, and the lack of an indication for the measurement method may cause severe problems in terms of study reproducibility. Among the comparisons between methods A and B to E, method E tended to have a lower average PSVR value. This is because the reference site was 2 cm from the target lesion in method E, which was closer to the target lesion than that in method A, and the PSV was higher than the PSV in method A. This can be considered the reason for the lower PSVR.
Based on these results, examining and clearly defining the angle correction value, setting method, and optimal settings for nonstenotic areas is necessary.
In addition, reports using PSVR to evaluate the performance of devices used in endovascular therapy often do not clarify the detailed measurement methods.2–5 This difference must be considered when comparing PSVR to devise patency. Furthermore, studies measuring PSVR should clearly describe the measurement method. This study is not a scheme to identify which method is best. However, based on these results, a simpler, standardized method would need to be considered.
Limitation
This study has some limitations. First, only a few cases were included, and no core laboratory analyses were performed. Second, although the relative differences between each measurement method were demonstrated, absolute differences could not be assessed. Third, the DUS equipment was not standardized, and the influence of inter model differences could not be evaluated.
Conclusion
In PSVR measurement, some criteria for angle correction values and their setting methods for different nonstenotic lesion settings affect the evaluation of PSVR stenosis. And, PSVR values considerably differed between measuring methods. This study suggested the potential for misleading results from devices studies that have compared PSVR as a standard parameter.
Footnotes
Acknowledgements
The authors thank the participating centers’ cardiac catheterization laboratory staff and the clinical research coordinators.
Declaration of Conflicting Interests
The author(s) declared no potential conflicts of interest with respect to the research, authorship, and/or publication of this article.
Funding
The author(s) received no financial support for the research, authorship, and/or publication of this article.
