
Abstract
Objective:
To identify risk factors for in-stent restenosis (ISR) in patients undergoing stent placement for superior mesenteric artery dissection (SMAD) and to determine the hemodynamic mechanism underlying ISR.
Methods:
For this retrospective study, patients with SMAD who had ISR after stent placement were included in the ISR group, and age- and sex-matched patients with SMAD who did not experience ISR after stent placement were included in the control group. Clinical, imaging, and hemodynamic data were assessed. Multivariable regression was used to identify independent ISR risk factors. Structural and fluid dynamics simulations were applied to determine the hemodynamic mechanism underlying the occurrence of ISR.
Results:
The study population included 26 patients with ISR and 26 control patients. Multivariate analysis demonstrated that stent-to-vascular (S/V) ratio (odds ratio [OR], 1.14; 95% confidence interval [CI]: 1.00–1.29; p=0.045), stent proximal position >10 mm away from the SMA root (OR, 108.67; 95% CI: 3.09–3816.42; p=0.010), and high oscillatory shear index (OSI) area (OR, 1.25; 95% CI: 1.02–1.52; p=0.029) were predictors of ISR. In structural and fluid dynamics simulations, a stent proximal position near the abdominal aorta (AA) or entering into the AA reduced the contact area between the proximal struts of the stent and the vascular wall, and alleviated the distal lumen overdilation.
Conclusion:
The S/V ratio, stent proximal position away from the SMA root (>10 mm), and high OSI area are independent risk factors for ISR in patients with SMAD undergoing stent placement. Deploying the proximal end of the stent near the AA or entering into the AA appears to improve the hemodynamic environment in the SMA lumen and ultimately reduce the risk of ISR.
Clinical Impact
In-stent restenosis is an uncommon but potentially catastrophic complication after stent placement for the management of superior mesenteric artery dissection. This study identified risk factors for in-stent restenosis and demonstrated that, as long as the stent can fully cover the dissection range, deploying the proximal end of the stent near the abdominal aorta or less entering into the abdominal aorta may reduce the risk of in-stent restenosis in this patient population.
Introduction
Superior mesenteric artery dissection (SMAD) is being increasingly diagnosed in recent years, which has led to a renewed focus on the optimal management of this condition. 1 Conservative treatment is recommended as the first-line therapy for most patients with SMAD; however, stent placement plays an important role in preventing serious complications in these patients and rapidly opening the superior mesenteric artery (SMA) for patients in emergent presentation and without time for conservative management.2–4 Although the short- and medium-term outcomes after stent placement for SMAD have been assessed in several studies, data regarding the long-term outcomes of this treatment are lacking, particularly in terms of stent-related complications and patency rates. Besides, the patency rate of stents varies greatly among different reports (90.0% vs 55.6%).3–9 For instance, in-stent restenosis (ISR), although reported to be relatively uncommon over short- and medium-term follow-up, can lead to potentially catastrophic events. 10 However, the hemodynamic mechanism underlying this complication is not well understood, and no clinical consensus regarding landing zone selection for stent placement has been reached.2,11-13
To date, few studies have employed both structural and fluid dynamics simulations to simulate stent deployment and postprocedural effects on blood flow. This allows us to more realistically reconstruct the process of stent release in the vessel and observe the subtle effects of stent placement on blood flow in the vessel lumen.
In this retrospective study, the goal was to use a combination of finite element analysis (FEA) and computational fluid dynamics (CFD) to identify factors related to the occurrence of ISR after stenting for SMAD and thus provide insights regarding landing zone selection for stent placement in patients with SMAD.
Methods
Study Population
This multicenter retrospective study was approved by all participating institutional review boards, with a waiver of informed consent. Consecutive patients who were diagnosed with isolated SMAD (patients who had aortic dissection with extension into the SMA were excluded) by computed tomographic angiography (CTA) and underwent stent placement between February 2015 and March 2023 were considered for study inclusion. Patients were excluded from the study if they had not received antithrombotic therapy after stent placement (aspirin 100 mg/d for ≥12 months and clopidogrel 75 mg/d for ≥6 months),4,14 if they were lost to follow-up, or if they had low-quality follow-up CTA images. All included SMAD patients were classified based on Yun’s type. 15
Perioperative Management
The decision to place a stent was based on the patient’s symptoms, imaging features of the SMAD, morphological characteristics of the SMAD, and the failure of, or without time, for conservative management, 9 which included blood pressure control, fasting, and parenteral nutritional support. 8
Selective SMA angiography was performed to determine the classification and imaging features of the dissection. Subsequently, bare self-expanding stents (with diameters approximately 10% larger than the normal SMA trunk diameter) were deployed into the SMA true lumen, fully covering the range of dissection on the SMA trunk. Thereafter, SMA angiography was then performed again to confirm the stent deployment, the resolution of the false lumen, and the patency of the true lumen. 9
After stent placement, all patients received double antiplatelet therapy consisting of aspirin 100 mg/d for at least 12 months and clopidogrel 75 mg/d for at least 6 months. Patients with hypertension, diabetes mellitus, and/or hyperlipidemia were treated with the appropriate guidelines-based therapy. Patients with a history of smoking were advised to quit. 2
Follow-up
Follow-up was performed at 1, 3, 6, and 12 months after discharge and yearly thereafter. Duplex ultrasound was performed at these time points, and CTA was also performed at 3, 6, and 12 months and yearly thereafter to evaluate stent patency. Relevant laboratory values and other clinical data were also collected at every time point.
Image Assessment
The SMA images were obtained using CTA (Philips Core 128, Rotterdam, Netherlands) with a slice thickness of 1.0 mm. Curved planar reconstruction of the SMA was performed on a separate workstation, and metal artifact reduction algorithms were applied to evaluate the imaging data. The vascular lumen was identified using semiautomatic software (Aquarius iNtuition software, TeraRecon Inc, Foster City, CA, USA) for threshold segmentation.
The image measurements are shown in Supplemental Figure S1. These measurements included (1) the location of dissection entry site, defined as the distance from the SMA root to the dissection origin; (2) the size of entry tear, defined as the length of dissection entrance; (3) the dissection length, defined as the maximum long-axis length of the dissection; (4) the false lumen diameter, defined as the maximum short-axis length of the dissection; (5) the proximal location of the stent, defined as the distance from the proximal site of the stent to the SMA root; (6) the distal coverage of the stent, defined as the distal location of the stent whether to cover the SMA maximum curvature point; (7) the aortomesenteric angle, defined as the angle between the SMA trunk axis and the abdominal aorta (AA) long axis; 16 (8) the SMA maximum curvature, defined as the maximum bending degree of the SMA centerline; (9) the Δangle, defined as the aortomesenteric angle before stent placement minus the aortomesenteric angle after stent placement; (10) the Δcurvature, defined as the SMA maximum curvature before stent placement minus the SMA maximum curvature after stent placement; (11) the stent-to-vascular (S/V) ratio, defined as the ratio between the stented lumen cross-section area and the vascular lumen cross-section area before stent placement in the same slice level 9 ; and (12) the ISR rate, defined as the cross-sectional area at the greatest in-stent stenosis site divided by the stented lumen area (the greatest in-stent stenosis site was identified by three interventional angiologists in consensus).
Nonstented Simulations
Nonstented model reconstructions and mesh generation
To quantify hemodynamic changes in the SMA, patient-specific SMA fluid domain models for all patients were extracted after stent placement by automatically reducing stent metallic image artifacts based on the first thin-slice CTA images (slice thickness, 1.0 mm) after stenting, 17 and 3D geometries were reconstructed using Mimics Research 19.0 (Materialize HQ, Louvain, Belgium; Figure 1). The tetrahedral mesh generation and prism layer creation for all SMA geometric modeling were completed using ICEM CFD Version 19 (ANSYS Inc., Canonsburg, PA, USA). Mesh sensitivity testing was conducted until the mean difference in time-averaged wall shear stress (TAWSS) distribution was less than 0.4% (Supplemental Table S1). Mesh refinement was performed within the coverage range of the stents (mesh size, 0.3 mm) to capture more abundant and subtle hemodynamic changes than were captured with the main model.
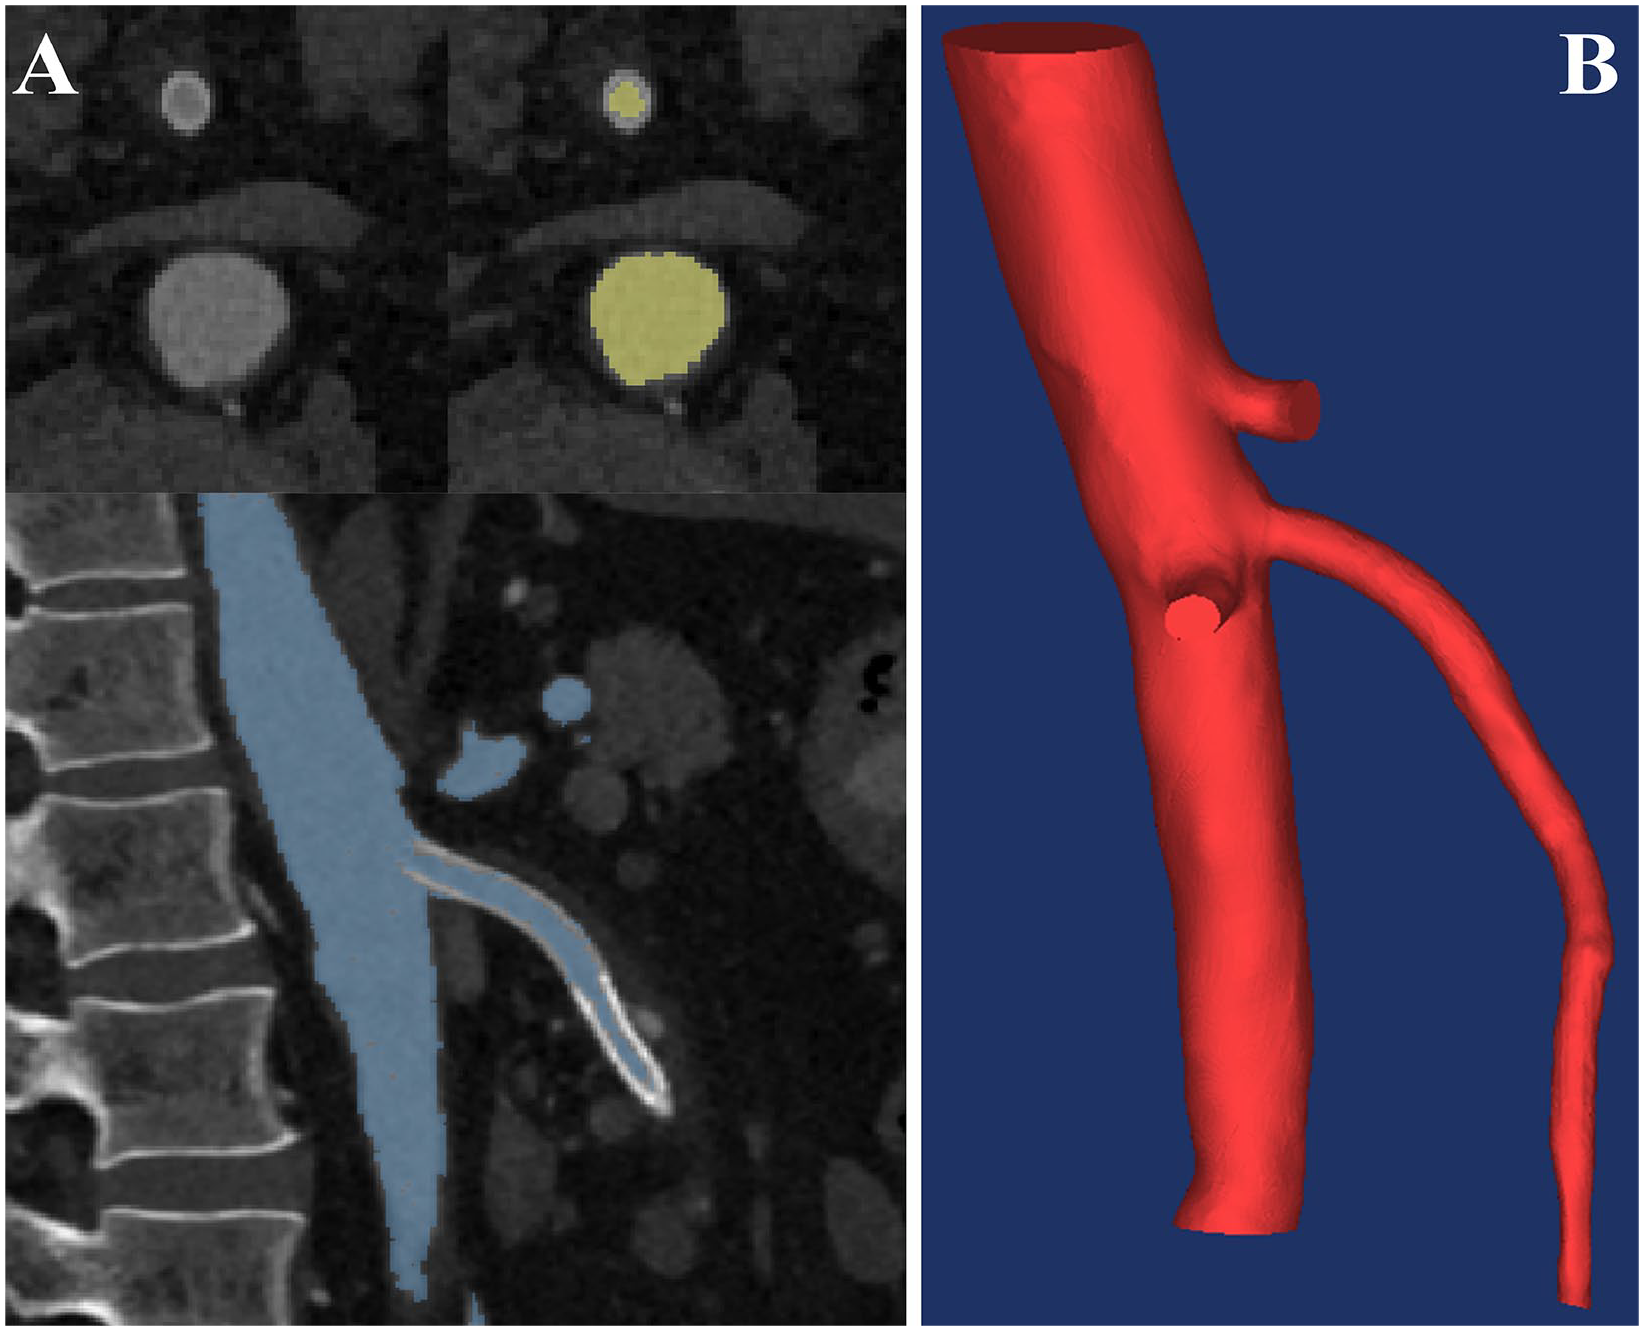
Model reconstructions demonstrating the progress of nonstented superior mesenteric artery (SMA) flow. (A) Segmentation of the lumen before stent placement. (B) SMA fluid domain 3D geometry.
Nonstented CFD
Patient-specific transient simulations were performed using the CFD solver in CFX (ANSYS Inc.) by solving the incompressible steady Navier-Stokes equations. The pressure inlet, based on patient-specific blood pressure waveform, and mass flow outlets, based on ultrasonic Doppler blood flow spectrums, were obtained by correcting the patient’s blood pressure and heart rate (Supplemental Information S1). 18 In this study, the blood was assumed to be an incompressible laminar, homogeneous Newtonian fluid, with a density of 1050 kg/m3 and a dynamic viscosity of 0.0035 Pa·s. 19 The vascular wall was set to be rigid and free of displacement. 20 All models underwent simulation calculations for three cardiac cycles. The CFD-POST (ANSYS Inc.) was used for postprocessing of simulation results. Eight wall shear stress (WSS)–derived parameter values were calculated.
The hemodynamic parameters assessed in this study were as follows: TAWSS, defined as the time-averaged value of blood flow–induced friction stress exerted on the lumen wall; oscillatory shear index (OSI), defined as instantaneous fluctuation of WSS, which was calculated by determining temporal changes of the local WSS vector; relative residence time (RRT), defined as the residence time of the particle (eg, platelets, erythrocytes, and lipid droplets) at the lumen wall; endothelial cell activation potential (ECAP), defined as the vascular wall’s thrombogenic susceptibility, indicating endothelial sensitivity; 21 and high or low hemodynamic parameter areas, defined as the area percentage of the SMA wall in which hemodynamic parameter values were higher or lower than the mean level in individual patients. 22 Detailed calculation formulas are provided in Supplemental Information S2.
Stented Simulations
Stent-vascular composite model reconstructions and mesh generation
To further explore the effect of different stent landing zones on blood flow in the SMA, three stent-vascular composite models (with stent proximal position set as –10 mm, 0 mm, and 10 mm away from the SMA root) and a single vascular model (control model) were constructed using structural simulation (Figure 2).
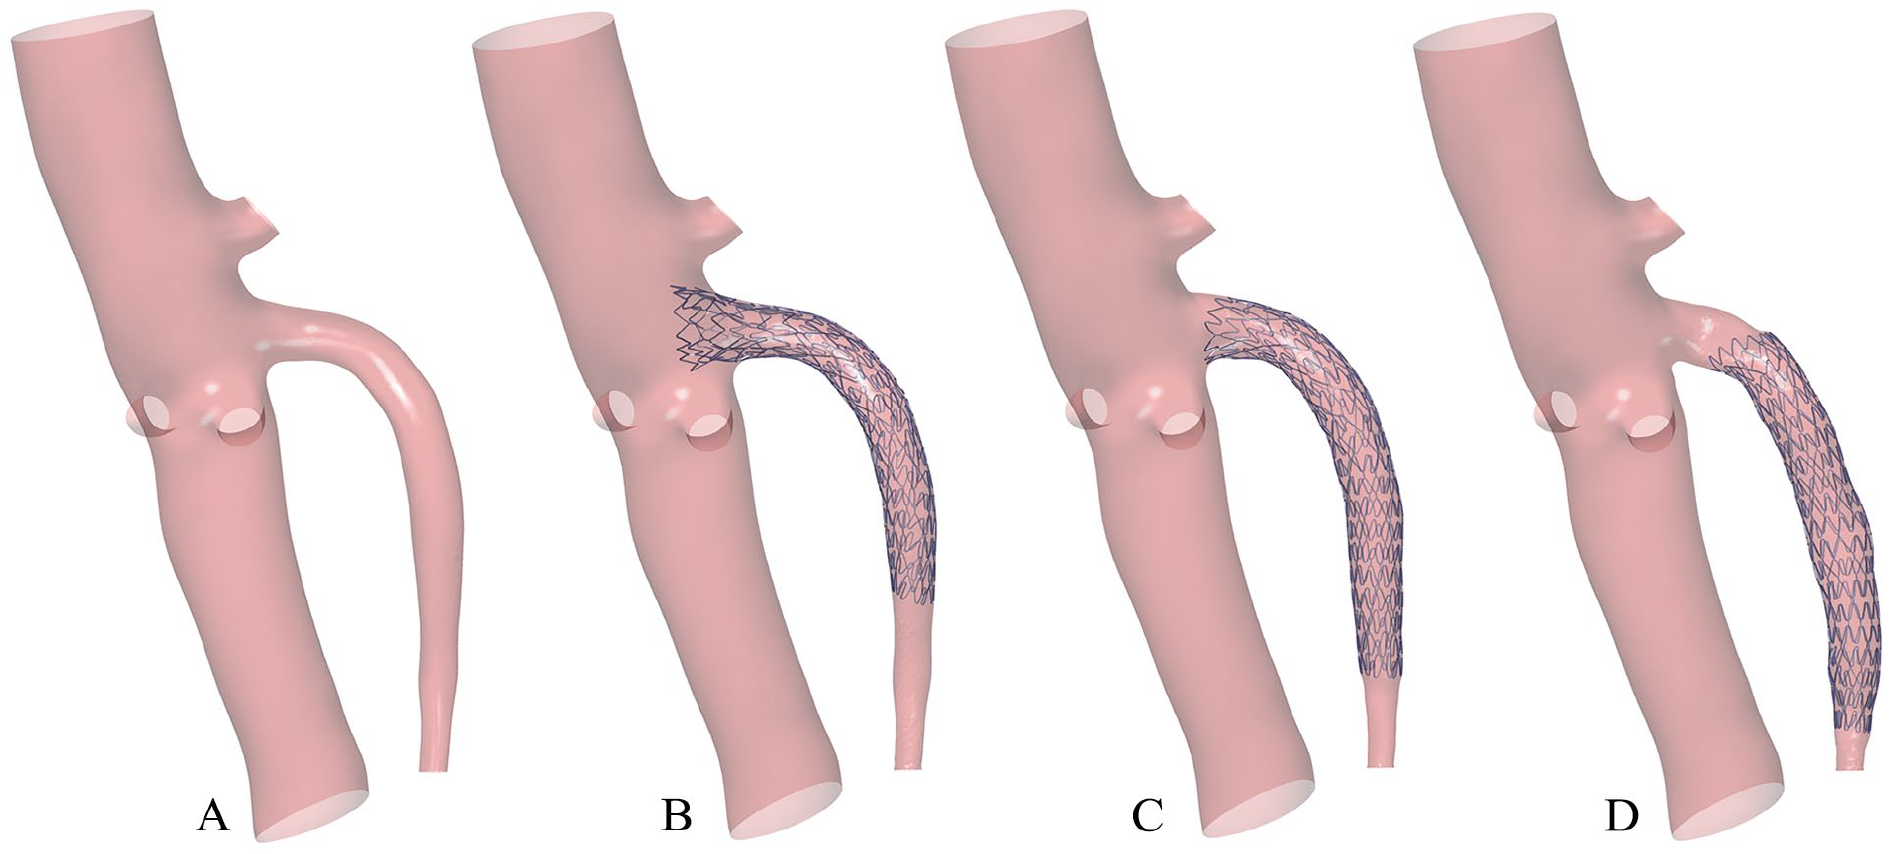
Stented models. (A) Control model. (B–D) Stent-vascular composite models with the proximal position of the stent entry located 10 mm into the abdominal aorta (B), at the superior mesenteric artery (SMA) root (C), or 10 mm away from the SMA root (D).
Based on a previously reported method, 23 the initial vascular geometry was constructed with SOLIDWORKS 2017 (Dassault Systemes, Paris, France) using the mean values of the patient’s SMA-related morphological parameters. The vascular wall density was 1400 kg/m³, the Young’s modulus was 2.7 MPa, and the Poisson’s ratio was 0.45. 23
The geometric structure of the stent was constructed in Abaqus/CAE (Providence, RI, USA) based on EverFlex (EV3, Medtronic), with a length of 60.0 mm, with a restraint diameter of 8.0 mm, wire width of 0.16 mm, and wire thickness of 0.2 mm. 24 The stent wire was set as a self-expanding isotropic super-elastic nitinol, and its constitutive model was set as the model proposed by Lagoudas et al 25 in the Abaqus software. The vascular trunk lumen diameter was 7.4 mm, and the vascular wall thickness was 0.8 mm. The stent structural simulation consisted of three major steps: compression, implantation, and release, as reported in previous studies.26,27 The stent was implanted into three different positions within the same vascular model, and the self-expansion process was then simulated.
The fluid domains for the CFD simulation were obtained from the vascular and stent geometries exported by the structural simulations. The deformed surface meshes were repaired and the complete closed surface fluid domains were then generated in SpaceClaim (ANSYS Inc.) 3D computer-aided design (CAD) modeling software. The fluid domains models were then meshed using tetrahedral elements (approximately 5 100 000–5 800 000 elements in the three stent-vascular composite models; the mesh size for the coverage range of stents was 0.1 mm and the mesh size for other parts of the model was 0.5 mm) in ICEM CFD V. 19, based on a previously described method for determining grid independence. 28 The final mesh was determined when the relative error of the area-averaged WSS between the intermediate and finest mesh was less than 0.4% (Supplemental Table S2). 29
Stented CFD
To ensure the comparability of the calculation parameters, the same equations and boundary conditions were used in CFD simulations for the four specific models, and the vascular and stent wall were both set to be rigid and free of displacement.
Statistical Analysis
For statistical analysis, SPSS 26.0 (SPSS Inc., Chicago, IL, USA) and GraphPad Prism 9 (GraphPad Software, Inc., Boston, MA, USA) were used. Normally distributed continuous variables were represented as mean±standard deviation, non-normally distributed continuous variables were represented as median (interquartile range), and categorical variables were represented as number (%). All continuous variables were compared using Student t tests or Mann-Whitney U tests, and all categorical variables were compared using χ2 tests or Fisher exact tests. Univariable and multivariable logistic regression analyses were performed to calculate odds ratios (ORs) and associated 95% confidence intervals (CIs) and thus identify independent risk factors for ISR. Receiver operating characteristic curve analysis was used to evaluate predictive performance of the model. A p value<0.05 was considered statistically significant.
Results
Patients
A total of 127 patients with SMAD underwent stent placement during the study period and were assessed for study inclusion (Figure 3). The final study population included 26 patients with ISR (ISR group; 23 men, 3 women; mean age, 54.9±6.9 years; range, 43–77 years) and 26 patients without ISR (control group; 23 men, 3 women; mean age, 53.4±8.5 years; range, 41–73 years). Information about baseline characteristics is shown in Table 1. The classification of all SMAD patients is shown in Table 2.
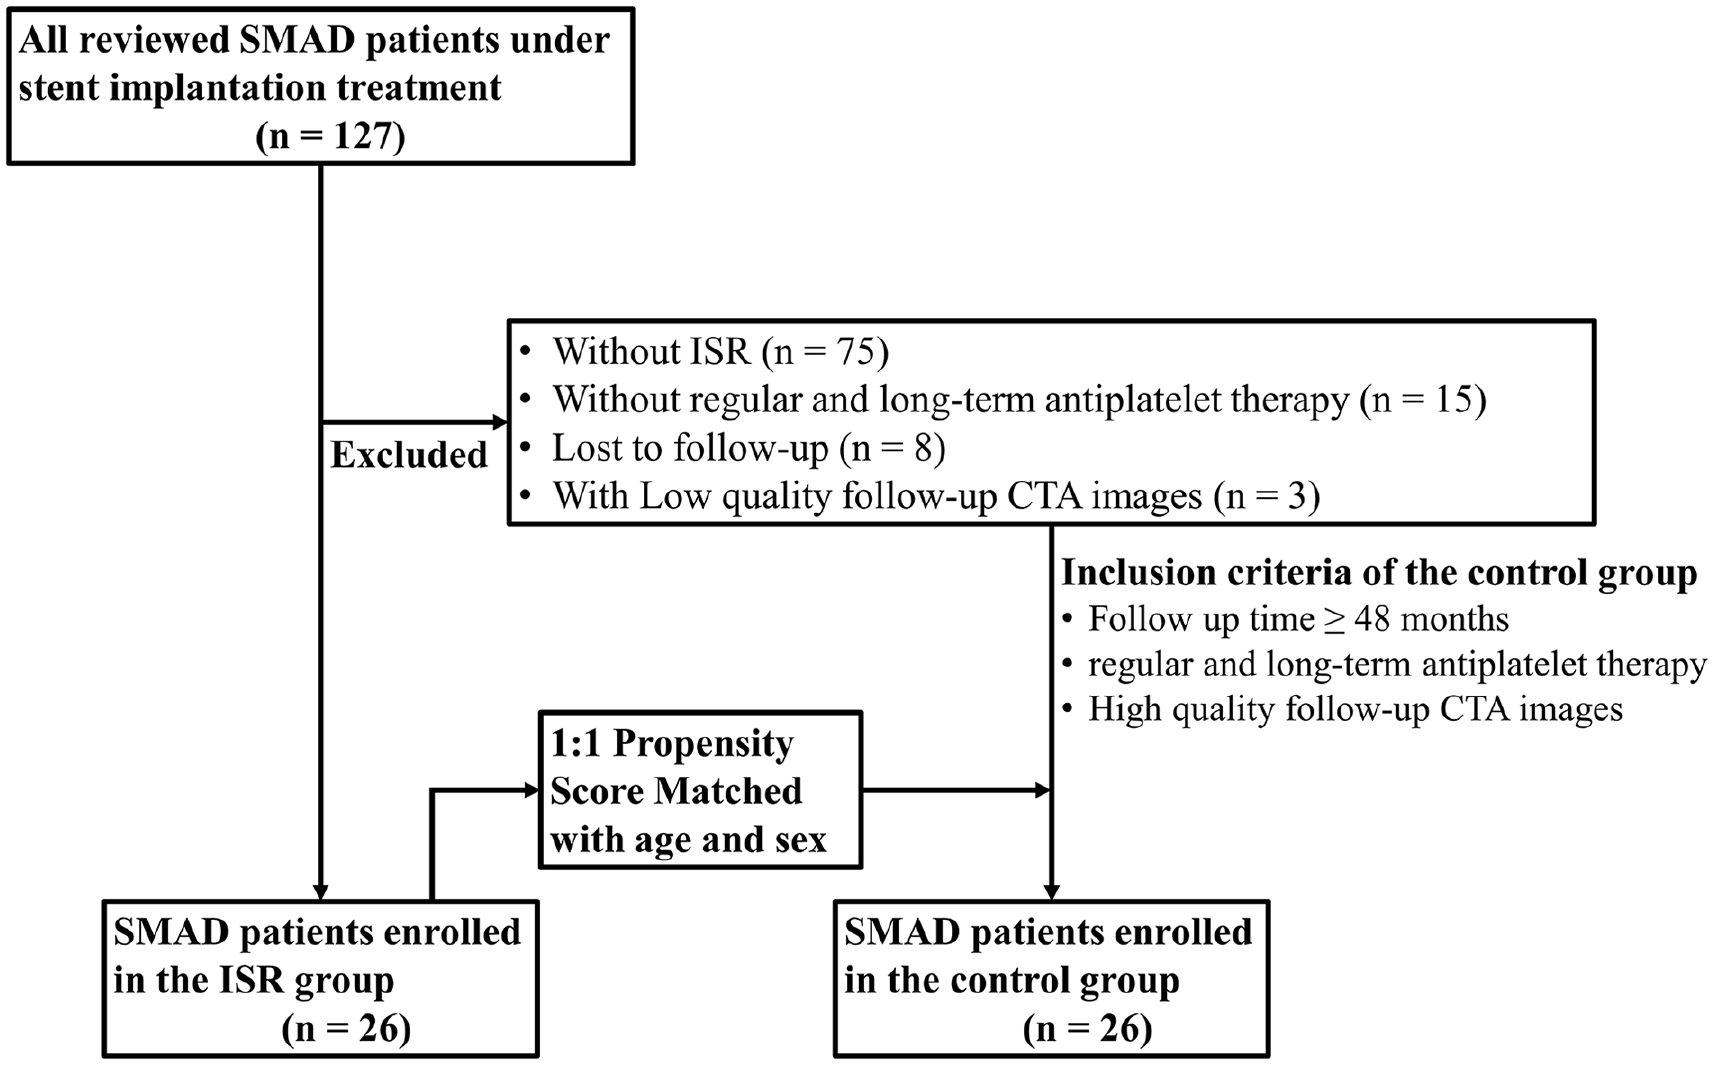
Flow chart demonstrating patient selection for the in-stent restenosis (ISR) and control groups. CTA, computed tomographic angiography; SMAD, superior mesenteric artery dissection.
Baseline Characteristics of Study Patients.
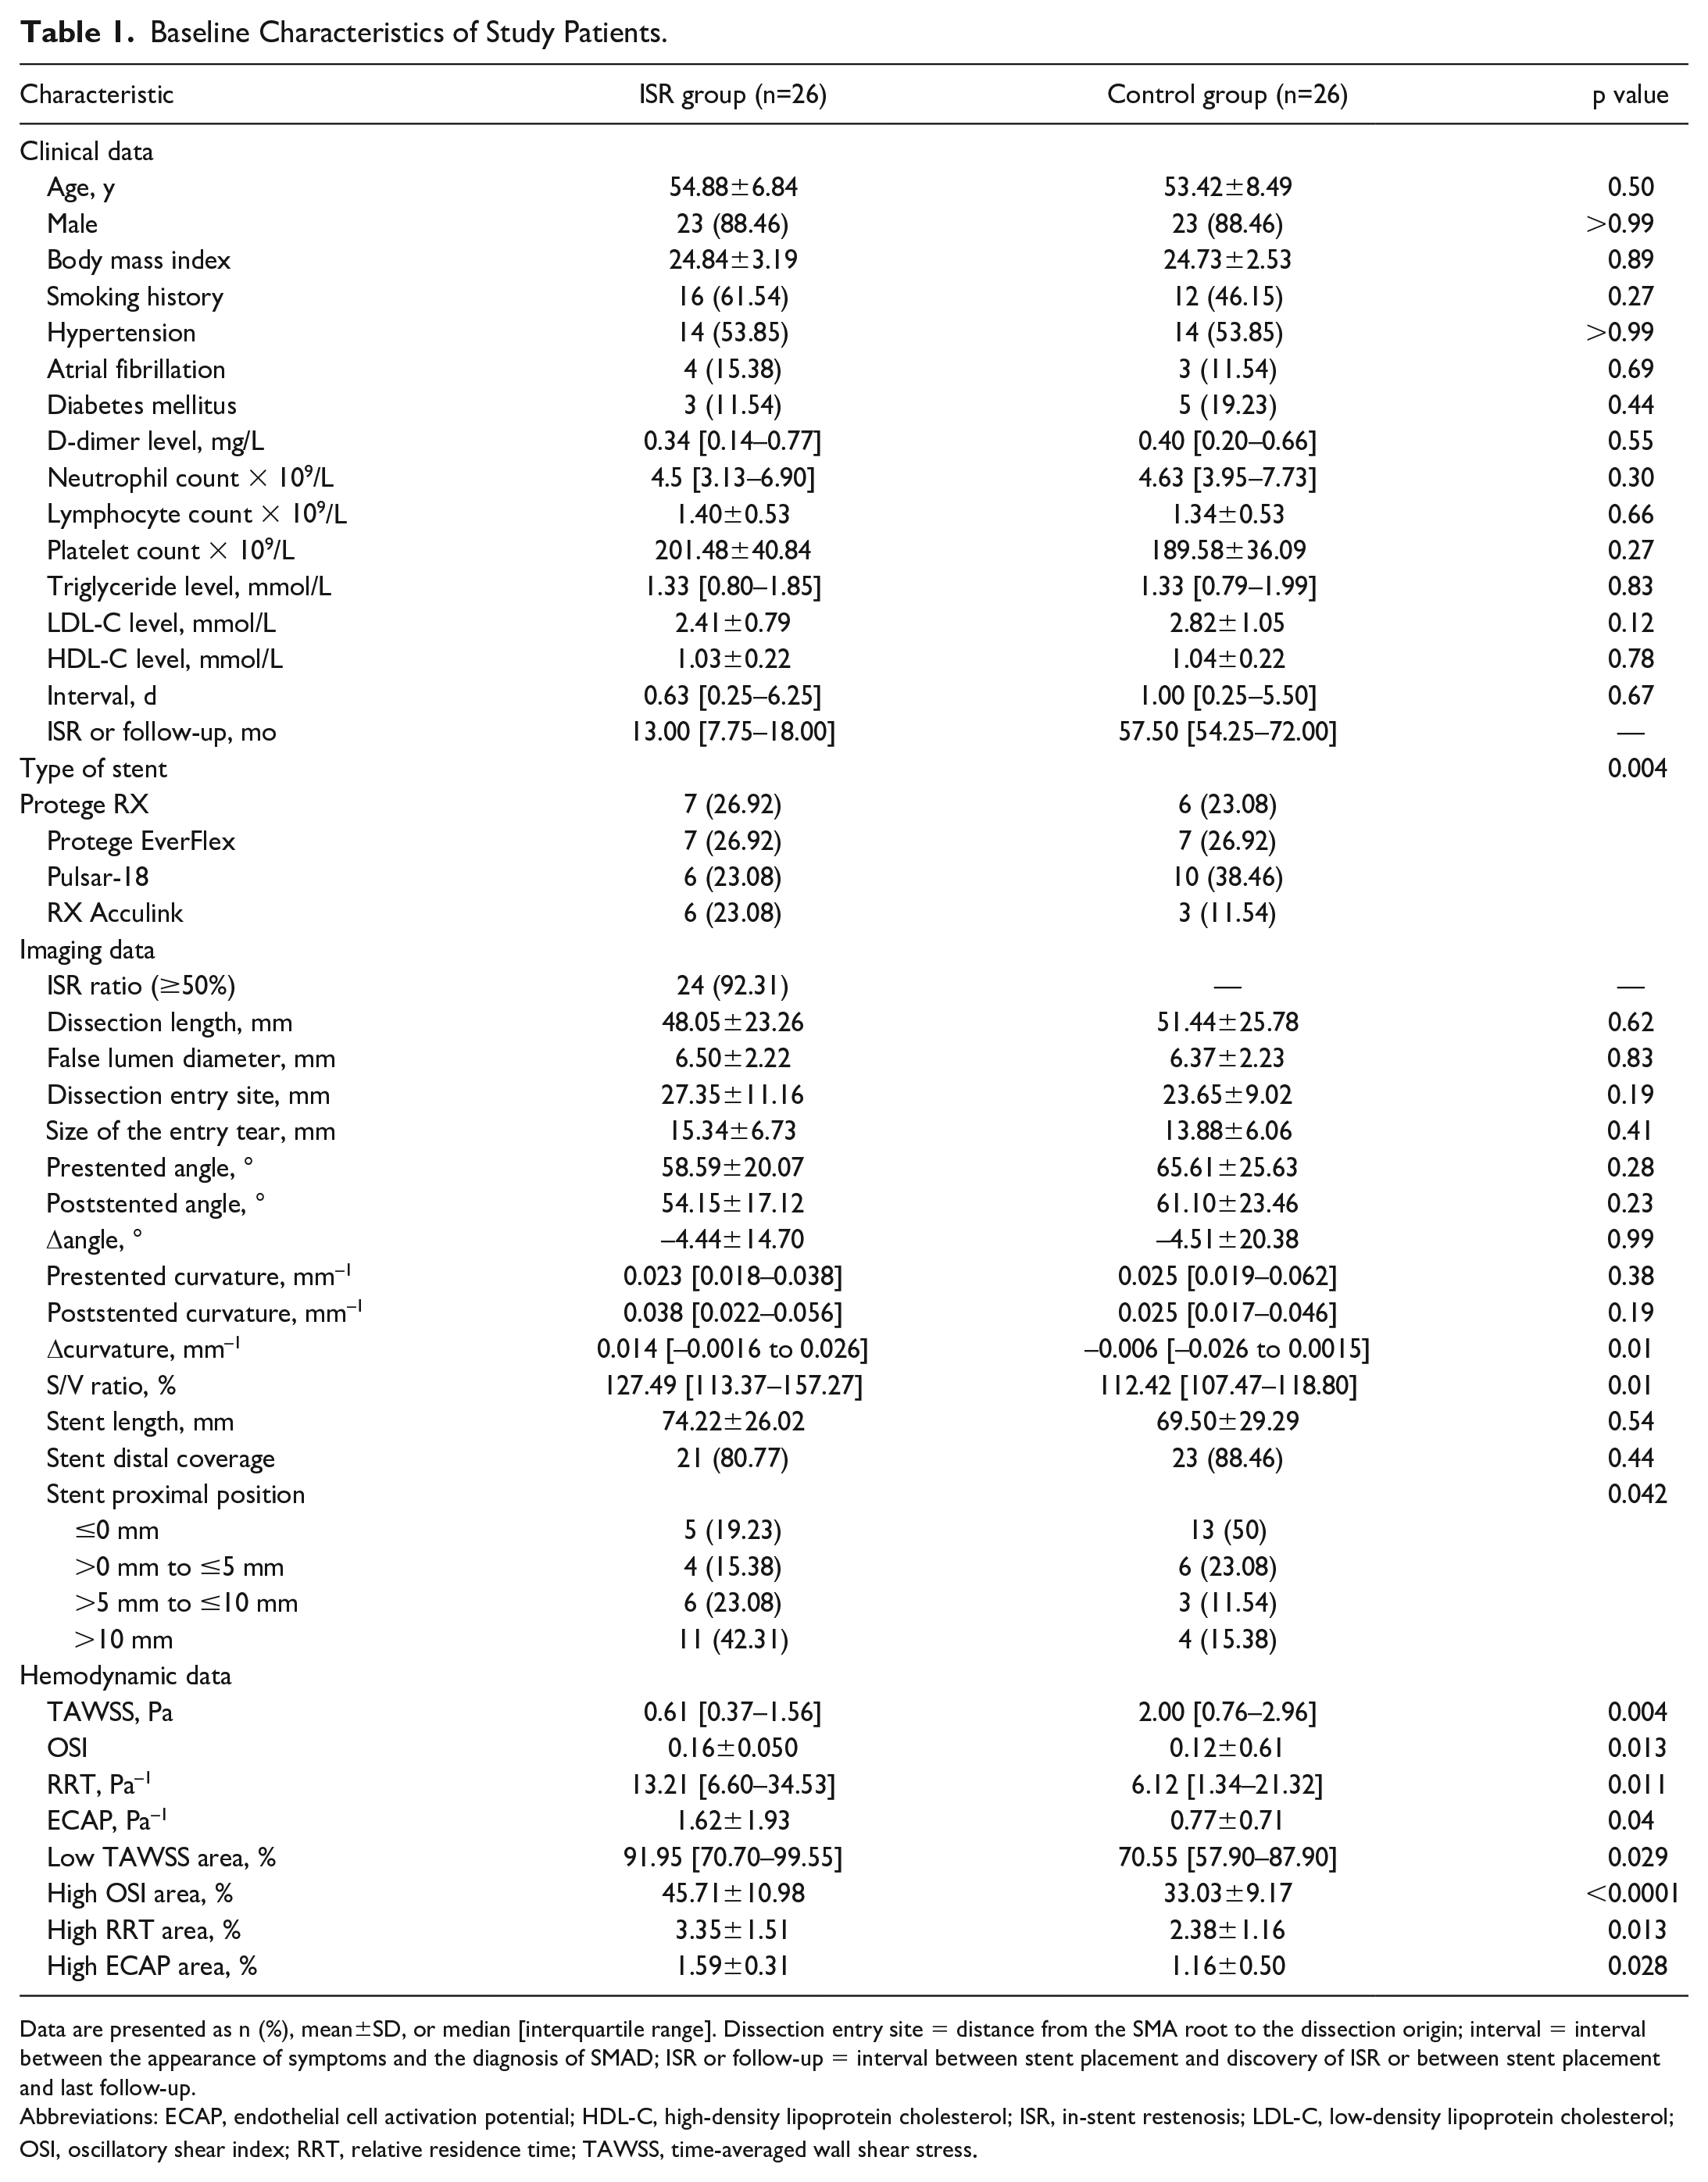
Data are presented as n (%), mean±SD, or median [interquartile range]. Dissection entry site = distance from the SMA root to the dissection origin; interval = interval between the appearance of symptoms and the diagnosis of SMAD; ISR or follow-up = interval between stent placement and discovery of ISR or between stent placement and last follow-up.
Abbreviations: ECAP, endothelial cell activation potential; HDL-C, high-density lipoprotein cholesterol; ISR, in-stent restenosis; LDL-C, low-density lipoprotein cholesterol; OSI, oscillatory shear index; RRT, relative residence time; TAWSS, time-averaged wall shear stress.
Imaging-Based Types of Superior Mesenteric Artery Dissection in Two Groups of Patients.
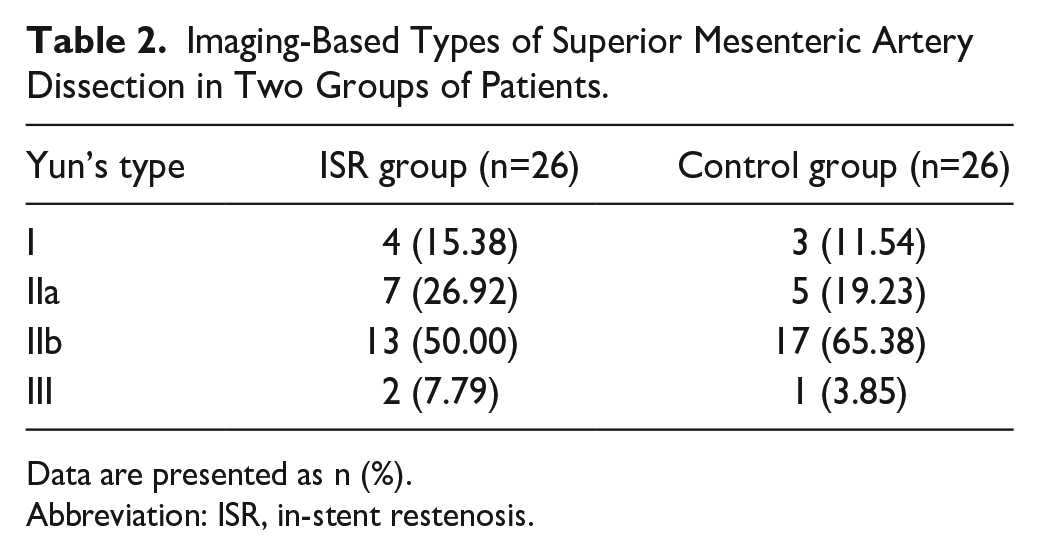
Data are presented as n (%).
Abbreviation: ISR, in-stent restenosis.
Risk Factors and Prediction Models for ISR
In the univariate analysis of all factors, Δcurvature (p=0.002), S/V ratio (p=0.018), stent proximal position (p=0.012), OSI (p=0.019), RRT (p=0.041), high OSI area (p=0.001), and high RRT area (p=0.019) were significantly associated with ISR. In multivariate analysis, S/V ratio (p=0.045), stent proximal position >10 mm away from the SMA root (p=0.010), and high OSI area (p=0.029) were found to be predictors of ISR (Table 3). The area under the curve of the comprehensive prediction model (S/V ratio+stent proximal position+high OSI area) was 0.963 (95% CI: 0.920–1.000; p<0.0001; Figure 4). The sensitivity and specificity values of the comprehensive prediction model are 88.46% and 92.31%, respectively.
Univariable and Multivariable Logistic Regression Analyses for In-stent Restenosis Risk Factors.
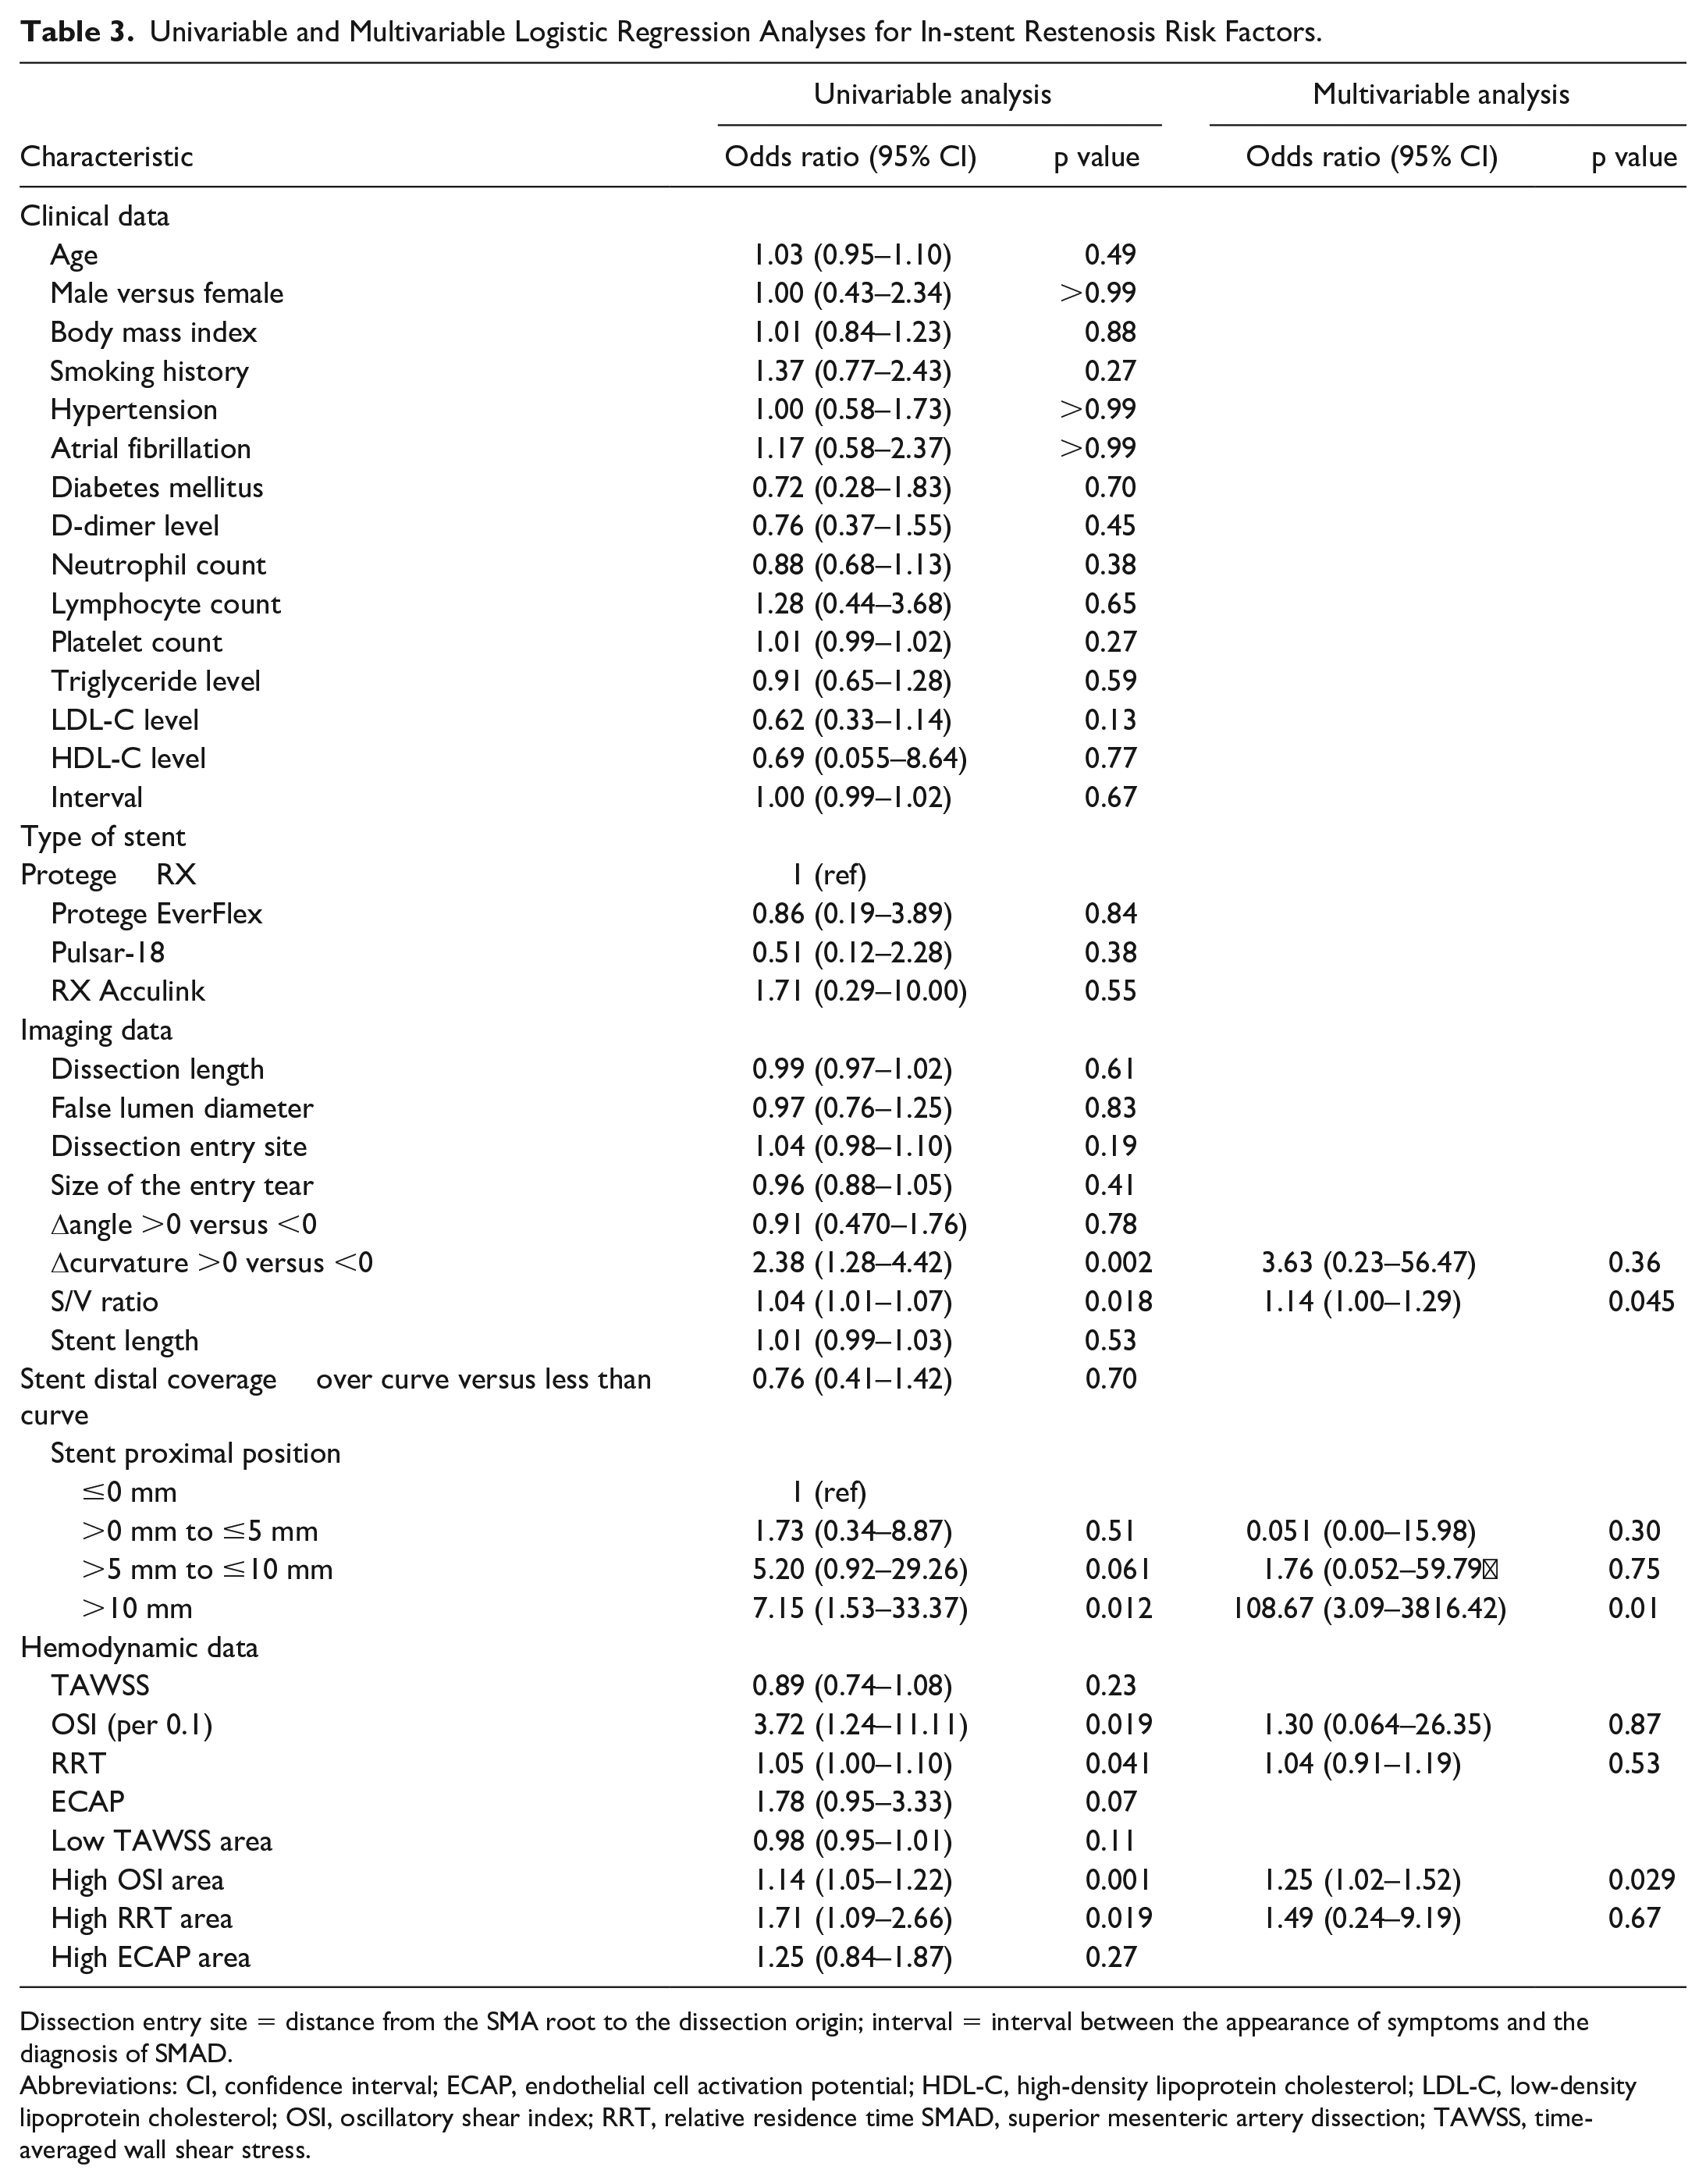
Dissection entry site = distance from the SMA root to the dissection origin; interval = interval between the appearance of symptoms and the diagnosis of SMAD.
Abbreviations: CI, confidence interval; ECAP, endothelial cell activation potential; HDL-C, high-density lipoprotein cholesterol; LDL-C, low-density lipoprotein cholesterol; OSI, oscillatory shear index; RRT, relative residence time SMAD, superior mesenteric artery dissection; TAWSS, time-averaged wall shear stress.
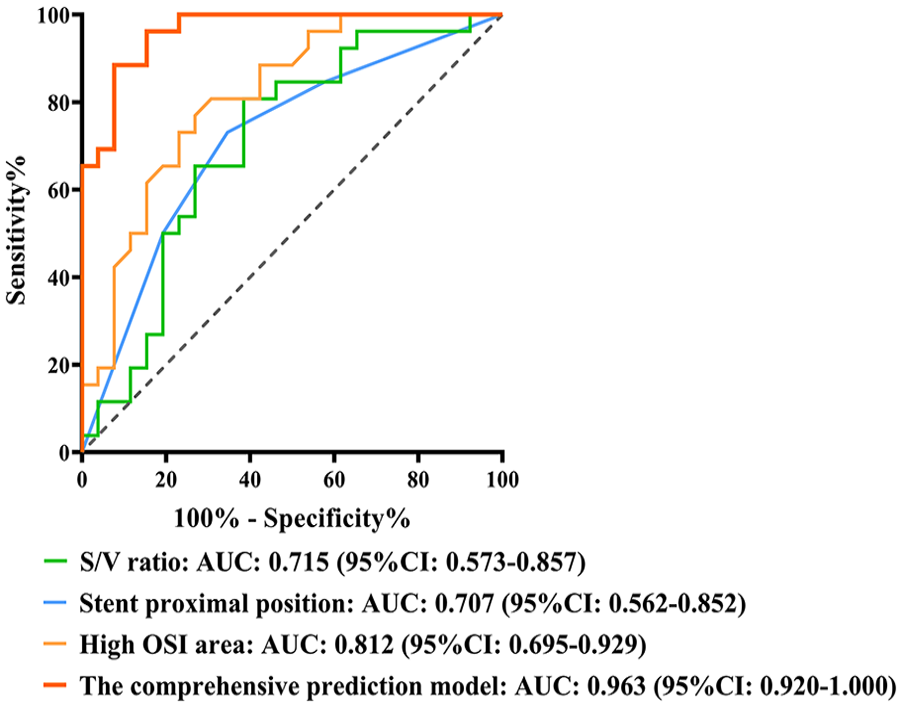
The ability to predict the occurrence of in-stent restenosis by the comprehensive prediction model (S/V ratio+stent proximal position+high OSI area) was evaluated by the receiver operating characteristic (ROC) curve. AUC, area under the curve; CI, confidence interval; S/V ratio, stent-to-vascular ratio.
Computational Fluid Dynamics
Blood flow alterations
In all models, vortices appeared at the SMA root, with no differences in distribution location or scope (Figure 5A). In the proximal position –10 mm model, the stent struts acted as obstacles, destroying the axial blood flow in the AA but without creating substantial disturbances in the direction or velocity of blood flow in the SMA near-wall region. As the proximal position of stents moved from –10 mm to 10 mm, the distal SMA lumen was gradually expanded (Figure 5B). In the proximal position 10 mm model, the blood flow produced a much lower velocity gradient and a larger wake region (low-velocity region with circulation) near the expanded wall boundary, further compressing the high-speed blood flow region in the center of the lumen.
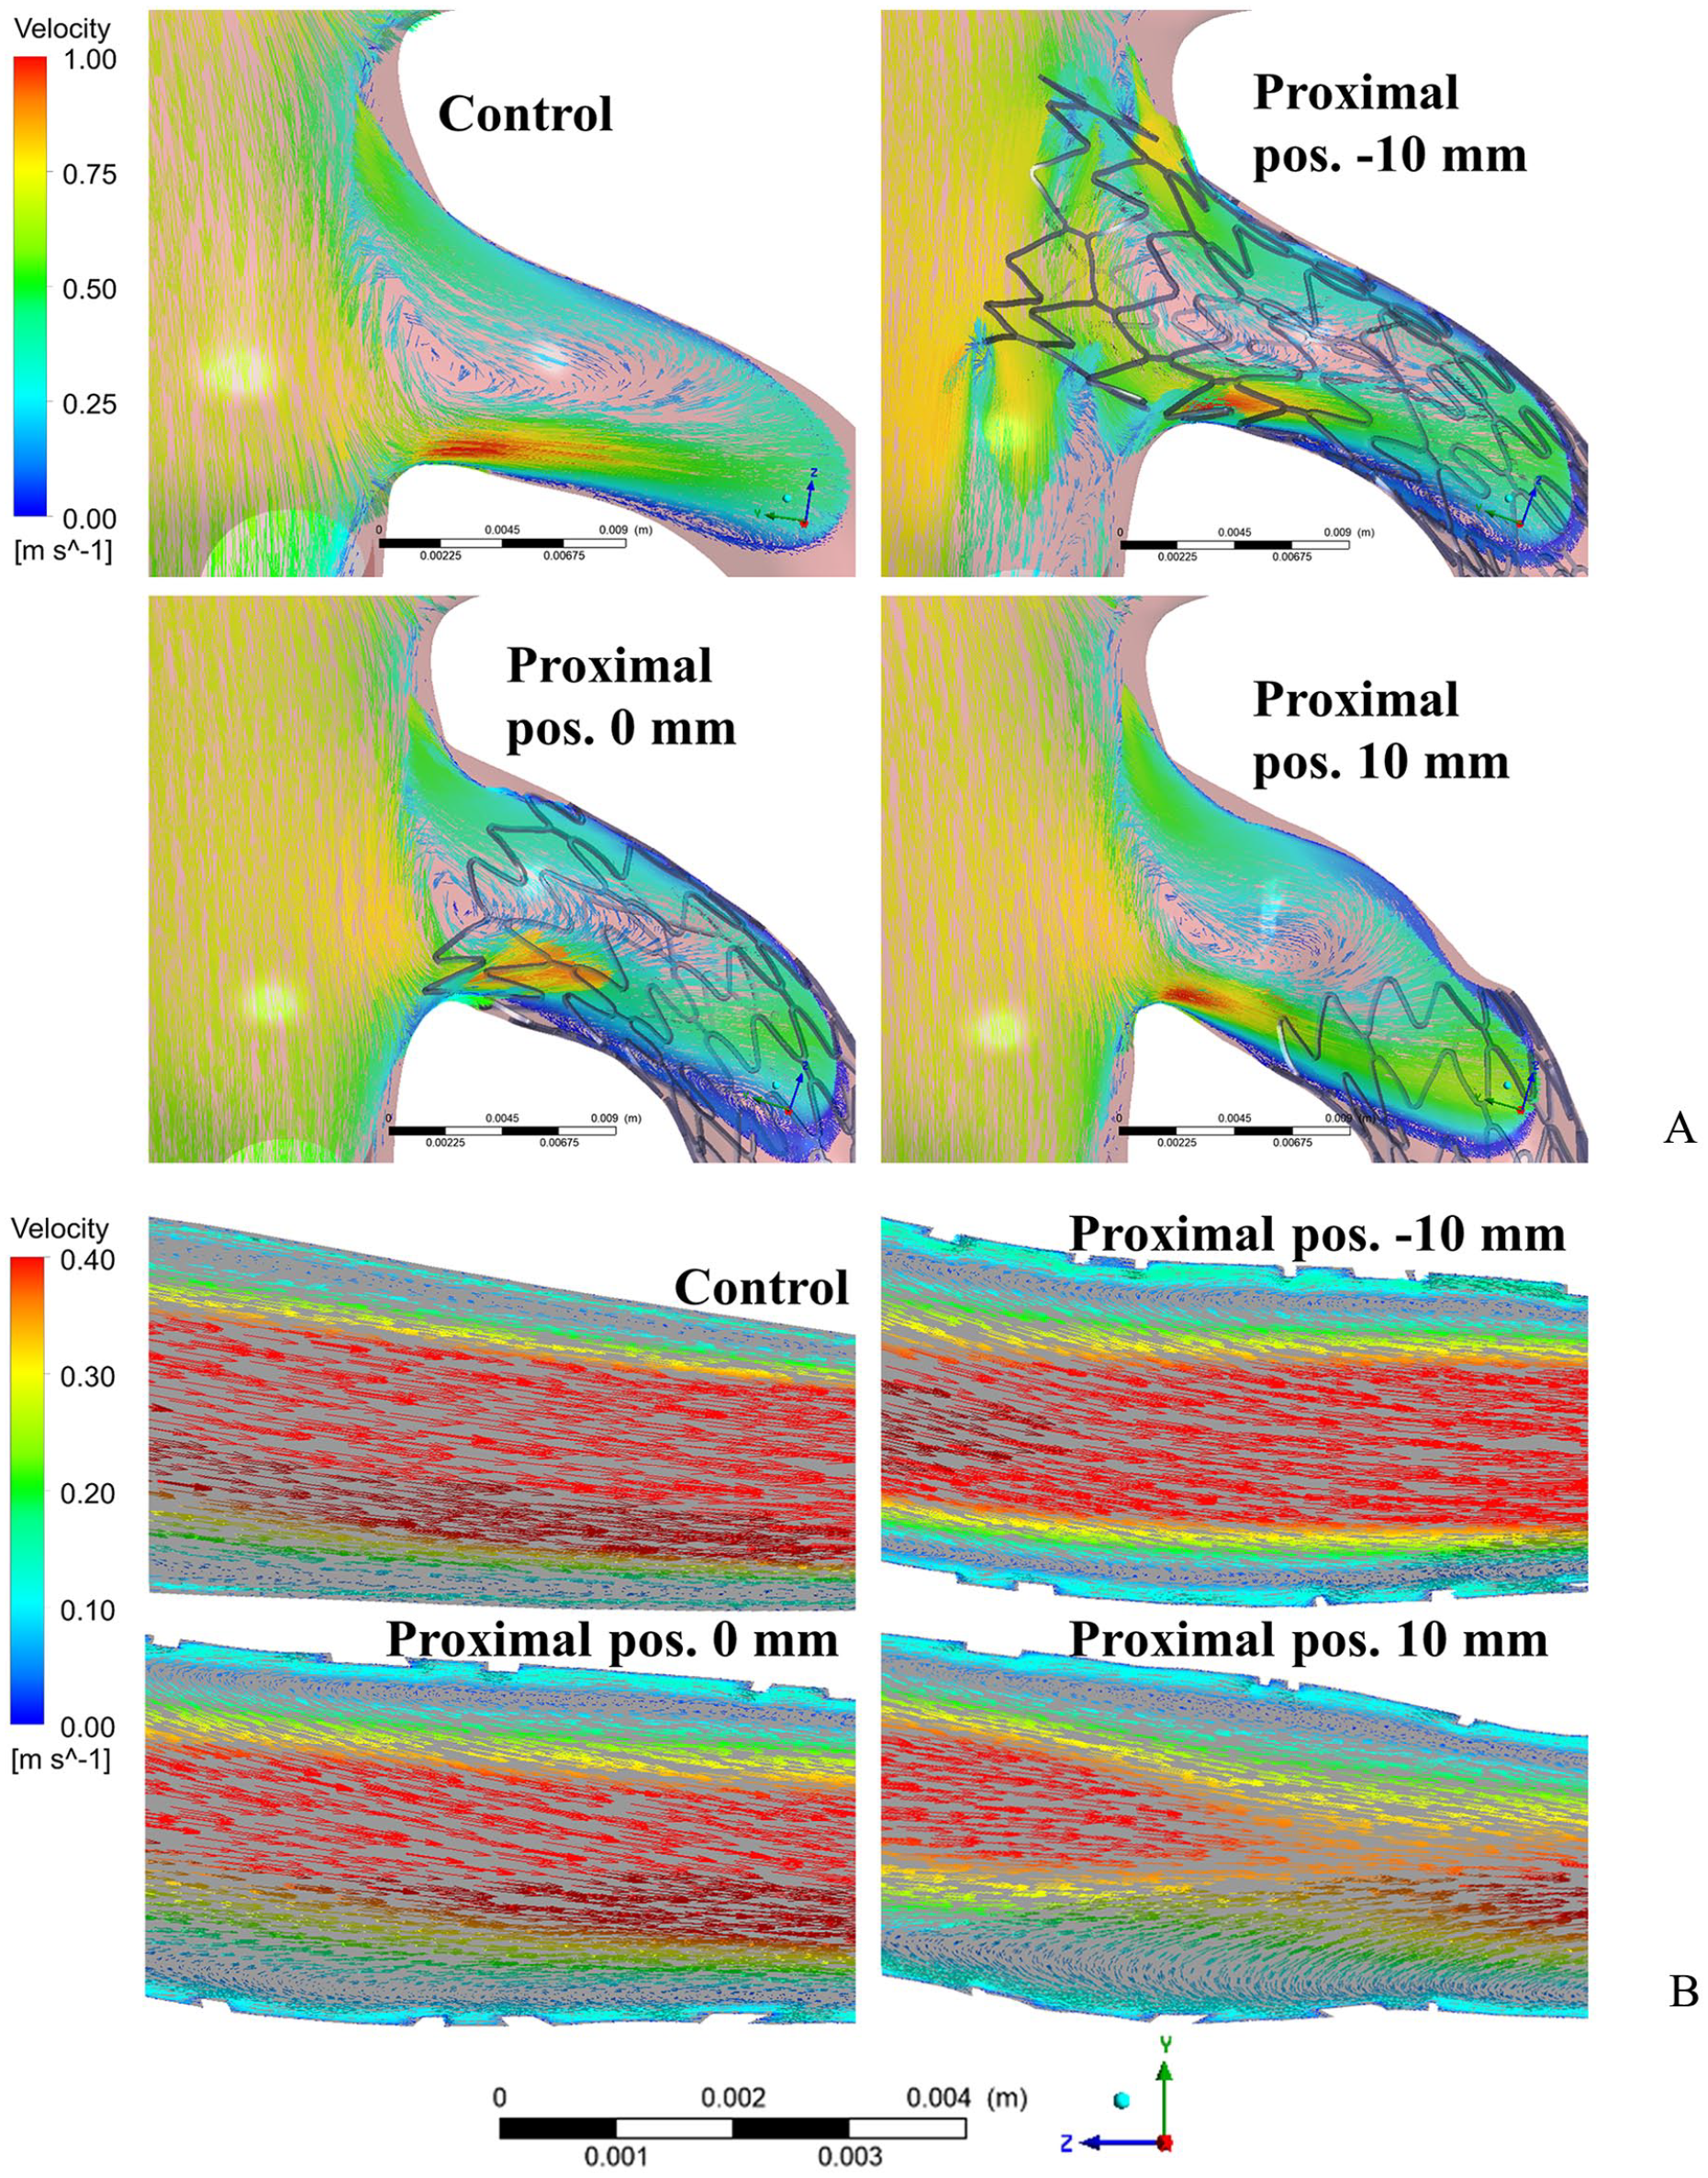
Cross-sectional view of the flow velocity vectors on the superior mesenteric artery (SMA) root (A) and the flow velocity vectors on the SMA distal segments (B) in four models. Proximal pos –10 mm = proximal position of stent entry was 10 mm into the abdominal aorta; proximal pos. 0 mm = proximal position of stent entry was at the SMA root; proximal pos. 10 mm = proximal position of stent entry was 10 mm away from the SMA root.
Time-averaged wall shear stress and OSI
The TAWSS values decreased (Figure 6A) and the low TAWSS area increased (Figure 6C) within the expansion range of the stent. As the proximal position of the stent moved away from the SMA root (from –10 mm to 10 mm), the low TAWSS area on the SMA distal segment further increased (from 73.9% to 89.3%). Compared with the mean TAWSS value of the control model, the mean TAWSS values of the stent placement models were lower, as shown on a curve chart demonstrating the mean TAWSS along the centerline of the SMA lumen (from the root to the distal end; Figure 6D). As the lumen diameter decreased at the distal end, the mean TAWSS increased rapidly, and the mean TAWSS of the proximal position –10 mm model began to increase at the farthest distance away from the SMA root.
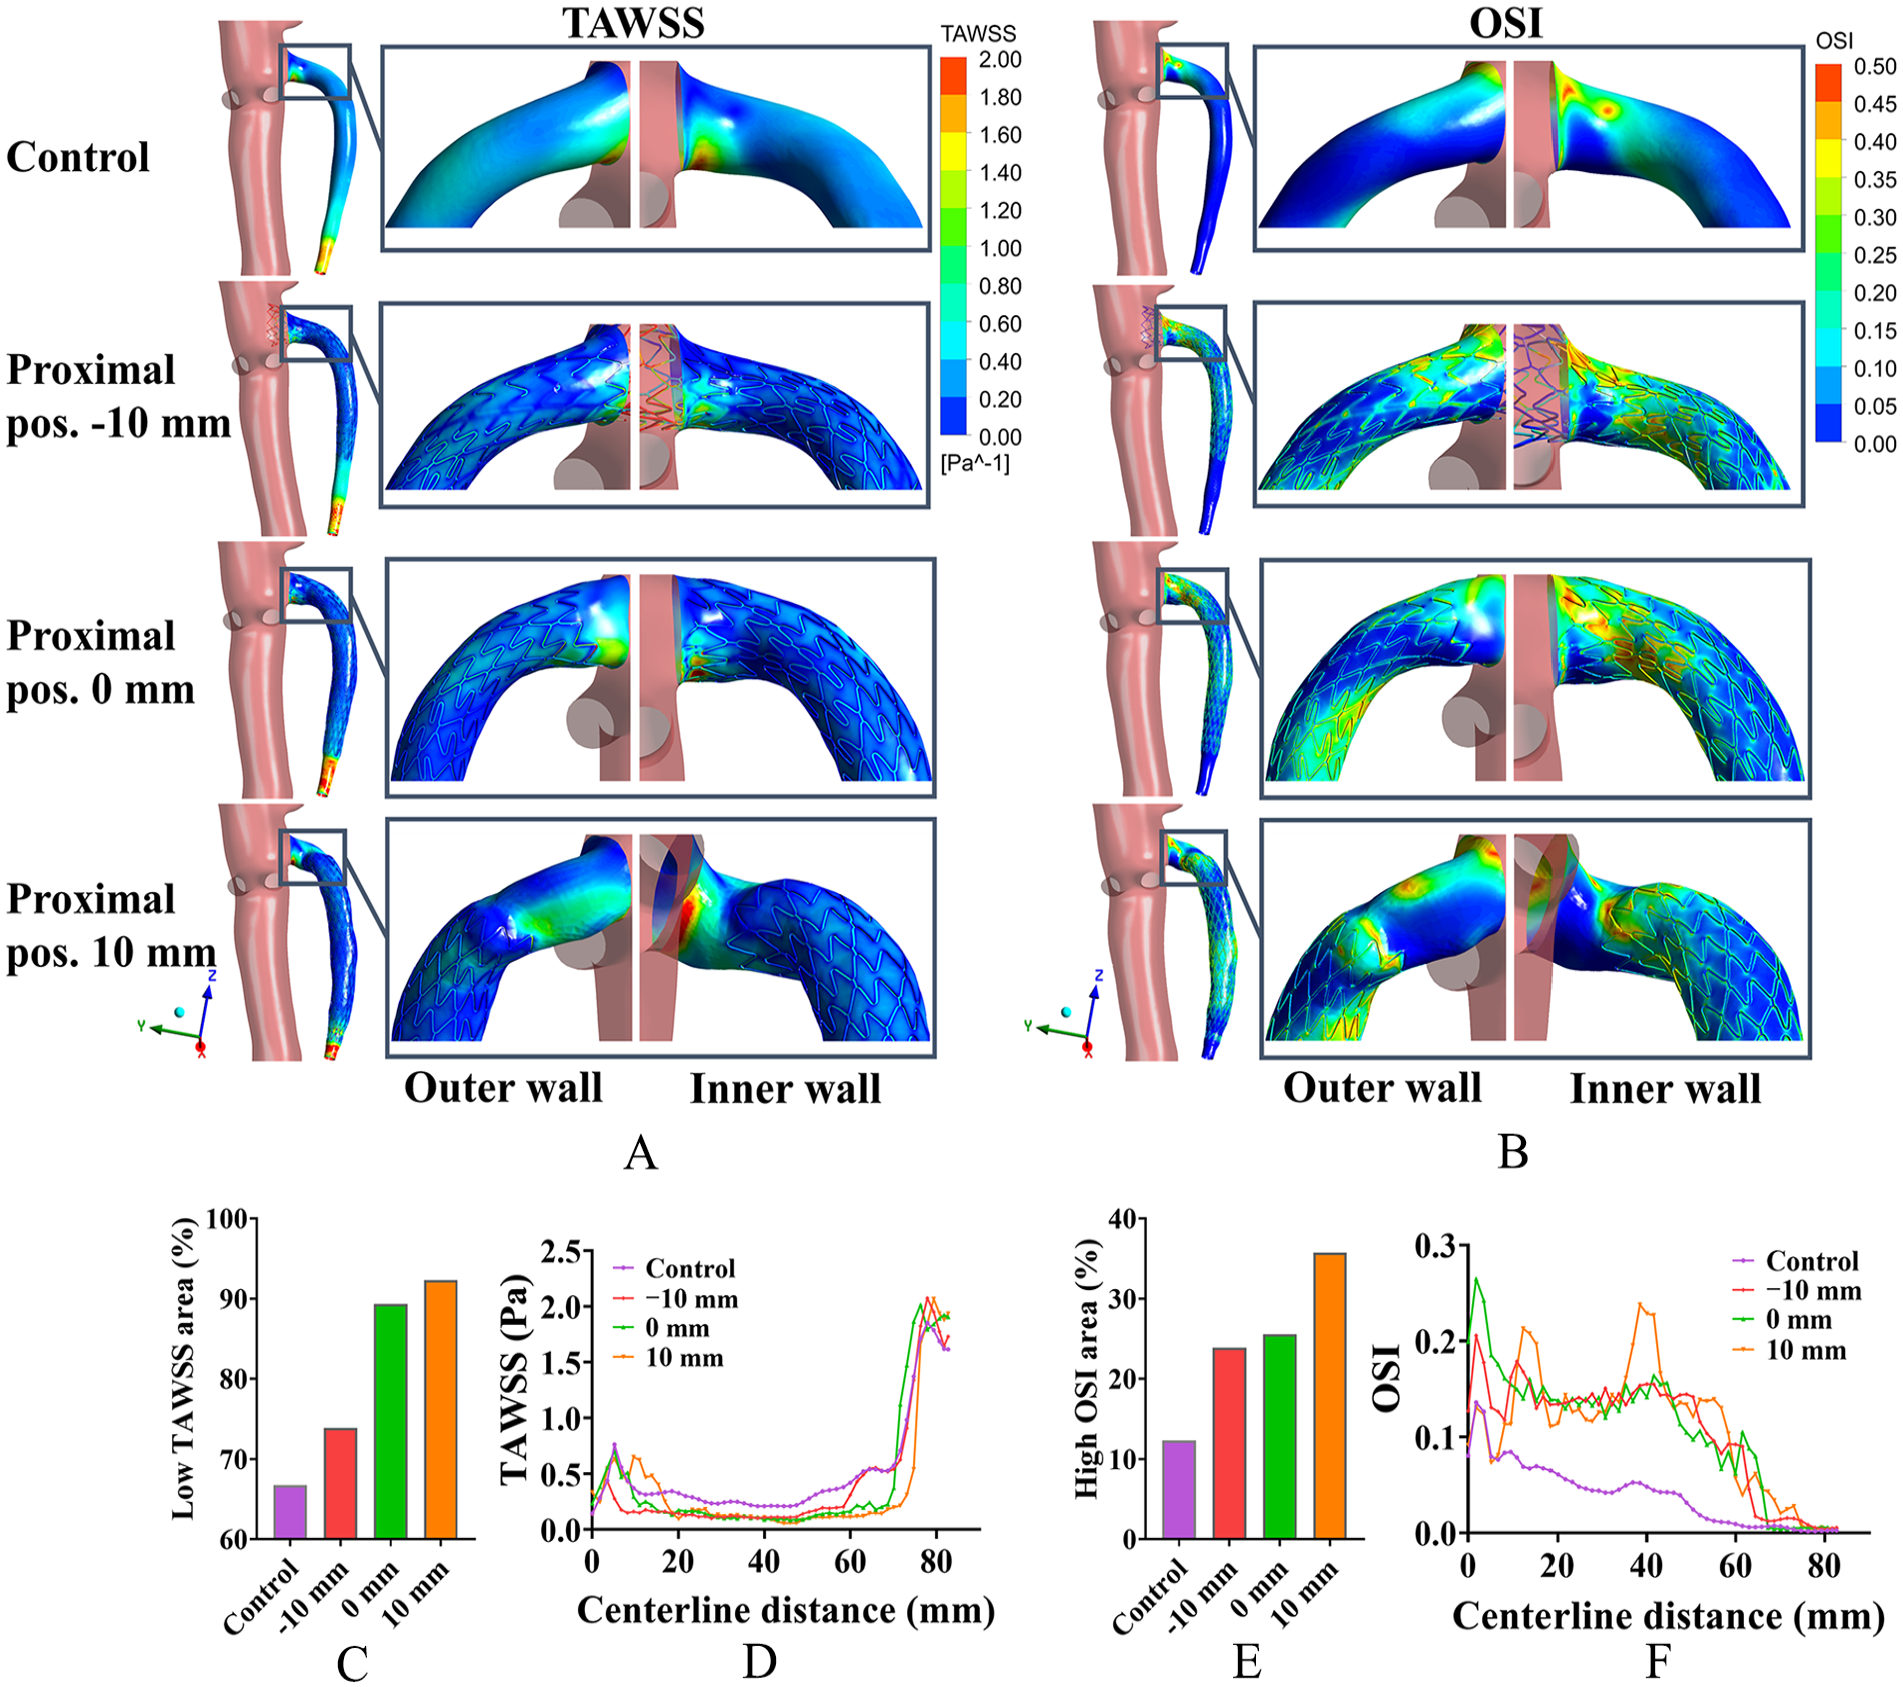
(A) Time-averaged wall shear stress (TAWSS) and (B) oscillatory shear index (OSI) distribution on superior mesenteric artery (SMA) wall. (C) Percentage of low TAWSS area (on SMA wall) and (D) curve chart of mean TAWSS along the centerline of the SMA lumen for all models. (E) Percentage of high OSI area (on SMA wall) and (F) curve chart of mean OSI along the centerline of the SMA lumen for all models. Proximal pos. –10 mm = proximal position of stent entry was 10 mm into the abdominal aorta; proximal pos. 0 mm = proximal position of stent entry was at the SMA root; proximal pos. 10 mm = proximal position of stent entry was 10 mm away from the SMA root.
Before stenting, regions of high OSI were seen only on the SMA root (Figure 6B). After stent placement, the initial high OSI area (on the SMA root) was further expanded. The proximal position 10 mm model had the highest percentage of high OSI area (35.7%), with a larger high OSI distribution at the middle and distal segments of the SMA and at the contact area between the stent proximal end and vascular wall (Figure 6E). A curve chart showing mean OSI (Figure 6F) demonstrated that stent placement led to an overall increase in mean OSI, with some peaks appearing. In the proximal position 0 mm model, the peak value mainly occurred in the range of 0 mm to 10 mm at the root of the SMA. In the proximal position –10 mm model, there were two peaks in the range of 10 mm to 20 mm and 30 mm to 50 mm away from the SMA root.
Relative residence time and ECAP
The distribution characteristics of RRT (Figure 7A) and ECAP (Figure 7B) were similar. In the control model, the high value regions were mainly distributed on the anterior medial wall of the SMA root. In the proximal position –10 mm and proximal position 0 mm models, the high value regions were mainly distributed on the anterior wall of the SMA root and the posterior inner wall of the SMA bend. In the proximal position 10 mm model, the high value regions were also distributed on the contact area between the stent proximal end and vascular wall, and on the middle and distal segments of the SMA. In addition, the regions with high RRT and ECAP showed correlations with the regions of low TAWSS and high OSI. The percentages of high RRT and ECAP increased sharply after stent placement and were highest in the proximal position 10 mm model (RRT, 4.4%; ECAP, 3.3%, Figures 7C and E). In the curve charts (Figures 7D and F), the peak distribution characteristics of mean RRT and ECAP were similar to those of mean OSI.
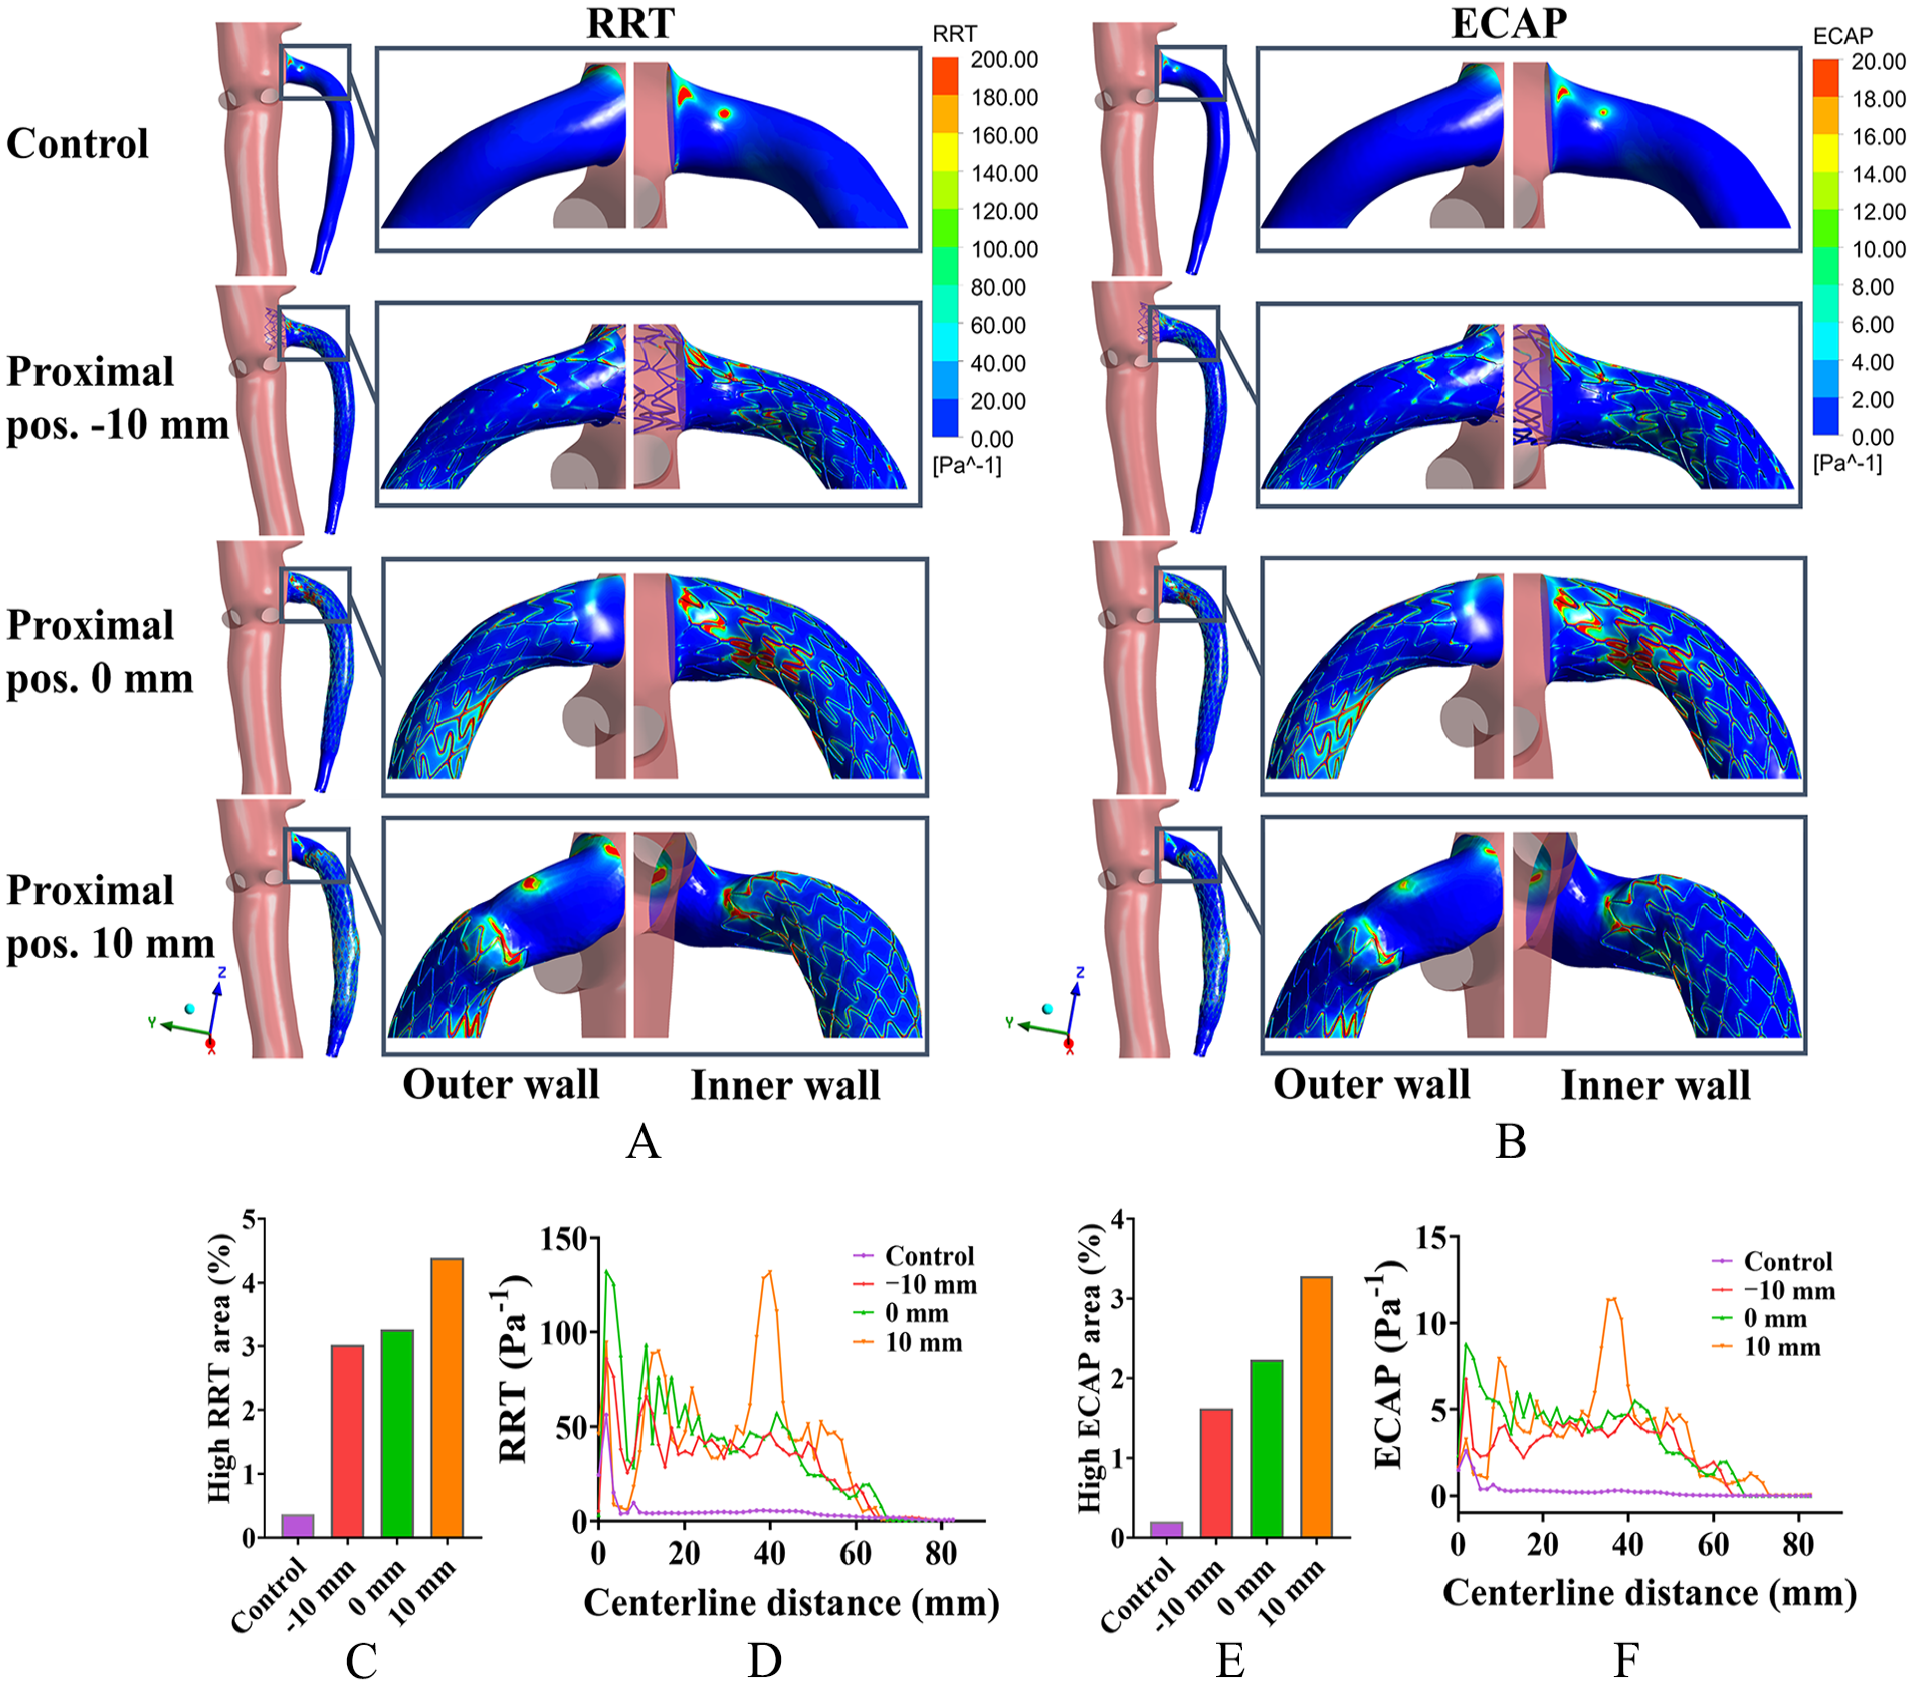
(A) Relative residence time (RRT) and (B) endothelial cell activation potential (ECAP) distribution on superior mesenteric artery (SMA) wall. (C) Percentage of high RRT area (on SMA wall) and (D) curve charts of mean RRT along the centerline of the SMA lumen for all models. (E) Percentage of high ECAP area (on SMA wall) and (F) curve charts of mean ECAP along the centerline of the SMA lumen for all models. Proximal pos. –10 mm = proximal position of stent entry was 10 mm into the abdominal aorta; proximal pos. 0 mm = proximal position of stent entry was at the SMA root; proximal pos. 10 mm = proximal position of stent entry was 10 mm away from the SMA root.
Discussion
In this study, patients in the ISR group had a more obvious increase in SMA curvature and a higher S/V ratio after stent placement than those in the control group. The stent proximal position also differed between the two groups. In terms of hemodynamic analysis, those in the ISR group had lower TAWSS and higher OSI, RRT, ECAP, high OSI area, high RRT area, high ECAP area, and low TAWSS area than those in the control group. Multivariable analysis demonstrated that S/V ratio, stent proximal position, and high OSI area were independent risk factors for the occurrence of ISR.
Through the use of structural and fluid dynamics simulations, this study was able to demonstrate the possible hemodynamic mechanism underlying the risk factors associated with ISR. Structural simulations demonstrated that the proximal position –10 mm and proximal position 0 mm models were able to better maintain the original morphological structure of the SMA root without overdilation of the distal segment of the SMA. In the proximal position 10 mm model, an obvious angulation formed on the contact area between the stent proximal end and vascular wall, and excessive expansion of the thinner lumen in the SMA distal segment was observed. These morphological changes led to a chain reaction affecting hemodynamic factors in the SMA lumen.
The vector diagrams of blood flow demonstrated that, in the proximal position –10 mm model, although the proximal struts of the stent disturbed the axial blood flow in the AA lumen, this did not create substantial disturbances on the near-wall region in the SMA root or lumen. In the proximal position 10 mm model, however, the thinner lumen in the distal segment of the SMA was overexpanded, resulting in a larger wake region (ie, a low-velocity region with possible circulations) produced in the near-wall region of the SMA. These near-wall low-velocity circulation regions have previously been shown to play a major role in endothelial hyperplasia and platelet activation. 30
In this study, the value of TAWSS decreased and the values of OSI, RRT, and ECAP increased after stenting. In the stent-vascular composite models, the proximal position 10 mm model demonstrated the highest percentages of low TAWSS area, high OSI, RRT, and ECAP area, whereas the proximal position –10 mm model demonstrated the lowest percentages. These findings were consistent with our clinical analysis. The peak values were mainly distributed in the inner wall of the stented vascular bend and in the contact area between the stent end and the vascular wall, perhaps because of stent underexpansion and malapposition. 31 These regions have previously been identified as the areas most commonly affected by ISR in patients with stented SMA.4,8
Time-averaged wall shear stress describes blood flow–induced friction stress on the lumen wall. Previous research has shown that TAWSS can affect the process of atherosclerosis by changing the morphology and orientation of endothelial cells. 32 Lower TAWSS near the stented vascular wall may promote the formation of neointimal hyperplasia, resulting in an increased risk of ISR.28,33 The OSI, which reflects the oscillatory degree of WSS on the lumen wall, has been shown to be related to cell inflammation, thrombus formation, and growth.4,34 Previous studies have found that high OSI in stented-vascular wall can promote the production of endothelin-1 mRNA and induce the activation of endothelial cells,35,36 which in turn have been linked to the occurrence of ISR. Measures of RRT and ECAP reflect the combined effects of TAWSS and OSI. Therefore, these measures can provide more regional information about the changes of near-wall hemodynamics in cases of ISR. More specifically, ECAP characterizes the thrombogenic susceptibility of the vascular wall, whereas RRT describes the relatively slower flow characteristics and the particle residence time near the wall. 21 Previous research has shown that areas with the highest ECAP and RRT values are more prone to thrombus development. 37 Our findings confirm these previous results.
Previous studies have shown that patients with stent placement because of SMA occlusion have a 1 year and 5 year stent patency rate of 75% and 39%, respectively. 38 However, two studies reported the medium- and long-term patency of stents for SMAD patients, which were 99% and 90%, respectively.4,8 From this point of view, the medium- and long-term patency of the stent for SMAD patients is better. However, 20 (44.4%) of the 45 SMAD patients reported in another study developed ISR during follow-up. 9 In addition, it is worth noting that only 10 SMAD patients were included in the long-term outcomes study. 4 Therefore, we believe that the long-term patency after SMAD stent placement still needs to be confirmed by more multicenter large sample size studies.
Based on previous studies of endovascular treatment for SMAD, self-expanding bare stents with tapering configurations that completely cover the curvature of the SMA are generally recommended.4,9,39 However, it has been unclear whether the proximal end of the stent needs to be placed beyond or at the dissection entrance. The results of this study suggest that deploying the proximal end of the stent closer to SMA root or less entered into the AA may reduce the risk of ISR and help to maintain long-term patency.
This study had several limitations. First, the study was limited by its small sample size. Nevertheless, it remains one of the largest cohorts of this patient population to be reported to date. 4 Second, only fluid simulation was performed for study patients; patient-specific structural simulations were not performed. Third, in the structural and fluid dynamics simulations for the four specific models used in this study, the method of fluid–structure interaction was not included. Finally, in the three stent-vascular composite models, only a single type of stent from one brand was assessed, and the effects of stent design were not evaluated. Further studies are needed to address these factors.
In conclusion, this study demonstrated that the proximal position of a stent and the S/V ratio are independent risk factors for ISR in patients with SMAD undergoing stent placement, and changes in the hemodynamic factors TAWSS, OSI, RRT, and ECAP are involved in the occurrence of ISR. These findings suggest that deploying the proximal end of the stent near the AA or enter into the AA may reduce the contact area between the proximal struts of the stent and the vascular wall, thus improving the hemodynamic environment in the SMA lumen and ultimately reducing the risk of ISR.
Supplemental Material
sj-docx-1-jet-10.1177_15266028241241494 – Supplemental material for In-stent Restenosis After Stenting for Superior Mesenteric Artery Dissection Is Associated With Stent Landing Zone: From Clinical Prediction to Hemodynamic Mechanisms
Supplemental material, sj-docx-1-jet-10.1177_15266028241241494 for In-stent Restenosis After Stenting for Superior Mesenteric Artery Dissection Is Associated With Stent Landing Zone: From Clinical Prediction to Hemodynamic Mechanisms by Junhao Mei, Hui Yan, Xi Zhao, Yuan Yuan, Haobo Su, Tongqing Xue and Zhongzhi Jia in Journal of Endovascular Therapy
Supplemental Material
sj-docx-2-jet-10.1177_15266028241241494 – Supplemental material for In-stent Restenosis After Stenting for Superior Mesenteric Artery Dissection Is Associated With Stent Landing Zone: From Clinical Prediction to Hemodynamic Mechanisms
Supplemental material, sj-docx-2-jet-10.1177_15266028241241494 for In-stent Restenosis After Stenting for Superior Mesenteric Artery Dissection Is Associated With Stent Landing Zone: From Clinical Prediction to Hemodynamic Mechanisms by Junhao Mei, Hui Yan, Xi Zhao, Yuan Yuan, Haobo Su, Tongqing Xue and Zhongzhi Jia in Journal of Endovascular Therapy
Supplemental Material
sj-docx-3-jet-10.1177_15266028241241494 – Supplemental material for In-stent Restenosis After Stenting for Superior Mesenteric Artery Dissection Is Associated With Stent Landing Zone: From Clinical Prediction to Hemodynamic Mechanisms
Supplemental material, sj-docx-3-jet-10.1177_15266028241241494 for In-stent Restenosis After Stenting for Superior Mesenteric Artery Dissection Is Associated With Stent Landing Zone: From Clinical Prediction to Hemodynamic Mechanisms by Junhao Mei, Hui Yan, Xi Zhao, Yuan Yuan, Haobo Su, Tongqing Xue and Zhongzhi Jia in Journal of Endovascular Therapy
Supplemental Material
sj-docx-4-jet-10.1177_15266028241241494 – Supplemental material for In-stent Restenosis After Stenting for Superior Mesenteric Artery Dissection Is Associated With Stent Landing Zone: From Clinical Prediction to Hemodynamic Mechanisms
Supplemental material, sj-docx-4-jet-10.1177_15266028241241494 for In-stent Restenosis After Stenting for Superior Mesenteric Artery Dissection Is Associated With Stent Landing Zone: From Clinical Prediction to Hemodynamic Mechanisms by Junhao Mei, Hui Yan, Xi Zhao, Yuan Yuan, Haobo Su, Tongqing Xue and Zhongzhi Jia in Journal of Endovascular Therapy
Supplemental Material
sj-tif-5-jet-10.1177_15266028241241494 – Supplemental material for In-stent Restenosis After Stenting for Superior Mesenteric Artery Dissection Is Associated With Stent Landing Zone: From Clinical Prediction to Hemodynamic Mechanisms
Supplemental material, sj-tif-5-jet-10.1177_15266028241241494 for In-stent Restenosis After Stenting for Superior Mesenteric Artery Dissection Is Associated With Stent Landing Zone: From Clinical Prediction to Hemodynamic Mechanisms by Junhao Mei, Hui Yan, Xi Zhao, Yuan Yuan, Haobo Su, Tongqing Xue and Zhongzhi Jia in Journal of Endovascular Therapy
Supplemental Material
sj-tif-6-jet-10.1177_15266028241241494 – Supplemental material for In-stent Restenosis After Stenting for Superior Mesenteric Artery Dissection Is Associated With Stent Landing Zone: From Clinical Prediction to Hemodynamic Mechanisms
Supplemental material, sj-tif-6-jet-10.1177_15266028241241494 for In-stent Restenosis After Stenting for Superior Mesenteric Artery Dissection Is Associated With Stent Landing Zone: From Clinical Prediction to Hemodynamic Mechanisms by Junhao Mei, Hui Yan, Xi Zhao, Yuan Yuan, Haobo Su, Tongqing Xue and Zhongzhi Jia in Journal of Endovascular Therapy
Footnotes
Acknowledgements
The authors thank Liulan Qian for her help with data analysis and Megan Griffiths, scientific writer, Cleveland, Ohio, USA, for her help with revising the manuscript.
Author Contributions
JM contributed as the guarantor of integrity of the entire study. All authors contributed to study concepts/study design or data acquisition or data analysis/interpretation, as well as manuscript drafting or manuscript revision for important intellectual content, approval of final version of submitted manuscript, agree to ensure any questions related to the work are appropriately resolved, and manuscript editing. JM and HY contributed to literature research and clinical studies. JM, HY, and XZ contributed to statistical analysis.
Declaration of Conflicting Interests
The author(s) declared no potential conflicts of interest with respect to the research, authorship, and/or publication of this article.
Funding
The author(s) disclosed receipt of the following financial support for the research, authorship, and/or publication of this article: China Postdoctoral Science Foundation (2023M730371); Research Project of Changzhou Medical Center of Nanjing Medical University (CMCC202206, CMCB202304).
Supplemental Material
Supplemental material for this article is available online.
References
Supplementary Material
Please find the following supplemental material available below.
For Open Access articles published under a Creative Commons License, all supplemental material carries the same license as the article it is associated with.
For non-Open Access articles published, all supplemental material carries a non-exclusive license, and permission requests for re-use of supplemental material or any part of supplemental material shall be sent directly to the copyright owner as specified in the copyright notice associated with the article.