
Abstract
Purpose:
We conducted a prospective study to evaluate the usefulness of ultralow-dose computed tomography (ULD-CT) with deep-learning reconstruction (DLR) compared with conventional standard-dose CT (SD-CT) for post-endovascular aneurysm repair (EVAR) surveillance.
Materials and Methods:
We prospectively performed post-EVAR surveillance using ULD-CT at a single center in 44 patients after they had received SD-CT. The ULD-CT images underwent DLR, whereas the SD-CT images underwent iterative reconstruction. Three radiologists blinded to the patient information and CT conditions independently measured the aneurysmal sac diameter and evaluated the overall image quality. Bland–Altman analysis and a linear mixed-effects model were used to assess and compare the measurement accuracy between SD-CT and ULD-CT.
Results:
The mean CT dose index volume and dose–length product were significantly lower for ULD-CT (1.0 ± 0.3 mGy and 71.4 ± 26.5 mGy•cm) than that for SD-CT (6.9 ± 0.9 mGy and 500.9 ± 96.0 mGy•cm; p<0.001). The mean short diameters of the aneurysmal sac measured by the 3 observers were 46.7 ± 10.8 mm on SD-CT and 46.3 ± 10.8 mm on ULD-CT. The mean difference in the short diameter of the aneurysmal sac between ULD-CT and SD-CT was −0.37 mm (95% confidence interval, −0.6 to −0.12 mm). The intraobserver limits of agreement (LOA) for measurements by ULD-CT and SD-CT were −3.5 to 2.6, −2.8 to 1.9, and −2.9 to 2.3 for Observers 1, 2, and 3, respectively. The pairwise LOAs for assessing interobserver agreement, such as for the differences between Observers 1 and 2 measurements in SD-CT, were mostly within the predetermined acceptable range. The mean image-quality score was lower for ULD-CT (3.3 ± 0.6) than that for SD-CT (4.5 ± 0.5; p<0.001).
Conclusion:
Aneurysmal sac diameter measurements by ULD-CT with DLR were sufficiently accurate for post-EVAR surveillance, with substantial radiation reduction versus SD-CT.
Clinical Impact
Deep-learning reconstruction (DLR) is implemented as a software-based algorithm rather than requiring dedicated hardware. As such, it is expected to be integrated into standard computed tomography (CT) systems in the near future. The ultralow-dose CT (ULD-CT) with DLR evaluated in this study has the potential to become widely accessible across various institutions. This advancement could substantially reduce radiation exposure in post-endovascular aneurysm repair (EVAR) CT imaging, thereby facilitating its adoption as a standard modality for post-EVAR surveillance.
Keywords
Introduction
Endovascular aneurysm repair (EVAR), along with surgical aneurysm repair, is the standard treatment for abdominal aortic aneurysms (AAAs). Patients who undergo EVAR require long-term follow-up because the aneurysmal sac diameter can increase during the remote period.1,2 Although computed tomography (CT) is often used for surveillance after EVAR, exposure to ionizing radiation is a concern. Guidelines for AAA management and previous studies on post-EVAR surveillance have recommended ultrasonography (US) and magnetic resonance imaging, which do not emit ionizing radiation3,4; however, US has accuracy and reproducibility problems, and MRI sometimes shows metal artifacts induced by stent grafts and presents medical economics issues. However, CT has many advantages, such as objectivity and simplicity, and if the radiation exposure from CT scans can be reduced, CT could be more commonly used for post-EVAR follow-up. Although low-dose CT can reduce the CT radiation dose, excessive reduction increases noise and may reduce image quality, increasing the difficulty of assessing aneurysms after EVAR.
Recently, improvements in CT equipment and the introduction of an image reconstruction method based on successive approximation reconstruction have enabled imaging at lower radiation doses, which has increased the popularity of this technique in clinical practice. Recently, image reconstruction using deep learning (an artificial intelligence method) has been developed, which has improved the quality of low-dose CT images.5 –7 The goal of CT in post-EVAR follow-up is to assess the aneurysmal morphology and sac diameter, neither of which requires high image quality. We hypothesized that ultralow-dose CT (ULD-CT) combined with deep-learning reconstruction (DLR) of images would be sufficient to assess aortic aneurysmal size, which would minimize radiation exposure during post-EVAR surveillance, greatly benefiting patients.
This study evaluated the validity and feasibility of ULD-CT with DLR for post-EVAR surveillance.
Primary and Secondary Endpoints
The primary endpoint of this study was the degree of clinical agreement of the aortic aneurysmal diameter measurements between standard-dose CT (SD-CT) and ULD-CT. The secondary endpoints included the radiation dose differences between ULD-CT and SD-CT, degree of agreement in the measured diameters of sites other than the aneurysm, image quality, and quantitative evaluation of the organ.
Materials and Methods
Patients
This single-center prospective study included the following patient categories: those who (1) underwent EVAR for AAAs; (2) were scheduled to undergo non-contrast-enhanced CT to evaluate the aortic aneurysmal sac diameter; and (3) were aged >50 years at enrollment. Fifty consecutive post-EVAR patients undergoing follow-up in our hospital’s Cardiovascular Surgery and Radiology Departments were initially enrolled in this study. Therefore, we considered that there was negligible patient selection bias and that the patient sample was representative of post-EVAR patients in general. We excluded 4 patients whose CT scans were not obtained because of schedule changes after enrollment, 1 patient who was lost to follow-up, and 1 patient who had undergone surgical aneurysmal repair but was incorrectly enrolled. Forty-four patients were ultimately included in this study. The study was approved by the Institutional Review Board of Kobe University Hospital (approval ID: B21006), and all participants provided written informed consent.
CT Technique and Estimation of the Patient Radiation Dose
All patients underwent ULD-CT in addition to SD-CT during post-EVAR surveillance. All acquisitions were performed on a 320-row detector CT scanner (Aquilion ONE; Canon Medical System, Otawara, Japan). The SD-CT series [120 kVp with automatic exposure control (AEC); standard deviation (SD): 20, 250–600 mA] used iterative reconstruction (adaptive iterative dose reduction using 3D processing), and the ULD-CT series (120 kVp with AEC; SD: 50, 10–600 mA) used DLR (Advanced Intelligent Clear-IQ Engine, Canon Medical System, Otawara, Japan). The ULD-CT imaging protocol assumed an effective dose of approximately 1 mSv, equivalent to the dose from a plain abdominal radiograph. 8 For each examination, the volume CT dose index (CTDIvol) and dose–length product (DLP) of SD-CT and ULD-CT were recorded from the dose reports generated by the CT scanner. The radiation effective dose (ED) was calculated by multiplying the DLP by an abdomen-specific correction coefficient (0.015 mSv/mGy•cm). 9 All CT images were reconstructed at thicknesses of 1 and 5 mm.
Measurements of the Aneurysmal Sac Diameter
CT images with fixed window settings (window width, 250 HU and window level, 50 HU) and 5-mm thickness were used for the measurements. First, the conductor (TO) compared the SD-CT and ULD-CT images of the same patient to determine the cross-section of the CT series for measurements. Next, 3 board-certified diagnostic radiologists in Japan (KM, KS, and TG with 9, 13, and 13 years of experience, respectively) who were blinded to the patient information and CT conditions used the same viewer (OsiriX Lite; Pixmeo, Bernex, Switzerland) to randomly measure the aneurysmal sac diameter in the specified slice. Each measurement was based on the external diameter of the aorta or arteries. The short and long aneurysmal sac diameters, which were perpendicular to each other, were measured from the slice with the maximum aortic aneurysm. For the analysis, the maximum short diameter of the aortic aneurysm was used. If differences in the aneurysmal diameter measurements were observed, the following confounding factors were assumed: patient obesity, aneurysmal wall calcification, body metal other than the stent graft, and motion artifacts. Patients with a body mass index (BMI) >25 kg/m2 were considered overweight. Aneurysmal wall calcification, presence of body metal other than the stent graft, and motion artifacts were evaluated by 1 observer (KM), and these were assessed in the same cross-section used to measure the aortic aneurysmal diameter.
Qualitative Analysis of CT Images
We used CT images with a 5-mm thickness for the image-quality evaluations. A 5-point Likert scale (5 = excellent, 4 = good, 3 = acceptable, 2 = suboptimal, and 1 = unacceptable) was used to evaluate the quality of each reconstructed CT image by 3 radiologists (KM, KS, and TG), who were blinded to the CT conditions and patient information. Each radiologist used the same viewer to evaluate the overall and specific image qualities of the aorta, liver, and colon. The CT images were initially presented with a preset soft-tissue window setting (window width: 250 HU; window level: 50 HU), and each radiologist modified the window setting at their discretion. Figure 1 presents the SD-CT and ULD-CT images of the same patient and their respective qualitative evaluations by the 3 radiologists.
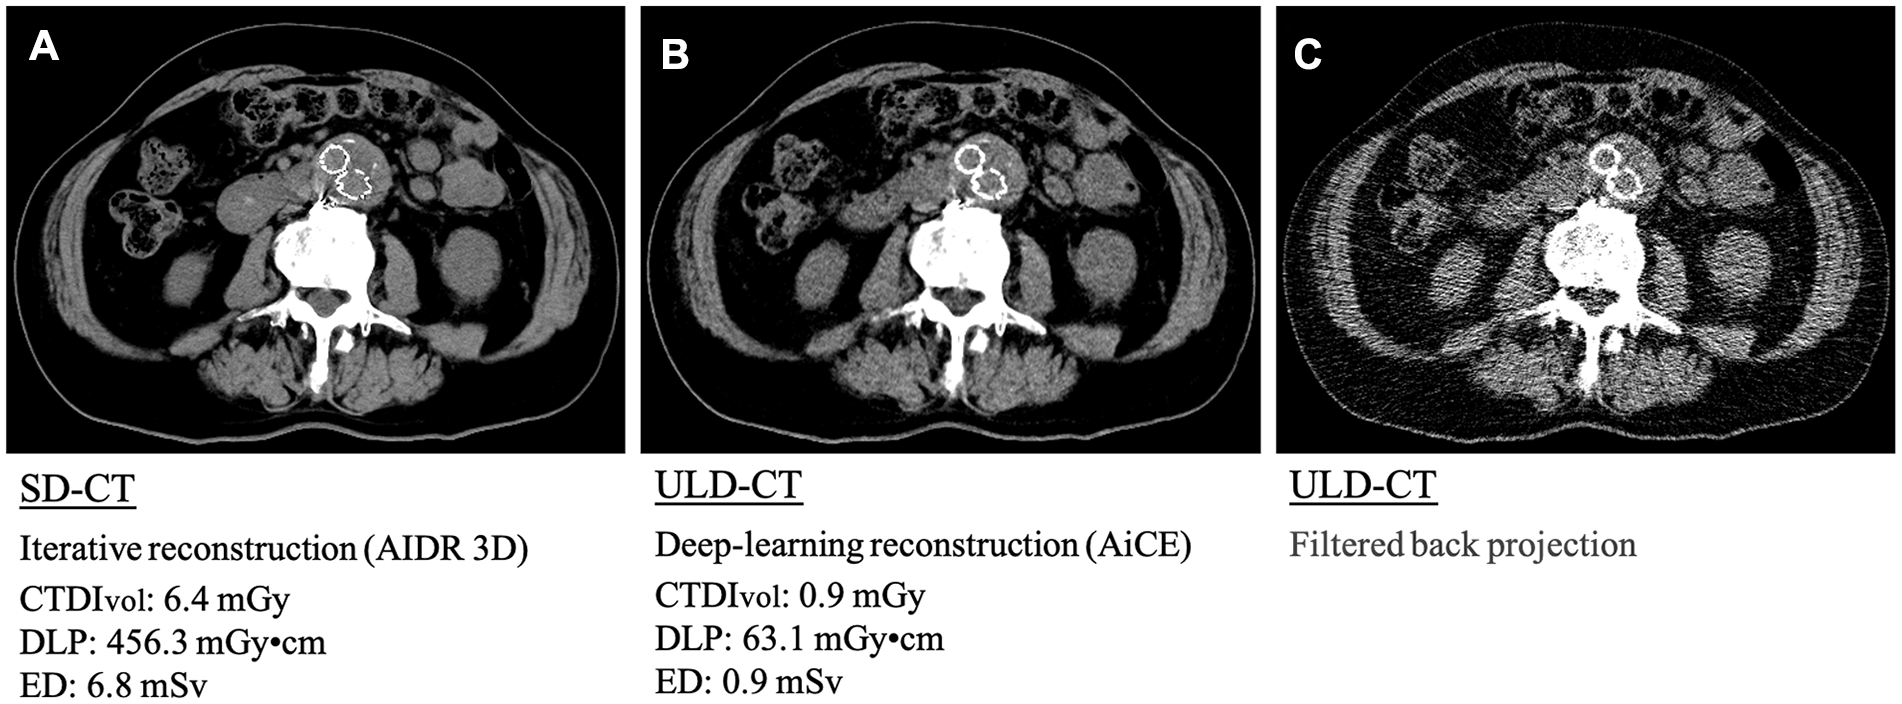
Representative SD-CT and ULD-CT images. Although (A) SD-CT provides superior image quality, (B) ULD-CT with deep-learning reconstruction can substantially reduce the radiation dose to approximately one-seventh that of SD-CT. (C) ULD-CT image reconstructed filtered back projection exhibiting increased noise. CTDIvol, CT dose index volume; DLP, dose–length product; SD-CT, standard-dose computed tomography; ULD-CT, ultralow-dose computed tomography.
Quantitative Analysis of CT Images
Measurements of 5-mm thick CT images were used for the quantitative CT image assessments, which were independently performed by 1 radiologist (KM). Circular regions of interest (ROIs) within the abdominal aorta, abdominal aneurysmal sac, hepatic parenchyma, paraspinal muscle, and subcutaneous fat in the buttocks were drawn twice, and the mean CT values and SDs of the ROIs were recorded. The SDs in the ROIs of each organ were defined as the image noise of the respective organ, and the signal-to-noise ratio (SNR) was calculated as the ratio of the mean CT value to noise. ROIs were placed in the right-hepatic lobe parenchyma while carefully avoiding blood vessels, bile ducts, focal lesions, and artifacts. The ROIs were placed in the aorta and aneurysmal sac within the same slice in which the diameter was measured to avoid calcifications, macroscopic thrombi, stent grafts, and artifacts.
Sample Size
Aortic aneurysmal diameter measurements on ULD-CT with DLR are potentially comparable to those on SD-CT. Reportedly, the mean AAA values for both measures were −0.19 ± 1.52 mm, whereas the repeatability coefficient (1.96 × SD) for the difference in aneurysmal diameter measurements was 3.8 mm. 10 These estimates and the expected tolerance in clinical applications were used to set the criterion for judging equivalence at ±3 mm in this study.
The main study objective was to determine the clinical agreement between ULD-CT with DLR and SD-CT for assessing the validity and feasibility of ULD-CT with DLR across various patient populations. Therefore, the patient sample-size determination was based on the feasible number that could be examined within the study period, which gave a sample size of 50 that ensured a minimum of 10 patients in each subgroup categorized by BMI, presence or absence of aneurysmal wall calcification, and presence or absence of body metal other than a stent graft.
Statistical Analysis
Continuous data are presented as means ± SDs for normally distributed data and medians with interquartile ranges for a skewed distribution of data. Categorical data are presented as frequencies and percentages. Student’s t-test, the Mann–Whitney U-test, or the Wilcoxon signed-rank test was used for quantitative data analyses, as appropriate. To evaluate intraobserver agreement (agreement between the ULD-CT and SD-CT measurements for each observer), Bland–Altman analysis and its extension for multiple measurements per patient were performed.11,12 To evaluate interobserver agreement (agreement between measurements obtained by different observers for the same patient in SD-CT and ULD-CT), we calculated pairwise Bland–Altman limits of agreement (LOA), including the agreement between measurements obtained by Observers 1 and 2 in SD-CT. The intraclass correlation coefficient (ICC) was used to assess the interobserver agreement to measure the degree of agreement between the 3 radiologists. Clinical agreement was judged as poor for ICCs <0.5, moderate for 0.50 to 0.75, good for 0.75 to 0.90, and excellent for ≥0.90. The threshold for statistical significance was set at p<0.05. EZR software (version 1.64; Saitama Medical Center, Jichi Medical University, Saitama, Japan) was used for all statistical analyses. 13
Results
Patients
In total, 44 patients (40 men and 4 women) were included in the study. The mean (±SD, range) age and BMI of the patients were 79.7 (±6.6, 60–90) years and 23.2 (±3.2, 13.8–30.6) kg/m2, respectively.
Radiation Dose
The mean CTDIvol (1.0 ± 0.3 mGy, range = 0.4–1.9 mGy), mean DLP (71.4 ± 26.5 mGy•cm, range = 23.7–153.6 mGy•cm), and mean ED (1.1 ± 0.4 mSv, range = 0.4–2.3 mSv) were significantly lower for ULD-CT than the mean CTDIvol (6.9 ± 0.9 mGy, range = 5.3–10.3 mGy), mean DLP (500.9 ± 94.9 mGy•cm, range = 312.8–821.9 mGy•cm), and mean ED (7.5 ± 1.4 mSv, range = 4.7–12.3 mSv) for SD-CT (p<0.001). The average reduction rates of CTDIvol, DLP, and ED were 86.0%, 86%, and 86.0%, respectively. Figure 2 presents the box plots of the CTDIvol and DLP for SD-CT and ULD-CT.
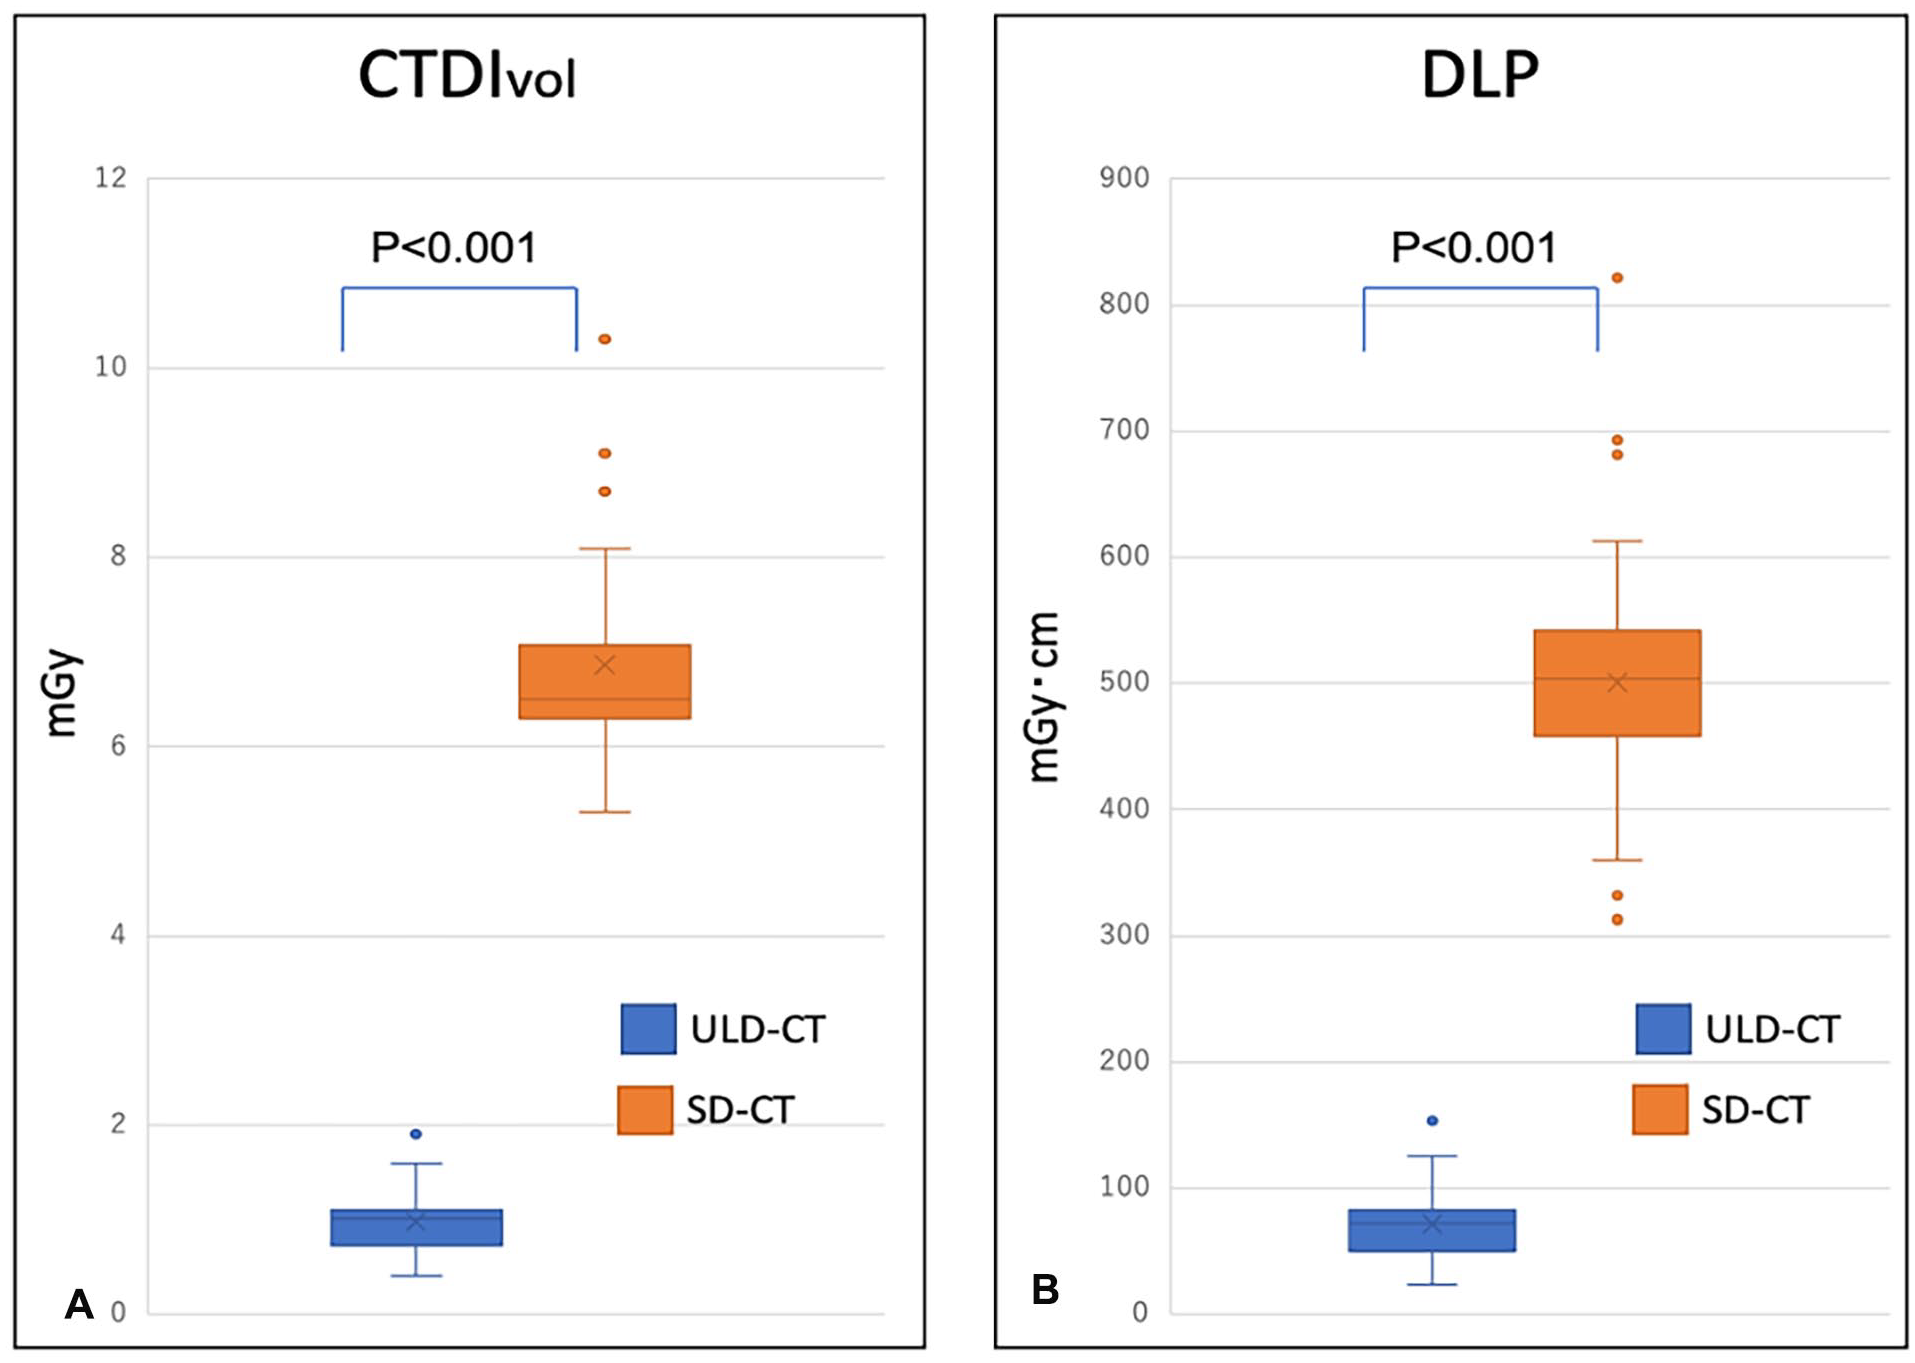
Comparison of the CTDIvol and DLP between ULD-CT and SD-CT. Box plots show that ULD-CT has a significantly lower (A) CTDIvol and (B) DLP than those for SD-CT. CTDIvol, CT dose index volume; DLP, dose–length product; SD-CT, standard-dose computed tomography; ULD-CT, ultralow-dose computed tomography.
Measurements of the Aneurysmal Sac Diameter
The mean short diameters of the aneurysmal sac measured by the 3 observers were 46.7 ± 10.8 mm on SD-CT and 46.3 ± 10.8 mm on ULD-C. The mean difference in the short diameter of the aneurysmal sac between ULD-CT and SD-CT was −0.37 mm [95% confidence interval (CI), −0.6 to −0.12 mm]. Figure 3 presents a Bland–Altman analysis to assess the agreement of the ULD-CT and SD-CT aneurysmal sac diameter measurements. The estimated range that included 95% of the potential differences between the ULD-CT and SD-CT measurements was almost within the prespecified range of ±3 mm, supporting the high agreement between the measurements. These results were generally consistent even when evaluated across the patient subgroups according to BMI, presence or absence of aneurysmal wall calcification, and presence or absence of metals in the body other than a stent graft. Furthermore, the agreement between the ULD-CT and SD-CT measurements was assessed by stratifying the data according to each of the 3 observers (Figure 4). The intraobserver LOA for the ULD-CT and SD-CT measurements were −3.5 to 2.6, −2.8 to 1.9, and −2.9 to 2.3 for Observers 1, 2, and 3, respectively (Table 1). Figure 5 presents the Bland–Altman analysis that assesses the agreement between the aneurysmal sac diameter SD-CT measurements obtained by Observers 1 and 2. Bland–Altman plots for other pairs, such as the comparison between Observers 2 and 3 for use of SD-CT, are provided in the Supplementary file. Table 1 presents the LOA values from all pairwise evaluations of the interobserver agreement. The estimated range encompassing 95% of the potential differences between measurements obtained by each observer was largely within the predetermined ±3-mm range, indicating a high level of agreement between measurements. For both methods, the ICCs among the observers were 0.993 (95% CI: 0.988–0.996) for SD-CT and 0.989 (95% CI: 0.981–0.994) for ULD-CT. No motion artifacts were observed in the CT scans of either patient; therefore, the effects of motion artifacts on the measurements were not assessed.
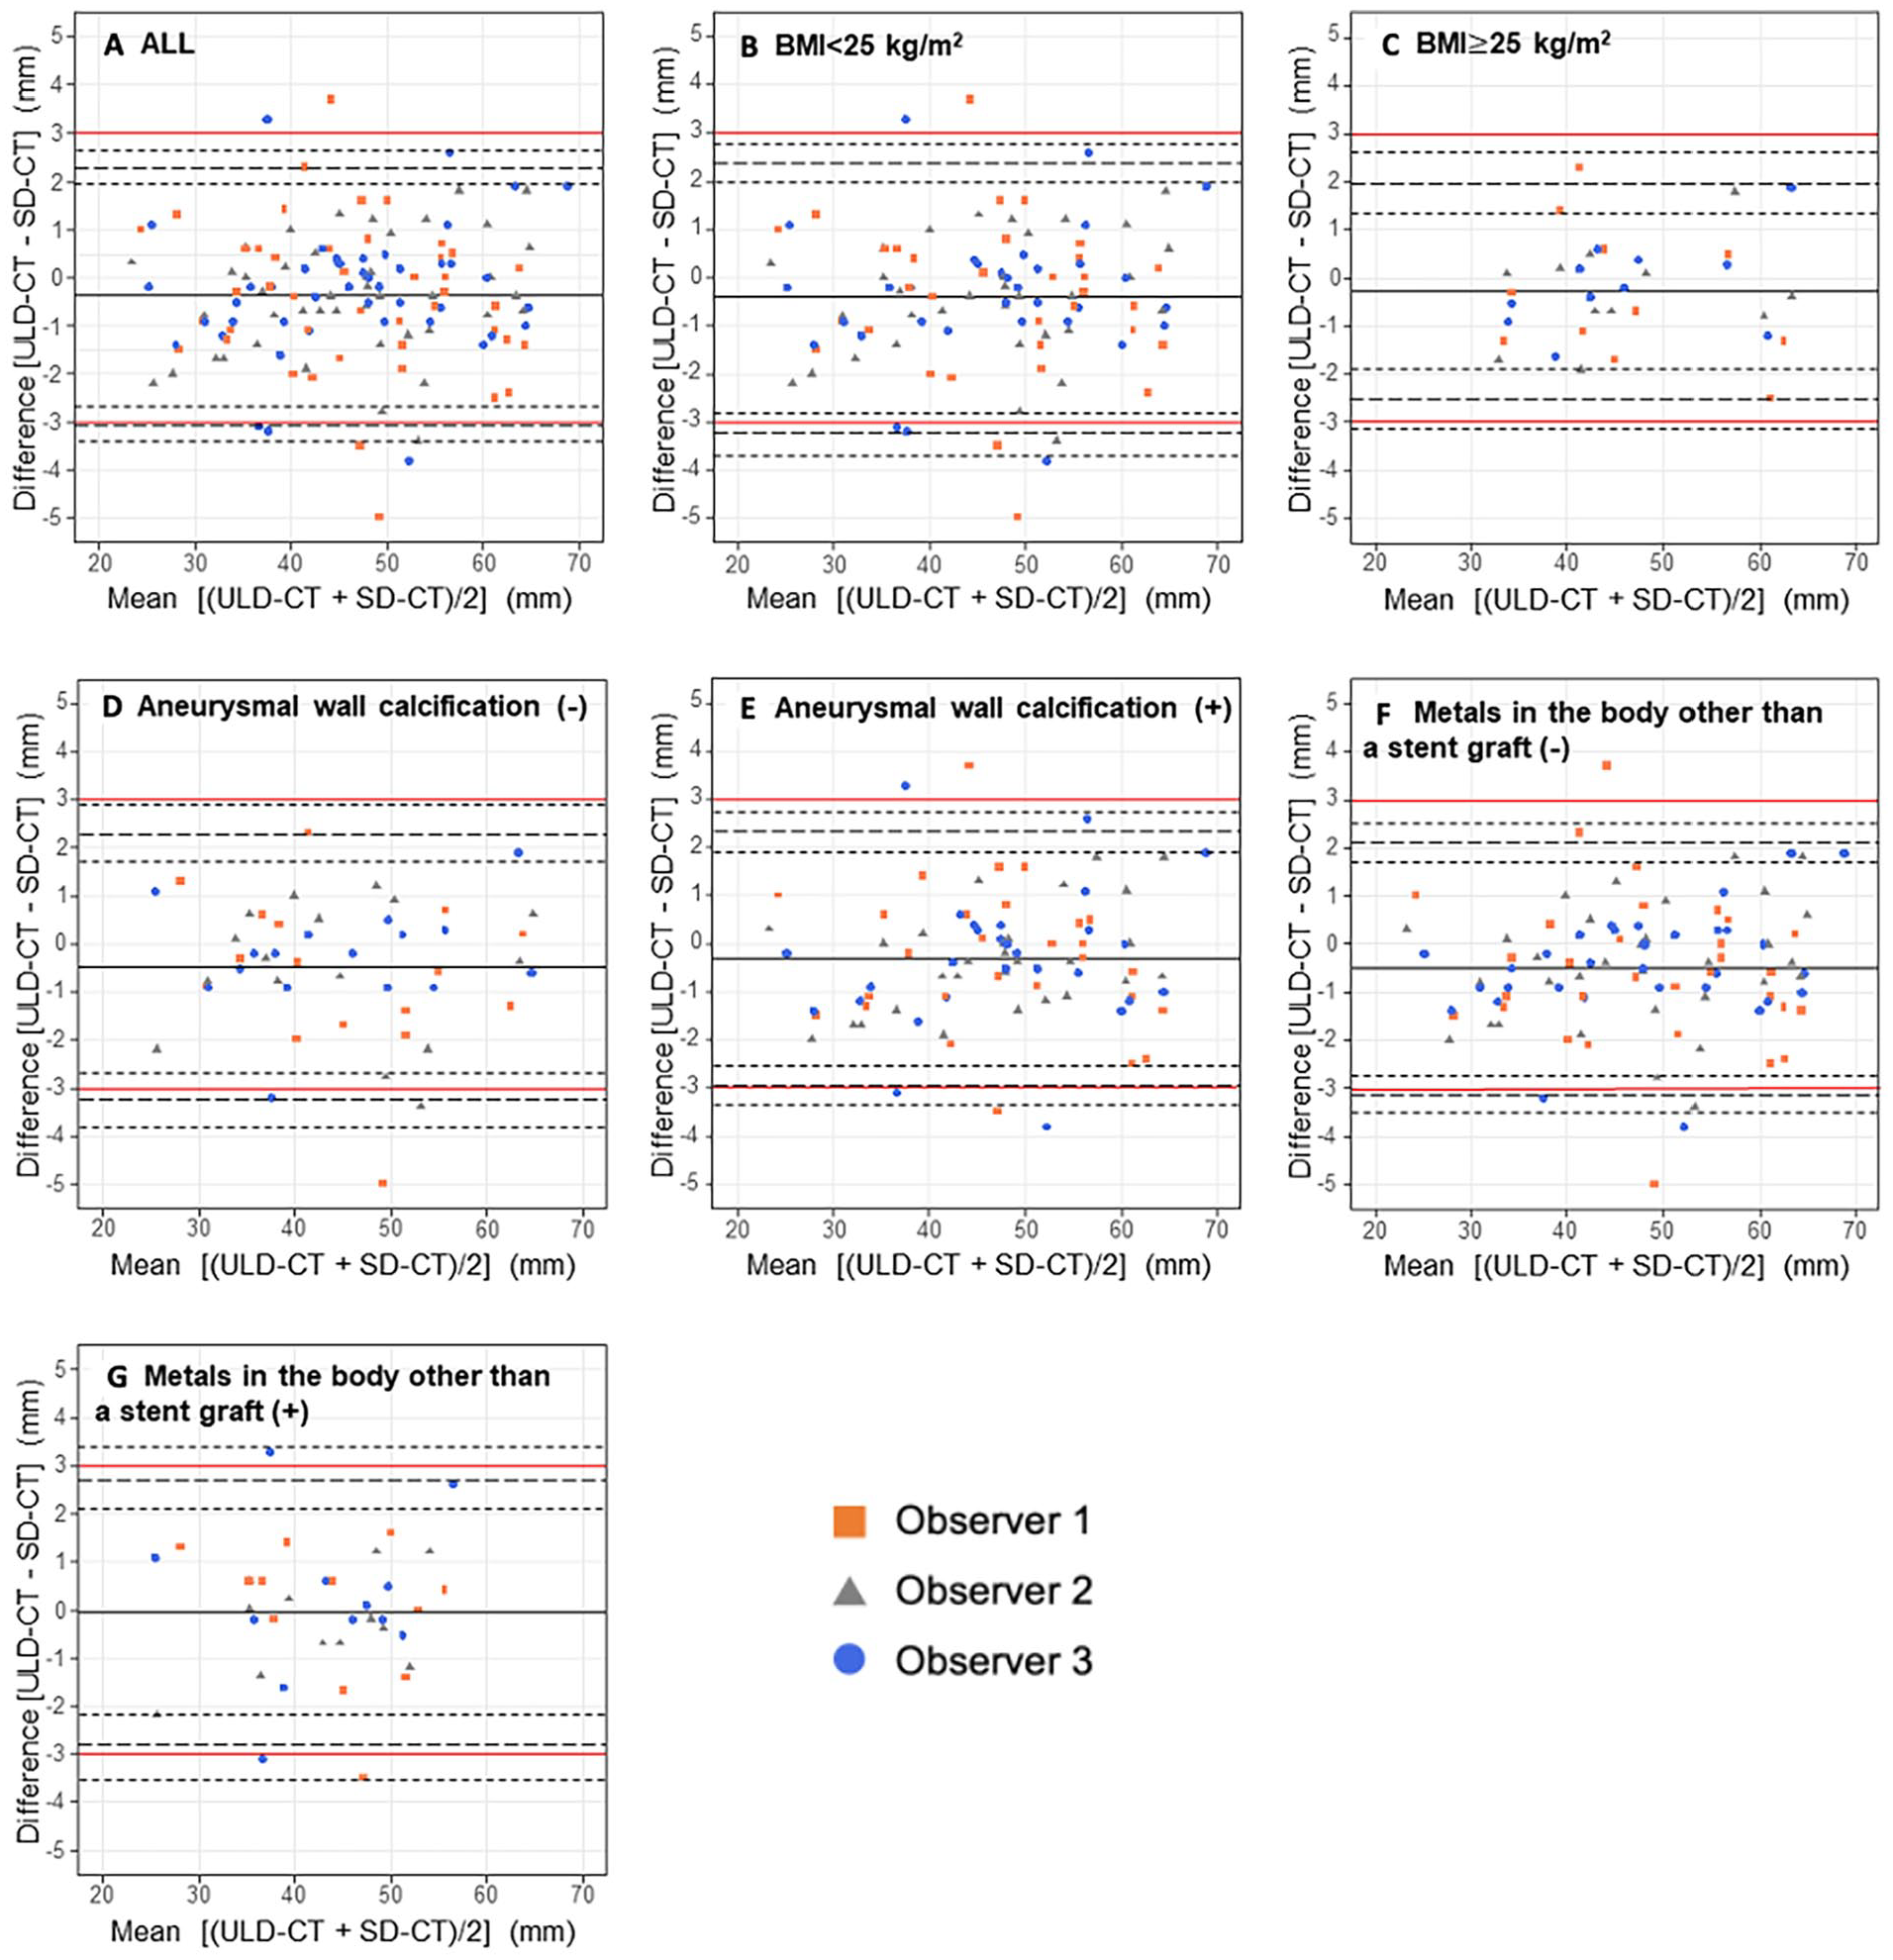
Comparison of measurements between SD-CT and ULD-CT for the aneurysmal sac diameter. (A) Results of the Bland–Altman analyses. Red horizontal lines indicate ±3-mm range for differences between measurements by ULD-CT and SD-CT, black solid lines indicate the mean differences between measurements by ULD-CT and SD-CT, and black dotted lines indicate the estimated range that contains 95% of the potential difference between measurements by ULD-CT and SD-CT. (B) Results for the BMI <25 kg/m2 subgroup. (C) Results for the BMI ≥25 kg/m2 subgroup. (D) Results regarding the aneurysmal wall calcification (−) subgroup. (E) Results for the aneurysmal wall calcification (+) subgroup. (F) Results for metals in the body other than a stent graft (−) subgroup. (G) Results for metals in the body other than a stent graft (+) subgroup. SD-CT, standard-dose computed tomography; ULD-CT, ultralow-dose computed tomography; BMI, body mass index.
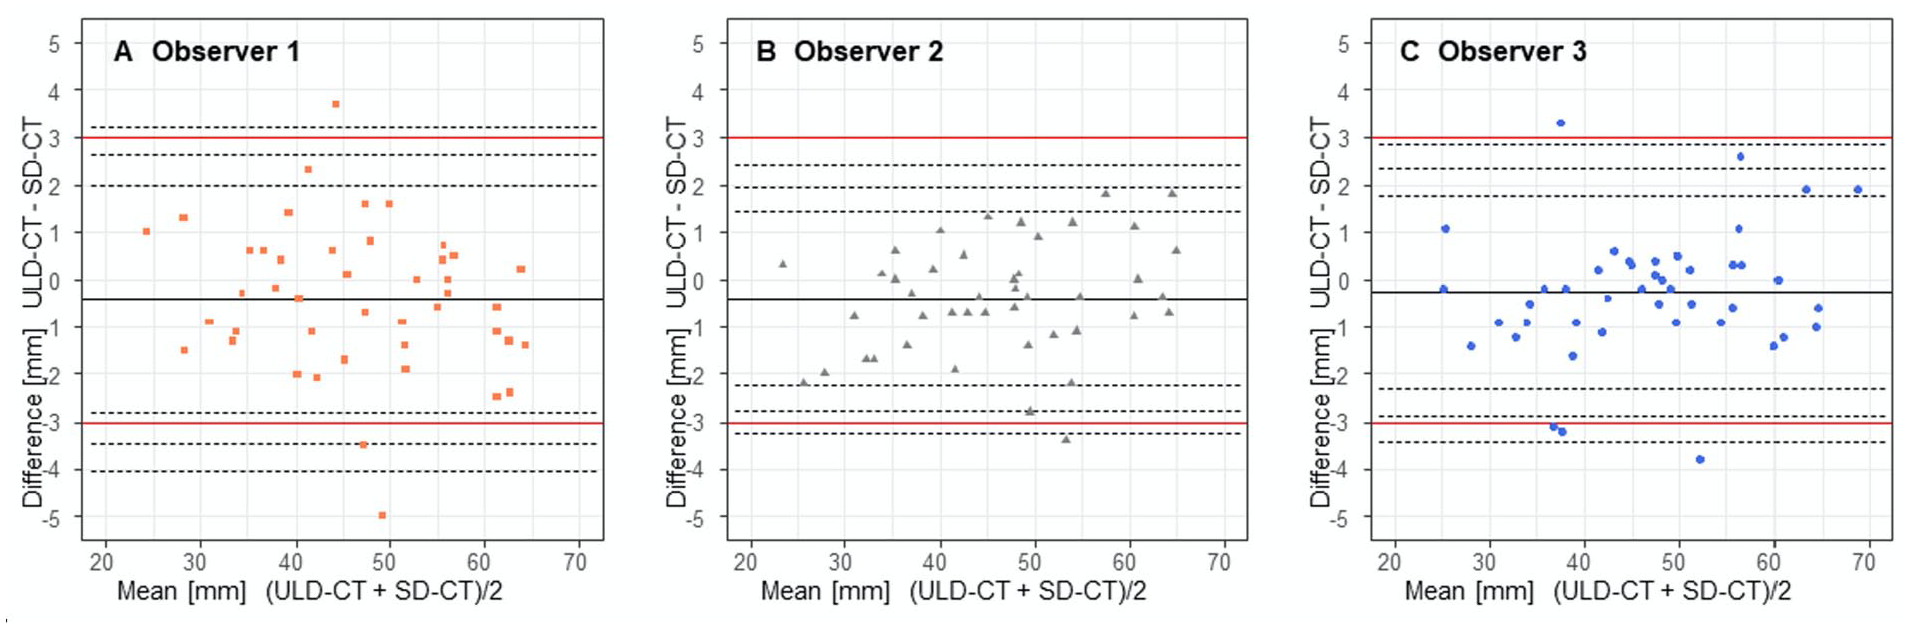
Results of the Bland–Altman analyses. Red horizontal lines indicate ±3-mm range for the differences between measurements by ULD-CT and SD-CT; black solid lines indicate the mean differences between measurements by ULD-CT and SD-CT; black long-dashed lines indicate the estimated range that contains 95% of the potential differences between measurements by ULD-CT and SD-CT; and black short-dashed lines indicate the 95% confidence intervals of the estimated range. (A) Bland–Altman plot for Observer 1. (B) Bland–Altman plot for Observer 2. (C) Bland–Altman plot for Observer 3.
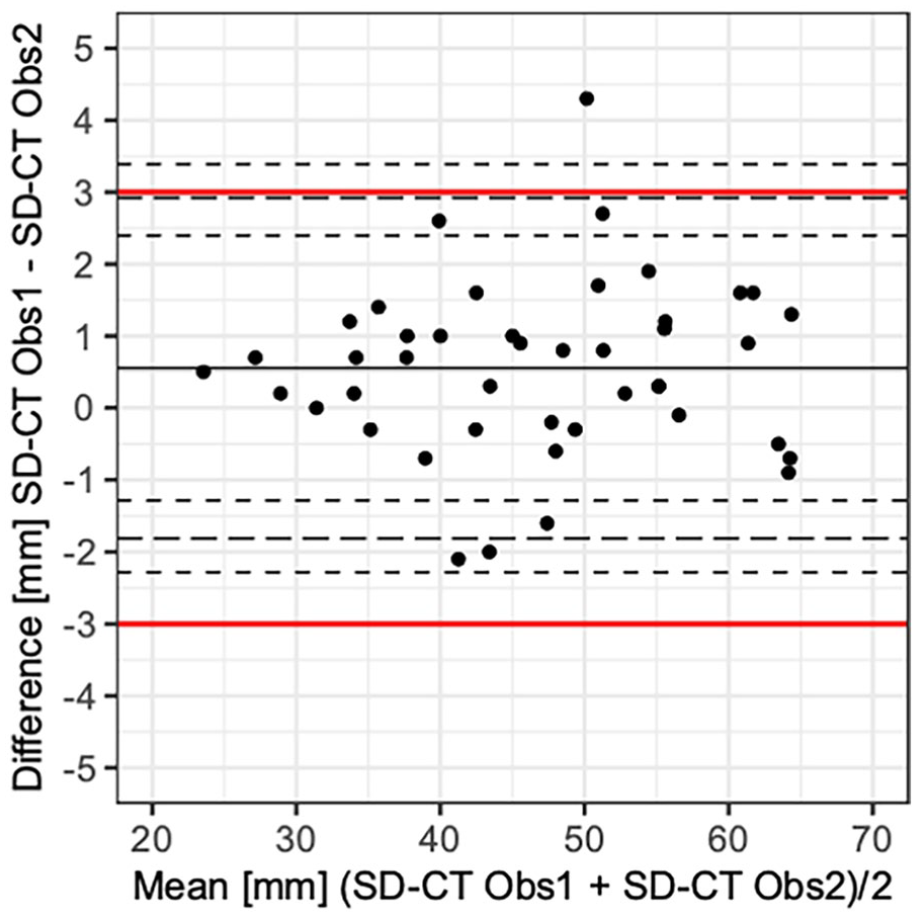
A Bland–Altman plot for a pair of measurements in SD-CT. Red horizontal lines indicate ±3-mm range for the differences between measurements by Observers 1 and 2 in SD-CT; black solid lines indicate the mean differences between measurements by Observers 1 and 2 in SD-CT; black long-dashed lines indicate the estimated range that contains 95% of the potential differences between measurements by Observers 1 and 2 in SD-CT; and black short-dashed lines indicate the 95% confidence intervals of the estimated range. Obs1, Observer 1; Obs2, Observer 2; SD-CT, standard-dose computed tomography.
Intraobserver LOA Values for Each Observer and Interobserver LOA Values for SD-CT, ULD-CT, and SD-CT Versus ULD-CT.
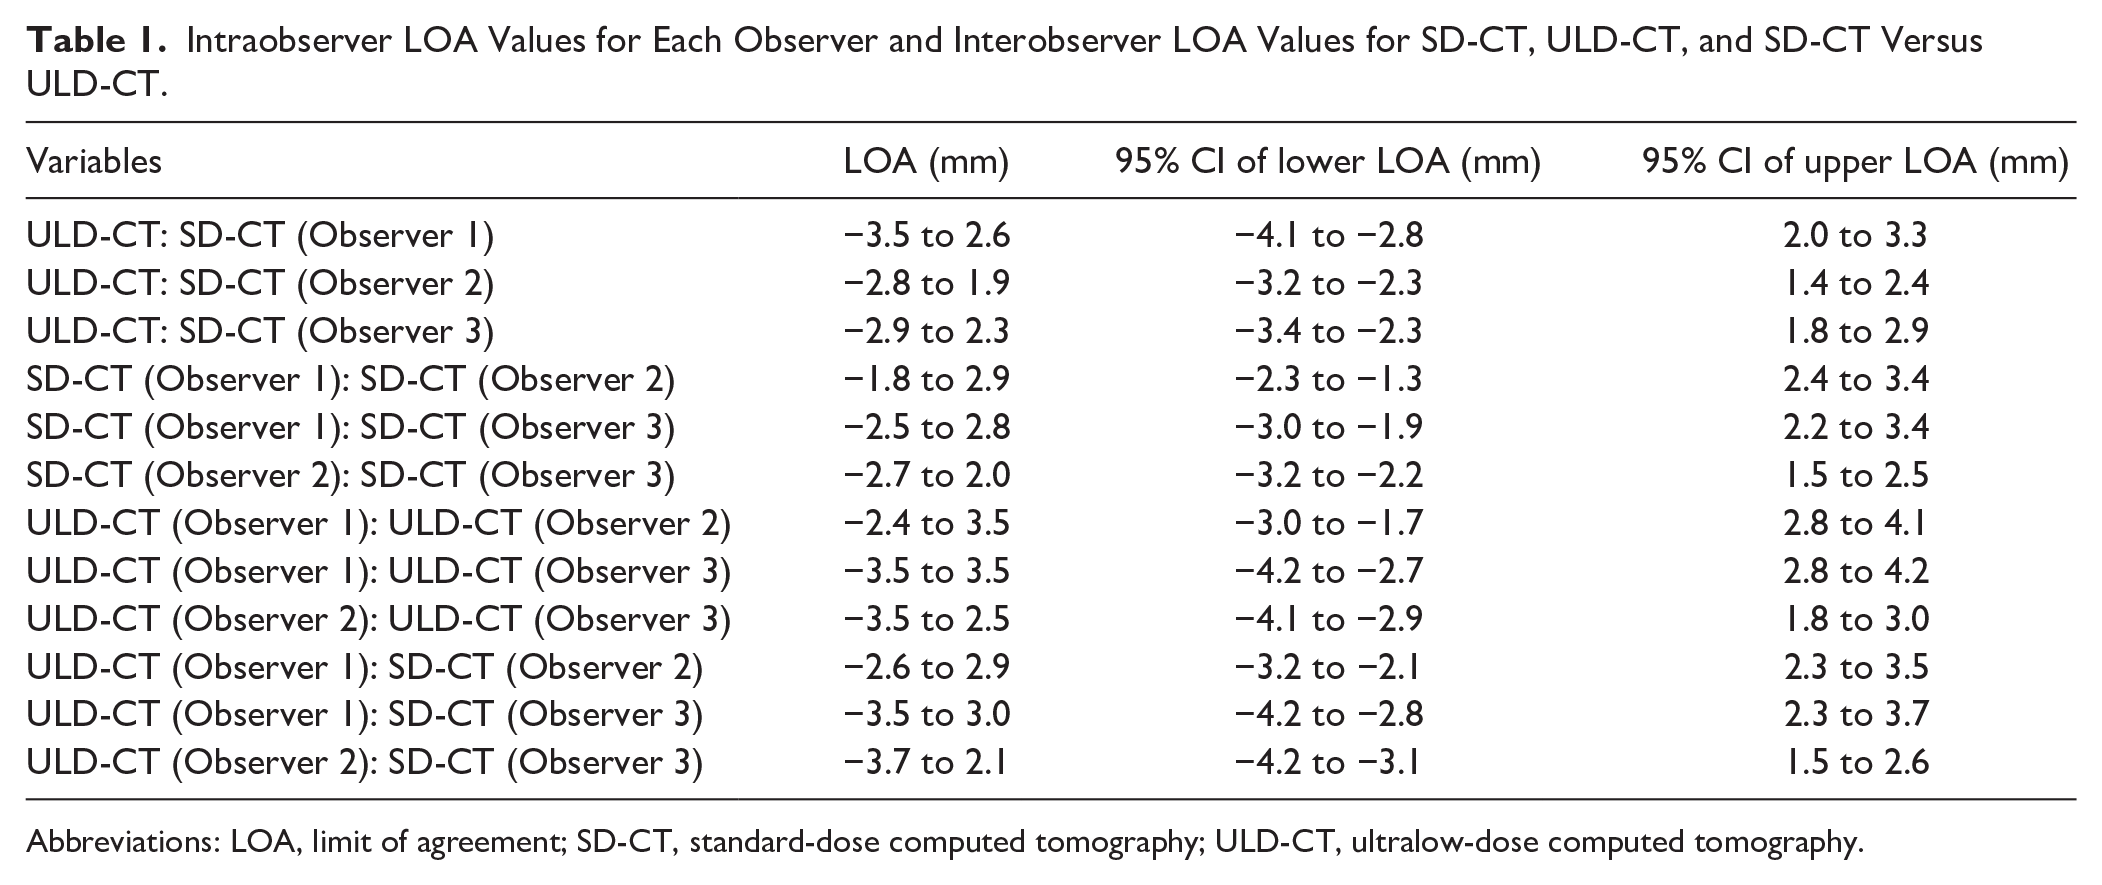
Abbreviations: LOA, limit of agreement; SD-CT, standard-dose computed tomography; ULD-CT, ultralow-dose computed tomography.
Qualitative Analysis of CT Images
Table 2 presents the image-quality scores for each observer. In all measurements by each observer, the overall and specific image qualities of the aorta, liver, and colon were significantly worse for ULD-CT than for SD-CT (eg, the overall image quality, Observer 1: SD-CT 4.1 ± 0.3 vs ULD-CT 3.4 ± 0.5, p<0.001; Observer 2: SD-CT 4.6 ± 0.5 vs ULD-CT 3.5 ± 0.8, p<0.001; Observer 3: SD-CT 4.9 ± 0.3 vs ULD-CT 3.1 ± 0.3, p<0.001).
Mean Image-Quality Scores in SD-CT and ULD-CT.
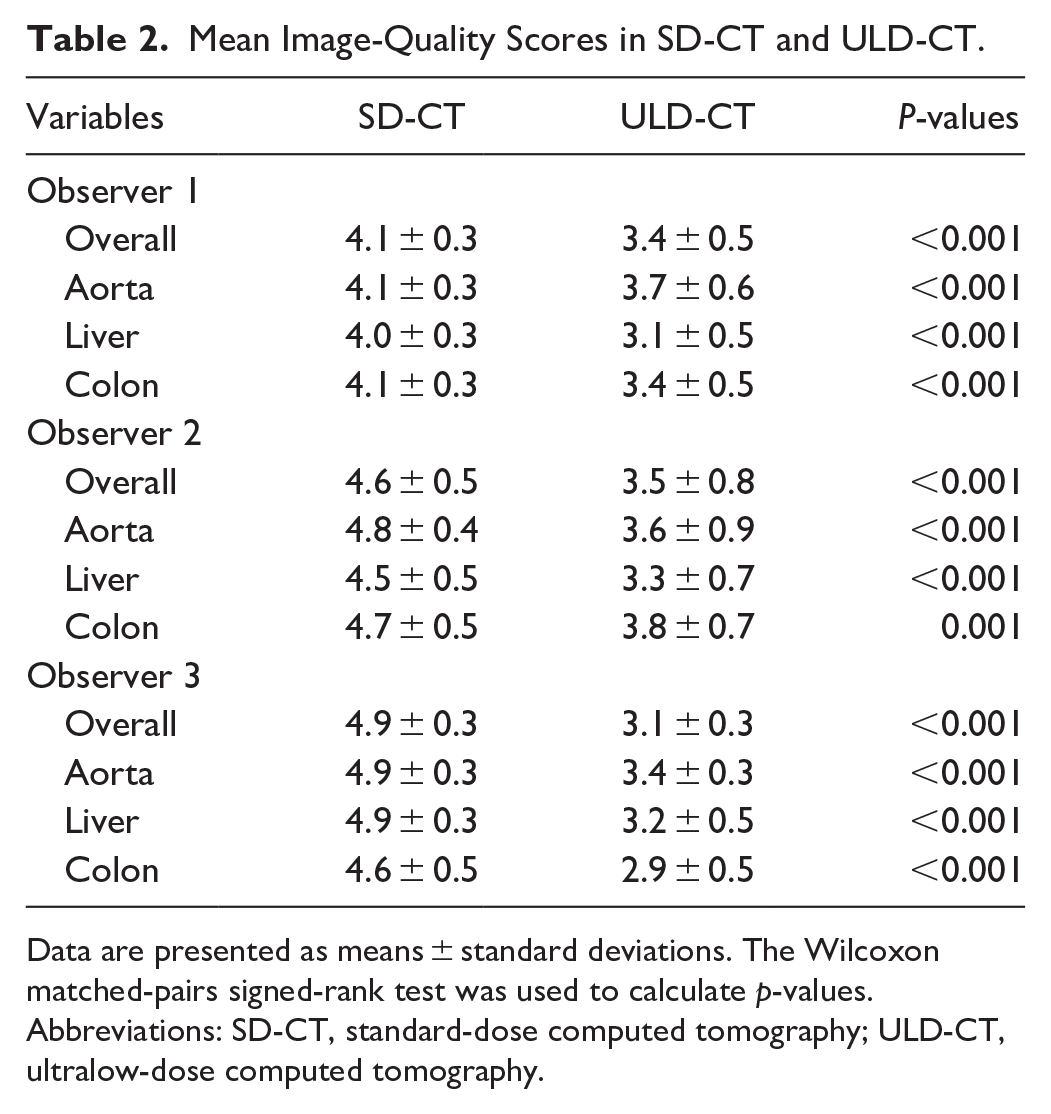
Data are presented as means ± standard deviations. The Wilcoxon matched-pairs signed-rank test was used to calculate p-values.
Abbreviations: SD-CT, standard-dose computed tomography; ULD-CT, ultralow-dose computed tomography.
Quantitative Analysis of CT Images
Table 3 presents the mean image noise and SNR for the SD-CT and ULD-CT protocols. The noise values of the aneurysmal sac, aorta, liver, paraspinal muscle, and subcutaneous fat were significantly higher for ULD-CT than for SD-CT. The SNRs of the aneurysmal sac, liver, and paraspinal muscle were significantly lower for ULD-CT than for SD-CT, and no significant differences in the SNRs of the aorta and subcutaneous fat were observed between ULD-CT and SD-CT.
Comparison of Image Noise and SNR Between SD-CT and ULD-CT.
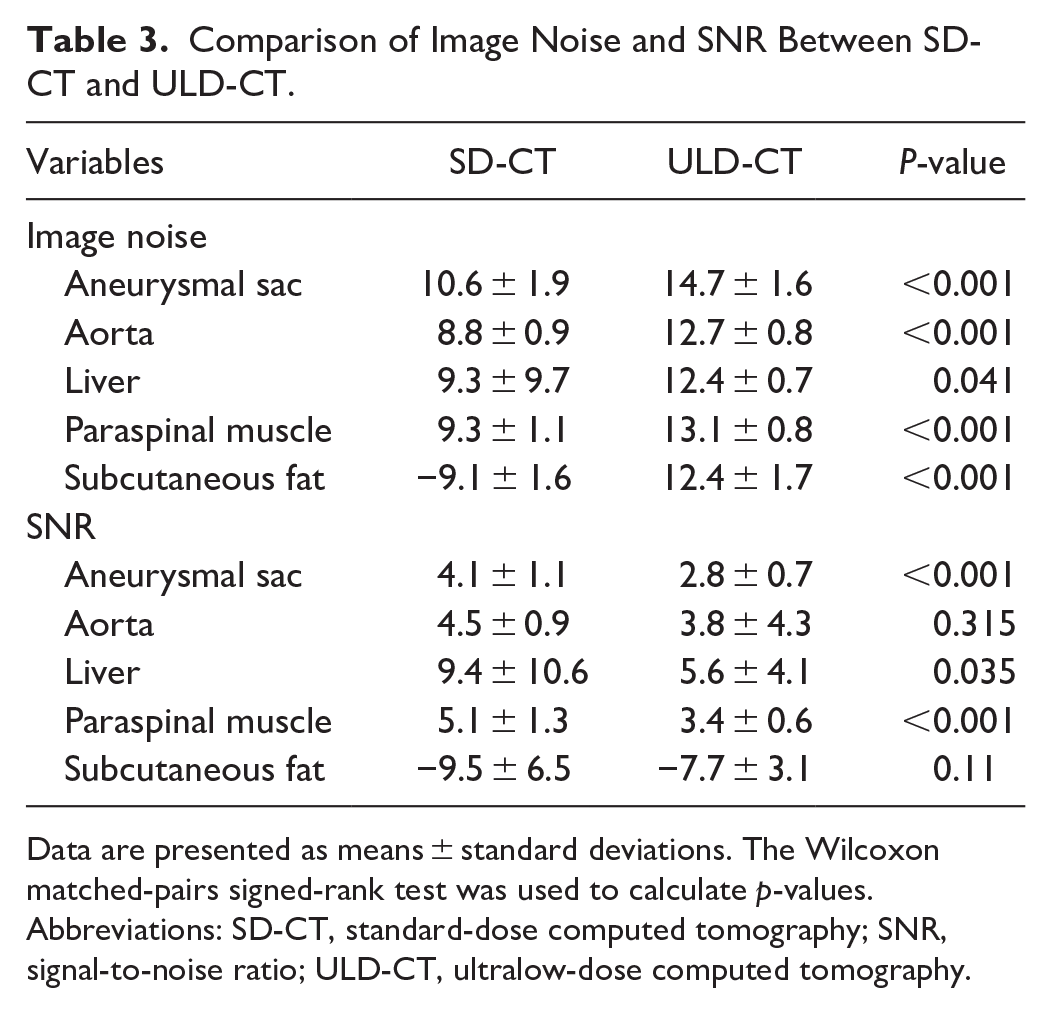
Data are presented as means ± standard deviations. The Wilcoxon matched-pairs signed-rank test was used to calculate p-values.
Abbreviations: SD-CT, standard-dose computed tomography; SNR, signal-to-noise ratio; ULD-CT, ultralow-dose computed tomography.
Discussion
This study showed that the aneurysmal and abdominal aortic diameters measured by ULD-CT with DLR agreed closely with those of SD-CT, indicating that ULD-CT with DLR is sufficiently effective for post-EVAR surveillance at reduced radiation doses.
US and CT have equivalent accuracy in measuring post-EVAR aortic aneurysmal diameters, as indicated by the high correlation between the 2.14 –17 US offers advantages, such as lower cost,18,19 absence of ionizing radiation, and the ability to assess blood flow dynamics. On the other hand, CT offers objectivity and accuracy independent of the examiner’s skill and facilitates easy assessment of stent graft and overall vessel morphology. Although the issue of exposure to ionizing radiation during CT has meant that US is often preferred for monitoring aneurysmal diameter, the low ionizing radiation exposure of ULD-CT used in this study suggests that, in environments or cases in which, for example, the sonographer’s skill is insufficient to ensure accuracy, the stent graft migration is a concern due to short sealing lengths, or in cases in which concomitant internal iliac artery embolization is present, the physician may find it easier to select CT for post-EVAR surveillance.
An increased risk of cancer due to radiation exposure during CT has been reported.20,21 A problem with post-EVAR surveillance is that it requires periodic CT scans. Although abdominal exposure to radiation in noncontrast-enhanced CT scans of the chest is often approximately 10 mSv (which is low compared with health-hazardous radiation doses of 100 mSv), routine post-EVAR CT examinations over a long period can result in considerable radiation exposure. A previous study found that the excess relative risk of carcinogenesis associated with routine post-EVAR CT was 0.43 in a relatively young population (age, 50–55 years). 22 With the CT protocol used in this study, a single exposure to a dose of approximately 1 mSv is equivalent to the dose of a plain abdominal radiograph, and even if CT examinations are performed annually for 10 years for post-EVAR surveillance, the estimated accumulated radiation dose would only be 10 mSv. This dose is almost equivalent to that of a single routine CT scan from the chest to the abdomen, which has a negligible risk of carcinogenesis.
The quantitative and qualitative analyses performed in this study showed significantly lower image quality and significantly higher image noise for ULD-CT than for SD-CT. These results suggest that ULD-CT with DLR may have lower sensitivity for detecting incidental findings, such as incidentalomas (including malignant tumors), than SD-CT. Previous studies have reported that incidentalomas were found in 2% to 12.2% of cases on post-EVAR follow-up using contrast-enhanced CT.23 –25 Although SD-CT, being non-contrast, is presumed to have lower detection sensitivity than contrast-enhanced CT, ULD-CT with DLR may have even lower sensitivity.
Our clinical experience suggests that the use of conventional iterative methods to reconstruct ULD-CT images causes excessive noise, making the images clinically unsuitable for effective post-EVAR surveillance. Therefore, a comparative analysis was not performed. However, several studies have suggested that low-dose CT may be feasible and useful for post-EVAR surveillance and AAA screening. Hansen et al demonstrated that low-dose CT angiography (CTA) with model-based iterative reconstruction enabled significant dose reduction during post-EVAR surveillance while maintaining adequate image quality and diagnostic accuracy. 26 The CT technique used in Hansen et al’s study approximately achieved a 73% dose reduction compared with conventional methods. However, the dose remained slightly higher than that of the method used in this study, with 4.4 ± 4.4 and 2.4 ± 2.2 mSv in the arterial and delayed phases, respectively. Given these considerations and the potential risk of contrast-induced renal impairment, the necessity for repeated examinations remains a significant concern. Borgbjerg et al found that ULD noncontrast-enhanced CT with 0.7 ± 0.4 mSv enabled accurate and reproducible measurement of the abdominal aortic diameter when compared with CTA. 27 However, they evaluated a population similar to the AAA screening cohort, so the effects of increased noise in ULD-CT on measuring aneurysmal diameters >4 cm are unclear. Moreover, when measuring the aneurysmal diameter or aortic diameter in post-EVAR patients, the extent to which metal artifacts caused by stent grafts in ULD-CT affect the measured values also remains unclear. Our study clearly demonstrates that ULD-CT with DLR is a reliable method for aneurysmal measurement in post-EVAR surveillance.
This study had some limitations. First, the CT results were not compared at various doses, so we did not determine if 1 mSv is the optimal dose. Additional examinations will be required to determine if the CT dose used in this study is optimal, but such a study would increase the number of patients exposed to extra radiation and be ethically problematic. Second, no differences in aneurysmal sac diameter were observed between ULD-CT and SD-CT in patients who had either aneurysmal wall calcification, metal in their body other than a stent graft, or obesity; however, the number of patients with these factors was too small to determine the statistical significance of any differences. Furthermore, because no cases of body motion were observed during CT, examining the extent to which motion artifacts may have affected the measured aneurysmal sac diameter was not possible. Third, specifying the slice in which the aneurysmal diameter was measured could reduce measurement variability but underestimate differences between ULD-CT and SD-CT. In the current study, we preselected axial images for measurement. Although cross-sectional imaging is recommended for clinical assessments of aneurysmal diameter, in this study, we evaluated the quality of 2 imaging techniques rather than the methods for measuring the maximum diameter. Consequently, we adopted this approach to minimize biases, such as errors arising from the generation of cross-sectional images. Furthermore, the measurements were only made by experienced radiologists to avoid inaccuracies caused by less experienced individuals. Nonetheless, measurement errors in routine clinical practice may exceed those observed in this study. Finally, the DLR used in this study is a proprietary reconstruction technique from a single manufacturer, which limits its availability. However, similar DLR technologies have been introduced by multiple vendors, and their adoption is expected to expand rapidly. Additional studies will be required to evaluate potential differences among DLR techniques from different manufacturers, but comparable performance is probable. Consequently, we anticipate that ULD-CT with DLR will become widely available to medical facilities.
Previous studies on the application and prospects of DLR 28 have not led to clear assessments of the diagnostic performance of DLR, so further prospective studies are needed. However, the current study results are useful because they demonstrated the diagnostic performance of DLR for a specific task.
Conclusion
In conclusion, ULD-CT with DLR was shown to measure the aneurysmal sac diameter to a clinically useful degree, with the benefit of substantial radiation dose reduction (approximately one-seventh that of SD-CT) during post-EVAR surveillance. Although the overall image quality was inferior to that of SD-CT, the image quality for the intended purpose was sufficient for long-term post-EVAR aneurysmal sac diameter surveillance.
Supplemental Material
sj-tiff-1-jet-10.1177_15266028251339345 – Supplemental material for Feasibility of Ultralow-Dose CT With Deep-Learning Reconstruction for Aneurysm Diameter Measurement in Post-EVAR Follow-Up: A Prospective Comparative Study With Conventional CT
Supplemental material, sj-tiff-1-jet-10.1177_15266028251339345 for Feasibility of Ultralow-Dose CT With Deep-Learning Reconstruction for Aneurysm Diameter Measurement in Post-EVAR Follow-Up: A Prospective Comparative Study With Conventional CT by Keigo Matsushiro, Takuya Okada, Koji Sasaki, Tomoyuki Gentsu, Eisuke Ueshima, Keitaro Sofue, Katsuhiro Yamanaka, Masatoshi Hori, Masato Yamaguchi, Koji Sugimoto, Kenji Okada and Takamichi Murakami in Journal of Endovascular Therapy
Footnotes
Acknowledgements
Declaration of Conflicting Interests
The author(s) declared no potential conflicts of interest with respect to the research, authorship, and/or publication of this article.
Funding
The author(s) received no financial support for the research, authorship, and/or publication of this article.
Ethical Approval and Informed Consent
Institutional Review Board approval was obtained (approval ID: B21006). Written informed consent was obtained from all patients in this study.
Data Availability
The data supporting this study’s findings are available from the corresponding author, T.O., upon reasonable request.
Supplemental Material
Supplemental material for this article is available online.
References
Supplementary Material
Please find the following supplemental material available below.
For Open Access articles published under a Creative Commons License, all supplemental material carries the same license as the article it is associated with.
For non-Open Access articles published, all supplemental material carries a non-exclusive license, and permission requests for re-use of supplemental material or any part of supplemental material shall be sent directly to the copyright owner as specified in the copyright notice associated with the article.