
Abstract
Objectives:
Decision to operate on abdominal aortic aneurysms (AAAs) is primarily on the basis of aneurysm diameter. However, some patients experience rupture before reaching operative thresholds. This study aimed to determine the influence of morphology and hemodynamic force on the rupture of small AAAs.
Methods:
This was an age and sex matched case control study. Forty infrarenal AAAs (20 ruptured, 20 nonruptured controls) were retrospectively analyzed. Morphological variables (maximum diameter, complex neck, morphology classification, etc) were recorded. Hemodynamic parameters (peak and average flow velocity, wall shear stress [WSS], and aneurysm pressure drop [∆pressure], etc) were derived from computational fluid dynamics (CFD) analyses. Univariable and Multivariable regression was used to determine independent AAA rupture risk factors.
Results:
Mean AAA diameters were similar for control vs rupture groups (40.91 ± 6.16 vs 41.00 ± 9.79 mm; P = .543). Aneurysm morphology (saccular vs fusiform) differed markedly: 14/20 (70%) ruptured AAAs were saccular vs 2/20 (10%) in controls (P = .005). Peak WSS tended to be higher in ruptured AAAs (P = .042). WSS and flow velocity was significantly lower at the site of rupture (P < .05). Only saccular morphology was found to be independent risk factor for rupture (OR = 3.36 [1.67, 17.10]).
Conclusion:
Saccular morphology was associated with a significantly increased rupture risk of small AAAs. AAAs rupture tended to occur in areas of low WSS and low flow velocity. These findings suggest that integrating aneurysm morphology could aid in the identification of small AAAs with a high rupture risk.
Clinical Impact
This study provides an improvement of management strategies of small AAAs based on morphological and hemodynamic analysis. The study presents saccular aneurysms with high overall peak WSS and localized low flow loading have higher risk. The combination of morphological and hemodynamic analysis helps to better predict rupture of small AAAs, even if the diameter is within the conventional safety range.
Introduction
Rupture of an abdominal aortic aneurysm (AAA) is often fatal, with mortality around 90%. 1 The maximum diameter of an AAA is used to stratify the risk of aneurysm rupture and determine the threshold for elective repair in current guidelines. 2 However, recent studies have revealed that 10% to 24% patients ruptured at smaller diameters.3-7 The limited role of aneurysm diameter has generated interest in more precise prediction of AAA rupture with alternative methods. Differentiating between “impending rupture” and “stable” small AAAs represents a key clinical challenge, as it may help to avoid unnecessary follow-up or intervention.
Prior studies suggest that hemodynamic and morphological analysis based on computer tomography angiogram (CTA) may be adopted to investigate the susceptible factors for AAA rupture. Computational fluid dynamics (CFD) has emerged as a valuable tool for studying the internal hemodynamic forces of AAAs, offering detailed insights into blood flow patterns, pressure distribution, and wall shear stress (WSS) within the aneurysmal sac. For example, structural features such as an angulated or iliac neck, asymmetric bulging, or the presence of intraluminal thrombus (ILT) can impact wall stress distribution and contribute to aneurysm instability.8-10 Likewise, flow pattern was associated with a significantly increased risk of AAA rupture. 11 Importantly, the rupture of an abdominal aortic aneurysm is not the result of a single mechanism, only by combining multiple hemodynamic indices with morphological and clinical data can aneurysm growth be predicted precisely. 12
Presently, the management of small AAAs primarily relies on serial imaging to monitor maximum transverse diameter as an estimate of rupture risk. 13 Alternative metrics, such as volume and tortuosity, remain less extensively studied, though they could offer additional insights into AAA progression. 14 Hemodynamics, while potentially valuable, has not assumed a primary role in small AAA surveillance due to its complexity and time demands. Furthermore, small ruptured AAAs are seldom treated as distinct entities in studies on ruptured AAAs, likely owing to the limited sample sizes of such cases. At present, there is no reliable method to assess the rupture susceptibility of a small AAA. Greater understanding of local hemodynamic factors specific to small AAAs might improve predictions of rupture potential.
In this study, we perform a detailed statistical analysis of morphology and hemodynamics in a control group of stable small AAAs versus a rupture group, to identify features that distinguish ruptured aneurysms. The hypothesis was that differences in morphology may lead to differences in blood flow patterns and be related to the risk of small AAA rupture suggests that it could serve as a useful tool for enhancing the predictive value.
Methods
Study Population
The institutional review board of Shandong First Medical University approved this study, and the requirement for patient consent was waived by the institutional review board as this was a retrospective study.
All consecutive patients with infrarenal AAAs from September 2018 to July 2024 in Shandong First Medical University affiliated Shandong Provincial Hospital were reviewed. The exclusion criteria were abdominal aortic pseudoaneurysm or perforating ulcer; dissecting aortic aneurysm; mycotic or inflammatory aortic aneurysm; patients with connective tissue diseases or autoimmune diseases; and patients without pre-operative CTA.
Cases were identified as patients who underwent emergency endovascular or open repair due to ruptured or impending ruptured AAA. Ruptured AAA was defined as the presence of retroperitoneal and/or intraperitoneal hematoma adjacent to the aneurysm sac on preoperative CTA. Impending rupture AAA was defined as an acute onset or exacerbation of symptom, with at least one of the following CTA findings: draped aorta sign; focal discontinuity in circumferential wall calcification; and collection of fluid around aneurysm sac. All diagnoses from CTA findings were determined by the agreement of 2 vascular surgeons. Control patients were those age and sex matched patients with AAA who were asymptomatic and confirmed unruptured from CTA images from the same period.
Geometry Reconstructions
Thin slice CTA images (slice thickness: 1.0 mm; pixel size 0.613 mm [SIEMENS/SOMATOM Definition Flash]) were obtained to reconstruct the 3-dimensional (3D) AAA geometries using the commercially available software, Mimics (version 21.0; Materialize, Plymouth, MI, USA). Both lumen and thin ILT surfaces were smoothed, and some small but disconnected vessels were eliminated using the 3-Matic software (version 18, Materialize Inc., Leuven, Belgium) before geometrical analysis and CFD simulations. The 3D AAA models were then discretized by Ansys ICEM (version 20.0; ANSYS, Canonsburg, PA, USA) to generate computational meshes suitable for CFD analysis.
CFD Simulations
Numerical solutions were obtained using ANSYS FLUENT (version 20.0) by solving the incompressible steady Navier-Stokes equations. The blood was assumed to be incompressible, laminar, steady, homogeneous, and a Newtonian fluid. The density and dynamic viscosity of the blood were defined as 1056 kg/m3 and 3.5 × 10⁻³ kg/m−3, respectively. 15 As for the boundary conditions, a constant velocity inlet of 0.1 m/s at the infrarenal aorta and zero pressure outlet at the 2 iliac outlets were applied. 16 A rigid wall assumption and no slip boundary condition at the wall were also prescribed. Fluent Meshing (ANSYS, Canonsburg, PA, USA) was used to mesh each patient-specific model into 600 000 to 900 000 tetrahedral elements and 10 boundary layers after mesh independence validation. For each case, the results of a standard and a refined volume mesh were calculated and grid independent solutions were verified if the average differences in the WSS distribution were <1%. Although this ensures mesh convergence, it does not constitute a full assessment of numerical uncertainty, which is multifactorial in nature. Based on the pulsatile flow wave data from the literature, 15 we extracted and calculated the velocity curve function associated with the inlet area. Subsequently, we assigned this function to the inlets of each 3D model by writing and loading a user-defined function (UDF). The flow ratio was calculated based on the cube of the outlet diameter, thereby distributing the total inlet flow to the 4 outlets of the model. It is noteworthy that to avoid the influence of boundary conditions on the blood flow within the study area, we extended the inlets and outlets: the inlet was extended by a fixed 200 mm, while the outlet was extended to 10 times its diameter. The Carreau-Yasuda model was used to characterize the dynamic viscosity of blood, as follows:

Three calculation cycles and the time step of 0.01 s were set for simulation calculation after verification of time-step and cycle dependence. Residual value below 10−5 was set as the convergence limit of calculation. Blood flow was characterized by the continuity equation and Navier-Stokes equation.


where ~u denotes the blood flow velocity vector, P is the pressure on blood flow, and g (= −9.81 m/s2) expresses the acceleration of gravity. The finite volume method was applied to solve the governing equations of discretized mesh elements

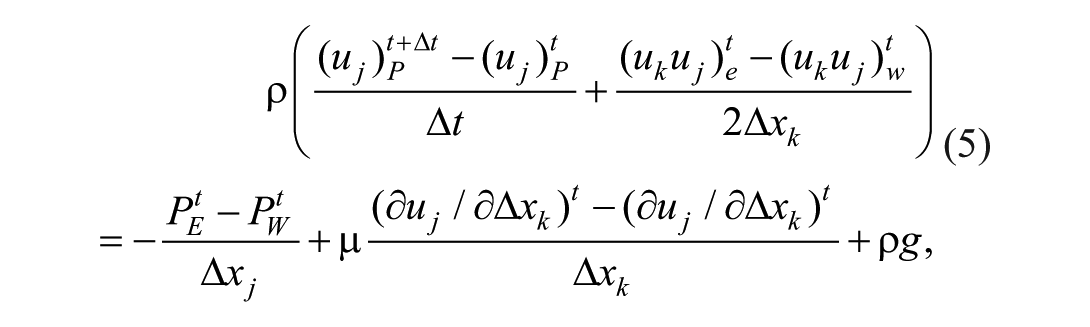
where t is the time; Dt is the time increment; e and w are the edge interface of grids; i, j, and k represent nodes of the mesh elements; subscripts P, E, and W are the center points of 3 adjacent elements; and Dx is the side length of grid cell. The pressure based separation algorithm, was employed to solve the coupling of pressure and velocity. The advection and unsteady terms were discretized using a second-order upwind interpolation scheme and a first-order implicit time-marching scheme, respectively. The above settings and solutions were executed through Fluent 2021 R1 (ANSYS, Canonsburg, PA, USA).
Hemodynamic Parameters
In addition to flow pattern, the following hemodynamic parameters were also calculated: (1) WSS, described magnitude of tangential viscous force between the aortic wall and the blood flow; (2) aneurysm pressure drop (∆pressure), defined as the pressure drop from the entrance of the aneurysmal sac to the outlet; (3) streamline velocity, described as the velocity of blood flow in the aorta and within the aneurysm. The peak and average values of all the above parameters have been statistically calculated.
Morphological Parameters
Morphological data were collected for all patients, including neck diameter, neck length and angle, maximal AAA diameter, AAA morphology (classified into saccular or fusiform), inlet-to-outlet ratio (calculated from the ratio of neck area to the sum of the area of the 2 common iliac arteries). All diameters were measured in slices perpendicular to the center line. A saccular small AAA was defined as a focally spherical asymmetric dilatation of the abdominal aorta and fusiform as a coil-shaped dilatation (Figure 1). Complex neck of AAA were defined as short neck (<15 mm), trapezoidal neck, combined circumferential thrombosis or calcification exceeding 50%, sharp-angular neck (>60°), or wide neck (>32 mm). A small AAA is defined as an AAA with the maximal diameter less than 55 mm.
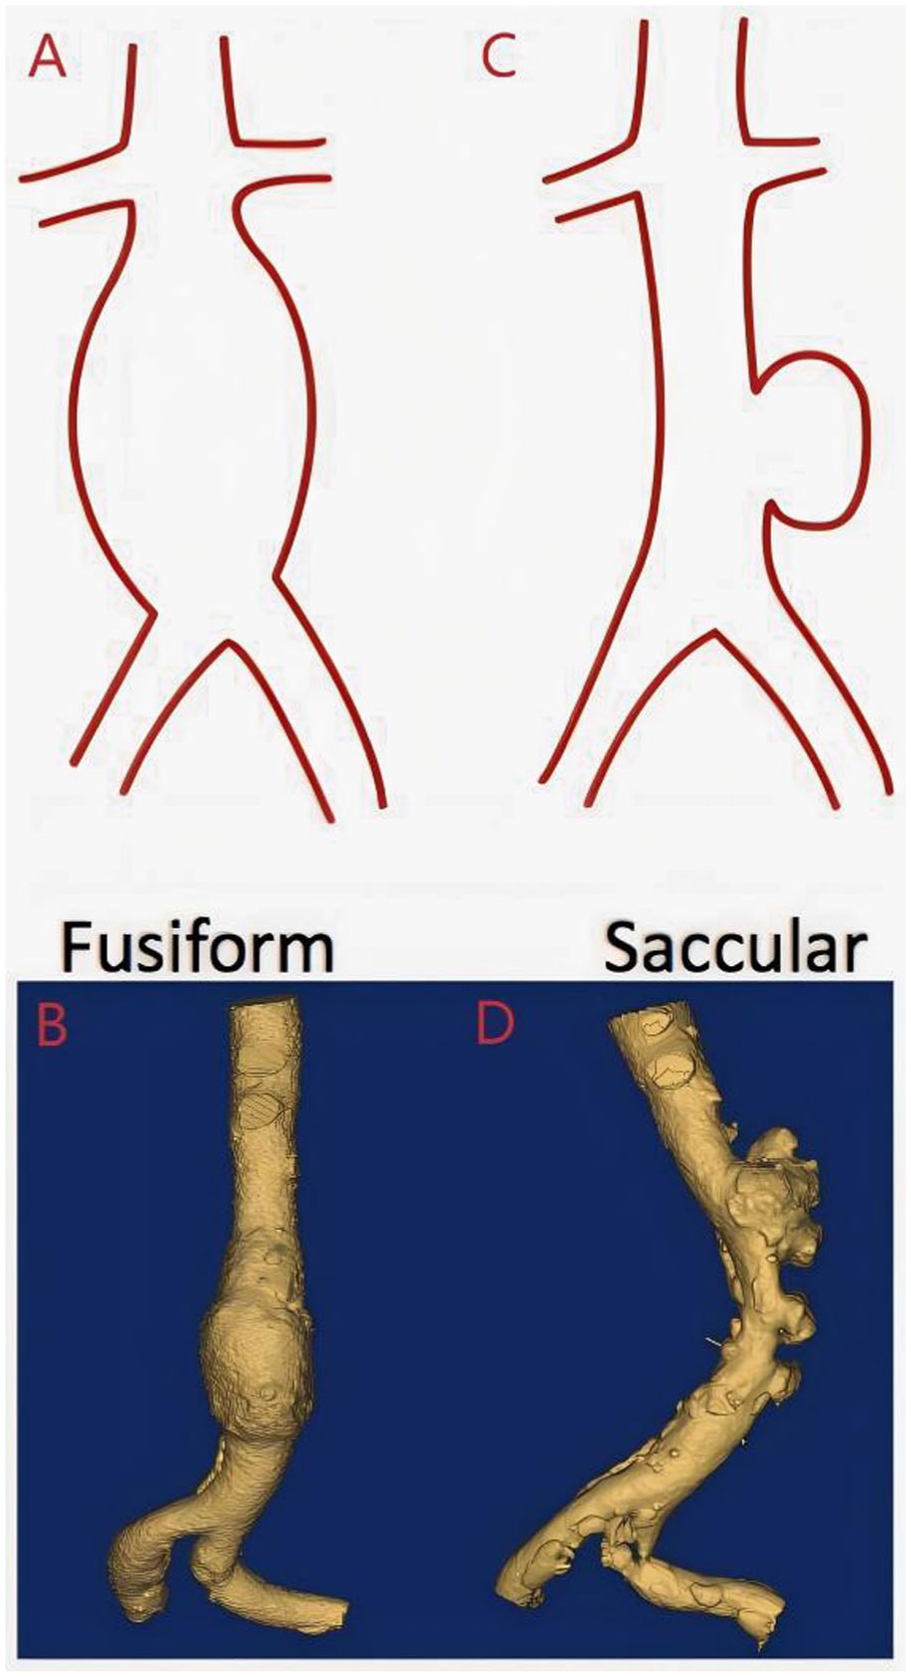
Schematic diagram of abdominal aortic aneurysm (AAA) morphology: fusiform AAA (A, B), saccular AAA (C, D). 23
Statistical Analysis
Continuous variables were expressed as mean ± deviation or as median (interquartile range) if they were not normally distributed. Categorical variables were presented as numbers (%). All variables were compared between patients with ruptured or unruptured small AAA in univariable analyses, using Student t tests or a Mann-Whitney U test for continuous data, and the chi square test or Fisher’s exact test for categorical variables. With adjustment for age, sex, and diameter, univariable and multivariable logistic regression analysis was performed to calculate the odds ratio (OR) and related 95% confidence interval (CI) and identify independent risk factors for rupture. The univariable analysis was conducted on all variables, and variables with P < .2 in univariable analysis were selected and subjected to forward stepwise regression to obtain the results of multivariable analysis. Given the limited number of rupture events (n = 20) relative to the number of candidate predictors, the multivariable model is susceptible to overfitting and potential instability. Therefore, the results of this analysis should be considered exploratory and hypothesis-generating, and will require validation in larger cohorts.
Results
Baseline Characteristics
During the study period, 926 patients were screened according to the inclusion and exclusion criteria, and the detailed selection process is shown in Figure 2. Finally, 121 patients were diagnosed as small AAAs. Only 20 cases met the criteria for small ruptured AAA and were identified as the rupture group, and 20 age and sex matched patients with stable AAAs were identified as the control group.
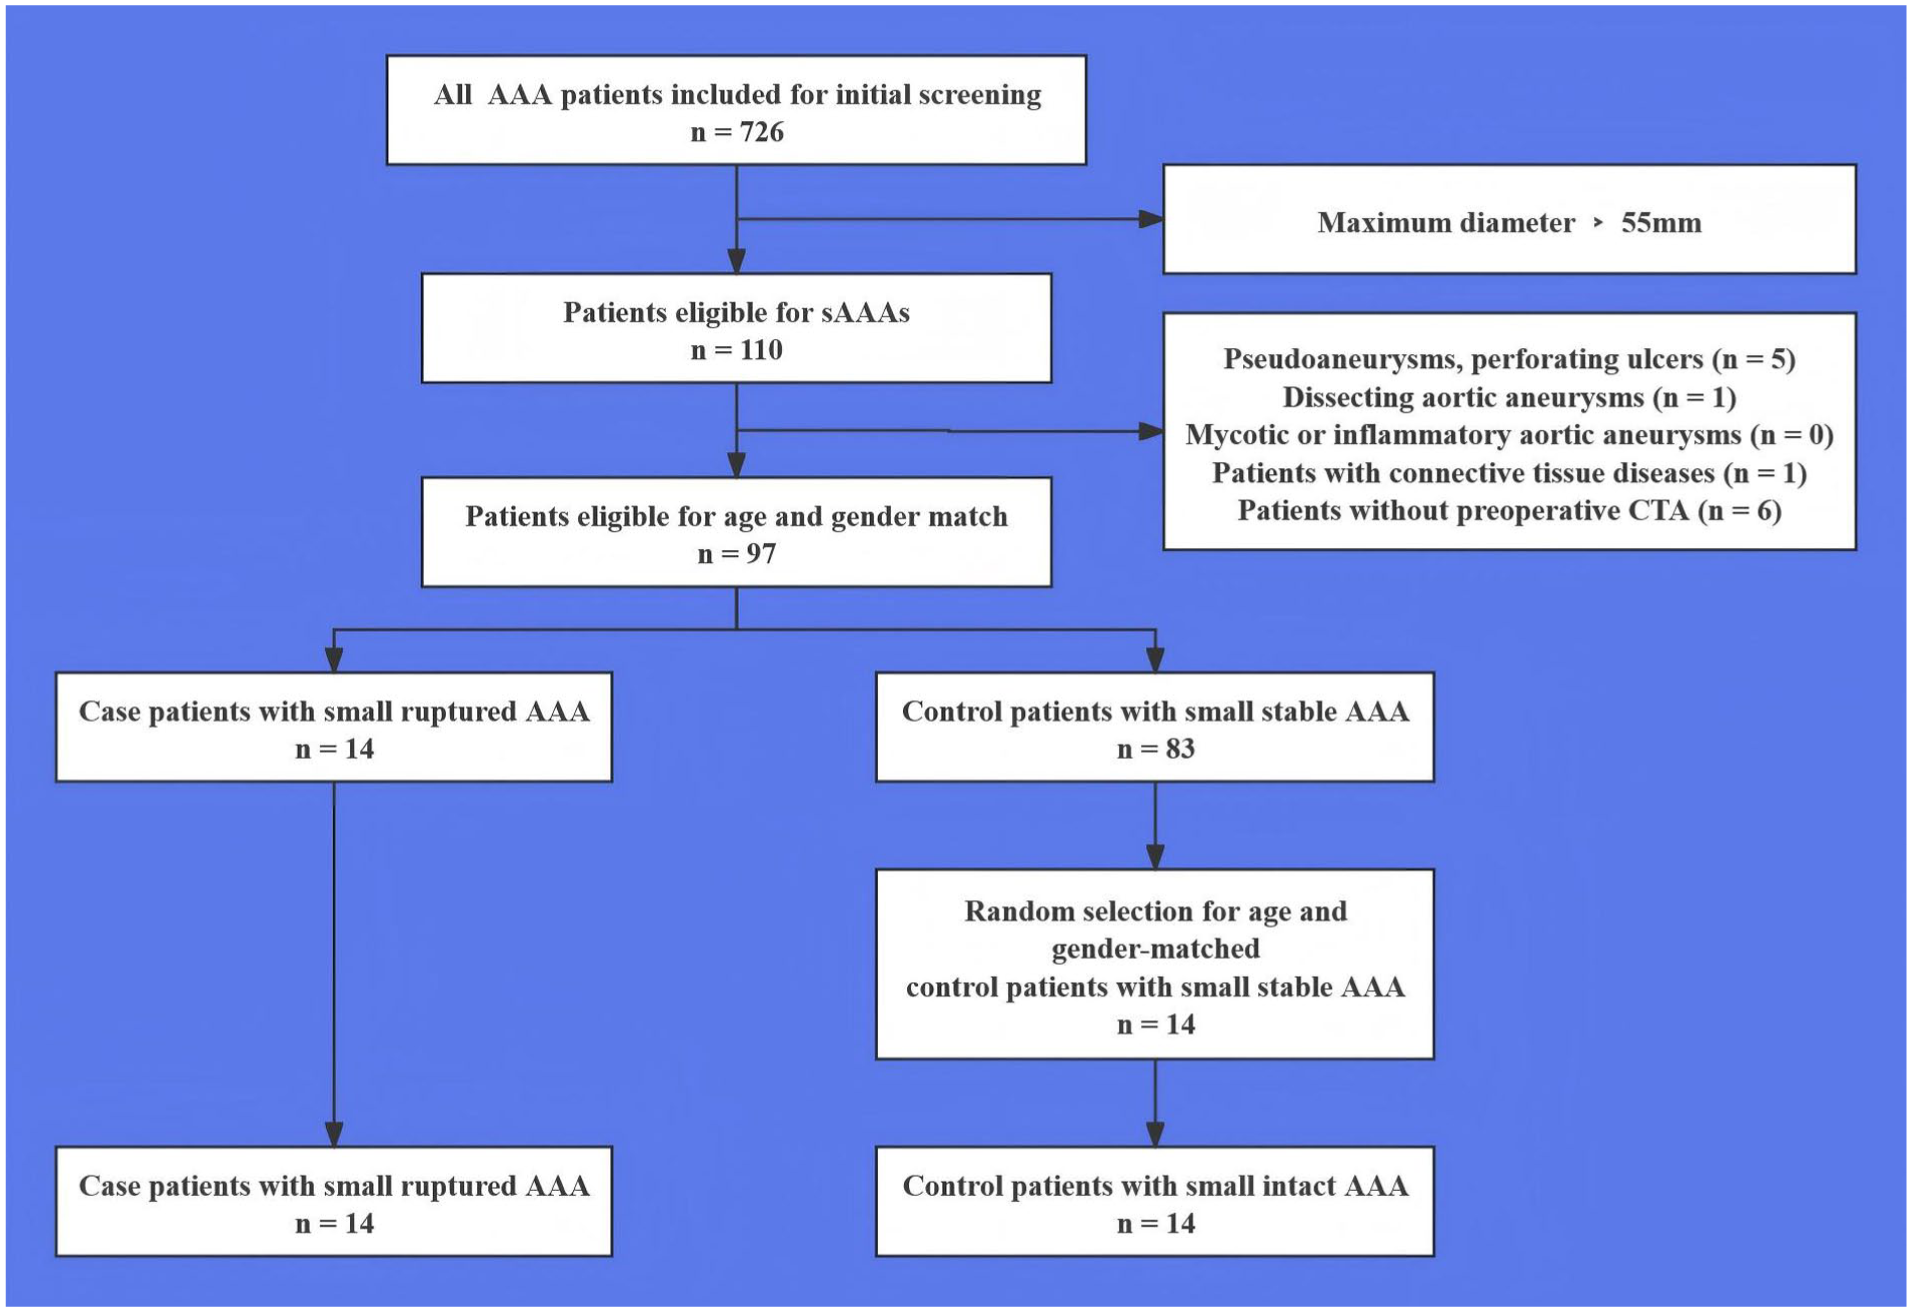
Flow diagram of patient selection in this retrospective, age and sex matched case control study including a total of 40 patients with small abdominal aortic aneurysms (AAAs) treated in the hospital between 2018 and 2024. CTA, computed tomography angiography.
The 2 groups were similar in basic clinical characteristics (Table 1). The mean age of the case and control groups were 63.01 ± 16.08 and 73.40 ± 6.09 years, respectively (P = .081). The majority of patients were male in both groups (80% in rupture vs 85% in control, P = .557). Prevalence of risk factors such as smoking (60% vs 70%) and diabetes (30% vs 50.0%) appeared lower in the rupture group, but these differences were not statistically significant in this small sample (P = .660 and P = .388, respectively). Hypertension was common in both groups (80% vs 85%).
Baseline characteristics of 20 ruptured and 20 intact abdominal aortic aneurysms (AAAs) included in this retrospective case control study.
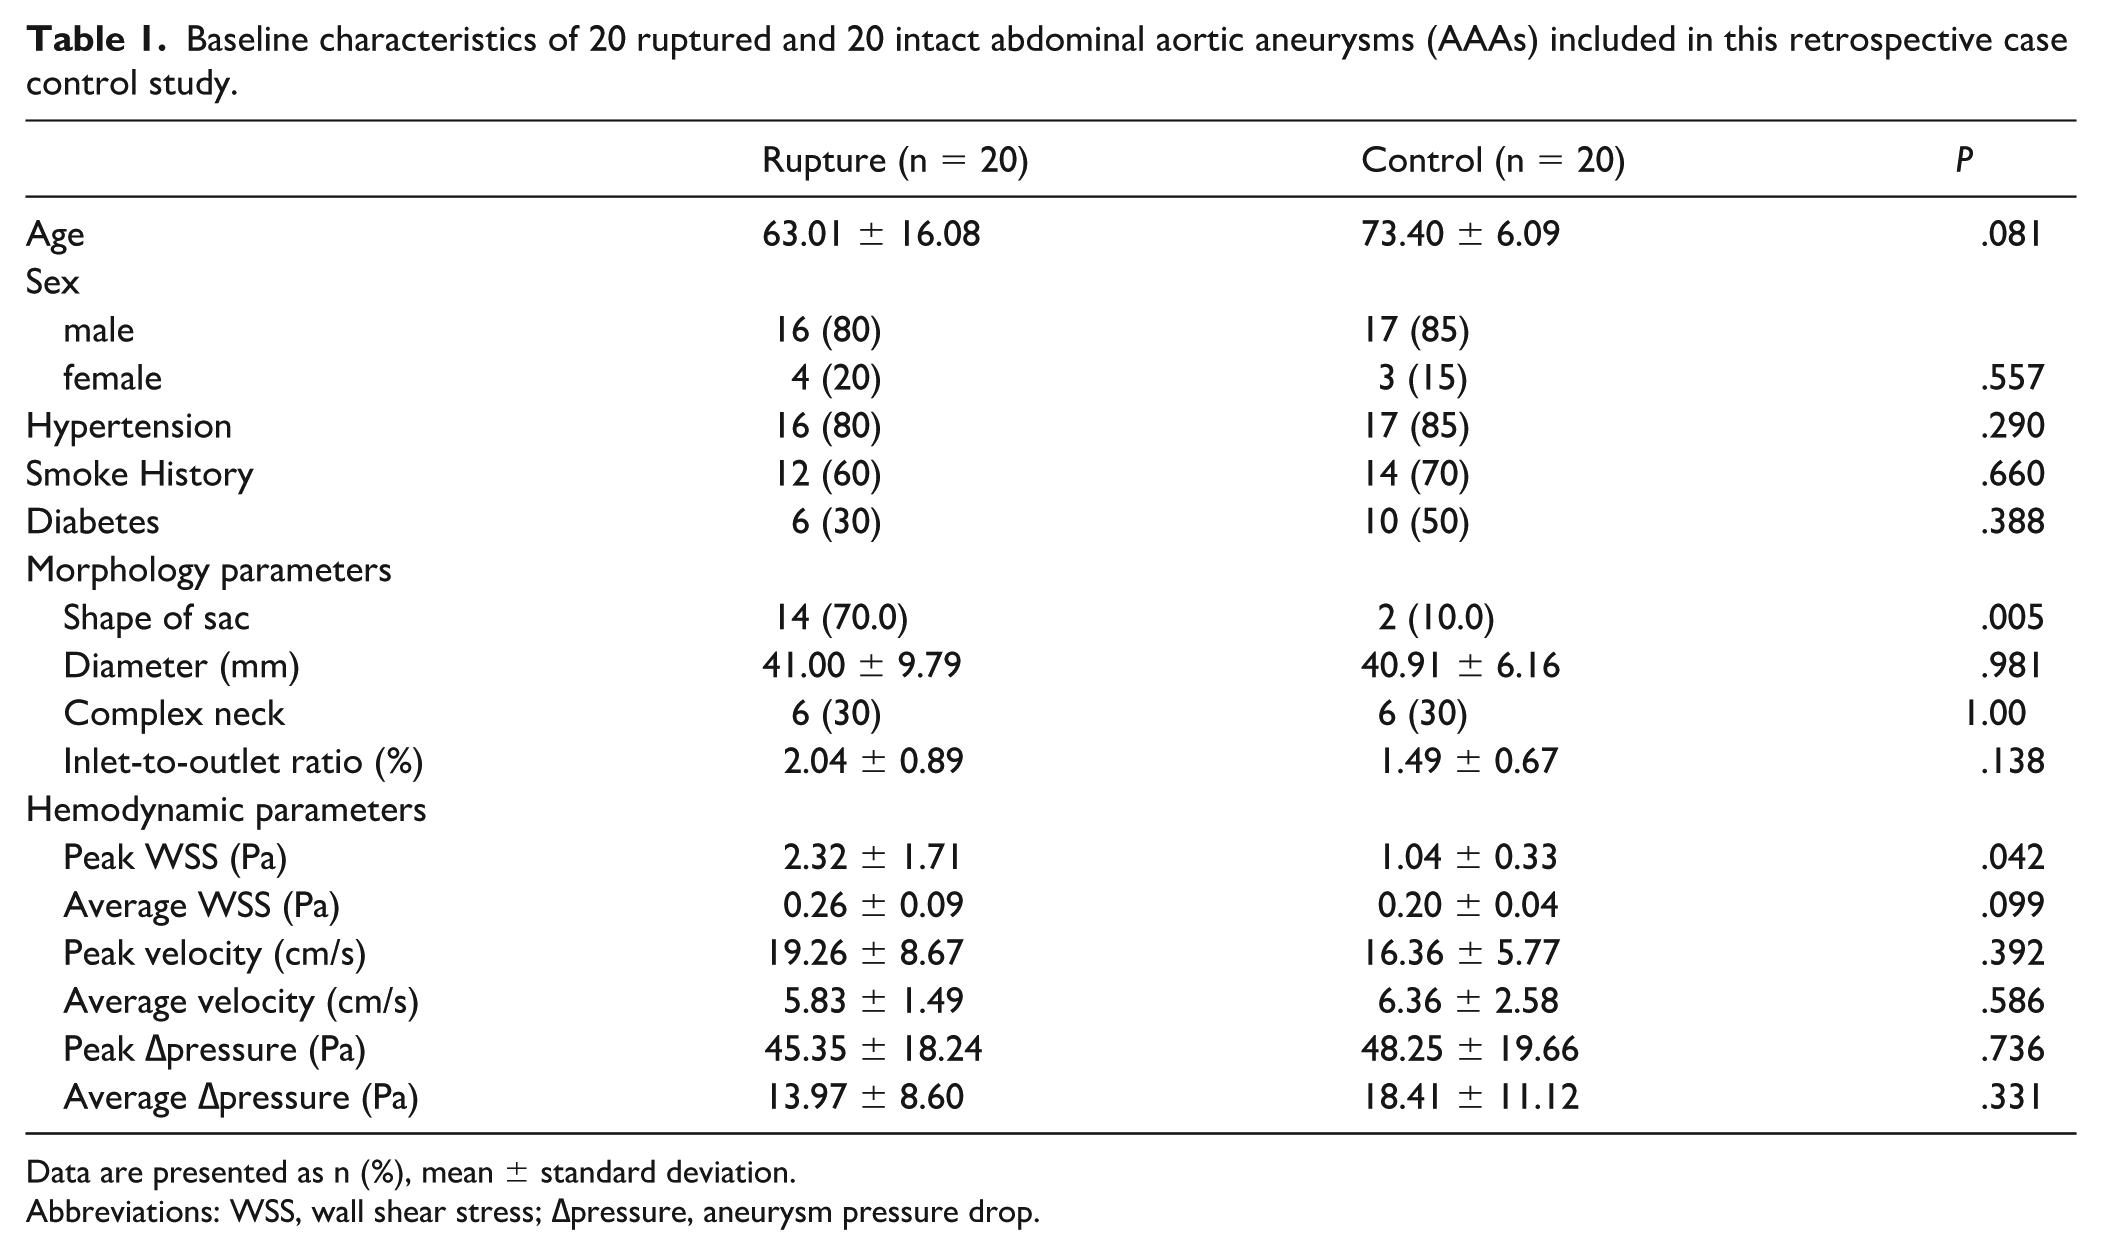
Data are presented as n (%), mean ± standard deviation.
Abbreviations: WSS, wall shear stress; ∆pressure, aneurysm pressure drop.
Morphology Parameters
In contrast, aneurysm morphology showed a striking difference in morphology between groups. Among ruptured AAAs, 14 out of 20 (70%) were classified as saccular, whereas the control AAAs were predominantly fusiform (only 2 of 20 saccular, 10%) (P = .005). The maximal diameter, condition of the neck and the ratio of the inlet to outlet was similar between groups (Table 1).
Hemodynamic Parameters
The overall flow patterns in small AAAs varies depending on their morphology. All fusiform aneurysms exhibit a kind of regular helical high-speed streamline, whereas saccular aneurysms have highly chaotic streamline and often contain extremely low-velocity streamline within the irregular saccular protrusions. Sample patient images are shown in Figure 3 and supplementary videos. With regard to all hemodynamic parameters, peak WSS was significantly higher in the rupture group (2.32 ± 1.71 Pa vs 1.32 ± 0.33 Pa; P = .042), there were no significant differences in other hemodynamic parameters between ruptured and control groups (Table 1). Only the morphology and peak WSS have a significant correlation with rupture (Table 2).
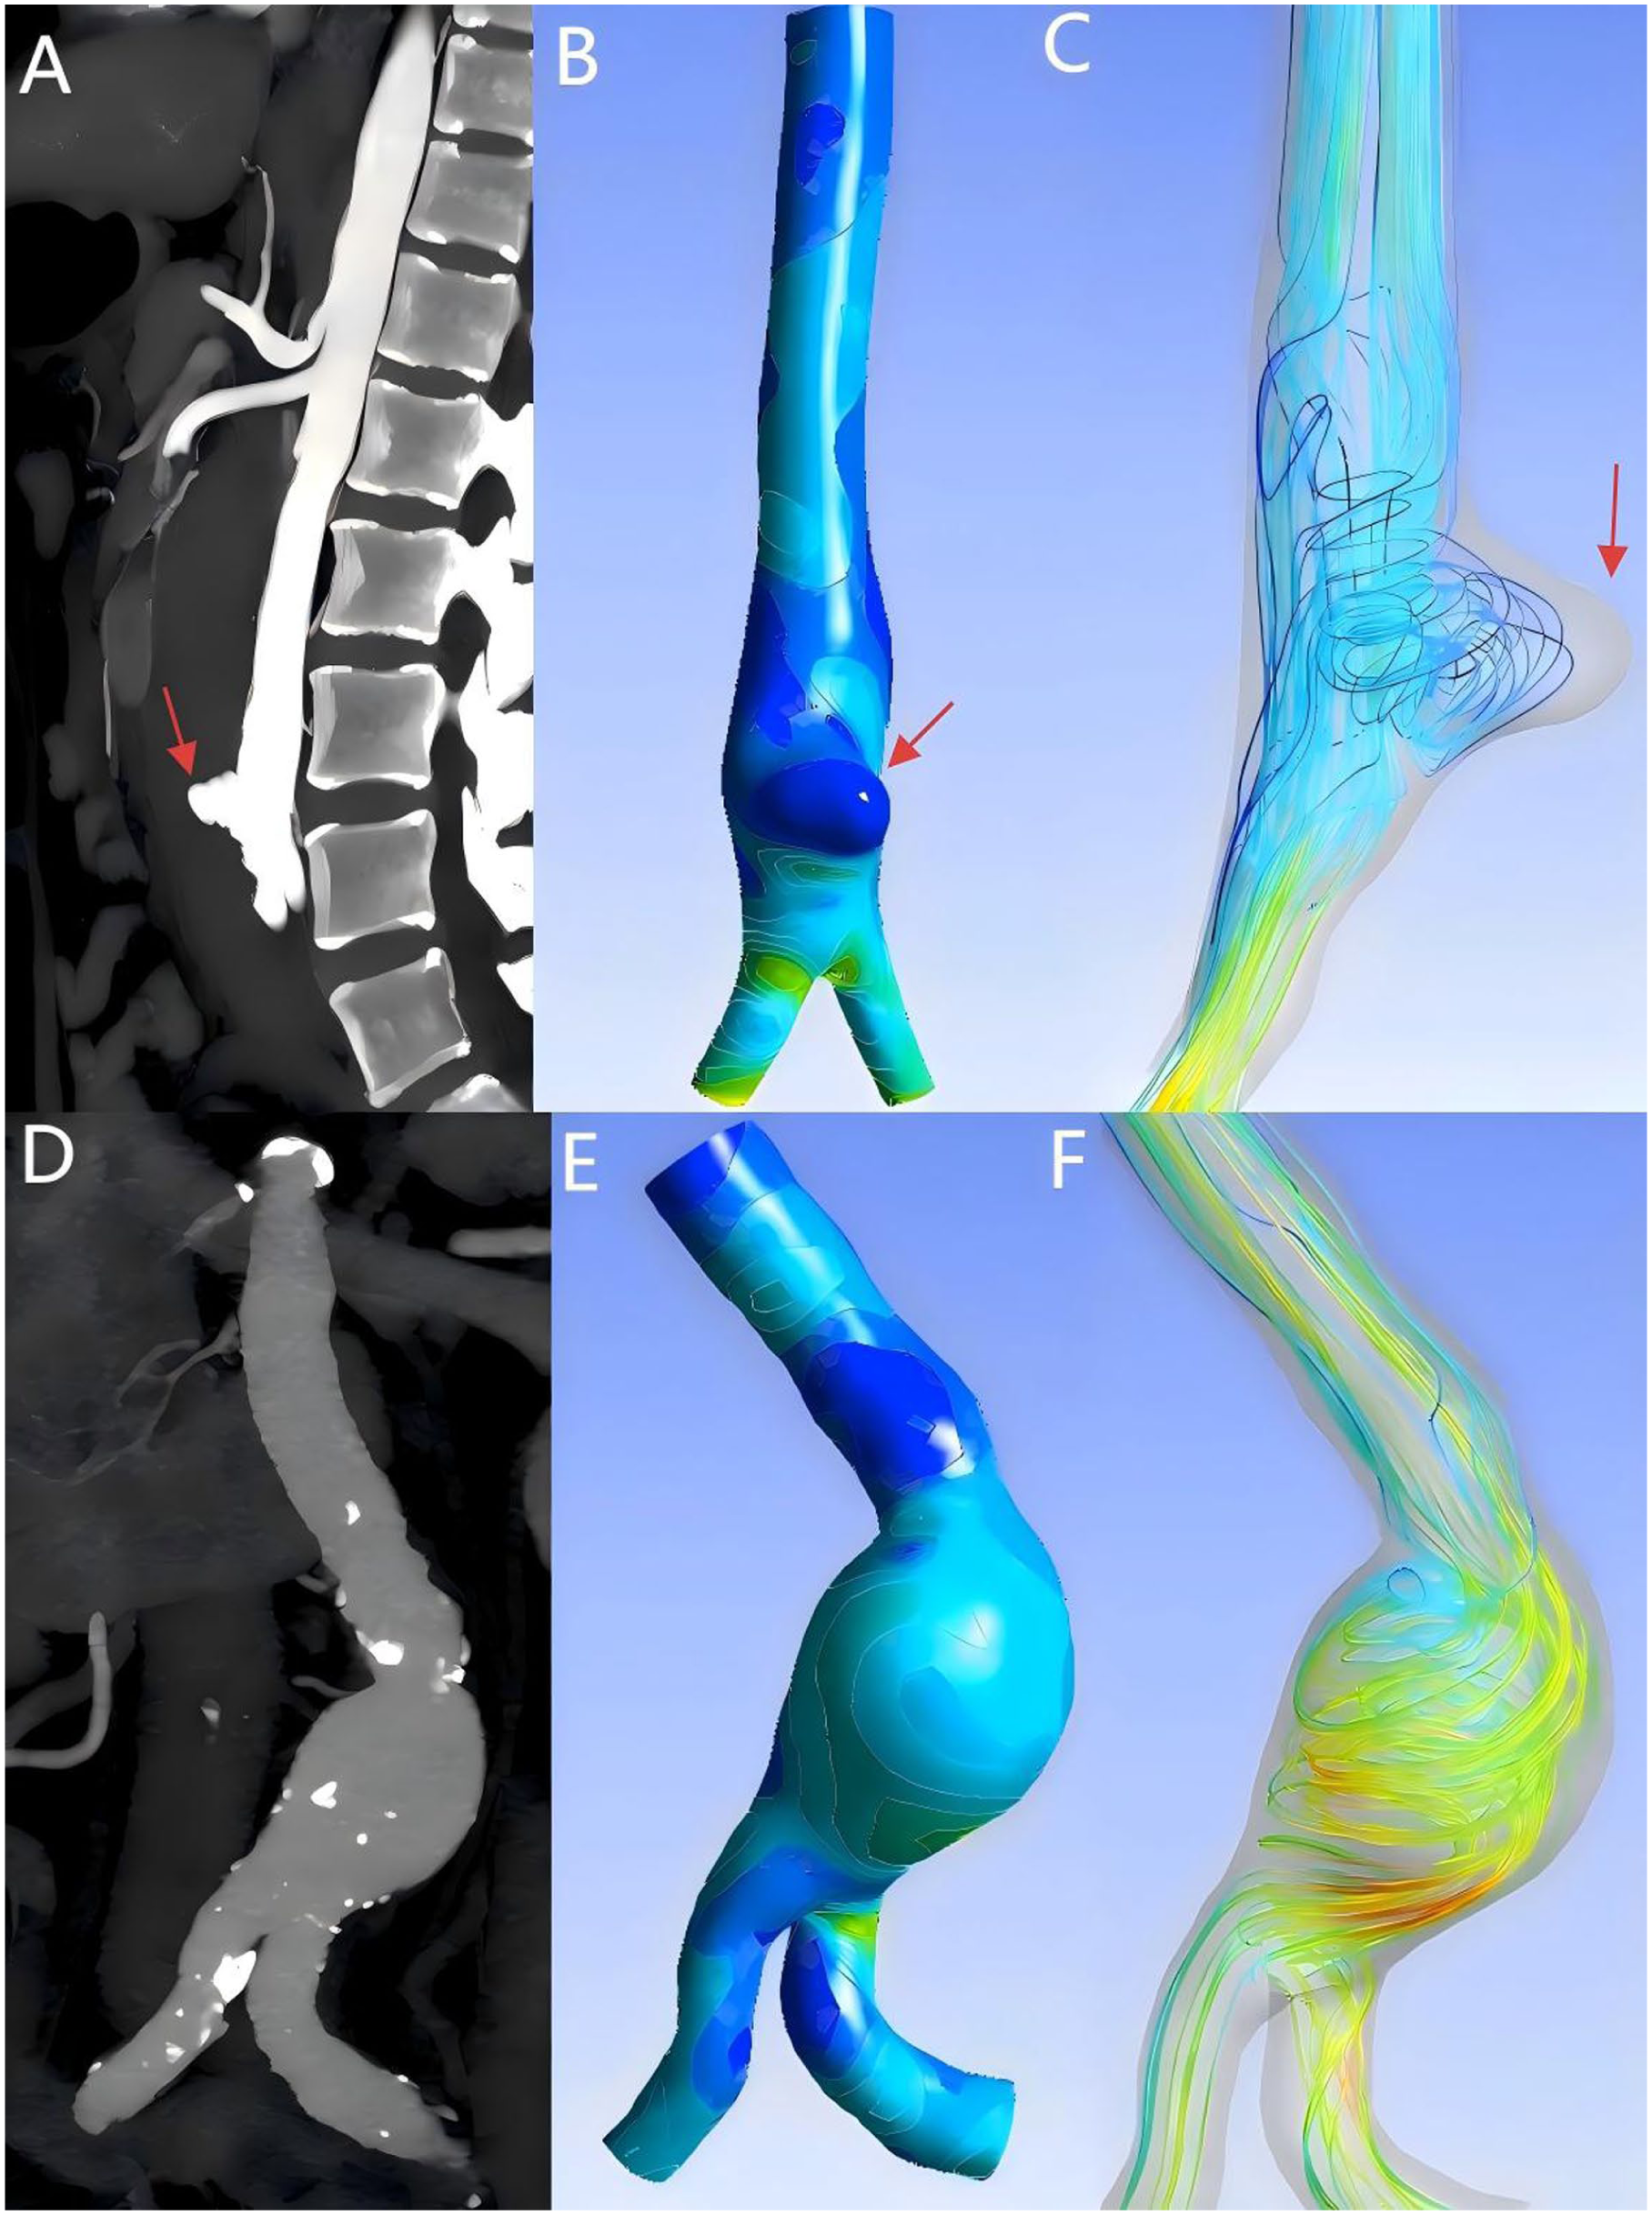
Figure A and D shows the Multiplanar reconstruction based on original computed tomography angiography (CTA) images. Computational fluid dynamics (CFD) shows wall shear stress (WSS) (B, E) and velocity (C, F) in two cases of small abdominal aortic aneurysms (AAAs). Case 1 (A, B, C) is a saccular rupture aneurysm with a diameter of 26 mm, the rupture site is marked with a red arrow. Case 2 (D, E, F) is a fusiform stable aneurysm with a diameter of 32 mm. Lower values are represented by the blue end of the spectrum, whereas red indicates higher values.
The correlation of various factors with abdominal aortic aneurysms (AAAs) rupture based on the cases included in this study.
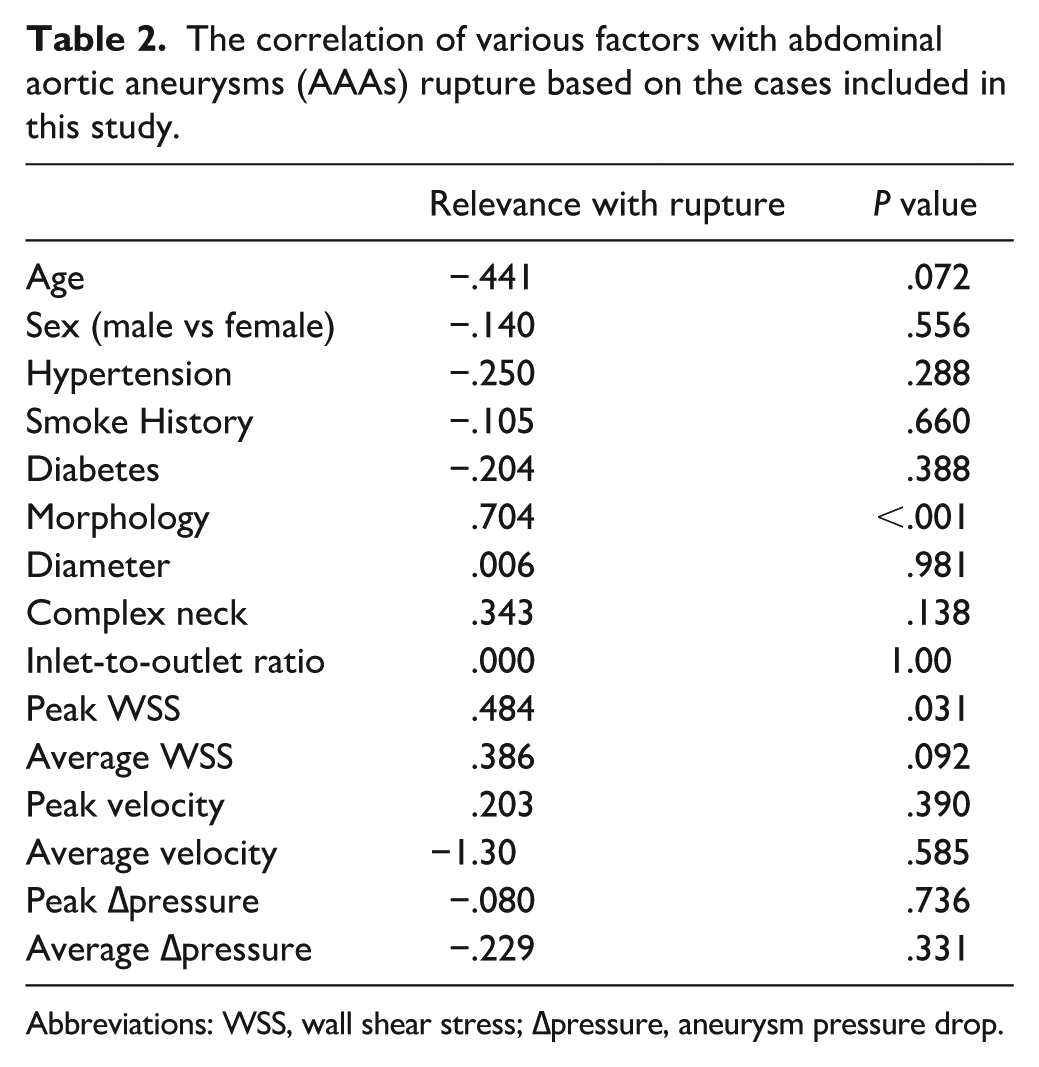
Abbreviations: WSS, wall shear stress; ∆pressure, aneurysm pressure drop.
Hemodynamics at the Rupture Site vs Entire Aneurysm
For each ruptured small AAA, we analyzed the blood flow characteristics specifically at the location where the wall rupture occurred, and compared these with the overall aneurysm’s hemodynamic extremes. Notably, the rupture occurs in areas with relatively low wall shear and flow, but high pressure. As shown in Figure 4, the local peak WSS, flow velocity and ∆pressure at the rupture site were markedly lower than the peak values elsewhere in that aneurysm. The local WSS at rupture was significantly lower than the peak WSS of in the same ruptured small AAAs (1.06 ± 1.00 Pa vs 2.63 ± 1.85 Pa; P = .048). Similarly, the blood flow velocity adjacent to the rupture site was greatly reduced compared with the central stream(5.01 ± 1.83 cm/s vs 20.24 ± 9.96 cm/s; P = .004). The computed pressure at the rupture site was markedly elevated, the ∆pressure at rupture was significantly less than the overall maximal ∆pressure (14.190 ± 8.55 Pa vs 45.85 ± 18.58 Pa; P = .008).
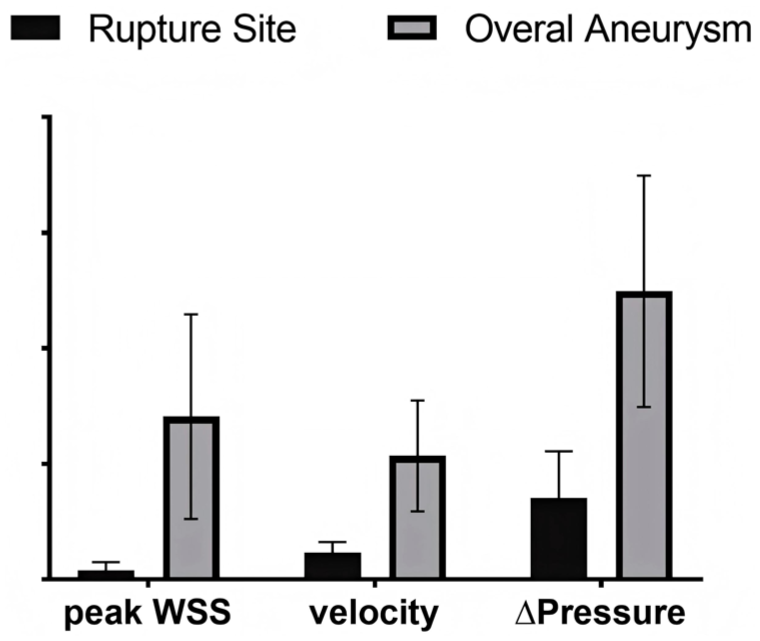
Comparison of hemodynamic parameters for rupture site and overall aneurysm in small ruptured abdominal aortic aneurysms (AAAs).
Risk Factors for Aneurysm Rupture
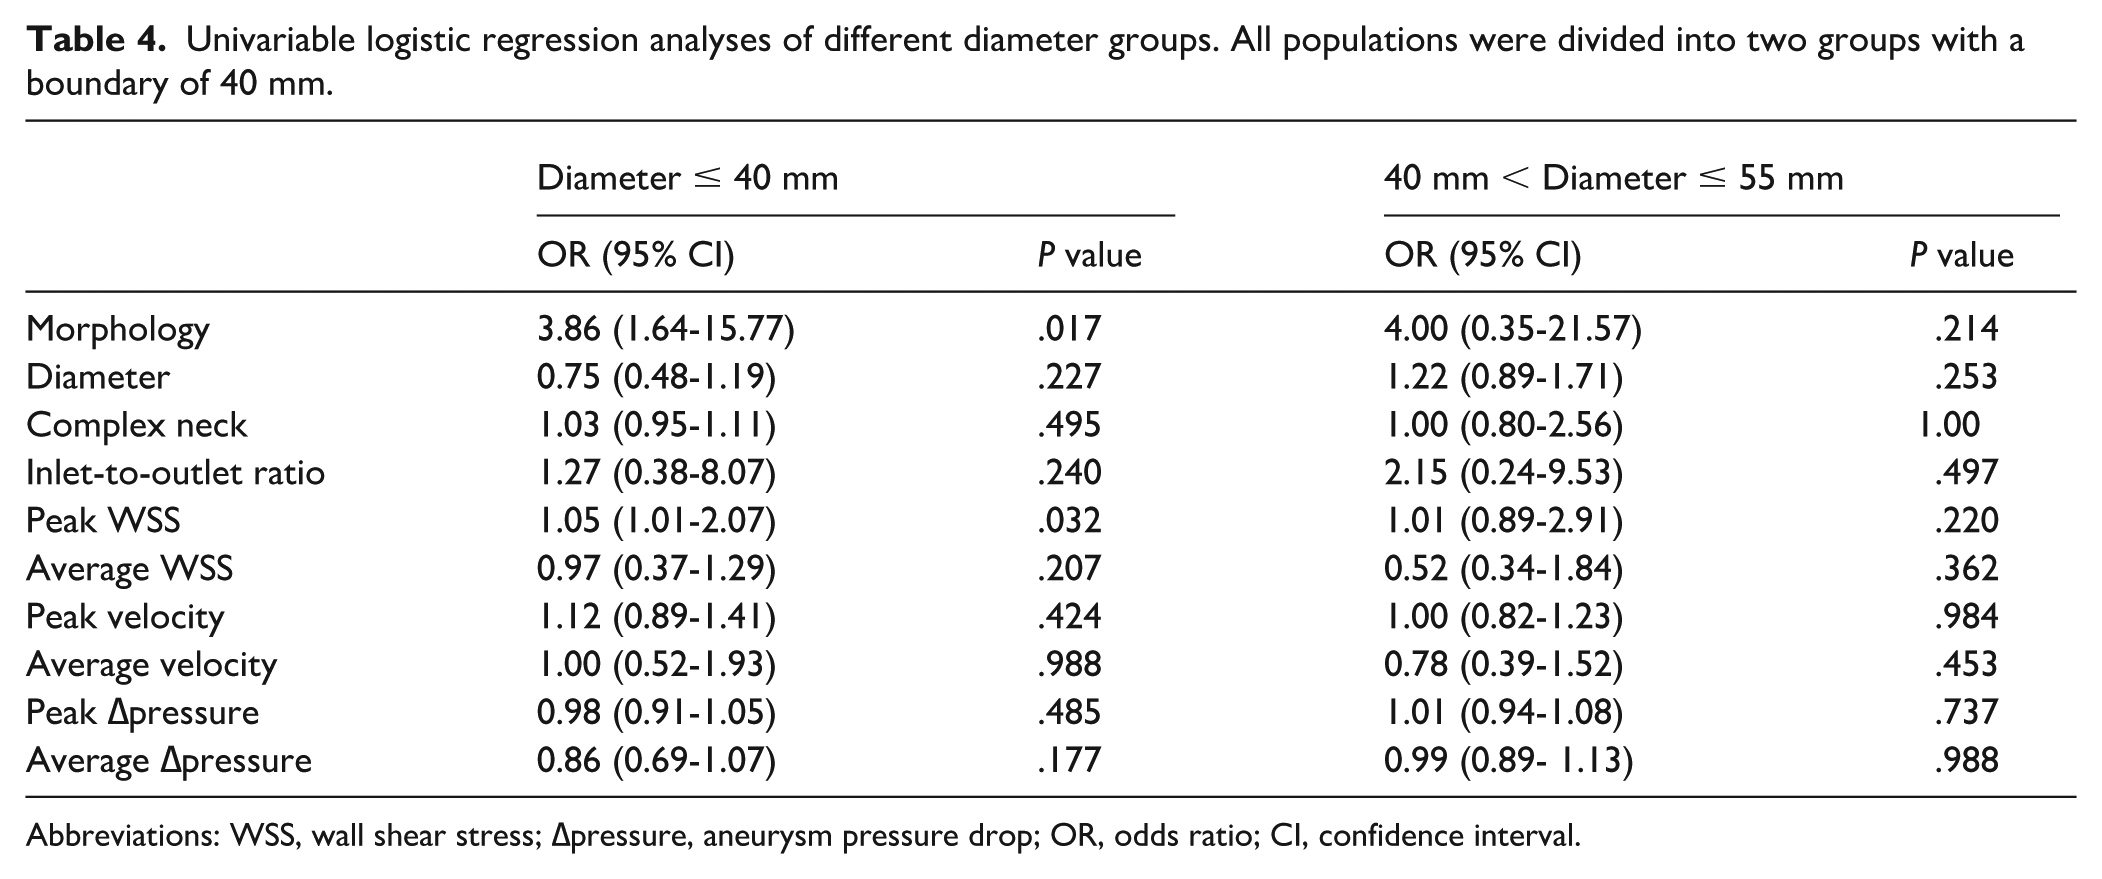
In the multivariate analysis of the overall population, it was found that only saccular morphology was associated with a significantly increased risk of small AAA rupture, indicating that risk of small AAA rupture increased progressively as the morphology of aneurysm changing from fusiform to saccular (OR = 3.36 [1.67-17.10], P = .048) (Table 3). However, due to the limited number of rupture events, this finding should be interpreted with caution, as the wide CI reflects model imprecision and potential overfitting. The overall study population was further subdivided into 2 groups based on diameter: ≤40 mm and 40 to 55 mm, and univariable analyses were conducted on these 2 groups (Table 4).
Uni- and Muliti- variable regression of patient characteristics correlated with rupture risk.
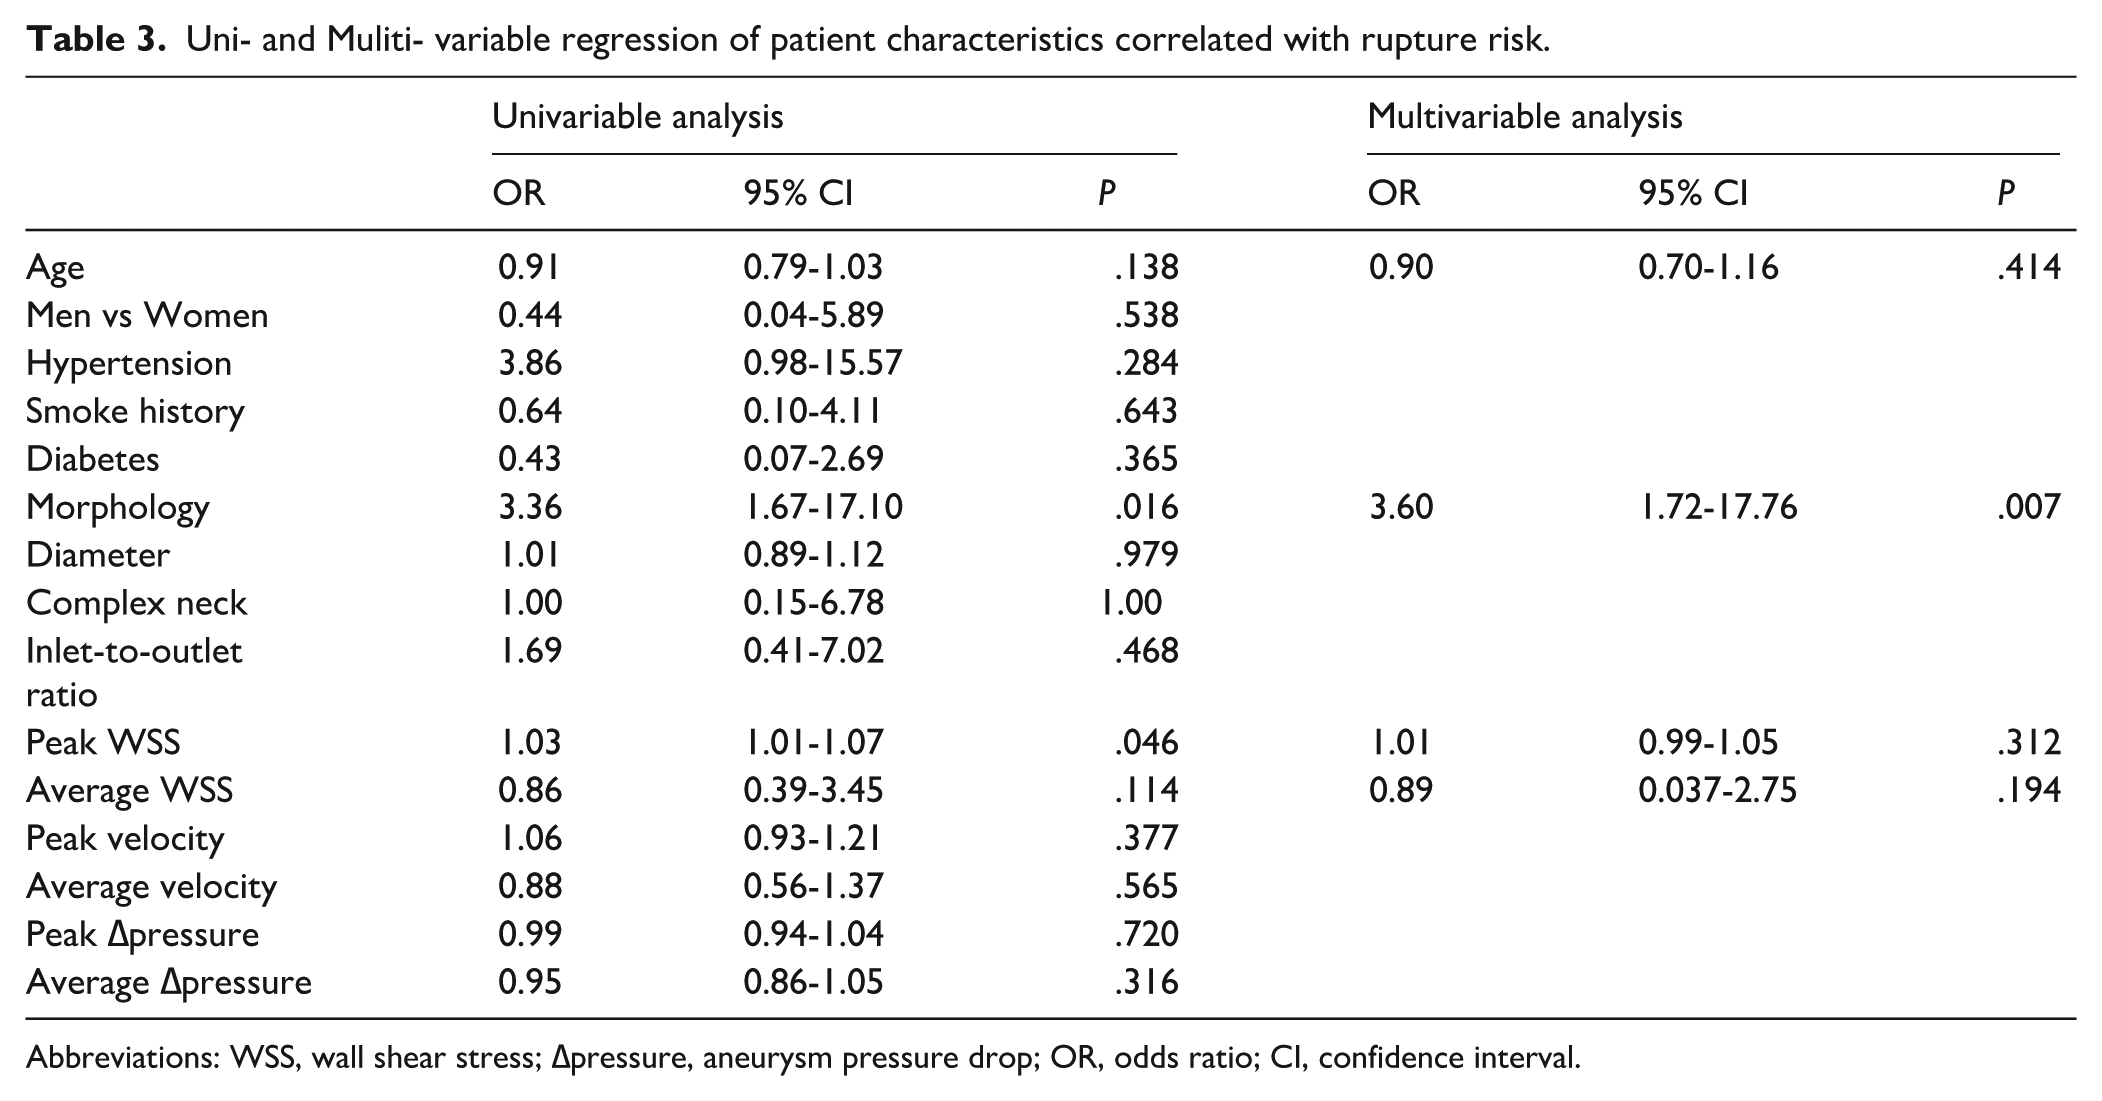
Abbreviations: WSS, wall shear stress; ∆pressure, aneurysm pressure drop; OR, odds ratio; CI, confidence interval.
Univariable logistic regression analyses of different diameter groups. All populations were divided into two groups with a boundary of 40 mm.
Abbreviations: WSS, wall shear stress; ∆pressure, aneurysm pressure drop; OR, odds ratio; CI, confidence interval.
Discussion
Early accurate prediction of small AAA rupture is an important supplement to the management of small AAAs. In this comparative analysis of ruptured versus intact small AAAs, we identified aneurysm morphology (saccular vs fusiform) as the key predicting factor and observed that abnormal low WSS and velocity location in overall higher WSS environments are associated with rupture sites. The results suggest that assessing morphology, and potentially hemodynamics, of small AAAs may provide additional insights into their rupture risk. This information could be considered alongside diameter in future risk stratification models.
Several randomized controlled studies comparing early intervention to surveillance of small ruptured AAA have used slightly different size cutoffs but concluded uniformly that early intervention does not decrease mortality compared with surveillance.17-21 Contrary to previous studies,22,23 we found no significant difference in maximal diameter between the ruptured and control groups. Although this could be partly due to the sample selection which only included the AAAs with diameters ≤ 55 mm, it also exemplifies the well-documented phenomenon that small size does not necessarily mean stability. One of our rupture cases was a young female patient with aneurysm diameter of only 26 mm, far below the usual intervention threshold. As noted in prior studies, diameter fails to account for patient-specific wall composition and biomechanics. 10 Our ruptured aneurysms were predominantly saccular with the percent of 85.7%, whereas stable aneurysms were mostly fusiform. This aligns with clinical experience and recent large-scale data showing saccular AAAs become acute at smaller diameters than fusiform AAAs.22,23 In our study, the saccular morphology is the most significant and sole factor that distinguishes ruptured small AAAs from stable ones. Our results suggest that, in this cohort of small AAAs, saccular morphology was associated with a higher rupture risk than diameter alone. This finding highlights the potential value of careful imaging evaluation of aneurysm morphology, which may offer additional information beyond the maximum diameter criterion currently used in clinical practice.
By comparing local rupture-site hemodynamics to global values, we found that rupture consistently occurred in regions that were not experiencing the highest flow or shear stress at that time. This finding is in agreement with recent CFD studies, which reported that actual rupture sites were characterized by low WSS and flow recirculation. 10 Interestingly, our research found that compared with fusiform small AAAs, saccular small AAAs are more likely to form slow-velocity streamline and multiple vortex outside the main blood flow, which also frequently appears at the rupture sites of ruptured aneurysms. This is consistent with a recent animal study that stagnant aortic hemodynamic conditions may accelerate aortic inflammation and aneurysmal enlargement but flow loading may attenuate AAA enlargement via wall shear or strain-related reductions in oxidative stress. 24
However, by comparing the overall hemodynamic parameters of the ruptured group with those of the control group, we found that both the peak WSS in the small ruptured AAAs was significantly higher which was always reported as having no statistical significance in past studies related to AAAs. Perhaps this is due to the particularity of this study which focused only on small ruptured AAAs that are rarely mentioned. Wall shear stress to some extent reflects the different stages of the progress of AAAs. It is well known that high WSS can promote endothelial injury, 25 whereas low WSS is characterized by inflammatory infiltration. 26 It has been reported that intracranial aneurysm rupture was correlated with high peak WSS. 27 The differences in the AAAs rupture mechanisms of various sizes need to be further explored.
The clinical significance of these results lies in generating hypotheses for future research. They suggest that a more comprehensive risk assessment model for small AAAs, incorporating morphological indicators like saccular shape in addition to diameter, could be explored. For instance, future prospective studies could investigate whether small aneurysms with such “higher-risk” features would benefit from more intensive surveillance or earlier intervention. If saccular shape is still identified as a risk factor for rapid aneurysm growth and rupture in larger trials, then reflects the findings of this study, which suggest that aneurysm diameter may contribute less to the risk of rupture than aneurysm morphology in small AAAs. Our study raises the possibility that identification of morphology could prove to be a valuable adjunct to routine surveillance. It suggests that a saccular small aneurysm might be associated with higher risk, even when its diameter is within the conventional safe range. Whether such aneurysms, particularly those with evidence of low-flow regions, would benefit from closer surveillance is a question that warrants further investigation. In addition, our stratified analysis of the diameter found that small AAAs with a diameter <40 mm, saccular shape and peak WSS could also effectively evaluate the rupture risk. However, for AAAs with a diameter of 40 to 55 mm, no statistically significant factors were found. Modern imaging techniques and CFD allow patient-specific analysis; while not yet routine in practice, in the future a “hemodynamic risk map” of an AAA might be generated to identify vulnerable regions.
The current study has several limitations. First, the small sample size, with only 20 rupture events, imposes significant limitations on our statistical analysis. Although we performed multivariable logistic regression to adjust for potential confounders, the number of events is below the generally recommended threshold (typically 10 events per predictor variable) to ensure model stability and minimize the risk of overfitting. 28 Consequently, our multivariable model may be unstable, and the estimated odds ratio for saccular morphology, with its wide CI, likely reflects this imprecision. There is a genuine possibility that the model overestimates the true effect size or that other clinically important risk factors were not identified due to insufficient statistical power. Therefore, our multivariable findings should be regarded as preliminary and hypothesis-generating, rather than definitive estimates of rupture risk. Future studies with larger, multicenter cohorts are essential to validate these findings and to develop more robust predictive models. Second, although age and sex 1:1 matching were performed, selection bias still cannot be eliminated. Thus, the future study need to be conducted by “1:M propensity score matching comparison” or prospective cohort. Third, the model in this study made an idealized assumption regarding ILT, modeling it as a smooth surface and omitting its potential biomechanical properties. Consequently, the results may not be fully applicable to patients with irregular, thick, or biomechanically active ILT. To explore the potential influence of this simplification, we conducted a descriptive, exploratory comparison of blood flow patterns in 2 representative patients, with and without ILT segmentation. In these 2 specific instances, the flow patterns were qualitatively consistent; however, this observation is purely descriptive and based on a very limited sample. It cannot be interpreted as a validation of the model’s applicability to the broader population with regular or thin ILT. The impact of ILT on hemodynamics and wall mechanics remains a complex issue that warrants dedicated, large-scale investigation in future studies. Finally, several limitations inherent to the CFD methodology should be acknowledged regarding numerical reproducibility. Although we performed standard mesh and time-step independence tests to ensure that our solutions were stable and consistent across different discretizations, this study did not include a formal assessment of numerical uncertainty, such as a systematic quantification of how variations in input parameters (eg, boundary conditions, viscosity model assumptions, or segmentation variability) might propagate through the simulations and affect the outputs. Therefore, the reported hemodynamic parameters (eg, WSS and pressure drop) should be interpreted as qualitative indicators of hemodynamic patterns and trends rather than as exact quantitative predictors. The reproducibility of these findings across different solvers or different observers remains to be validated. Future studies should aim to incorporate more rigorous uncertainty quantification (UQ) frameworks and multiobserver segmentation analyses to enhance the robustness and generalizability of patient-specific CFD results.
Conclusion
Our findings underscore the predictive value of morphology and hemodynamics in the rupture risk of small AAAs. Saccular morphology emerged as the sole indicator of rupture propensity of small AAAs. Abdominal aortic aneurysms rupture consistently occurred in regions of low WSS and flow velocity, suggesting that low-flow conditions promote focal wall weakening. Identification of the saccular small AAAs with high overall peak WSS and localized low-flow loading, even if the maximal diameter is within the conventional safe range, is an important supplement to the prediction of AAAs rupture.
Footnotes
Funding
The authors received no financial support for the research, authorship, and/or publication of this article.
Declaration of Conflicting Interests
The authors declared no potential conflicts of interest with respect to the research, authorship, and/or publication of this article.
Supplemental Material
Supplemental material for this article is available online.
References
Supplementary Material
Please find the following supplemental material available below.
For Open Access articles published under a Creative Commons License, all supplemental material carries the same license as the article it is associated with.
For non-Open Access articles published, all supplemental material carries a non-exclusive license, and permission requests for re-use of supplemental material or any part of supplemental material shall be sent directly to the copyright owner as specified in the copyright notice associated with the article.