






Abstract
Aim:
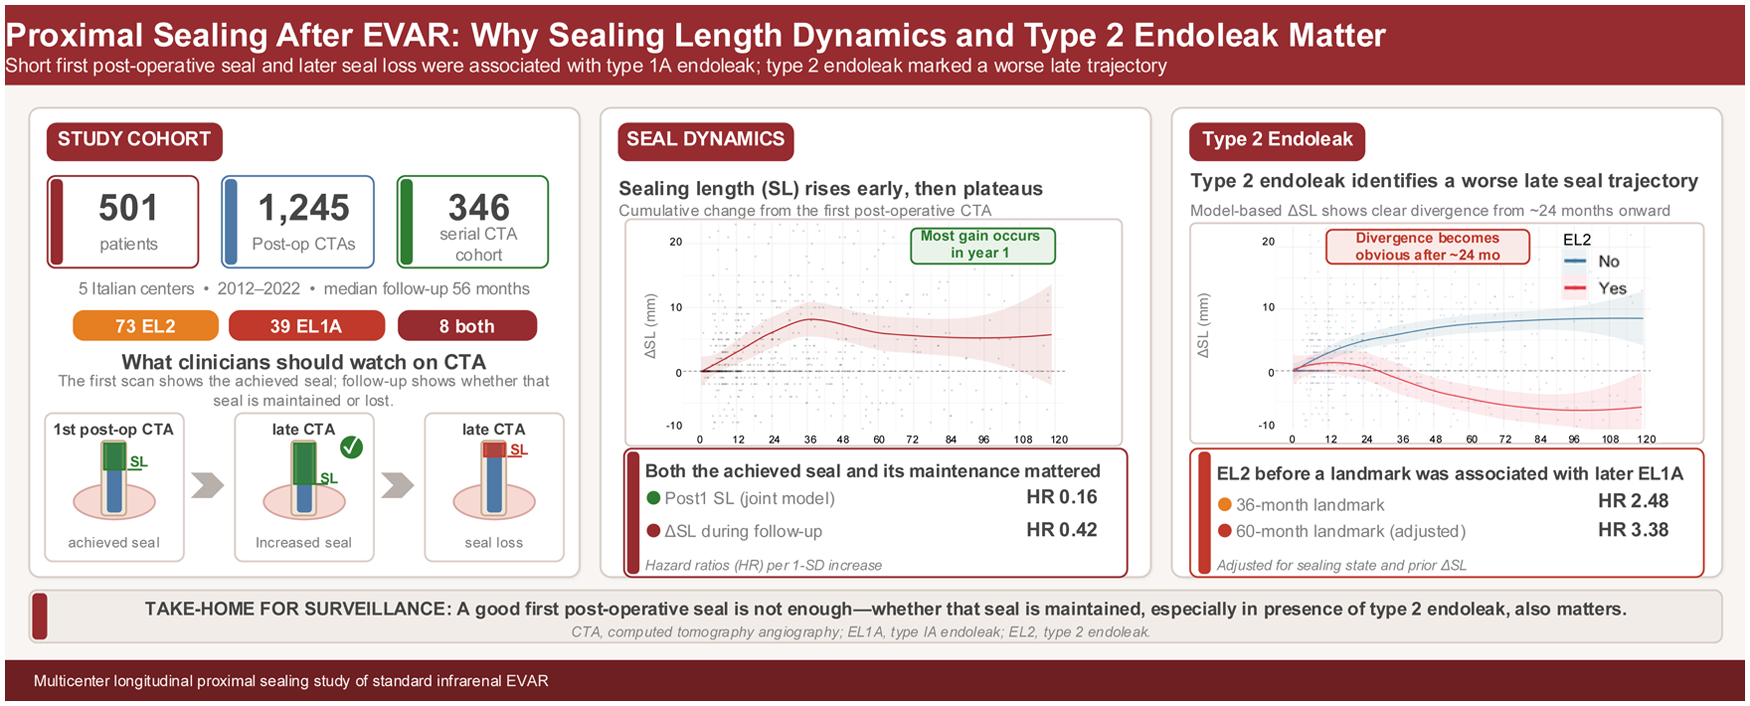
To determine whether achieved sealing length (SL) at the first postoperative computed tomography angiography (CTA) and its subsequent change over time are associated with later endoleak type 1A (EL1A) after infrarenal endovascular aortic repair. Secondary aims were to describe longitudinal remodeling of SL and to assess the association between persistent type 2 endoleak (EL2) and SL trajectories.
Methods:
This retrospective study analyzed SL and sealing surface measured on postoperative CTA, using the first postoperative CTA as the reference examination. We examined whether the first postoperative seal, its subsequent change over time, and prior persistent EL2 were associated with later EL1A. Trajectories of ΔSL and Δsealing surface were modeled using spline mixed-effects models. Time to EL1A was analyzed using Cox models with predictors at the first CTA and pre-event change, including a joint baseline-plus-change model. Landmark analyses were used to assess sealing behavior and EL1A risk. Type 2 endoleak was treated as a time-varying exposure, and its association with subsequent EL1A was evaluated using landmark Cox analyses at 12, 24, 36, and 60 months.
Results:
Among 501 patients, 346 were included in the longitudinal cohort; after a median follow-up time of 56 months (interquartile range, 28–95 months), 73 developed EL2, 39 developed EL1A, and 8 experienced both events. Baseline sealing at the first postoperative CTA and sealing deterioration were independently associated with EL1A in joint models (SL and sealing surface). Type 2 endoleak was associated with differential SL remodeling (interaction P < .001), with progressive divergence after ~24 months. In exploratory landmark analyses, EL2 was associated with higher subsequent EL1A hazard (36-month hazard ratio [HR] = 2.48; P = .030; 60-month HR = 3.14; P = .008), persisting after adjustment for sealing state and change up to the landmark.
Conclusions:
Both the first postoperative infrarenal seal and its variation during follow-up were associated with later EL1A. Persistent EL2 was associated with sealing deterioration, whereas its association with subsequent EL1A should be considered exploratory because few patients experienced both events.
Clinical Impact
In infrarenal endovascular aneurysm repair, both the sealing length achieved at the first postoperative computed tomography angiography and its longitudinal change were associated with later type 1A endoleak (EL1A). Persistent type 2 endoleak was associated with less favorable sealing evolution and may identify patients with reduced seal stability and exploratory higher subsequent EL1A risk.
Introduction
Endovascular aneurysm repair (EVAR) has become the predominant treatment for infrarenal abdominal aortic aneurysm (AAA),1-3 offering lower peri-operative morbidity than open repair4,5 but with persistent long-term failure modes requiring surveillance and secondary interventions6,7 reported in up to ~50% of patients at 10 years.7,8 Contemporary guidelines emphasize the need for structured follow-up to detect endoleaks, 2 sac enlargement, migration, and seal-related complications, and recent studies acknowledge the ongoing debate on risk-stratified surveillance strategies after EVAR.9,10 Loss of proximal sealing leading to type 1A endoleak (EL1A) is a particularly relevant late failure mechanism because it re-pressurizes the sac and increases rupture risk. 11
The post-EVAR proximal sealing zone (PSZ) includes the functional stent-graft-aortic-wall interface 12 using geometric models.13,14 However, the PSZ might not be static: the aortic neck and sealing interface remodel under device-aortic interaction and progressive degenerative disease.15-17 This may explain late failures despite apparently adequate early sealing and motivates measurement of proximal seal changes rather than relying on a single measurement.18,19
Type 2 endoleak (EL2) is the most frequent endoleak after EVAR and ranges from benign, self-limited findings to persistent leaks with sac growth.20,21 Its potential interaction with proximal sealing mechanics remains insufficiently characterized.
This study examines how proximal seal changes after infrarenal EVAR. Specifically, we assessed whether the first postoperative proximal seal and its subsequent evolution were associated with later EL1A, and whether persistent EL2 identified patients with later seal deterioration.
Methods
Study Design
This retrospective multicenter study included consecutive patients with fusiform infrarenal AAA undergoing elective or urgent EVAR between November 2012 and November 2022 in 5 centers, irrespective of device-specific instructions for use.
All procedures were performed according to contemporary guideline-based indications.3,4 Inclusion criteria were infrarenal, fusiform AAA endovascular repair. Exclusion criteria included non-degenerative pathology (penetrating ulcers/dissections), saccular aneurysms, EVAR requiring adjunctive proximal/distal procedures (EndoAnchors, chimney, fenestrated/branched), and unavailable imaging follow-up.
Demographics, clinical, anatomical, and peri-procedural data were systematically collected. Endoleak definitions and outcome reporting conformed to reporting standards. 22 All patients provided written consent for anonymous data collection. Ethical approval was obtained by the local ethical committee. Reporting adhered to Strengthening the Reporting of Observational Studies in Epidemiology (STROBE) guidelines. 23
Follow-Up Algorithms and Study Outcomes
Postoperative surveillance included routine computed tomography angiography (CTA) within 1 month (baseline) and at 1 year after EVAR. Thereafter, follow-up imaging was center driven according to local protocols and standard clinical practice. In all centers, surveillance relied on scheduled clinical assessment with duplex ultrasonography and/or CTA at least annually.
Primary outcome was the occurrence of EL1A after EVAR. The primary objective was to assess whether proximal sealing length (SL) at the first postoperative CTA and its longitudinal change during follow-up were associated with subsequent EL1A. Secondary objectives were to (1) characterize longitudinal post-EVAR changes in SL, sealing surface, and other geometric descriptors and (2) evaluate the association between EL2 and PSZ remodeling.
Endoleak detection and all quantitative sealing measurements were based on CTA. Duplex ultrasound examinations, when performed as part of local surveillance, were not used to diagnose events or to derive SL, sealing surface, or other sealing metrics.
The study was designed to address 3 questions: How did proximal sealing change after EVAR? Did the first postoperative seal and later seal loss relate to subsequent EL1A? and Did persistent EL2 identify a subgroup with less favorable sealing trajectories?
Variable Definition and Measurements
Measurements were derived from axial CTA reconstructions on planes orthogonal to the aortic centerline. An overview of the measurement protocol is provided in Figure 1. On pre-operative CTA, cross-sectional area (mm2) was sampled at (1) the infrarenal reference plane just caudal to the lowest renal artery (or planned spared accessory or polar artery) and (2) the most distal guideline neck plane as defined by current guidelines (10% diameter increase compared with the infrarenal level); the centerline distance (mm) between the infrarenal and distal neck planes was recorded.
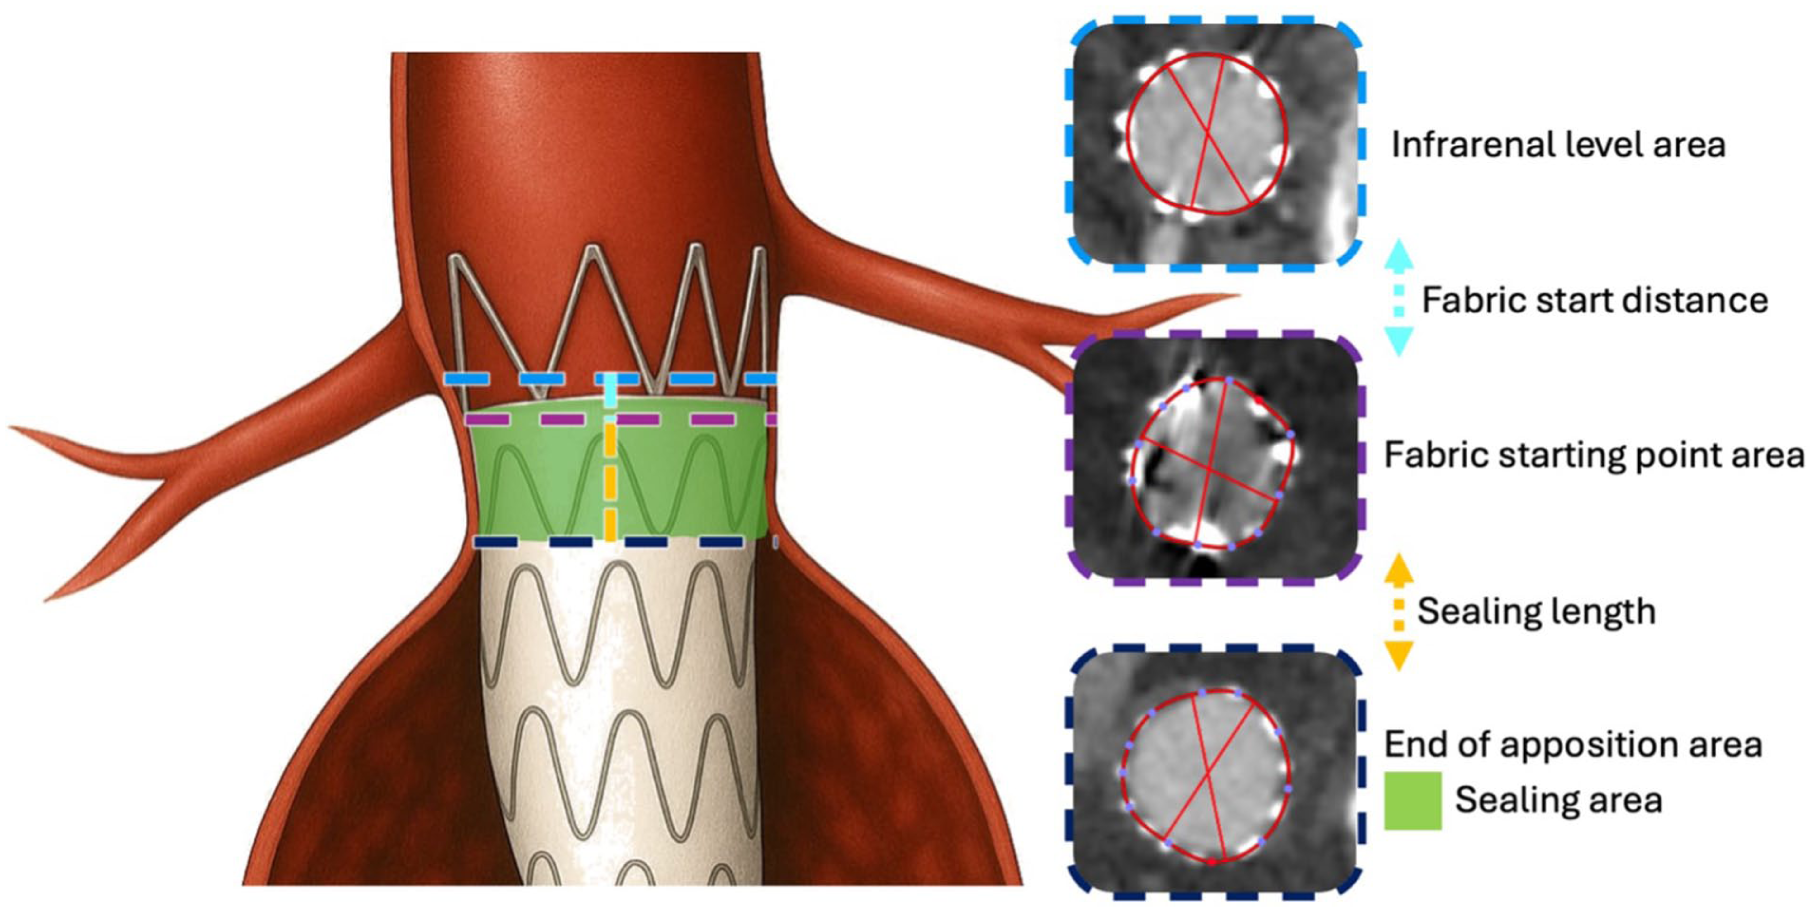
Measurements overview.
On postoperative CTA, areas (mm2) were sampled at (1) the infrarenal, (2) proximal fabric edge of the main body (“fabric start”), and (3) the most distal plane of complete apposition according to expert definition 12 with corresponding centerline distances from the infrarenal plane.
Sealing length was defined as the centerline distance in millimeters between the fabric start and the most distal point of circumferential apposition.
Sealing surface was estimated by modeling the apposed segment as a truncated cone defined by the proximal and distal cross-sectional areas and the centerline height between those planes.
The infrarenal cross-sectional area (mm2) and the centerline distance between the infrarenal level and the fabric starting point (mm) were also recorded to assess neck dilatation and device migration.
Sealing deterioration was defined a priori as net loss of the sealing metric from the first postoperative CTA to the last pre-event or pre-censoring CTA: ΔSL <−1 mm for SL and Δsealing surface <−50 mm2 for sealing surface. Patients not meeting these loss thresholds were categorized as stable or gain according to the same pre-specified margins (SL: −1 to +1 mm stable, >+1 mm gain; sealing surface: −50 to +50 mm2 stable, >+50 mm2 gain).
Measurements were performed by 2 physicians, who did not operate on the patients, who specialized highly in using OsiriX 13 (Pixmeo SARL, Bernex, Switzerland) software. The evaluators followed a standardized and predefined protocol for assessing CTAs based on precisely defined criteria and were unaware of the study-specific assumptions during the evaluation process. The measurement protocol, already described previously,13,14 was performed on all patients on all postoperative CTAs. Interobserver reliability was evaluated using a subset of 60 randomly selected CTAs and tested with the intraclass correlation coefficient (ICC) method.
Statistical Analysis
Normality was assessed with the Kolmogorov-Smirnov test. Normally distributed variables are reported as mean ± standard deviation (SD) and were compared using the Student t test. Skewed variables are reported as median (interquartile range [IQR]) and were compared using the Mann-Whitney U test.
Longitudinal Analysis of Sealing Zone
Longitudinal trajectories of sealing metrics were analyzed using linear mixed-effects models with patient-specific random intercepts and natural cubic splines for time since EVAR. Evidence for differential evolution was assessed using likelihood-ratio tests comparing models with and without a time × exposure interaction. Non-linearity of longitudinal evolution was addressed using natural cubic splines for time and, for clinically interpretable summaries, piecewise linear specifications with knots at 1, 2, and 3 years within mixed-effects models including patient-level random effects. Cumulative change from baseline post-EVAR CTAs was summarized within annual windows (±6 months) as median (IQR) Δ metric. For clinically interpretable summaries, deltas were additionally evaluated at pre-specified annual landmarks of 12, 24, 36, and 60 months, using the last available measurement at or before each post-EVAR landmark. The association between maximum sac diameter change and ΔSL was assessed using patient-level Spearman correlation and linear regression, including an EL2-adjusted model.
For descriptive visualization, scatterplots of cumulative change from the first postoperative CTA were displayed with locally estimated scatterplot smoothing (LOESS) curves and 95% confidence bands.
EL1A and Sealing-Zone Morphology/Dynamics
EL1A was modeled using Cox proportional hazards models with time defined from EVAR to EL1A or censoring. Primary predictors were SL and sealing surface at the first postoperative CTA and their pre-event change (Δpre-event), defined as the difference between the first postoperative CTA and the last available measurement before EL1A or censoring.
Models were fitted for baseline alone, delta alone, and baseline plus delta. Collinearity between baseline SL and ΔSL pre-event was assessed before joint modeling and was minimal (Pearson’s r = −0.14; variance inflation factor ≈ 1), supporting their simultaneous inclusion in the model. To enhance clinical interpretability, Δpre-event was also categorized as gain, stable, or loss using pre-specified thresholds (length-based ± 1 mm; surface-based ± 50 mm2) and analyzed using regression models and contingency summaries. Proportional hazards assumptions were assessed using Schoenfeld residuals; non-linearity of baseline predictors in Cox models was assessed by comparing linear versus spline specifications (natural splines, 3 degrees of freedom) using likelihood-ratio testing. Exploratory sensitivity analyses were performed by adding device-derived fixation architecture (suprarenal/dual vs infrarenal/no suprarenal bare-stent fixation) and approximate graft oversizing to the main Cox model.
EL2 and Sealing-Zone Dynamics
Persistent EL2 was defined as an endoleak visible on at least 2 consecutive imaging studies. EL2 was treated as a time-varying exposure, and EL2 status was assumed to persist between imaging time points until the next available assessment. Its association with longitudinal sealing behavior was evaluated using spline-based mixed-effects models of delta (Δ)SL and Δ sealing surface including a time × EL2 interaction. To enhance interpretability, scatterplots and time point-specific comparisons and landmark delta summaries were computed at pre-specified landmarks using the last measurement at or before each landmark, restricting to EL1A-free patients at the landmark. False-discovery-rate adjustment within this family of tests was performed.
To assess the association between EL2 and subsequent EL1A avoiding immortal-time bias, landmark Cox analyses were performed at pre-specified time points, restricting EL1A-free patients at each landmark and modeling EL1A occurring after the landmark as a function of EL2 status before that landmark, with additional adjustment for sealing state and change up to the landmark.
A two-sided P < .05 was considered statistically significant for all tests. All analyses were performed using JASP 0.95.4 (JASP Team, Amsterdam, The Netherlands) software and R 4.3 (R Foundation for Statistical Computing, Vienna, Austria).
Results
Study Cohort and Imaging Availability
The study included 501 patients. Baseline demographic, model of stent graft used, clinical, and anatomical characteristics of the study population are reported in Supplemental Tables S1 and S2, respectively. Exploratory comparison of patients included versus not included in the repeated-imaging cohort showed broadly comparable baseline and anatomical characteristics. After false-discovery-rate correction, the only significant baseline difference was dyslipidemia prevalence; fixation architecture and anatomical variables did not differ significantly. Overall, 1245 postoperative CTAs were analyzed. Longitudinal assessment required 2 or more postoperative CTAs per patient and included 346 patients with a median of 3 postoperative CTAs per patient (IQR = 2–4; range = 2–8). Within ±6-month annual windows, 243 patients contributed imaging at 12 months, 135 at 24 months, 97 at 36 months, 61 at 60 months, and 24 at 120 months. Median follow-up time was 56 months (IQR = 28–95 months).
Interobserver Variability
Interobserver reproducibility was excellent for all sealing-zone measurements, with ICC(2,1) ranging from 0.969 to 1.000 (95% confidence interval [CI] 0.867–1.000), mean bias between −0.61 and +3.65 mm2 for area-based metrics and ≤0.15 mm for length-based measurements, and Bland-Altman limits of agreement within ±2 mm for distances and within ±33 mm2 for cross-sectional areas.
Longitudinal Evolution of Proximal Sealing-Zone Metrics
Sealing length and sealing surface exhibited a nonlinear evolution (both P < .001). All measures showed changes over time. Segment-specific changes derived from piecewise mixed-effects models are reported in Table 1.
Values are Patient-Specific Segment Variations Summarized as Median (25th–75th Percentile), Estimated From Linear Mixed-Effects Models With a Piecewise Linear-Time Specification and Patient-Specific Random Slopes for Time.
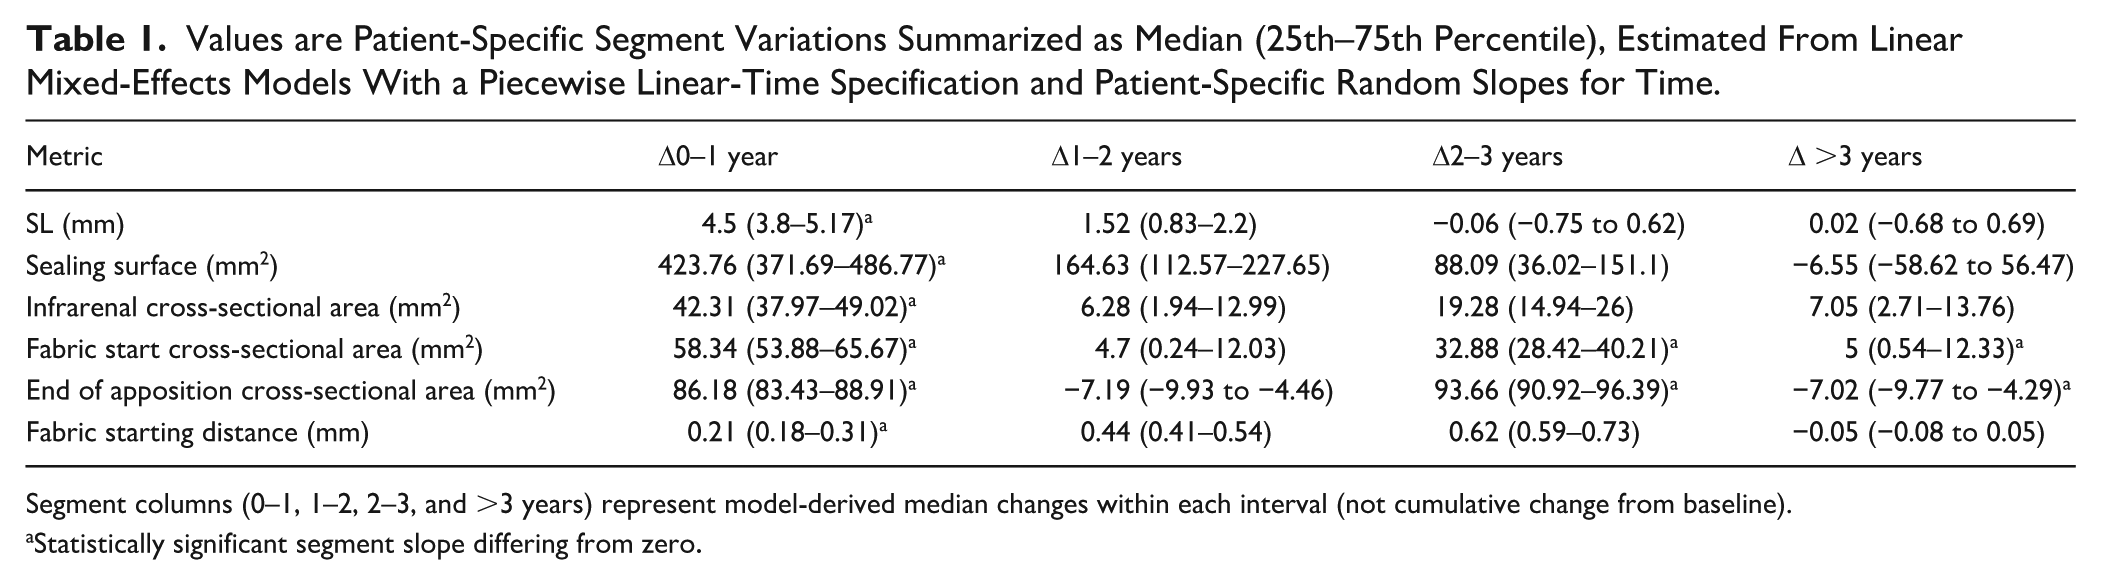
Segment columns (0–1, 1–2, 2–3, and >3 years) represent model-derived median changes within each interval (not cumulative change from baseline).
Statistically significant segment slope differing from zero.
For SL, the highest rate of change occurred within the first postoperative year (4.5 mm [IQR = 3.8–5.17 mm]; P < .001), followed by markedly attenuated slopes thereafter, which were not statistically distinguishable from zero beyond year 2. Sealing surface demonstrated a similar early-dominant pattern, with substantial expansion during the first year (423.8 mm2/year [IQR = 371.7–486.8 mm2/year]; P < .001) and progressively smaller, non-significant rates beyond 3 years.
Infrarenal and fabric start cross-sectional areas also exhibited significant early increases, although reduced evolution was observed in later intervals for selected metrics. In contrast, changes in fabric starting distance were not consistently different from zero across segments.
Longitudinal evolution of sealing-zone metrics is reported in Figure 2.
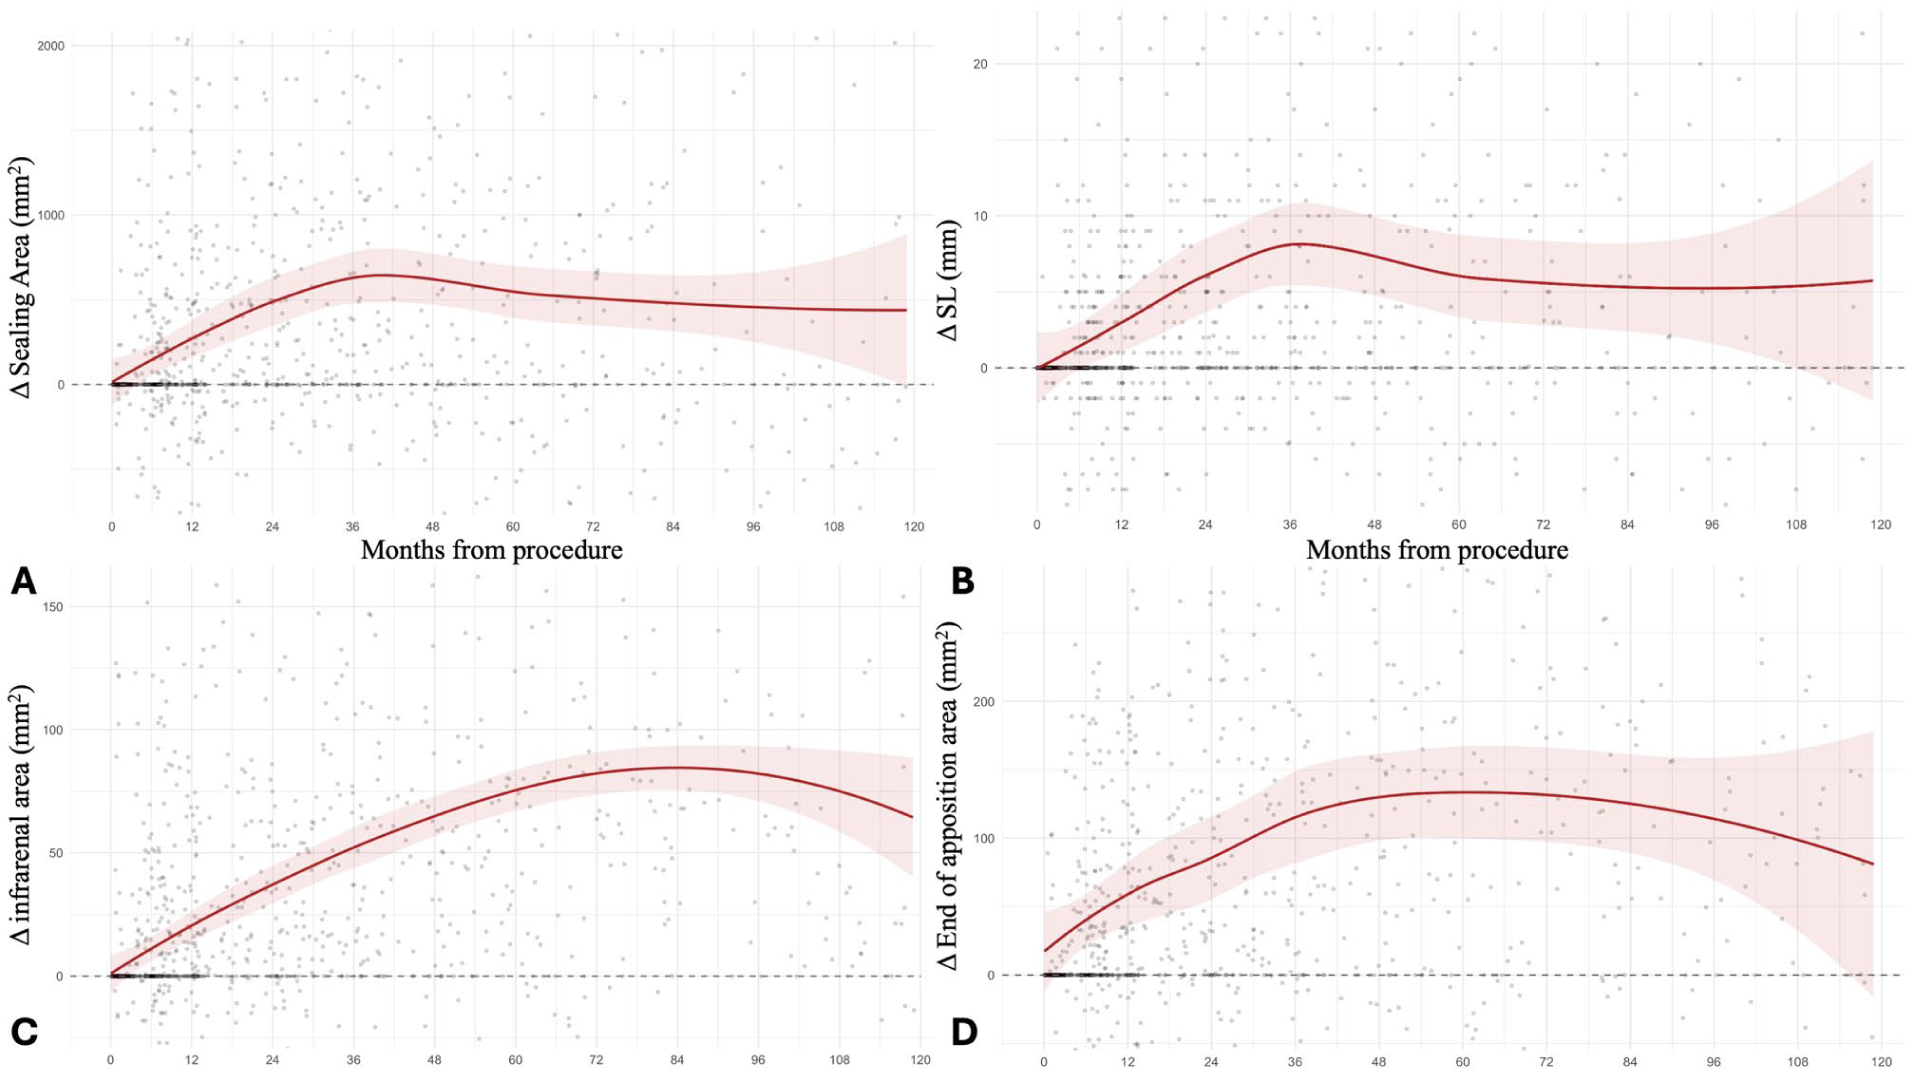
Longitudinal evolution of sealing metrics. Longitudinal changes in sealing surface area (panel A), sealing length (panel B), infrarenal area (panel C), and end of apposition (panel D). Scatterplots display all available postoperative observations, with locally weighted regression (locally estimated scatterplot smoothing [LOESS]) curves and 95% confidence bands illustrating population-level trends over time.
First Postoperative Sealing, Seal Change, and EL1A
Among the whole cohort, 39 EL1A were reported. Baseline sealing at the first postoperative CTA was strongly associated with subsequent EL1A development. In univariable Cox models, increased SL and sealing surface were both protective (Table 2).
Association of First Postoperative Sealing Metrics and Pre-Event Change With EL1A.
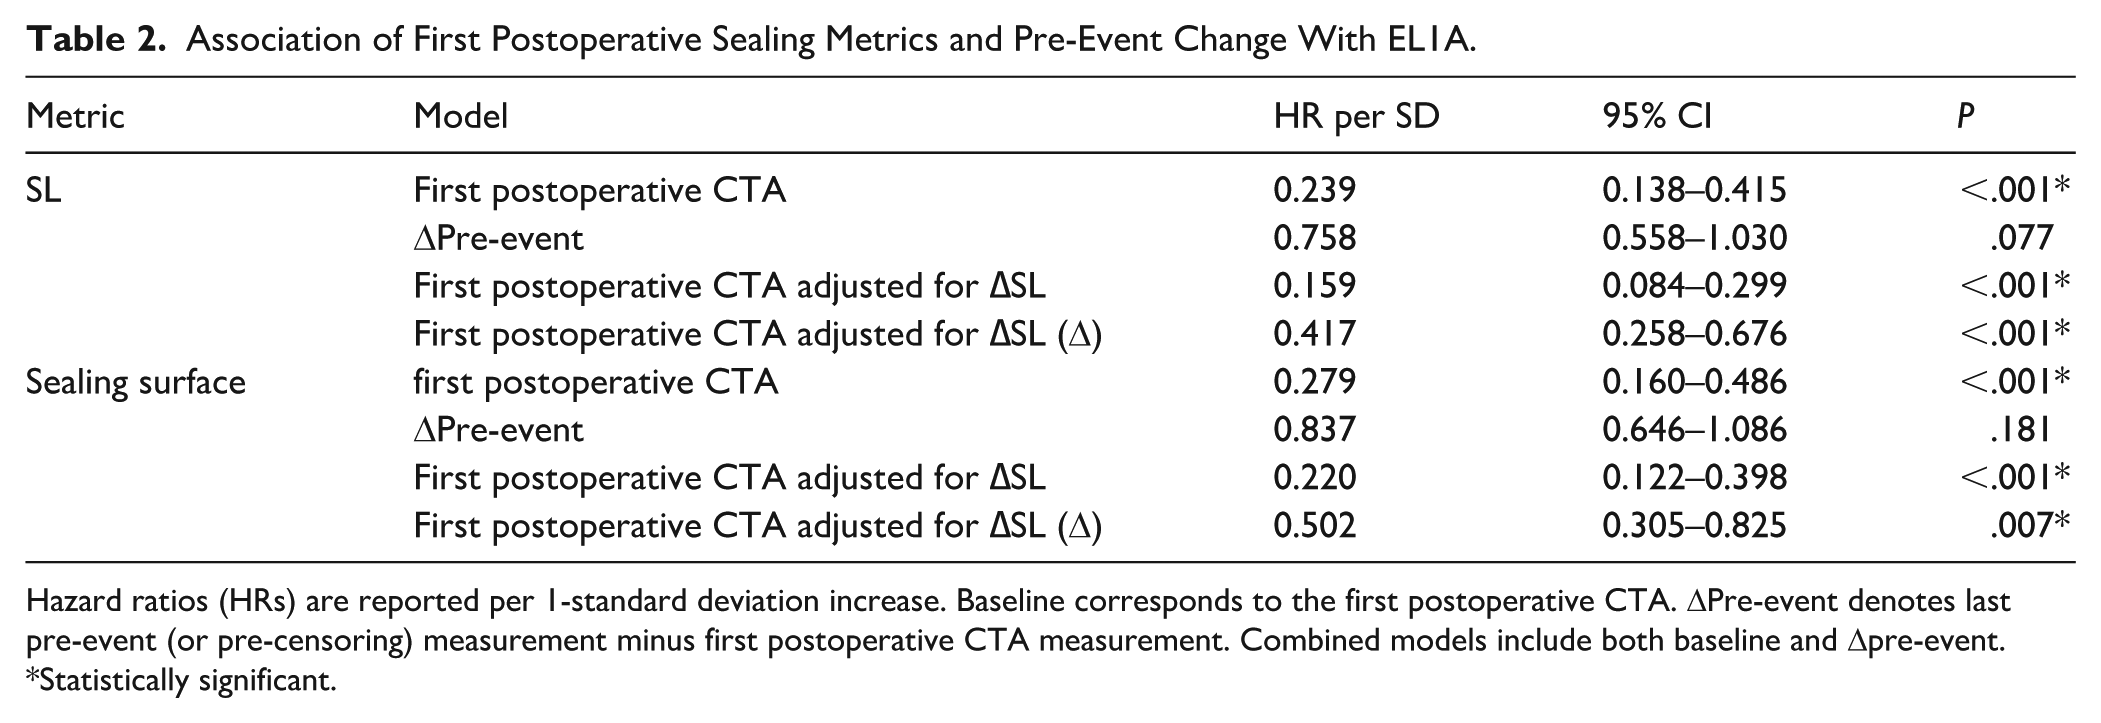
Hazard ratios (HRs) are reported per 1-standard deviation increase. Baseline corresponds to the first postoperative CTA. ΔPre-event denotes last pre-event (or pre-censoring) measurement minus first postoperative CTA measurement. Combined models include both baseline and Δpre-event.
Statistically significant.
ΔPre-event alone showed weaker association but provided independent incremental information when modeled jointly with baseline. In combined Cox models including both baseline and Δpre-event, longitudinal sealing deterioration remained independently associated with EL1A. In categorical analysis, patients exhibiting sealing loss had substantially higher EL1A risk compared with those demonstrating sealing gain (SL loss vs gain: HR = 2.90; 95% CI 1.29–6.51; P = .010; sealing surface loss vs gain: HR = 2.32; 95% CI 1.05–5.12; P = .037). The association remained consistent after adjustment for device-derived fixation architecture and approximate oversizing: baseline SL, HR = 0.16, 95% CI 0.07–0.37, P < .001; ΔSL HR = 0.49, 95% CI 0.26–0.92, P = .025; fixation architecture P = .188; oversizing P = .121. Detailed sensitivity analyses are reported in Supplemental Table S3.
Corresponding contingency analyses showed EL1A proportions of 18.7% in the SL “loss” group versus 5.45% in “gain/stable” groups (P < .001), consistent with impaired retention of sealing preceding failure.
Sealing surface and SL evolution according to EL1A occurrence are reported in Figure 3.
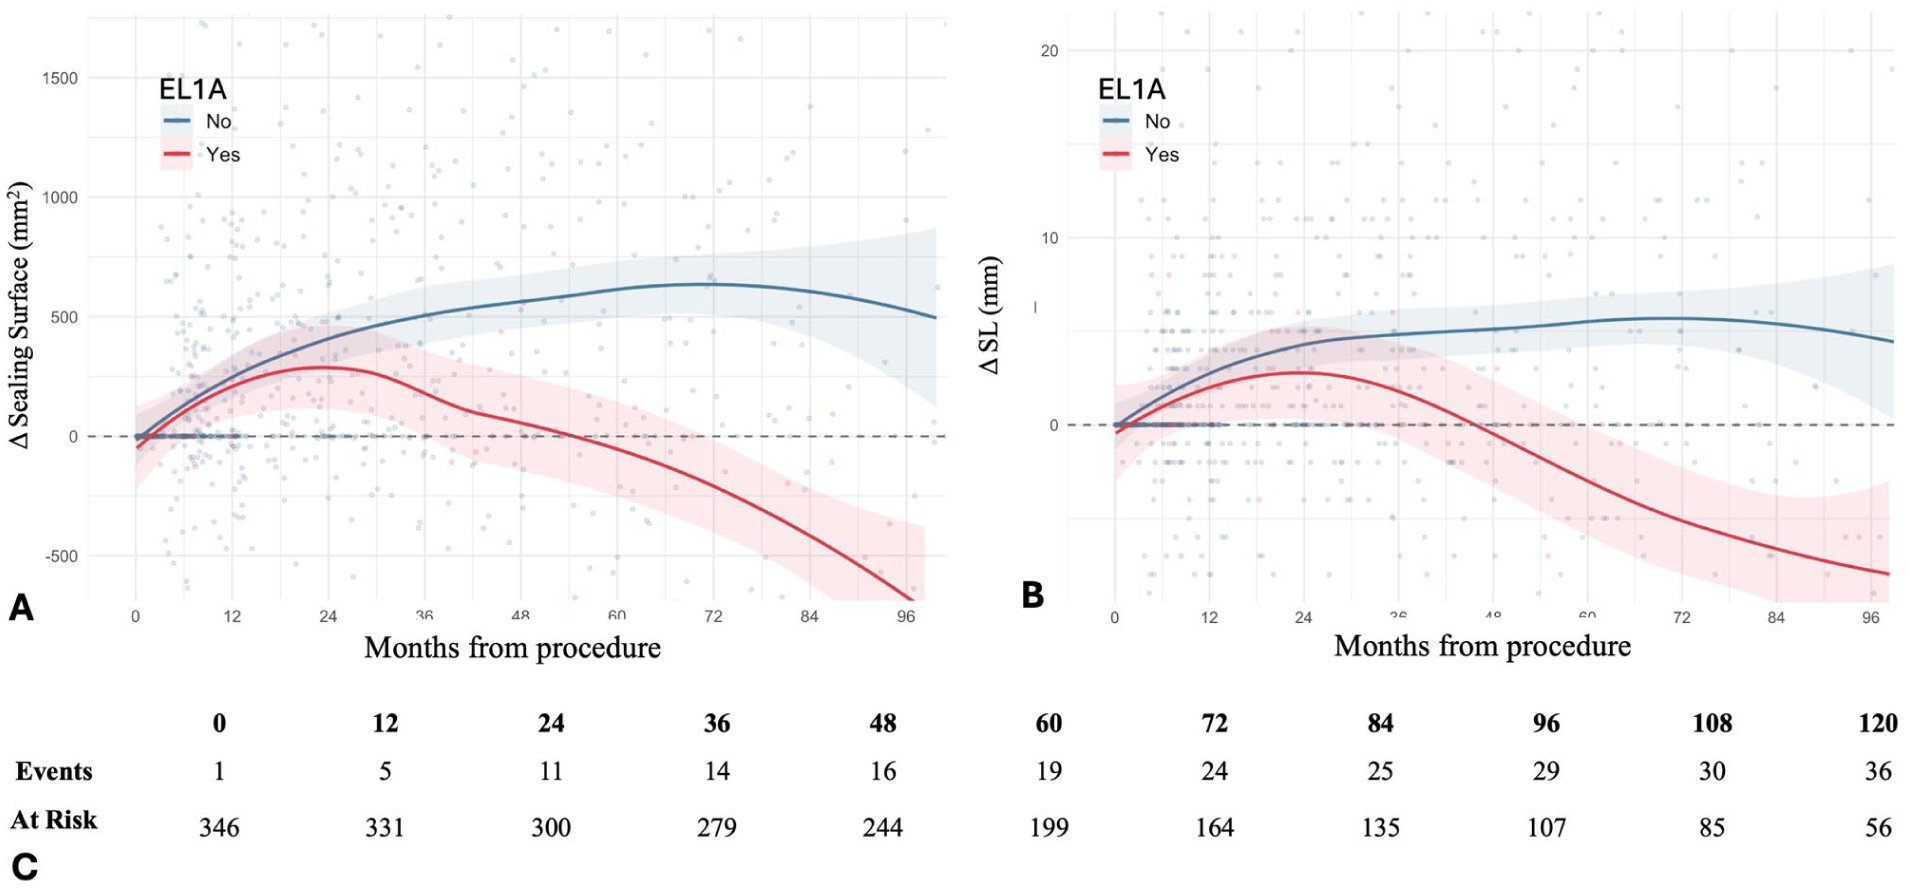
Longitudinal sealing-zone evolution in patients with and without EL1A. Longitudinal evolution of sealing surface area (Δsealing surface, panel A) and sealing length difference (ΔSL, panel B) compared to baseline and stratified by the occurrence of type 1A endoleak (EL1A). Scatterplots include all postoperative observations obtained prior to the event in patients who developed EL1A and all available observations in patients without EL1A. Locally estimated scatterplot smoothing (LOESS) curves with 95% confidence bands depict average trajectories over time. Panel C reports the number of patients at risk and the cumulative number of EL1A events at each 12-month interval.
EL2 and Longitudinal Sealing Behavior
In the whole cohort, 73 patients developed EL2; 8 of these patients later also developed EL1A. Longitudinal sealing trajectories differed according to persistent EL2 status. In spline-based mixed-effects models of variation from the first postoperative CTA, patients with EL2 showed differential evolution (P < .001 for both SL and sealing surface); landmark differences are reported in Table 3, and SL and sealing surface trajectories are shown in Figure 4.
SL and Sealing Surface Variations at Pre-Specified Landmarks (Spline Mixed-Effects Models).
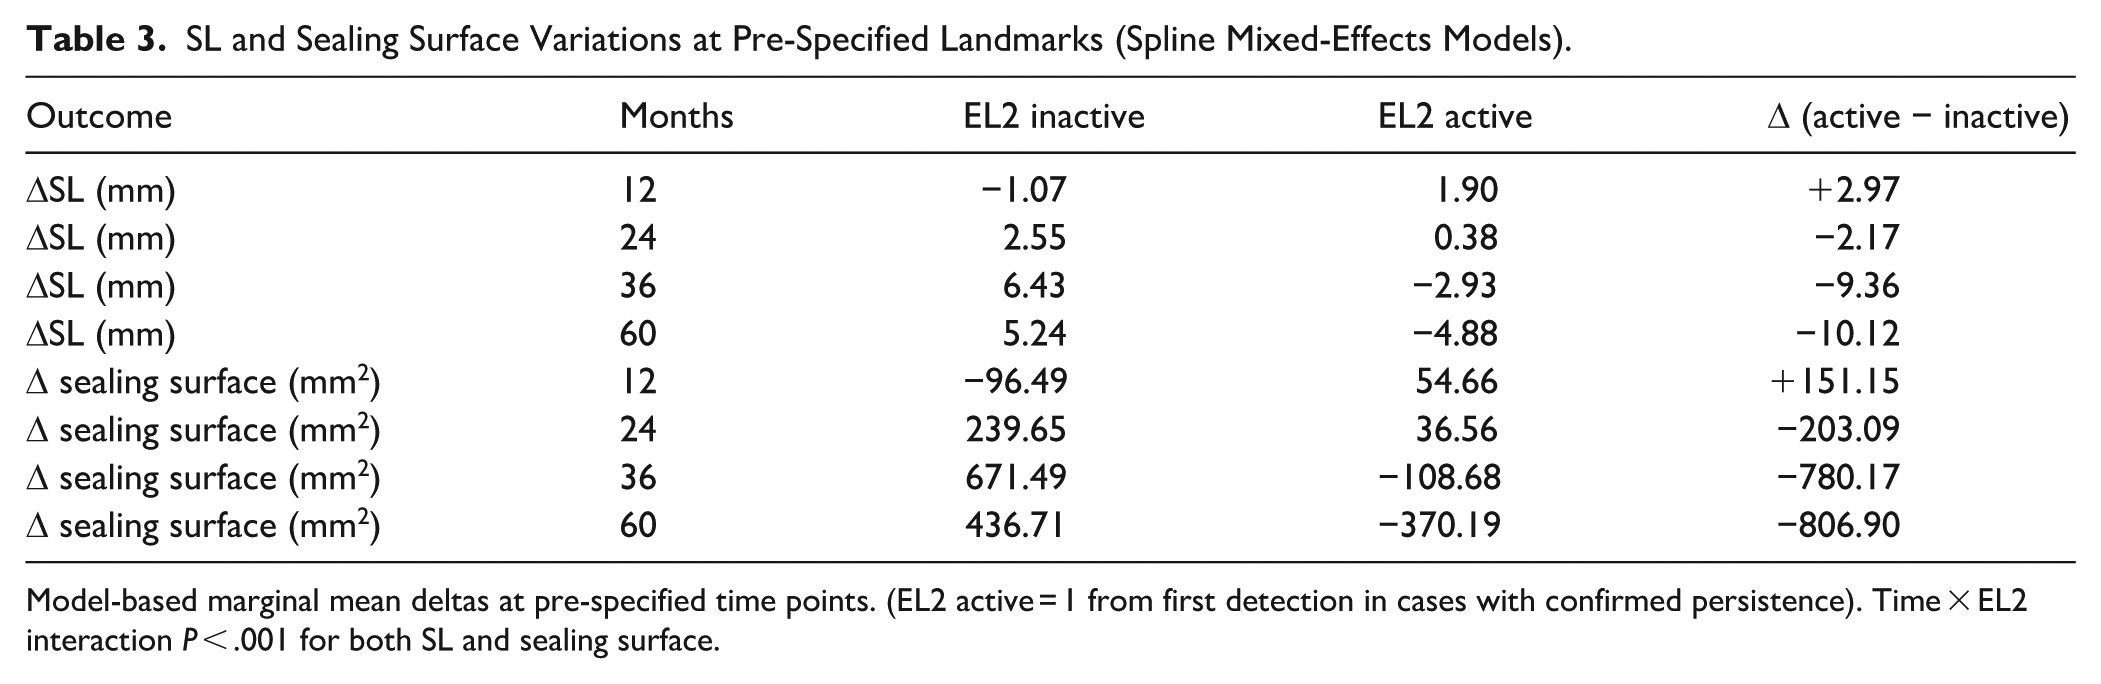
Model-based marginal mean deltas at pre-specified time points. (EL2 active = 1 from first detection in cases with confirmed persistence). Time × EL2 interaction P < .001 for both SL and sealing surface.
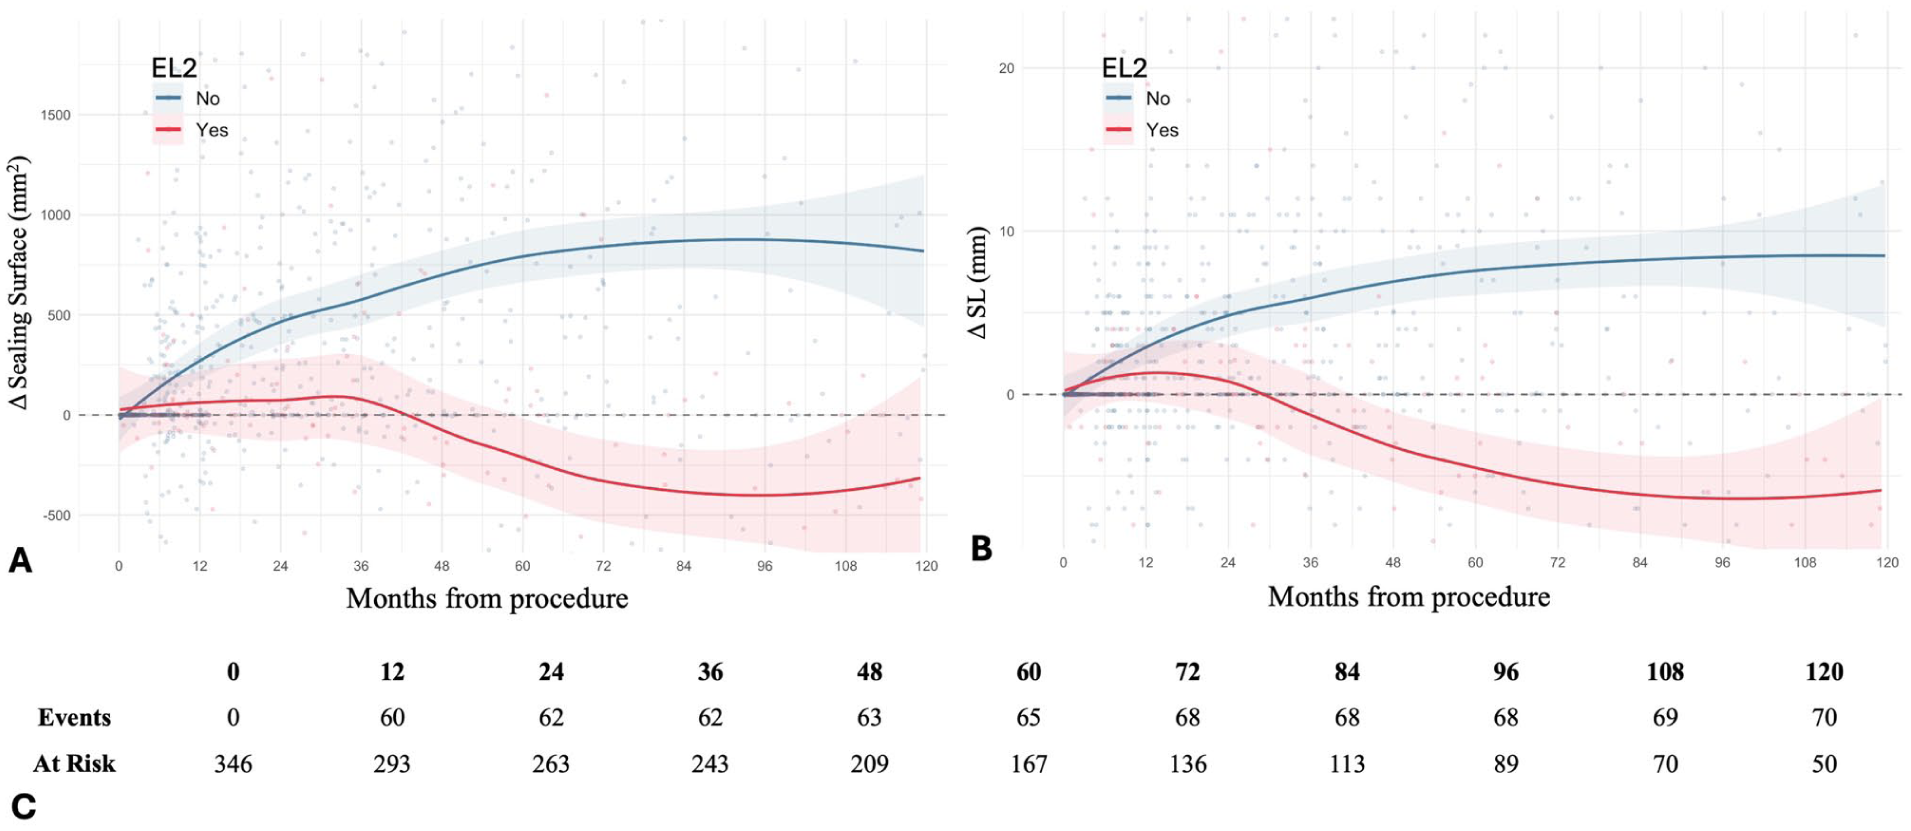
Longitudinal sealing-zone evolution according to type 2 endoleak (EL2). Longitudinal changes in sealing surface area (Δsealing surface, panel A) and sealing length difference (ΔSL, panel B) compared with baseline according to the occurrence of EL2. Smoothed LOESS curves with 95% confidence bands illustrate average temporal trends. Panel C displays the number of patients at risk and cumulative EL2 events at each 12-month interval. Given the reduced number of patients contributing data at the 60-month landmark, the 60-month SL and sealing-surface differences should be interpreted as exploratory.
At pre-specified landmarks, between-group differences were modest early and became evident from 24 months onward, when patients with EL2 before the landmark showed less favorable SL and sealing-surface changes than patients without EL2, with the largest separation at 60 months (both q < .01 after false-discovery-rate correction). Change in maximum sac diameter was modestly inversely correlated with ΔSL (Spearman’s rho = −0.276; n = 297; P < .001). In linear regression, each 5-mm increase in sac diameter was associated with 1.64 mm lower ΔSL (95% CI −2.46 to −0.83; P < .001); this association remained significant after adjustment for EL2 status (−1.27 mm per 5 mm; 95% CI −2.07 to −0.47; P = .002).
EL2 and Subsequent EL1A risk
Landmark Cox analyses showed that EL2 occurring before the landmark was associated with increased subsequent EL1A hazard at later landmarks. At 36 months, EL2 occurring before the landmark was associated with a higher risk of subsequent EL1A (HR = 2.48; P = .030). The association strengthened at later follow-up. At 60 months, EL2 before the landmark was associated with EL1A in unadjusted models (HR = 3.14; P = .008) and remained significant after adjustment for SL at the landmark and its change up to the landmark (SL-adjusted model: HR = 3.38; 95% CI 1.24–9.23; P = .017; sealing surface-adjusted model: HR = 3.51; 95% CI 1.27–9.67; P = .015).
Discussion
In this multicenter cohort of infrarenal EVAR, proximal sealing behaved as a dynamic interface. Given the still substantial burden of post-EVAR reintervention, long-term durability remains limited even after initially uneventful repairs.24-26 Using expert-consensus apposition definitions, 12 our main findings can be summarized as:
First, sealing metrics changed over time, with the largest changes occurring within the first 2 years after EVAR. Second, both the amount of seal achieved at the first postoperative CTA and its subsequent evolution were associated with later EL1A. Third, failure to gain, or later loss of, seal identified patients at higher EL1A risk. Finally, persistent EL2 identified a subgroup with less favorable sealing trajectories and exploratory higher subsequent EL1A risk.
Sealing-Zone Remodeling: A Moving Target With Heterogeneous Trajectories
Spline mixed models demonstrated longitudinal remodeling: SL and surface increased over time, whereas infrarenal and fabric-start areas enlarged, consistent with existing literature 27
The early increase in SL and sealing surface likely reflects a combined effect of device expansion/conformability and remodeling of the neck-graft interface rather than a purely biological or purely device-related phenomenon. Because no device-specific or material-specific comparison was performed, this study cannot disentangle these mechanisms. At the same time, this apparent early gain should be interpreted cautiously, because part of it may coexist with progressive proximal neck dilatation. Sandström et al 18 reported that ~40% of patients developed partial/total seal loss and that post-EVAR ruptures were preceded by loss of seal; durable cases had longer proximal seal at 1 month (~23 mm) than those later losing seal (~14–16 mm). Our data support this framework, suggesting that sealing dynamics—not a single time point—is clinically relevant.
Baseline and Longitudinal Changes in SL
The first postoperative SL and sealing surface were strongly correlated with EL1A, aligning with previous literature.28-30 Conceptually, SL captures the operative “reserve” available to buffer subsequent neck dilatation and graft micro-migration. After accounting for baseline SL, ΔSL pre-event became independently associated with EL1A. Absent SL gain or net SL loss tripled EL1A risk. Clinically, these data support a “state plus maintenance” model: initial sealing reserve matters, but durability also depends on whether that reserve is preserved over time.
EL2: Altered Seal Dynamics
Patients with persistent EL2 showed less favorable mid- and long-term sealing trajectories, with reduced SL gain and negative sealing-surface deltas. Importantly, only 8 of the 73 patients with EL2 later developed EL1A. Therefore, the present data should not be interpreted as evidence that persistent EL2 is a causal precursor of EL1A. Rather, persistent EL2 may identify patients with unfavorable sac–seal remodeling. Whether EL2 is only a marker, a contributor, or both in the development of EL1A cannot be determined from these data. The divergence in SL and sealing-surface trajectories became most evident from approximately 24 months onward and was greatest at 60 months.
In landmark Cox analyses designed to avoid immortal-time bias, EL2 present before the 36- and 60-month landmarks was associated with higher subsequent EL1A hazard even after adjusting for sealing state and change up to the landmark. Given the limited number of patients experiencing both events, these estimates should be regarded as exploratory and hypothesis-generating. Current registry evidence is consistent with this hypothesis, 31 but the present data set cannot establish a causal pathway from EL2 to proximal seal failure.
The inverse association between sac diameter change and ΔSL suggests that sac expansion may partly contribute to adverse sealing evolution; however, EL2 remained associated with lower ΔSL after accounting for sac diameter change, supporting EL2 as a marker of an unfavorable remodeling phenotype rather than a purely sac-size-mediated phenomenon.
Clinically, these findings support adding a functional SL assessment to the routine post-EVAR CTA evaluation. 10 Quantifying achieved SL provides an implementable measure of “sealing reserve” with excellent interoperator reproducibility (ICC = 0.96–0.99). Serial SL assessment can identify patients with an unstable sealing configuration and may support risk-informed surveillance. Although adjunctive fixation strategies were excluded from this cohort, recent data showing that EndoAnchors may increase realized apposition SL and sealing surface suggest that patients with poor early sealing reserve14,32 could be considered for future studies of selective seal augmentation for, rather than surveillance intensification alone.
Study Limitations
This study is limited by its retrospective multicenter design and non-standardized follow-up beyond the first postoperative year. Imaging frequency/method were center-driven and may affect detection timing. Although all EL2 ascertainment and quantitative sealing measurements in the present analysis were CTA-based, imaging was performed according to real-world center-driven follow-up schedules after the scheduled early and 1-year CTA. Therefore, under-detection of clinically silent EL2 between CTA examinations cannot be completely excluded. Longitudinal modeling required 2 or more postoperative CTAs, potentially selecting patients with closer surveillance. EL1A events were modest, limiting power for complex multivariable and predictive analyses. The cohort included heterogeneous stent graft types, with limited numbers for some devices, precluding robust device-specific analyses. Although cases were included irrespective of device-specific instructions for use (IFU), this study was not designed to compare EVAR performed within versus outside IFU, and no inference on IFU compliance can be drawn from these data. Device-specific effects, and elective versus urgent presentation were not analyzed in dedicated subgroups because event counts and data structure were not adequate for robust comparative inference. Therefore, the present data do not support recommendations regarding device platform, oversizing strategy, fixation type, or prophylactic branch-vessel embolization. Likewise, prophylactic branch-vessel embolization, source vessel of EL2, and secondary interventions for EL2 were not analyzed in a standardized fashion across centers. Finally, the EL2-to-EL1A analyses should be interpreted cautiously because only 8 patients experienced both events; therefore, these analyses are hypothesis-generating and cannot determine whether EL2 is a contributor in EL1A development.
Sealing metrics were derived from geometric modeling of centerline-based measurements and might not fully capture asymmetric apposition, focal calcification, or thrombus-related effects. In highly angulated necks, SL may not correspond to the true shortest geometric neck length, particularly when considering inner versus outer curvature. Although measure reproducibility was excellent, some degree of measurement dependency remains unavoidable.
Conclusion
In this multicenter longitudinal imaging study, proximal sealing after infrarenal EVAR appeared to be a dynamic process rather than a fixed postoperative state. Both the first postoperative seal and its subsequent evolution were associated with later EL1A.
Failure to maintain or increase SL over time independently increased EL1A risk beyond baseline sealing, supporting a state-plus-evolution paradigm of EVAR durability. Persistent EL2 was associated with less favorable sealing maintenance and an exploratory higher subsequent EL1A hazard at later follow-up landmarks. Because causal inference is limited by real-world imaging schedules and the small number of patients with both EL2 and EL1A, EL2 should be interpreted as associated with later adverse sealing evolution rather than as a deterministic cause of EL1A. From a practical perspective, serial SL assessment on centerline-based CTA may offer the most immediately transferable surveillance metric, with sealing surface serving as a complementary parameter where dedicated post-processing is available.
Supplemental Material
sj-docx-1-jet-10.1177_15266028261463466 – Supplemental material for Proximal Seal After Endovascular Aneurysm Repair: Why Sealing Length Dynamics and Type 2 Endoleak Matter
Supplemental material, sj-docx-1-jet-10.1177_15266028261463466 for Proximal Seal After Endovascular Aneurysm Repair: Why Sealing Length Dynamics and Type 2 Endoleak Matter by Giulio Accarino, Raffaele Pulli, Felice Pecoraro, Domenico Angiletta, Nabile Belouafa, Salvatore Bruno, Stefano Attolini, Francesca Noce, Mostafa El Moumni, Jean-Paul P. M. de Vries and Umberto Marcello Bracale in Journal of Endovascular Therapy
Footnotes
Authors’ Note
All authors contributed substantially to the conception and design, or acquisition of data, or analysis and interpretation of data; drafting the article or revising it critically for important intellectual content; and the final approval of the version to be published.
ORCID iDs

Funding
The authors received no financial support for the research, authorship, and/or publication of this article.
Declaration of Conflicting Interests
The authors declared no potential conflicts of interest with respect to the research, authorship, and/or publication of this article.
Supplemental Material
Supplemental material for this article is available online.
References
Supplementary Material
Please find the following supplemental material available below.
For Open Access articles published under a Creative Commons License, all supplemental material carries the same license as the article it is associated with.
For non-Open Access articles published, all supplemental material carries a non-exclusive license, and permission requests for re-use of supplemental material or any part of supplemental material shall be sent directly to the copyright owner as specified in the copyright notice associated with the article.
