
Abstract
Previous research neglects to consider additional sources of moral hazard in baseball beyond the designated hitter (DH) rule. Using a game-level analysis similar to Bradbury and Drinen (2006), the authors find that an additional National League (NL) relief pitcher leads to more hit batsmen than an additional American League (AL) relief pitcher and that the number of games remaining in the NL has a smaller positive effect on the number of hit batsmen than the number of games remaining in the AL, though the latter relationship is economically small. Both results, however, imply additional avenues by which moral hazard emerges.
Introduction
Major League Baseball (MLB) provides an exceptional natural experiment to test the theory of moral hazard. Due to the presence of the designated hitter (DH) rule 1 in the American League (AL) but not in the National League (NL), AL pitchers are insured against the costs of increasingly reckless behavior—namely, since they do not bat, AL pitchers incur lower costs of hitting opposing batters, because they cannot be retaliated against. The result is a difference in hit batsmen across leagues due to the discrepancy in playing rules.
Previous research confirms this outcome. In the first analysis of moral hazard within MLB, Goff, Shughart, and Tollison (1997) find that batters in the AL are hit at rates 10% to 15% higher than those in the NL. Bradbury and Drinen (2006, 2007) confirm the moral hazard hypothesis, and Kawaura and Croix (2007) find evidence in Japanese professional league, where a similar discrepancy in rules creates the same moral hazard scenario.
However, certain studies have called into question the existence of such an effect. Levitt (1998) shows that pitchers are hit extremely infrequently and, should retaliation be the sole motive for a pitcher being hit by pitch, pitchers received such a punishment only one of the every 50 times they hit an opposing batter. Trandel, White, and Klein (1998) and Trandel (2004) find no evidence of the moral hazard effect on pitchers. Kawaura (2010) shows that pitchers in Japanese leagues, who experienced the implementation of the DH rule in the middle of their careers did not take advantage of the increased protection from retaliation. Further, since the moral hazard argument rests on rule differences between the two leagues, the AL should consistently witness more hit batsmen by virtue of the fact that their pitchers do not bat. Figure 1 shows that while a separation in hit batsmen rates seemed to exist at the onset of the DH rule in 1973, the difference seems to have dissipated more recently.
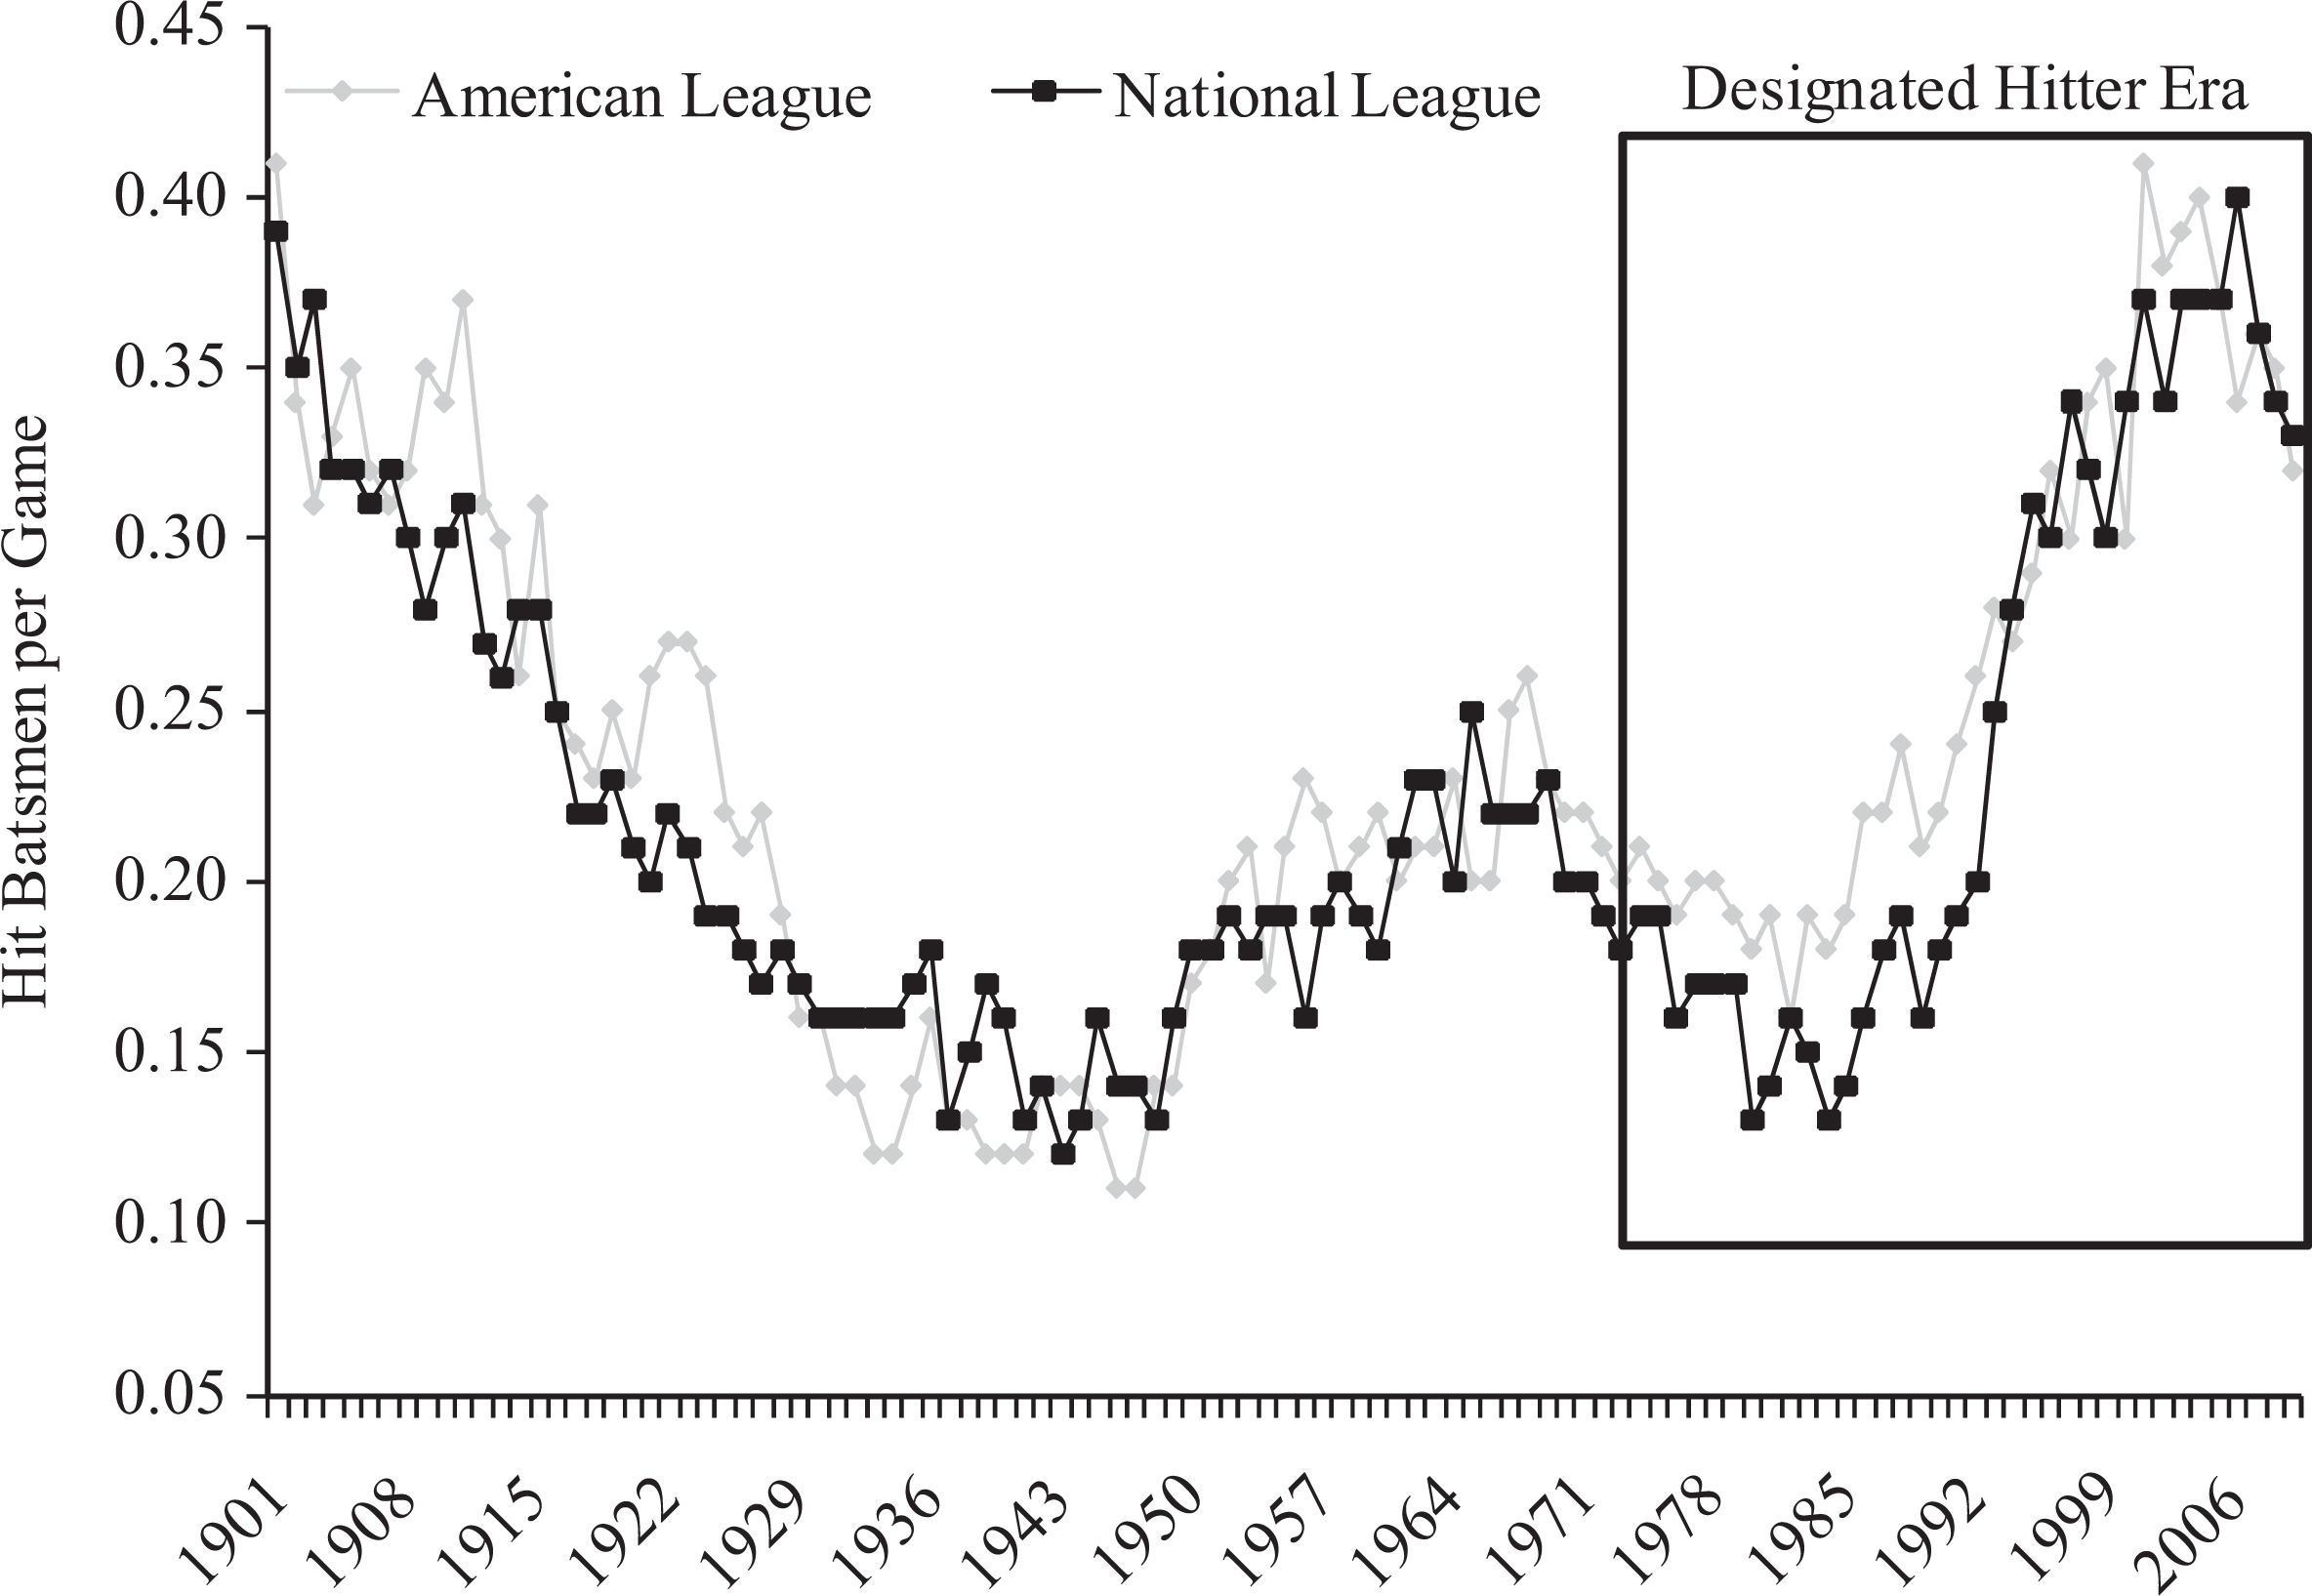
Hit batsmen rates by league, 1901-2009.
In this analysis, we look to identify alternative sources of moral hazard by pitchers within the game of baseball, utilizing game-level data and a model most similar to that used by Bradbury and Drinen (2006). We focus on two potential areas. First, can the increased reliance upon relief pitching—that is, pitchers used for short periods after the starting pitcher has left the game—create a situation of moral hazard? Recall that the moral hazard hypothesis for pitchers arises from the fact that some pitchers—those in the AL—do not bat, and thus the cost/benefit calculation for their actions changes. While relief pitchers in the AL do not bat due to the DH rule, relief pitchers in the NL rarely bat as well. Relief pitchers are poor offensive players and managers generally have the ability to utilize combinations of player substitutions to avoid having a relief pitcher bat. Therefore, while a relief pitcher in the NL could bat according to the rules, in actuality, relief pitchers rarely do bat. 2 We would expect, then, that NL relief pitchers would face a moral hazard problem due to the fact that they do not bat. Furthermore, as the incidence of relief pitching rises, we would expect NL pitchers to behave more like AL pitchers. Our results show that the number of hit batsmen rises as the number of relief pitchers in a game increases and also that this increase is larger in the NL than in the AL, lending support to the hypothesis that relief pitching could be a significant source of moral hazard for pitchers.
To our knowledge, only Stephenson (2004) has considered the role of relief pitchers as separate from starting pitchers. He hypothesizes that if a starting pitcher switches leagues to the NL (AL), his behavior should adjust and he should hit fewer (more) batters due to the absence (presence) of the DH rule and the moral hazard it creates. However, since relief pitchers do not bat, this behavior shift should not occur in relief pitchers. Stephenson, though, finds no evidence to support the moral hazard hypothesis.
Second, does the number of games remaining against a particular team create a moral hazard dilemma? Consider the cost to a NL pitcher of hitting a batter at the beginning of a season and at the end of a season. Since the potential for retaliation is greater when there are more games left in the season, a moral hazard would seem to develop as the season progresses and fewer games remain against any one particular opponent. 3 However, since this effect would occur only when pitchers can bat, only NL pitchers would be subject to this particular form of moral hazard. Our results show that although there is an unexpected positive relationship between the number of games remaining and the number of batters hit in a game, the relationship is actually smaller in the NL than in the AL, which is consistent with moral hazard. However, the size of the difference in this case is very small.
The article will proceed as follows. Data and Method section outlines the empirical methodology and data. Results section describes the results. Conclusion section concludes.
Data and Method
The data used in this article are from Retrosheet, Inc. (2009) and Sports Reference, LLC (2009) and consists of all regular season MLB games from 1973 to 2008. 4 No play-off games are included. As in Bradbury and Drinen (2006), the year 1973 is chosen as the starting point because it is the first year in which the DH was utilized.
Following Bradbury and Drinen (2006), a Poisson regression is used to model the number of hit batsmen for a team in each game, since the dependent variable is a positive count outcome with generally low numbers. Equation (1) represents the Poisson regression used to model hit batsmen in a game in this article.

The major difference in this article compared to past literature is that it takes into account other possible moral hazard problems in MLB, in particular by also accounting for relief pitching and the number of games remaining. This is done by including three additional variables,
Recall, the moral hazard hypothesis suggests that the effect of an additional relief pitcher in the NL is larger than the effect of an additional relief pitcher in the AL, as an NL reliever is expected to behave more like an AL pitcher since he rarely bats and therefore rarely faces retaliation. Correspondingly, an additional NL reliever is expected to increase the number of hit batsmen more than an additional AL reliever. 6 Furthermore, the moral hazard hypothesis predicts that the effect of a game remaining in the NL would be smaller than in the AL because NL pitchers are concerned not only about the threat of retaliation in the present game but also in a future game. Since AL pitchers bat in neither present nor future games, this future threat is also nonexistent in the AL.
Notice, Equation (2) represents the regression equation when the game is being played under NL rules, such that NL is equal to 0 and DH is equal to 1:


Similarly, the difference between the coefficient on
Table 1 displays summary statistics for all the variables used in the regression analysis.
Summary Statistics by League
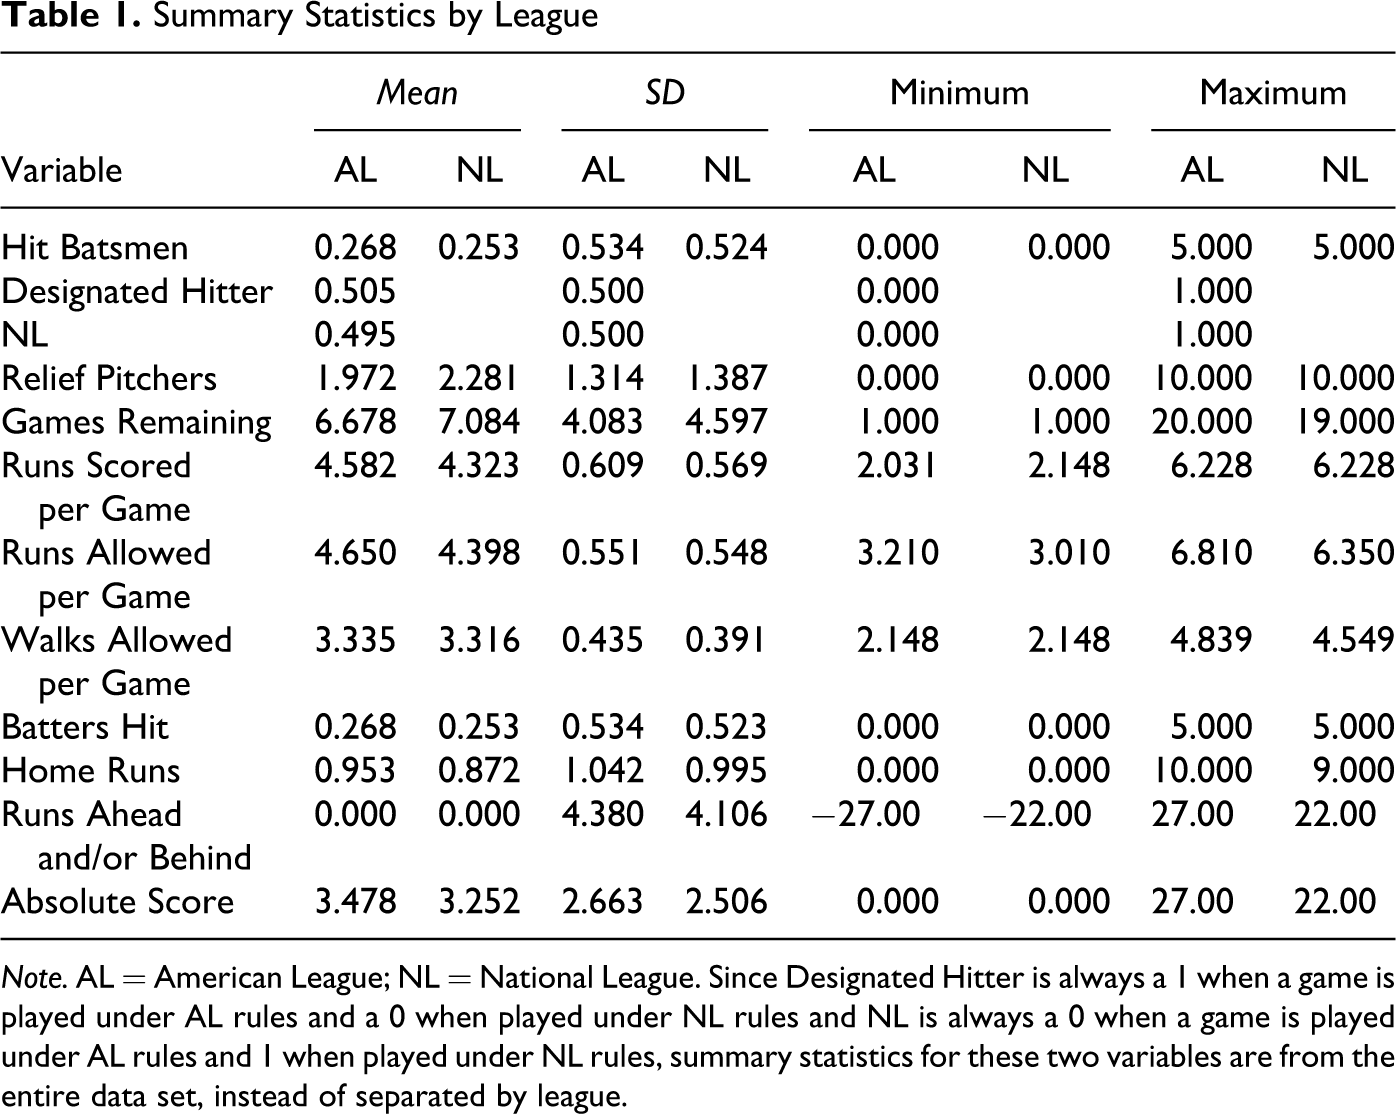
Note. AL = American League; NL = National League. Since Designated Hitter is always a 1 when a game is played under AL rules and a 0 when played under NL rules and NL is always a 0 when a game is played under AL rules and 1 when played under NL rules, summary statistics for these two variables are from the entire data set, instead of separated by league.
Results
Table 2 displays the Poisson regression estimates for the sample of all MLB games between 1973 and 2008. 9 Note that since each game consists of two teams, each game also accounts for two observations, for a total of 155,712 observations. Incidence rate ratios are reported for ease of interpretation and consistency with Bradbury and Drinen (2006). The model specifications also follow the approach used in Bradbury and Drinen. The results for the batter quality, pitcher quality, retaliation, and game-specific variables are mostly consistent with Bradbury and Drinen, so we again direct the reader to that article for a discussion of those variables.
Determinants of Hit Batters, 1973-2008
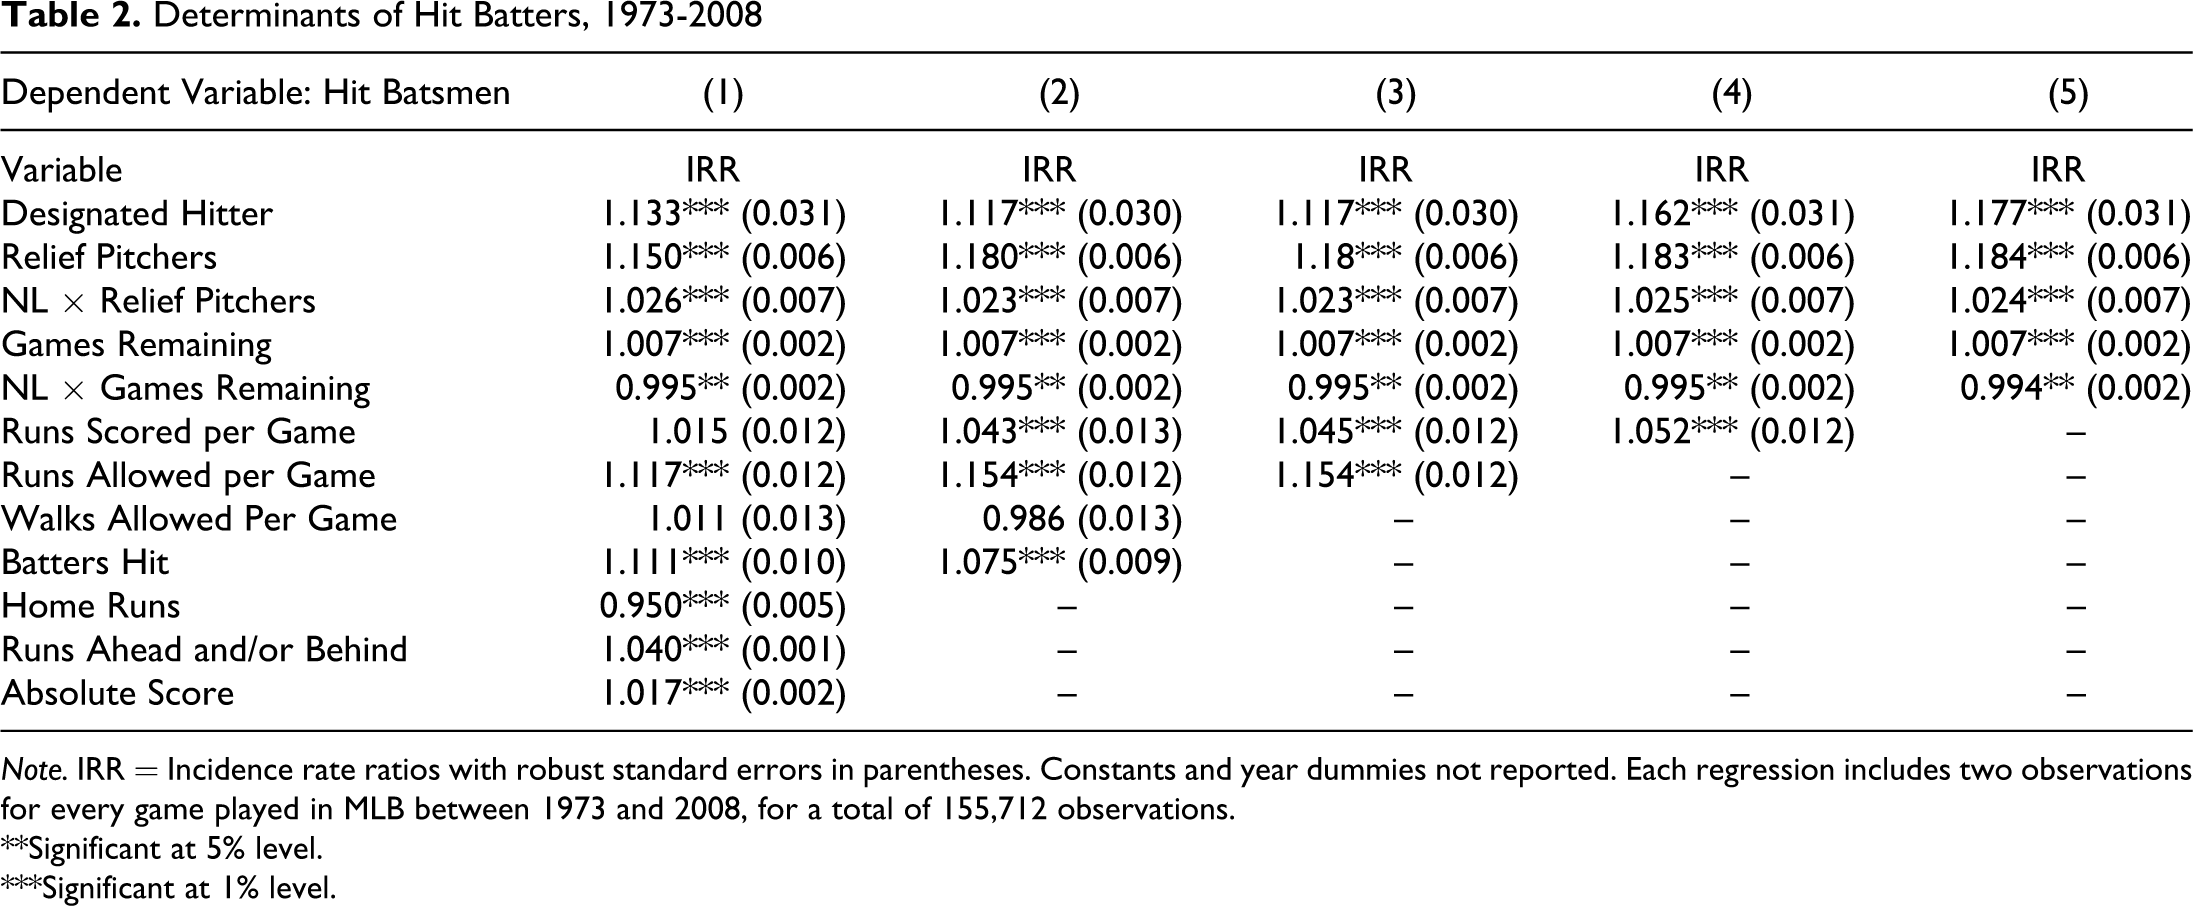
Note. IRR = Incidence rate ratios with robust standard errors in parentheses. Constants and year dummies not reported. Each regression includes two observations for every game played in MLB between 1973 and 2008, for a total of 155,712 observations.
**Significant at 5% level.
***Significant at 1% level.
Referring to the incident rate ratio on the Designated Hitter variable, Bradbury and Drinen (2006) find a nearly 8% increase in the likelihood of a hit batsman due to the DH rule. The results in Table 2 suggest that the DH effect may actually be larger, between 11% and 18% when relief pitchers and games remaining are included in the specification.
Consistent with the moral hazard hypothesis, the incidence rate ratio on NL × Relief Pitchers is statistically greater than 1. Referring to column 1, the results for the coefficients on Relief Pitchers and NL × Relief Pitchers imply that an additional relief pitcher in the AL increases the number of hit batsmen by about 15%, whereas an additional relief pitcher in the NL increases the number of hit batsmen by about 18%. 10 There are several explanations for why the effect of an additional relief pitcher increases the number of hit batsmen, such as the number of relief pitchers being correlated with more opposition at-bats in a game (resulting in more hit batters) and style and control differences between starters and relievers. However, the 3% difference between leagues is not attributable to these factors and is thus most likely explained as being moral hazard. Alternative specifications suggest similar results.
Figure 2 displays this result graphically, showing the impact of the number of relief pitchers used in the AL versus the NL on the expected number of hit batsmen. The results in Figure 2 were calculated using the Poisson regression shown in column 1 of Table 2. Figure 2 shows that as the number of relief pitchers used in a game increases, the difference in the expected number of hit batsmen per game decreases between the AL and NL. Furthermore, when about five relief pitchers are used in a game, the expected number of hit batsmen is about the same for the two leagues. Again, the rationale behind this is that the more relief pitchers used in the NL, the less likely those pitchers bat and face retaliation. Correspondingly, the more those pitchers behave like AL pitchers.
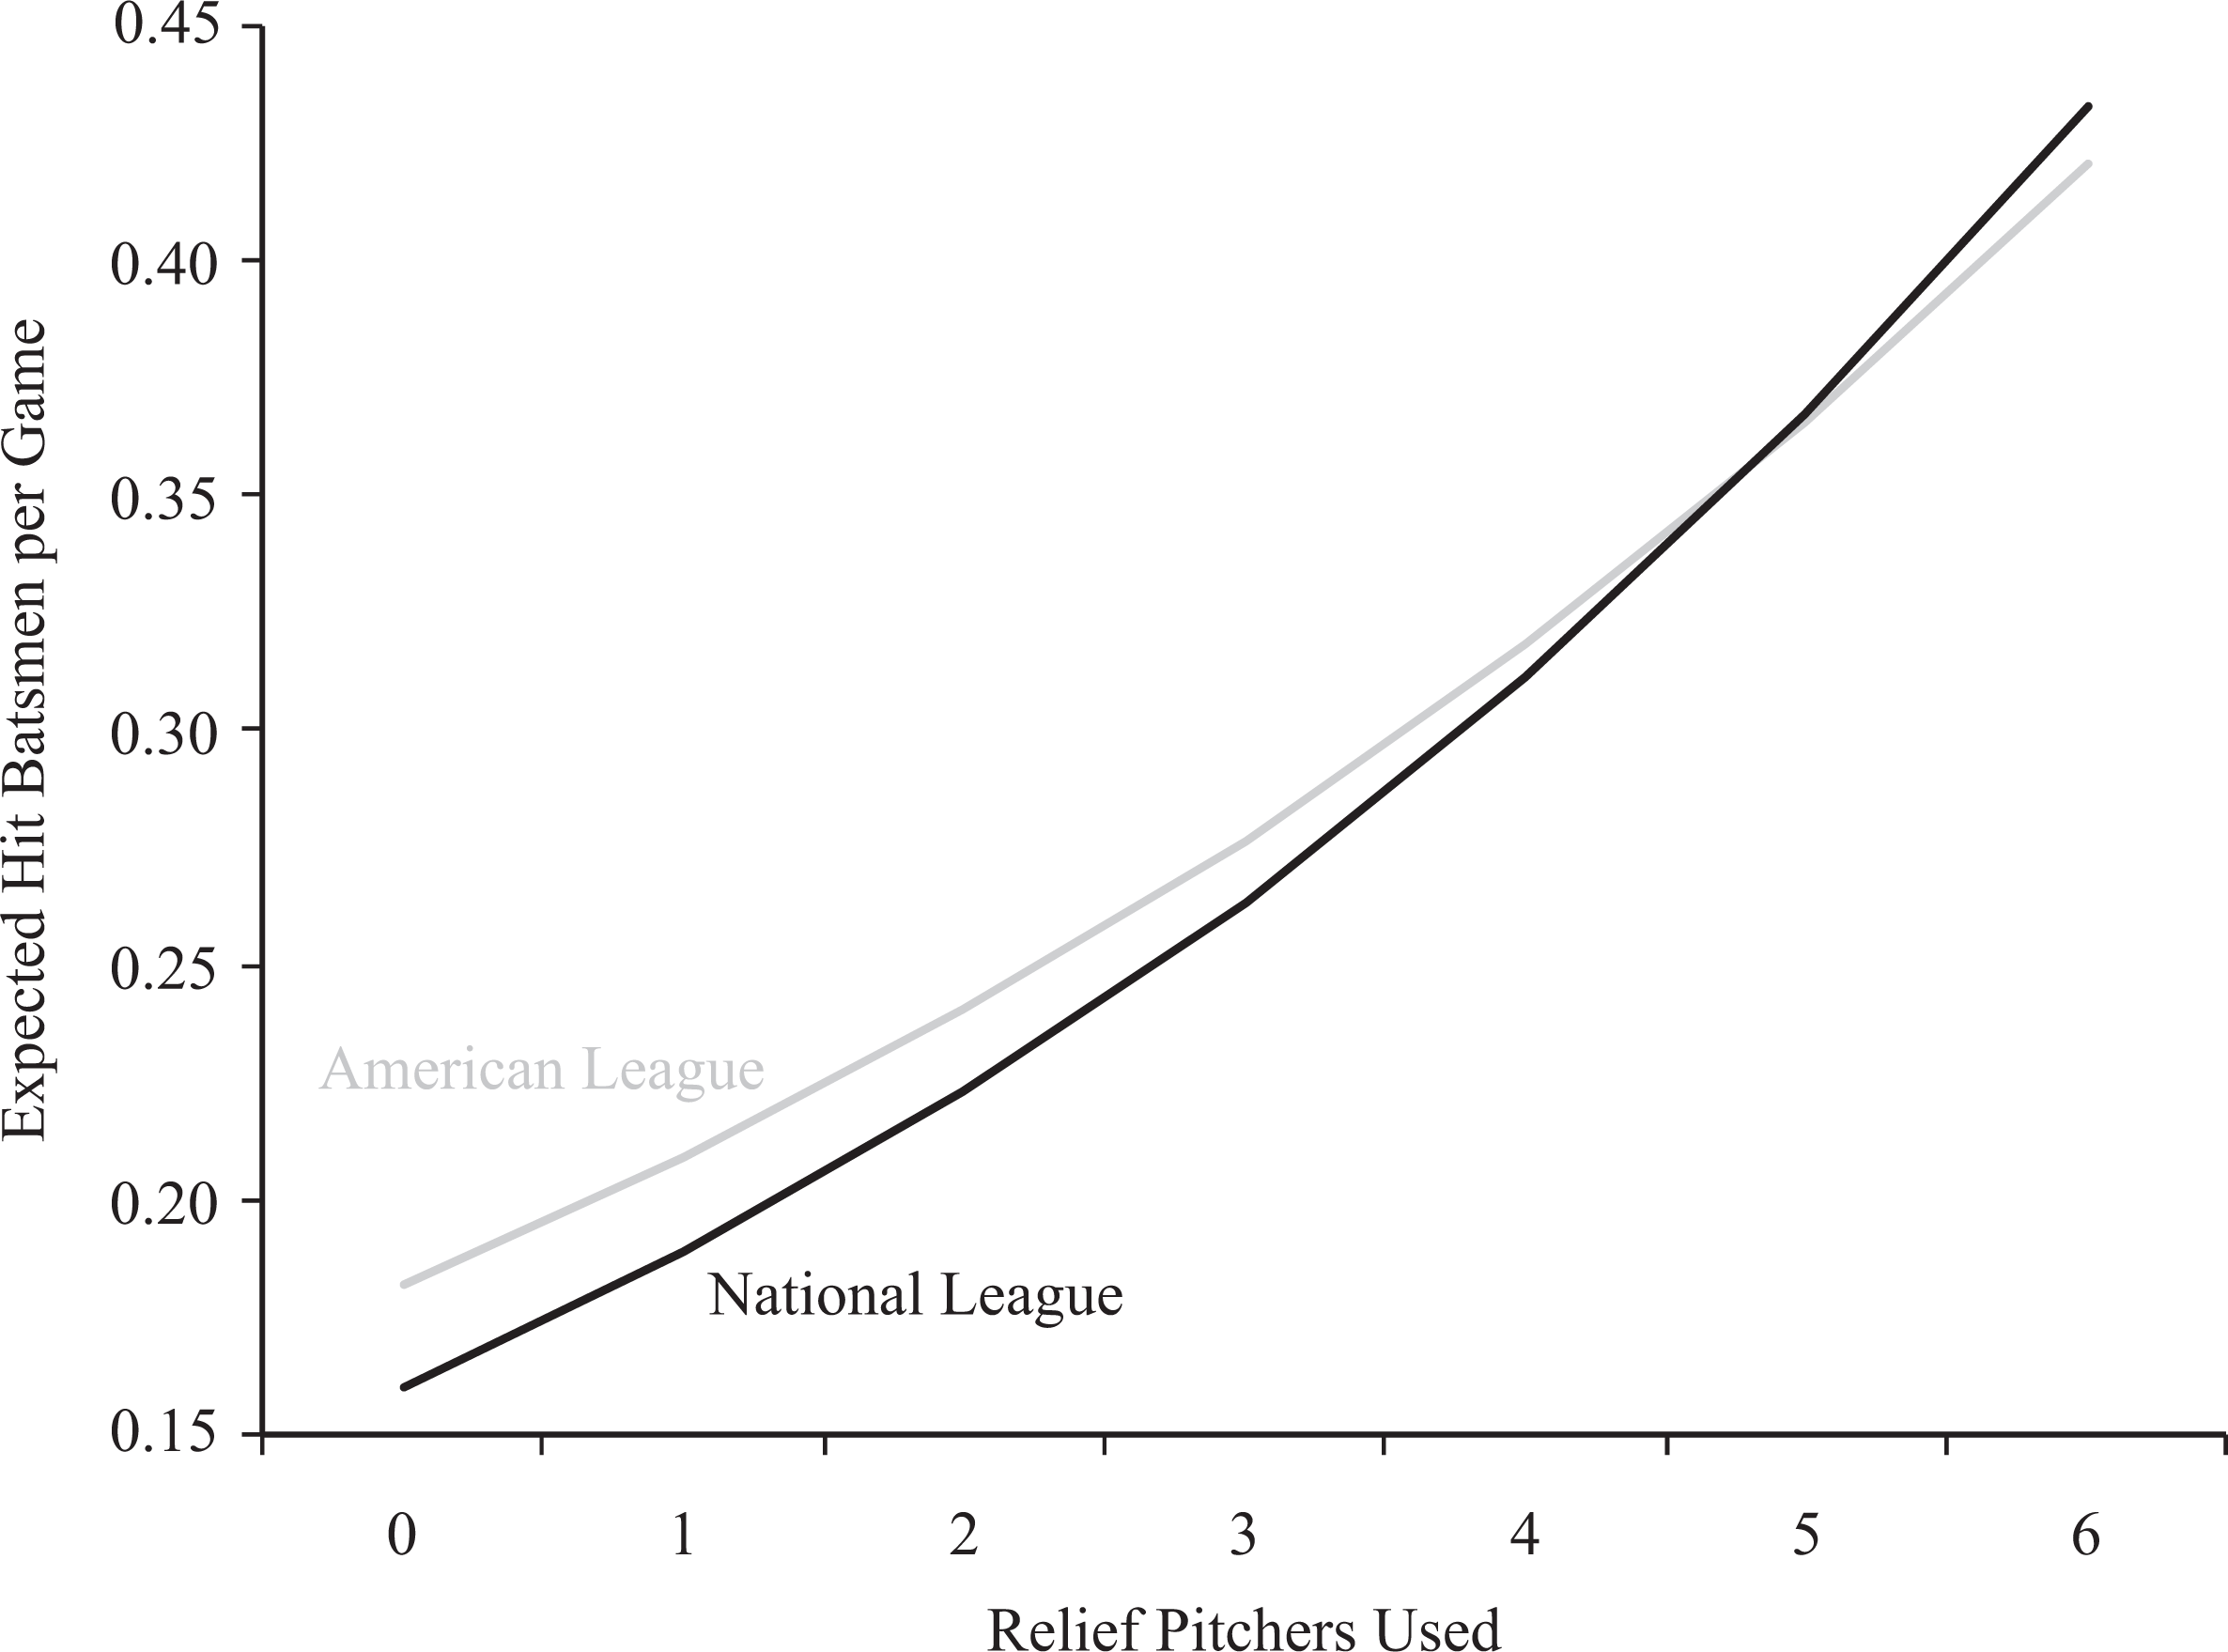
Expected hit batsmen and relief pitchers used per game.
While statistically different from 1, the incident rate ratios on Games Remaining and NL × Games Remaining are economically small. The results suggest that the impact of an additional game remaining in the AL increases the number of hit batsmen by only about 0.7%. Furthermore, in the NL, the impact of an additional game remaining increases the number of hit batsmen by about 0.2%. 11 As expected and consistent with the moral hazard hypothesis, the impact of an additional game remaining in the NL is smaller than in the AL. Unexpectedly however, the more games remaining between two teams, the more batters are hit. One possible explanation is that the Games Remaining variable is associated with what point in the season a team is at, such that a game early in the season may not be as important as a game later in the season when teams are competing for a play-off spot. Therefore, pitchers may view games earlier in the season as “lower cost” games that results in more hit batsmen. Nonetheless, the magnitude of the impact is almost trivial.
Conclusion
This article uses game-level data to examine forms of moral hazard in MLB not previously considered. Specifically, this article looks at whether the number of relief pitchers used and the number of games remaining have a moral hazard aspect to them. The results for the relief pitching variables support the moral hazard hypothesis in that the effect of an additional relief pitcher in the NL is larger than the effect of an additional relief pitcher in the AL. Also, an additional game remaining in the NL has less of a positive effect on hit batsmen than an additional game remaining in the AL. However, the effect of an additional game remaining is very small in either league. In general, these results support the moral hazard in baseball hypothesis.
This article also sheds new light on the debate about why the difference in hit batsmen between the AL and the NL has decreased in more recent years. Past research has debated the reason for the diminishing difference in hit batsmen between the AL and the NL. From 1973 to 1993, AL teams consistently hit more batters per game than NL teams. Not only did AL teams hit more batters, but the size of the difference was quite large. However, from 1994 to 2009, the difference seemingly disappeared. Past research suggests the MLB expansion in 1993 12 and the double warning rule in 1994 13 as possible explanations; however, the results in this article suggest another possible reason for the decrease in the difference of hit batsmen between leagues: the increased use of relief pitching. Over the course of the DH era, the number of relief pitchers used in a game has increased. As Figure 3 shows, the average number of relief pitchers used per game has roughly doubled in both the AL and the NL since the beginning of the DH era. This increased use of relief pitching has most likely increased the number of hit batsmen in both the AL and the NL due to “style” differences between starters and relievers, but it has also likely increased the number of hit batsmen in the NL due to moral hazard in relief pitching. Figure 4 shows the actual percentage difference in hit batsmen between leagues as compared to the predicted difference in hit batsmen per league if we only allowed the mean number of relief pitchers to vary by league. While the percentage difference between the two series fluctuates across years—sometimes considerably—a rough back-of-the-envelope calculation places the percentage of the difference explained at approximately 20%, as the mean predicted difference is 3.14% over the sample and the mean average difference is 13.91%. Nonetheless, as is evident in Figure 4, as more relief pitchers are used, the possibility of pitchers being retaliated against in either league becomes smaller, thereby eliminating the observed difference between the two leagues.
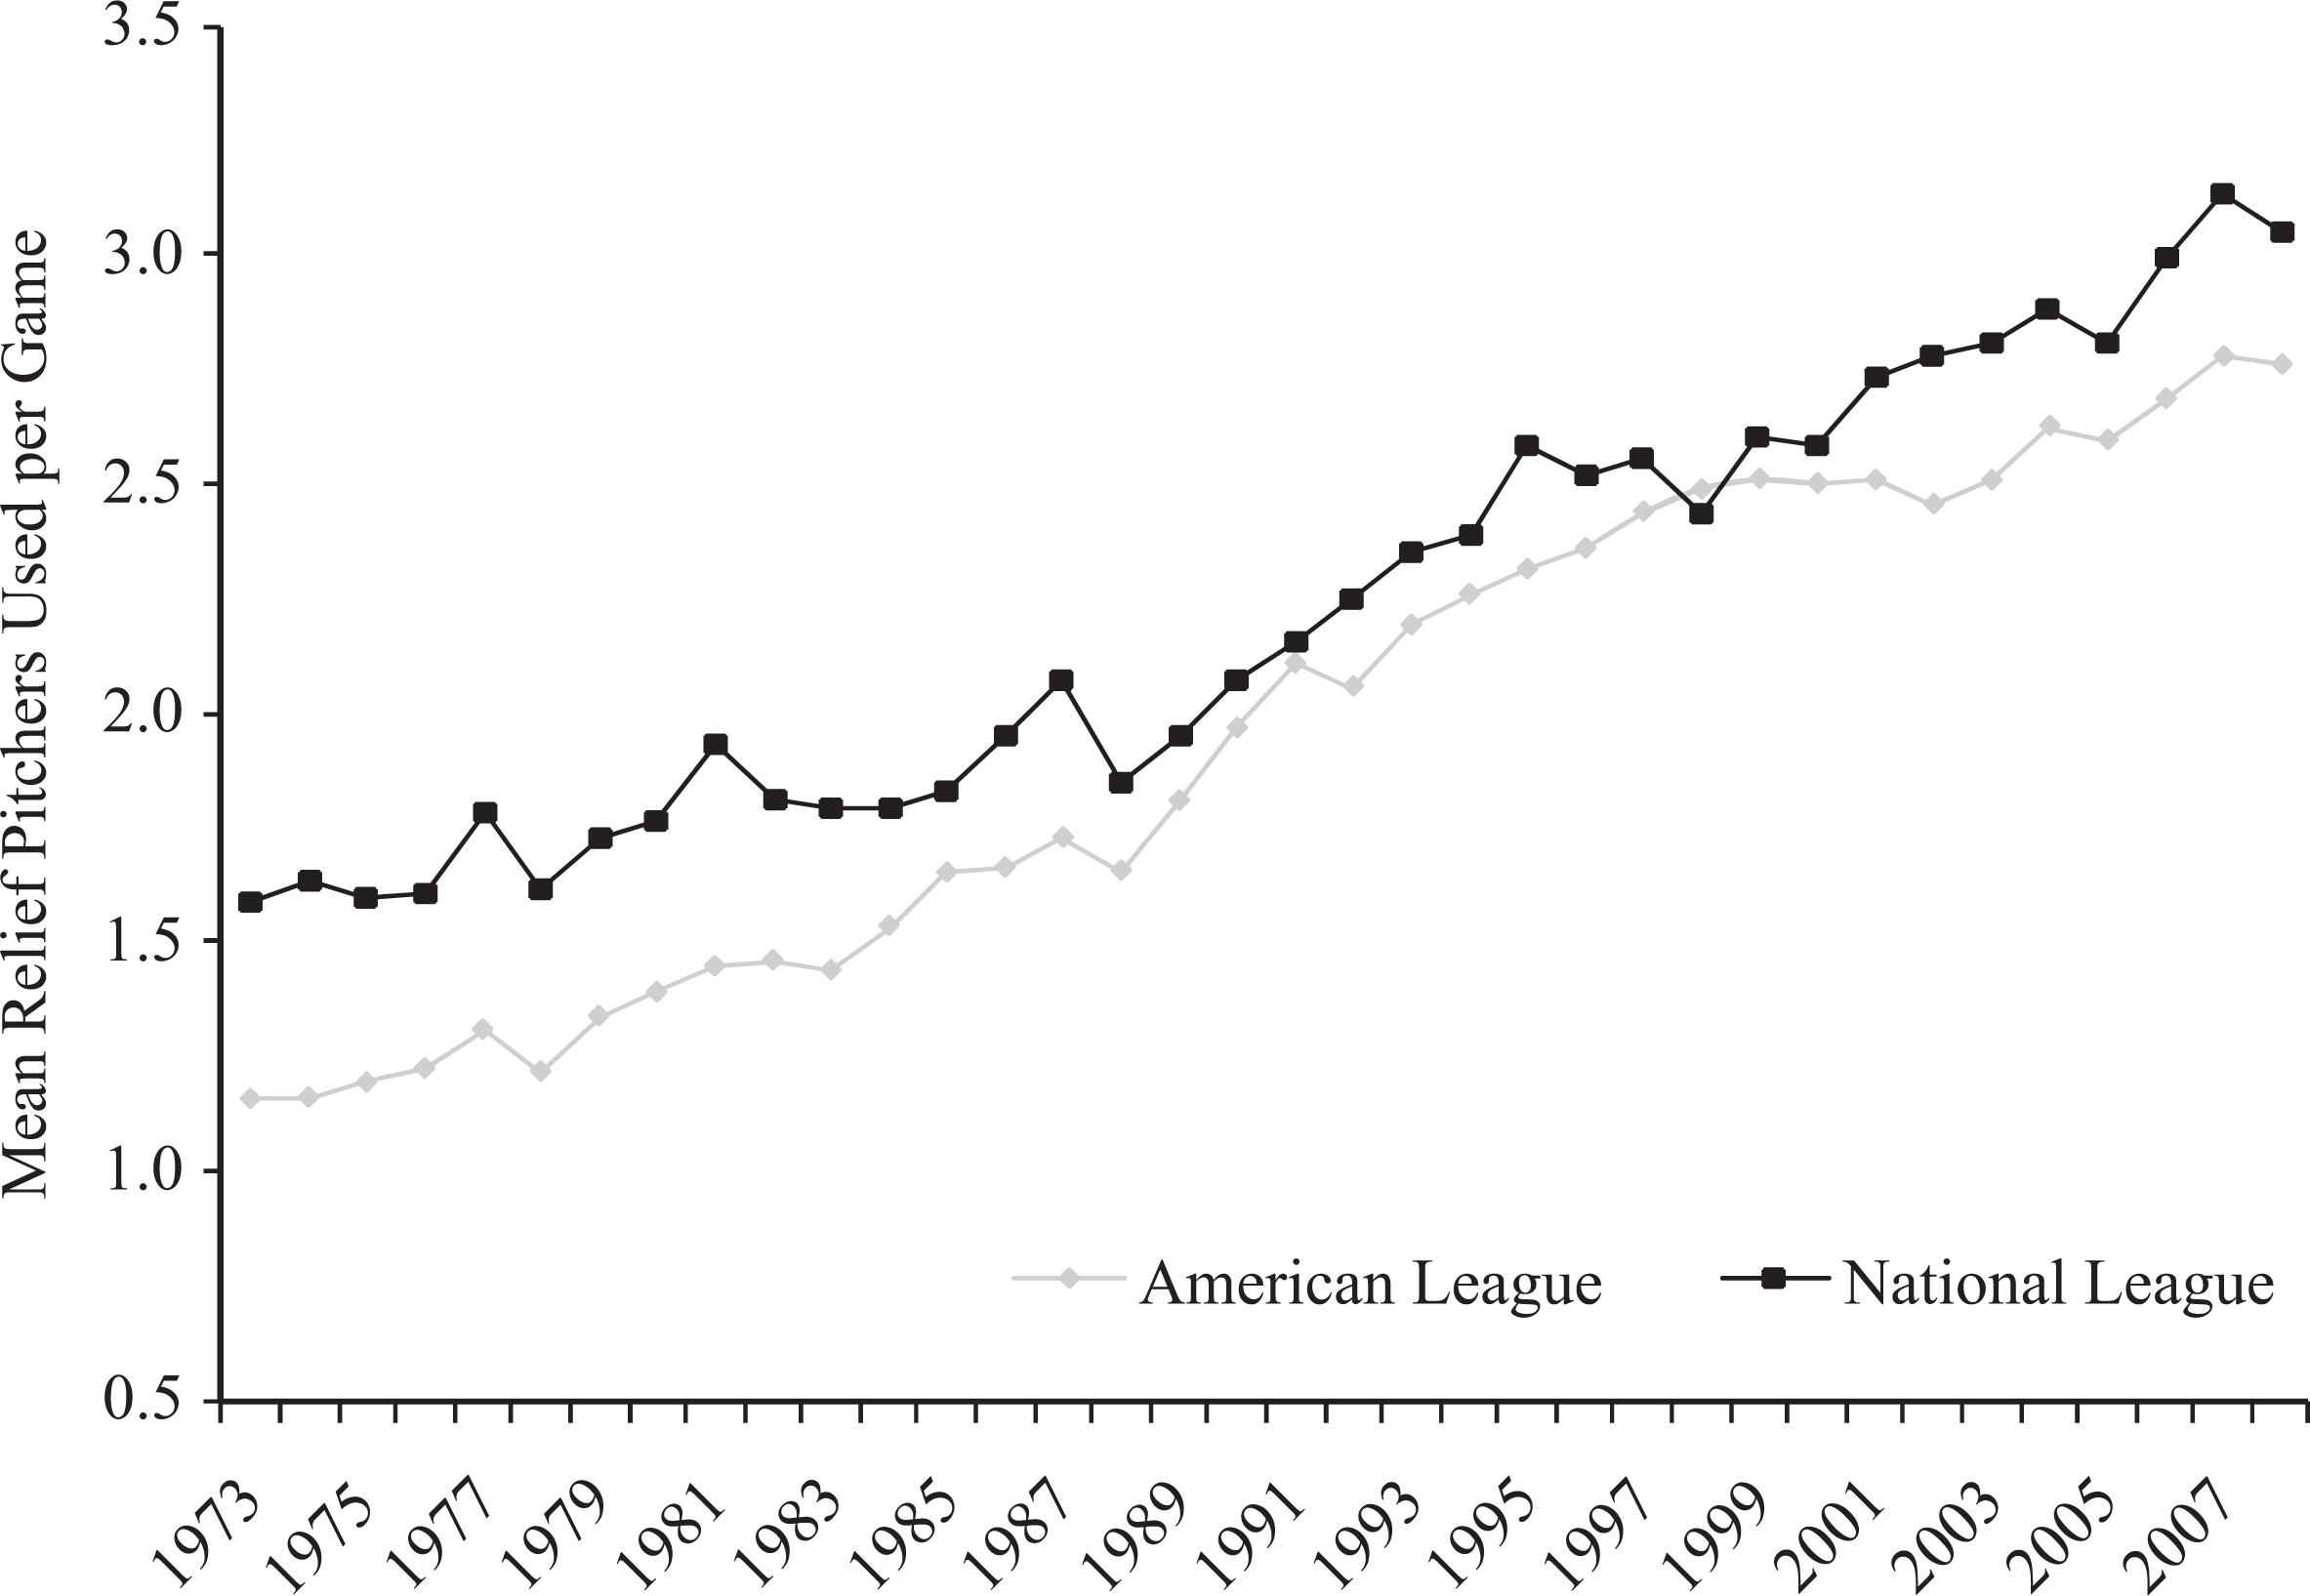
Mean relief pitchers used per game by league, 1973-2008.
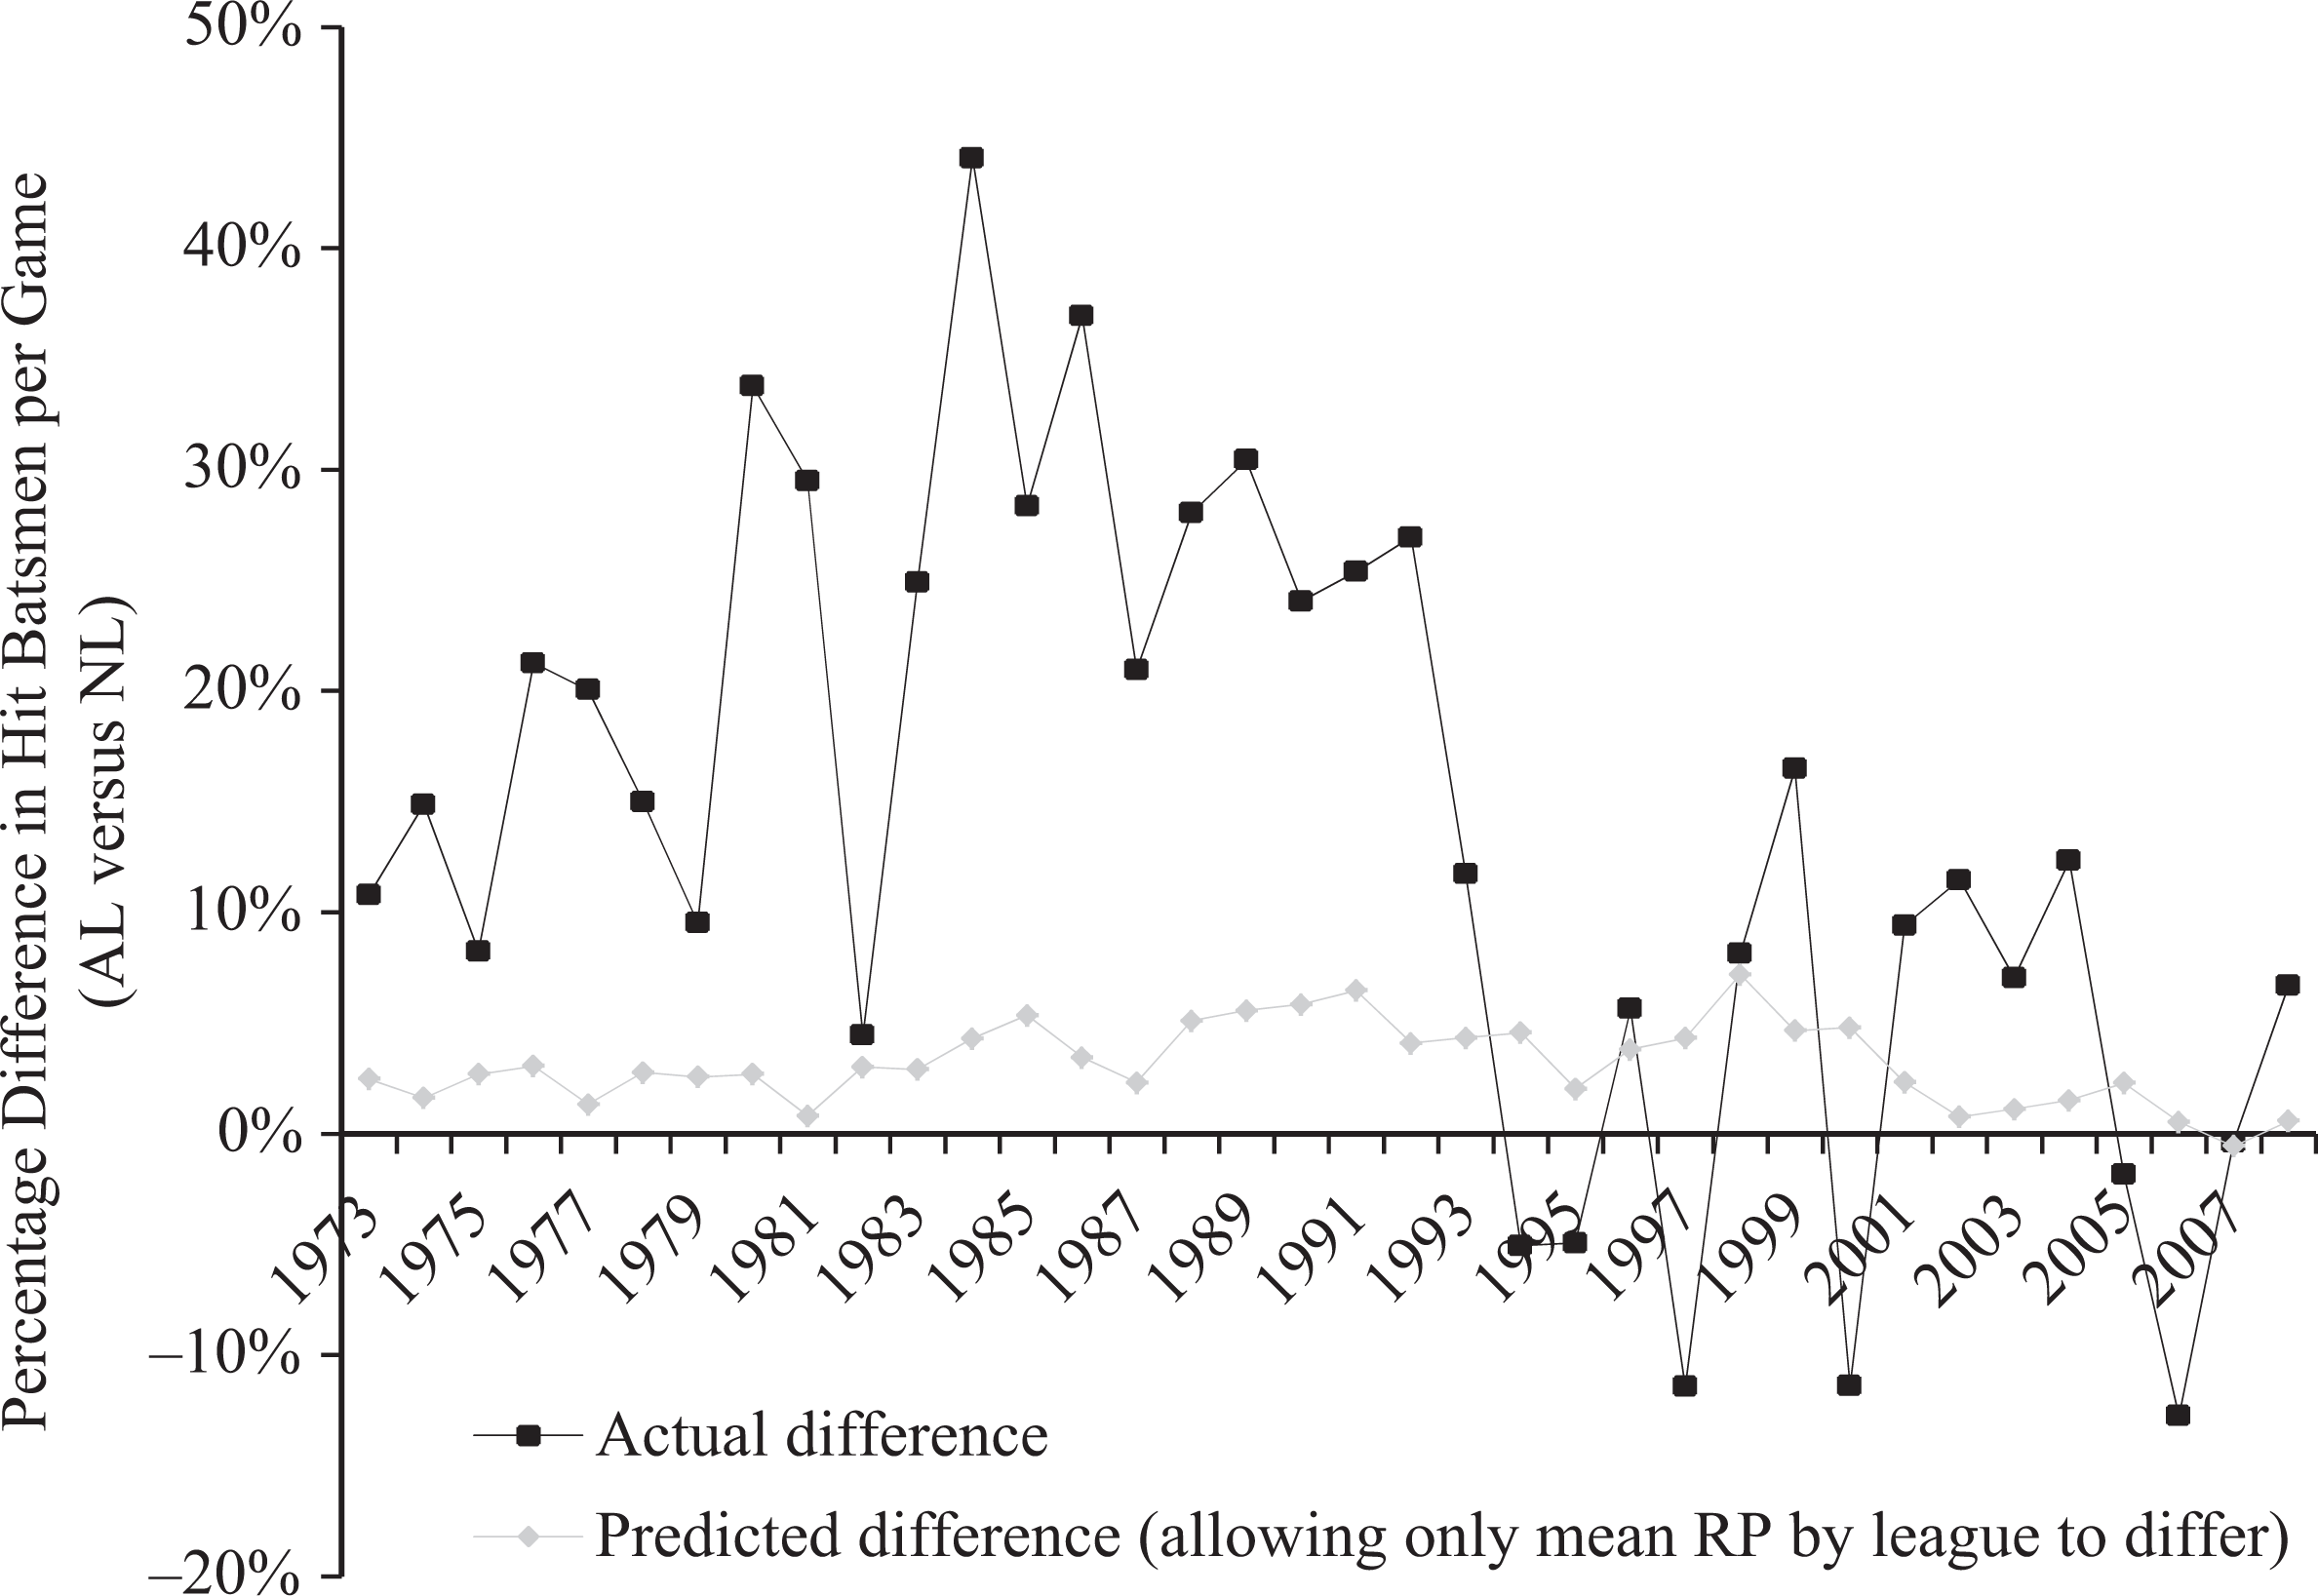
Percentage differences (AL versus NL) in hit batsmen per game, 1973-2008.
Footnotes
Notes
The author(s) declared no conflicts of interest with respect to the authorship and/or publication of this article.
The author(s) received no financial support for the research and/or authorship of this article.