
Abstract
Using 2008-2009 data, we identify winning input combinations for the game of cricket in two different formats: 50-over one-day internationals and 20-over games from Twenty20 internationals and the Indian Premier League. We find that attacking batting and bowling are the best determinants of the winning probability in both formats in an international setting despite their 30-over difference. Interestingly, attacking batting and defensive bowling are the optimal input combinations in the league version of the 20-over format. Finally, we speculate about their implications for the future of cricket, especially for the popularity of formats, choices of players, and player development.
Keywords
Introduction
The game of cricket has gone through many transformations to keep up with the changing times. Modern society, as reflected by attendance at games, has been creating pressure to adopt shorter, result-oriented versions of the game. The conventional form of five-day Test matches was complimented by the introduction of limited-over one-day cricket in the 1960s. More than 40 years later in 2003, an even shorter 20-over format called Twenty20 (T20) was introduced in order to revive spectator interest in the game. This version has not only transformed the game by introducing a fast-paced and TV-friendly format but also created new business interests in the game by attracting millions of spectators. Though several formats coexist today, ranging from the traditional five-day Test match to the one-evening T20 both at international and domestic levels of cricket, there has been an increasing demand for the T20 format from the time of its emergence.
The objective of our article is to compare the 50-over one-day cricket with the shorter version T20. We will examine the factors that determine a team’s ability to win matches in these two different formats, given that there is a difference of 30 overs between them. As Rumford (2011a) states, the T20 is often considered to be more formulaic than the 50-over version with relatively little scope for strategy implementation. In fact, he observes that the traditional “bat versus ball” contest has been reduced to an attacking “six-hitting” batting versus a defensive “in-swinging-yorker” bowling contest with the introduction of T20 cricket. Clearly, the veracity of such observations needs to be examined.
To study these issues, we use a production function approach that determines the outcome of a cricket match as a function of batting, bowling, fielding, and other relevant inputs. Our utilized data set covers 50-over one-day international (ODI) matches, 20-over international (T20I) matches, and matches from the Indian Premier League (IPL). We use conditional-logit models to determine the (relative) importance of batting and bowling inputs for winning matches. This will be used to identify the optimal combination of winning inputs in both formats.
The rest of the article is structured as follows: The second section briefly reviews the history, nature, and rules pertaining to the limited-over cricket. The third section reviews the relevant literature. The fourth section presents the empirical framework. The fifth section describes the data sources and construction of variables. The sixth section discusses the empirical results, and the seventh section concludes and provides implications for the future of cricket.
Brief History of Limited-Over Cricket
The limited-over one-day cricket game was first introduced in the domestic cricketing circles of England in the 1960s. 1 This variant was specifically introduced to revive the popular appeal of the game in England by providing result-orientated and fast-paced cricket in contrast to conventional first-class cricket which was prone to being inconclusive. The format became popular very quickly and was adopted across the cricketing nations. The internationalization of this format began with the first ever ODI game played between England and Australia on January 5, 1971, at the Melbourne Cricket Ground in Australia, which was won by Australia. This format was further popularized with the introduction of the World Cup cricket in 1975.
While the last three decades have witnessed a significant increase in popularity and growth in limited-over cricket, this period coincided with a fall in popularity of the game at the domestic level in the cricketing nations. This was particularly true for county cricket in England. In an attempt to revive the mass appeal of the game, the England and Wales Cricket Board introduced an even shorter 20-over version of the game in its domestic circuits in 2003. This format was introduced to attract the traditional spectators who were constrained with time, as well as non-traditional spectators like young and women. The format became an immediate success, largely owing to its non-stop action over a three-hour period in compared to the whole-day commitment associated with the longer fifty-over version. Other test-playing nations quickly followed suit. 2 The formal introduction of this format at the international level occurred on February 17, 2005 when Australia played and defeated the host New Zealand in a match at Eden Park, Auckland. With the growing demand for this format, the International Cricket Council (ICC) organized the first T20 International World Cup in 2007, which added further momentum to the popularity of this format.
Following India’s victory in the inaugural T20 International World Cup, the Board of Control for Cricket in India decided to establish a T20 cricket league in India known as the Indian Premier League (IPL) along the lines of soccer's English Premier League. The aim was to establish a global league where teams were allowed to draw from a pool of international players while still maintaining a local identity by tying the team to a major city and associating an iconic Indian player to it (Gupta, 2011). 3 Each team was allowed to choose players from a pool of international and regional players through auctions with a cap on the amount a team could spend on player acquisition. 4 IPL rules permit a team to include a maximum of 4 overseas players in its playing 11, while the remaining players must be drawn from India. Teams in the IPL are owned by wealthy Indian businessmen and Bollywood stars which adds further local flavor and glamor to the event. On an important note, the financial payoff from a few weeks of commitment makes this league very lucrative for international players. 5 The inaugural competition took place over 2 months (April–May) in 2008 between eight teams competing on a “home” and “away” basis. 6 The commercial viability of IPL through advertising, media campaigns, satellite and TV rights, and ticket sales in the presence of the South Asian market consisting of 1.5 billion people has made it the most successful and cash-rich league in the world. 7
Earlier in the introduction, we have already noted that this article uses data from 50-over ODI matches and T20 games consisting of T20I matches and matches from the IPL. The objective of using international games is fairly straightforward. Players in the international format have years of international and domestic cricketing experience and are trained by long-term strategists and coaches. To obtain insights about how the optimal input combination changes once we change the format, we need to focus on games involving such players. Our choice of a club-level league was guided by the fact that IPL has emerged as the most successful T20 league, pooling players from across the globe and is completely different in its setup in contrast to international cricket. Given the huge financial incentives in IPL, it would be interesting to see if the optimal input combination changes once we move from international cricket to league cricket using this significantly successful league.
Differences in Rules
Given the limited-over nature of both ODI and T20, the rules are similar in many respects. However, some rules have been modified in T20 to create fast-paced and TV-friendly cricket within a three-hour time frame. 8 Obviously, as opposed to 50 overs in ODI, in T20 each side gets 20 overs to bat with the highest scoring team deemed the winner. Similarly, each bowler is capped to bowl a maximum of 4 overs in T20 as opposed to 10 overs in ODI. The rules have been modified in T20 to provide additional advantage to the batsmen. For example, a bowler who oversteps the crease in ODI is considered to have bowled a “no-ball”, resulting in an additional run being awarded to the batting team. However, in the case of a “no-ball” in T20, two additional runs are awarded to the batting team with the next ball bowled being considered as a “free-hit” for batsman who can only be dismissed via run-out. Another significant difference in the rules relates to time-wasting in T20. Owing to the three-hour time constraint, umpires are authorized to penalize a bowling team if it is found guilty of wasting time by awarding five additional runs to the batting team. To make the game more result oriented, in case of a tie in T20, the winner of the game is decided through a one-over per side “super-over” where the team scoring the most runs in the “super-over” is declared the winner.
Literature Review
We now provide a brief overview of the relevant literature starting with the production function approach in cricket. Schofield (1988) in his seminal article estimates the outcome of two different formats in English county cricket: the three-day County Championship and the limited-over (40-over per innings) John Player League for the 1981-1983 seasons. The author finds attacking batting measured as runs scored per over (RPO) has greater importance in both formats, while the strength of bowling inputs differs across formats. Attacking bowling measured as overs bowled per wicket taken and wickets taken per game has greater importance in the three-day format, while defensive bowling measured as runs conceded per over emerges as a key factor for winning limited-over games. Bairam, Howells, and Turner (1990a) extend this approach to include the longer format of first-class cricket matches played in Australia and New Zealand. Using a Box-Cox general transformation function, they find attacking batting and attacking bowling as the best input combination to maximize the probability of winning in New Zealand cricket. By contrast, winning probabilities are maximized by using a mix of attacking batting and defensive bowling in Australia. In a subsequent article, Bairam, Howells, and Turner (1990b) compare the optimal input combinations across the three-day and one-day matches played in the domestic cricketing circles in New Zealand. Their findings suggest that while the optimal mix is attacking batting and attacking bowling for the three-day matches, the optimal mix is attacking batting and defensive bowling in the limited-over one-day cricket. This echoes the conclusion made by Schofield (1988). Brooks, Faff, and Sokulsky (2002) apply the production function approach to the longer format Test cricket. Methodologically, their article differs from the previous articles, as it uses an ordered response model to accommodate the presence of a qualitative dependent variable in contrast to the ordinary least squares (OLS) used in other articles. They find average batting and average bowling intents implying a mix of both attacking and defensive intents to be the optimal mix for most test-playing nations, with the model correctly predicting 71% of the match outcomes. 9
Besides batting and bowling inputs, researchers have also studied the impact of other important factors such as toss and home-team bias on match results in cricket. de Silva and Swartz (1997) provide evidence of significant home team advantage in ODI, but fail to find similar evidence for the effect of toss advantage. Allsopp and Clarke (2004) provide similar conclusions for ODI and five-day Test matches. 10 On the other hand, Morley and Thomas (2005) find significant positive effects on match outcomes in English one-day cricket conditional on the home team winning the toss, but such effects disappear after controlling for other variables such as team quality and match importance. Bhaskar (2009) shows significant advantage for a team that wins the toss and opts to bat first in a day–night ODI match. On the other hand, he finds significant disadvantage for a team which opts for a similar strategy in a day match. Dawson, Morley, Paton, and Thomas (2009) further corroborate this finding and show that the toss outcome combined with the decision to bat first increases the probability of winning by 31% in day–night ODI matches.
To our knowledge, there are only a limited number of studies examining T20 matches. Lemmer (2011) using data on 2009 IPL matches asserts that traditional batting average is not an appropriate measure to compare batsmen’s performance, given the different batting conditions. Saikia, Bhattacharjee, and Bhattacharjee (2012) utilize data on IPL and T20 World Cup matches for 2009 and 2010 to evaluate cricketers’ performances and conclude that the poor performance of players in T20 World Cup is uncorrelated with their IPL performance.
Empirical Framework
The contribution of batting, bowling, and fielding inputs to a team’s ability to win games within the production function approach has been widely explored in the sports economics literature.
11
This approach expresses a team’s winning ability as a function of the inputs shown below:

Observe that for the game of cricket each of these inputs can be measured in different ways. In this article, we have created two different categories for the first two inputs of Equation 1: attacking and defensive. These two categories can be thought of as capturing the intent of the teams. Fielding is ascribed only to one category since intent is not really a choice in the context of fielding.
Each input measure depends on a set of observable and unobservable factors. Observable factors include toss outcomes, home-team bias, and weather conditions. For example, although the toss outcome is merely decided by flipping a coin with a 50% probability of winning for each team and does not directly affect any input measures, it confers a comparative advantage to the team winning the toss in choosing its input measures given the pitch, outfield, and weather conditions. Similarly, playing at home can provide a boost to a team’s input measures, given the familiarity with pitch conditions and home crowd support. Examples of unobservable factors include player ability and form, captaincy skills, coaching skills, and team management skills. While ability and form is player-specific, coaching, captaincy, and management skills tend to be team-specific and may be thought as the team’s think tank that devises its strategies for a given match.
The fielding variable has been ignored by most of the studies mentioned above. However, we believe that it plays a significant role and there are several reasons to consider its inclusion. While bowling measures may or may not affect fielding measures, it is definitely true that measures of bowling performance depend to a great extent on fielding performance. Further, in the shorter format of the game, run rate is key to winning a match, making fielding a crucial input. Since one of our goals is to determine whether or not a good fielding side increases its chances of winning, we include this variable in our empirical model. 12
The literature using the production function approach for the game is divided over the choice of the empirical methodology for estimating the model discussed above. The difference in opinion revolves around the construction of the dependent variable that in part is dictated by the nature of the data. Schofield (1988) and Bairam et al. (1990a, 1990b) focus on first-class cricket where teams play each other on a seasonal basis, and present the output and input measures relative to seasonal averages. Since the output variable (expressed as a percentage of matches won or points scored) is a continuous one, they estimate the model using OLS. On the other hand, Brooks et al. (2002), who use data from international Test cricket where teams do not play each other on a seasonal basis, estimate an ordered response model in which the dependent variable is a categorical variable taking values based on win, loss, or draw. In our data set, though the IPL tournament is played on a seasonal basis, the ODI and T20I competitions are scheduled in advance by the ICC’s Future Tours Program. Hence, we opt for a logit model using a binary dependent variable based on the win or loss outcome of the match.
The latent variable model can be expressed as

where ej has a standard logistic distribution independent of xj, with

So, given the explanatory variables, the logit model can be represented as

where Λ(.) is the cumulative distribution function for a standard logistic distribution.
Further, it should be noted that each match generates a pair of observations in the data set: one for the winning team and the other for the losing team. This involves a one-to-one matching between the two choices: win and loss. It stands to reason that within each pair, the outcome of a match is linearly dependent and hence the error terms are correlated. So, we estimate a “Conditional (Fixed-Effect) Logit” model with “match” as the grouping variable that accounts for this correlation due to fixed effects (different intercept across matches) in the model.
Before proceeding to the empirical section, we focus on two issues that warrant further discussion. First, the article identifies the input measures that have the greatest impact on team success. This not only identifies the critical inputs but also has implications for both player selection and team composition. For example, the importance of attacking batting over the defensive one suggests selecting an attacking batsman over a defensive batsman and/or also requires adopting an attacking batting style. Second, it is possible that the selection of batting or bowling measures or intent is also conditional on the choices made by the rival team, but at the time of making its own choice a team may not be fully aware of the other team’s choice. Hence, in keeping with the literature, our focus will be to identify the optimal combination of input measures independent of the opposing team’s choices.
Data
We collect individual match-specific information from the ESPN-owned website CRICINFO (http://www.espncricinfo.com) for all IPL, T20I, and ODI matches in 2008 and 2009. Our data set comprises 276 ODI, 77 T20I, and 118 IPL games that took place during these 2 years. For every match, we obtain data on batting, bowling, fielding, and other related inputs for both teams. Using this, we create different batting and bowling variables to measure different types of intent for each team. The dependent variable is binary and equals 1 when a team wins a match and 0 otherwise. Each match generates two observations, and the observations are stacked by one team’s input variables followed by the same variables for the other team.
We divide the batting and bowling inputs into two categories based on attacking and defensive intents. The batting variables are runs scored through boundaries (fours and sixes) as a percentage of total runs scored (BOUND) and nonboundary runs (excluding extras) as a percentage of total runs scored (NBR). BOUND may be thought of as an “attacking” batting measure whereby teams attempt to accumulate runs at a faster pace in maximizing the number of runs scored. Quite naturally, this method involves higher risks as batsmen aim to acquire more boundaries. The downside of this batting measure is that the team might lose wickets quickly and end up with a lower total score if this risk does not pay off. On the contrary, NBR can be used to depict a “defensive” batting measure where the batting team is conservative in its approach and takes less chances by accumulating runs through singles, doubles, and triples by skillfully finding open spaces in the field and hence, limiting the number of wickets lost while batting. Traditionally, the literature exploring production function in cricket used RPO as a measure of an “attacking” batting intent. 13 While we have included this variable in our empirical analysis for a comparison with the earlier findings in the literature, we emphasize here that this variable conveys little information regarding the intent of the batting input. This is because the analysis involves only limited-over cricket and a team with higher RPO (hence, higher total score) wins the match by definition if both teams use the allocated overs entirely. 14
The set of bowling variables comprise the following: opposition wickets taken per over while bowling expressed as a percentage of overs (OWPO) and the number of runs scored through boundaries (fours and sixes) by the opposition as a percentage of total runs scored (OBOUND). OWPO reflects an attacking bowling intent where a team aims to bowl out the opposition team quickly. 15 On the contrary, OBOUND expresses a defensive bowling intent. Intuitively, the aim of this defensive bowling measure is to minimize the total runs scored by opposition regardless whether the opposition gets out or not. This can be effectively achieved by restricting the number of boundaries (fours and sixes) hit by the opposition. So, a low OBOUND implies a more successful implementation of defensive bowling by restricting the opposition’s run accumulation through boundaries, hence limiting them to a lower total. 16 We also include a comparable traditional defensive bowling measure: runs scored by opposition per over bowled (ORPO) in our empirical analysis. Following our discussion on RPO in the previous paragraph, it can be argued that ORPO, which is the opposition’s RPO, does not provide much insight in defining the bowling intent given the limited-over format of the matches.
The fielding variable (Fielding) is defined as the wickets due to fielding (catches, stumpings, run-outs) as a proportion of total wickets taken. 17 Other independent variables include dummy variables reflecting whether a team played at home (Home), whether a team won the toss (Toss) and whether a team batted first (Bat1).
Tables 1 and 2 report the summary statistics for ODI and T20 matches, and for IPL and T20I matches, respectively. The reported summary statistics exclude the information on 17 ODI, 4 T20I, and 4 IPL matches that were abandoned or tied. As is evident from both tables, there are no significant differences in the outcomes between ODI and T20 matches or between IPL and T20I matches. With respect to independent variables, the batting inputs are significantly different between ODI and T20 as well as between IPL and T20I. In Table 1, the average value for BOUND, a measure of attacking batting, is understandably higher for the shorter format T20I and IPL matches as there is a higher premium on accelerated scoring in form of hitting boundaries. This can be further confirmed by the higher average for RPO in T20 where RPO is a traditional measure of attacking batting and indicates a higher rate of run accumulation. On the contrary, a higher average NBR in ODI confirms the importance of a defensive batting approach where runs are accumulated by taking fewer risks by placing the ball in the gaps where there are no fielders. This is particularly important since the batting team needs to bat through a longer innings in order to maximize its runs scored. Meanwhile, OWPO, an attacking bowling measure is significantly higher for T20 in comparison to ODI. Given that the bowling team has an entire 50 overs at its disposal to bowl out the opposition in ODI as opposed to the 20 overs in the T20 format, the OWPO measured in percentage terms is higher for T20. Since OBOUND (ORPO) is the opposition team’s BOUND (RPO), the mean values are very similar to those shown under batting inputs and are not reported separately to avoid repetition. The values in Table 2 illustrate that the attacking batting input BOUND in IPL matches is statistically significantly larger than that for T20I. This is also reflected through a higher average of run rate (RPO) for IPL. To the extent that league-level games such as the IPL allow for the possibility of exceptional pooling of talent from across the world, this result is not surprising. Moreover, the higher financial incentives may also be driving performance. The average value of the attacking bowling measure OWPO is higher for T20I where most bowlers are specialized in this form of the game and often possess years of international cricketing experience.
Summary Statistics for One-Day International (ODI) and Twenty20 (T20) Matches for 2008-2009.
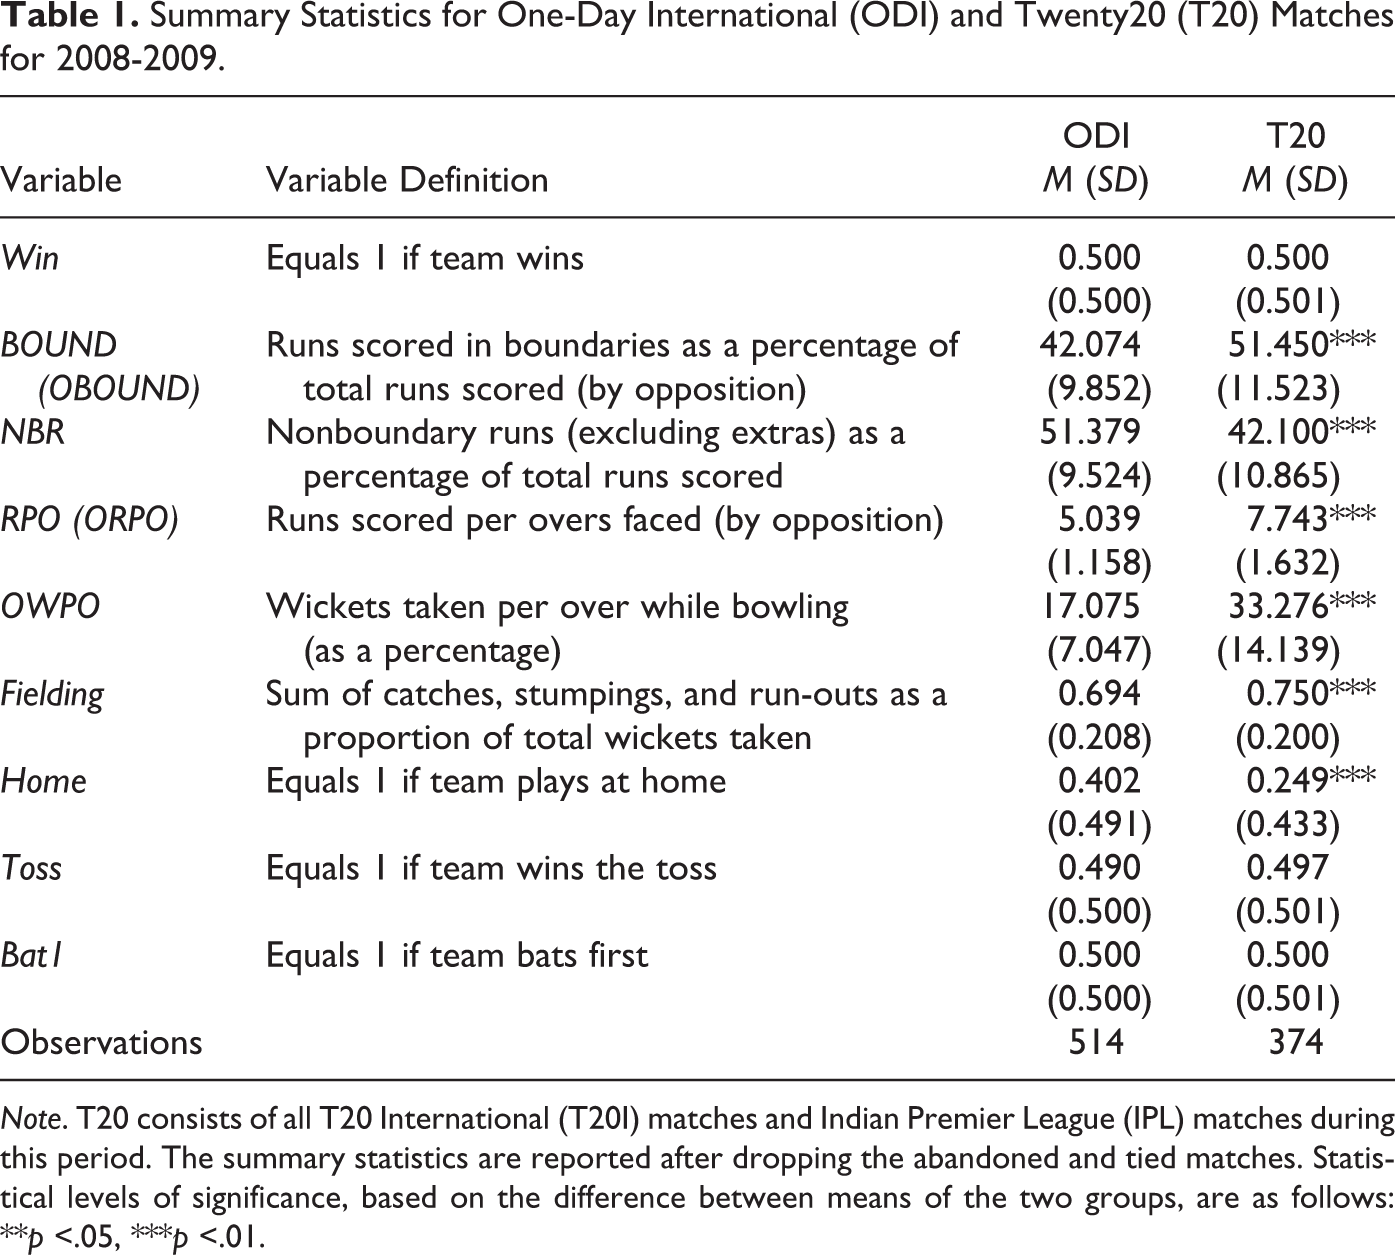
Note. T20 consists of all T20 International (T20I) matches and Indian Premier League (IPL) matches during this period. The summary statistics are reported after dropping the abandoned and tied matches. Statistical levels of significance, based on the difference between means of the two groups, are as follows: **p <.05, ***p <.01.
Summary Statistics for Indian Premier League (IPL) and 20-Over International (T20I) Matches for 2008-2009.
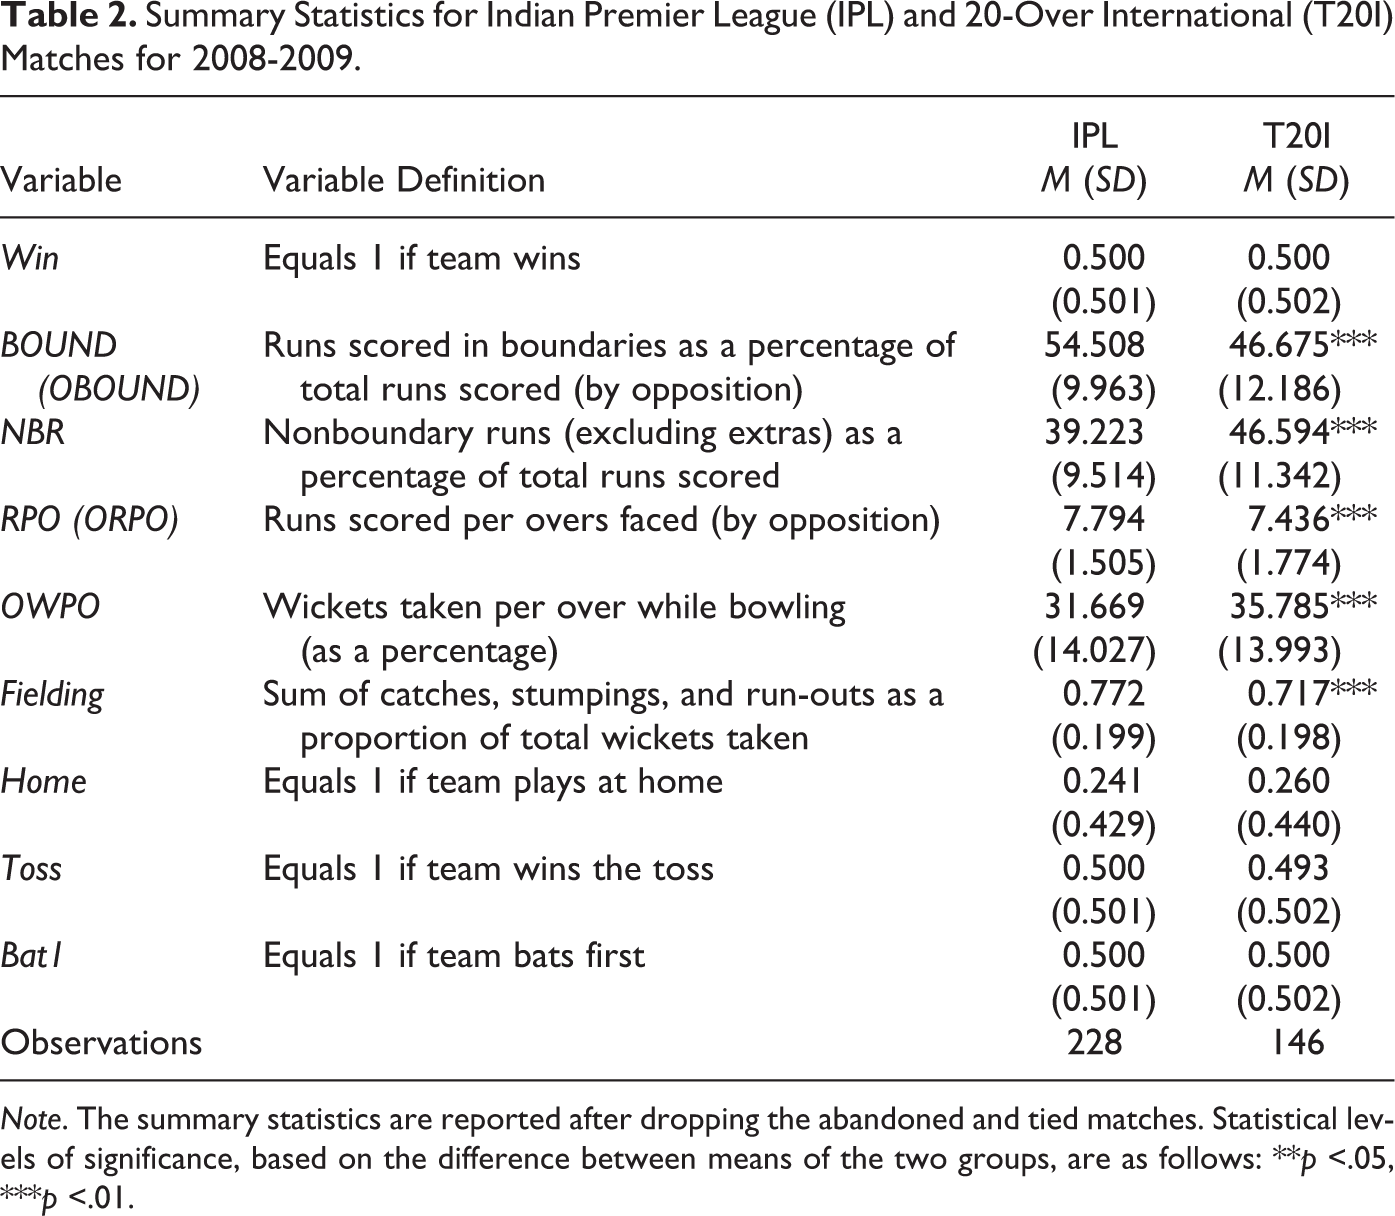
Note. The summary statistics are reported after dropping the abandoned and tied matches. Statistical levels of significance, based on the difference between means of the two groups, are as follows: **p <.05, ***p <.01.
The average value for the fielding variable is significantly higher for T20 in comparison to ODI. This is possibly due to the fact that the faster rate of run accumulation creates more chances for the fielders in T20. The same argument can be extended to support a higher mean value of the fielding variable in IPL than in T20I. With respect to other variables, there is no significant difference between ODI and T20 matches or between IPL and T20I matches. The one exception where the difference is statistically significant between ODI and T20 matches is the Home variable. This is because the documented mean value of 0.249 under T20 is smaller than usual as a result of 2009 IPL matches (which constitute a portion of the T20 matches) played at neutral venues in South Africa. Having found that the descriptive statistics for batting and bowling inputs are different in the two different formats of the game, we now move on to answer the main question of this article: What inputs are responsible for winning matches in the two different formats?
Results
Our objective is to find the combinations of batting and bowling inputs that increase the log odds of winning in different formats of the game. Therefore, our results are neither specific to a team nor in response to a specific team’s choices—they identify different winning combinations of batting and bowling inputs that a team can adopt based on the format of the game. The estimated conditional logit coefficients for different combinations of batting and bowling inputs, as well as fielding and other factors are presented in Tables 3–5 for ODI, T20I, and IPL matches, respectively. 18 We include year fixed effects to separate out any qualitative changes in a team between 2008 and 2009. We discuss and compare the importance of each input across the different formats below.
Conditional Logit Results from One-Day International (ODI) Matches.
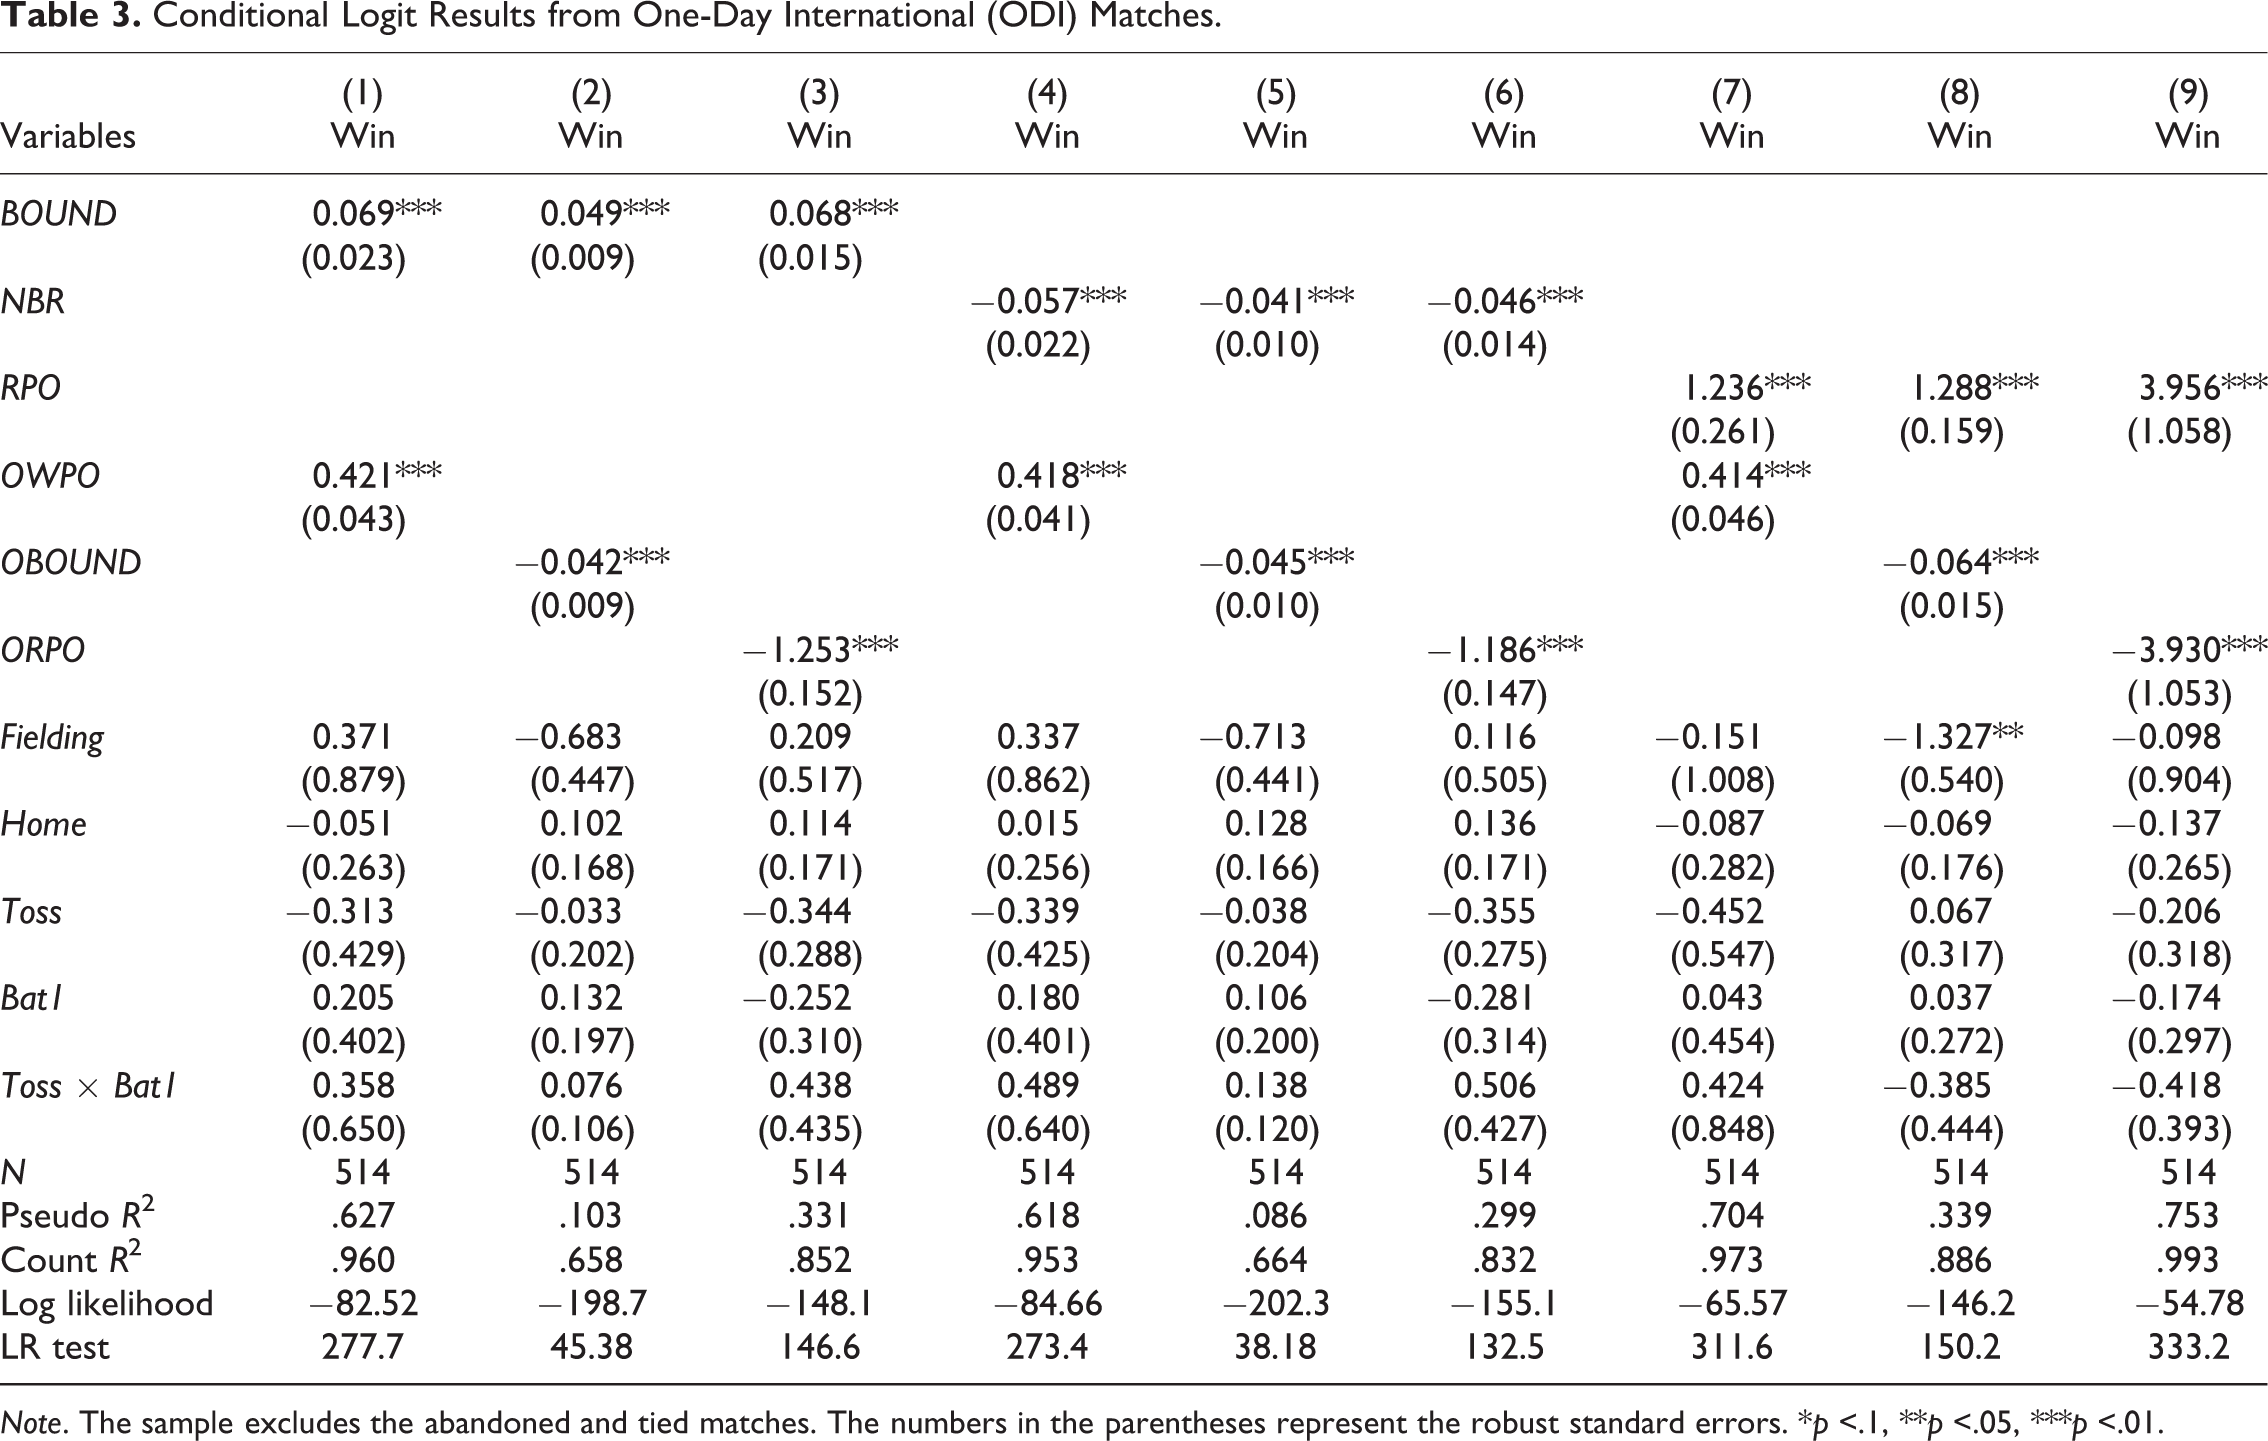
Note. The sample excludes the abandoned and tied matches. The numbers in the parentheses represent the robust standard errors. *p <.1, **p <.05, ***p <.01.
Conditional Logit Results from 20-Over International (T20I) Matches.
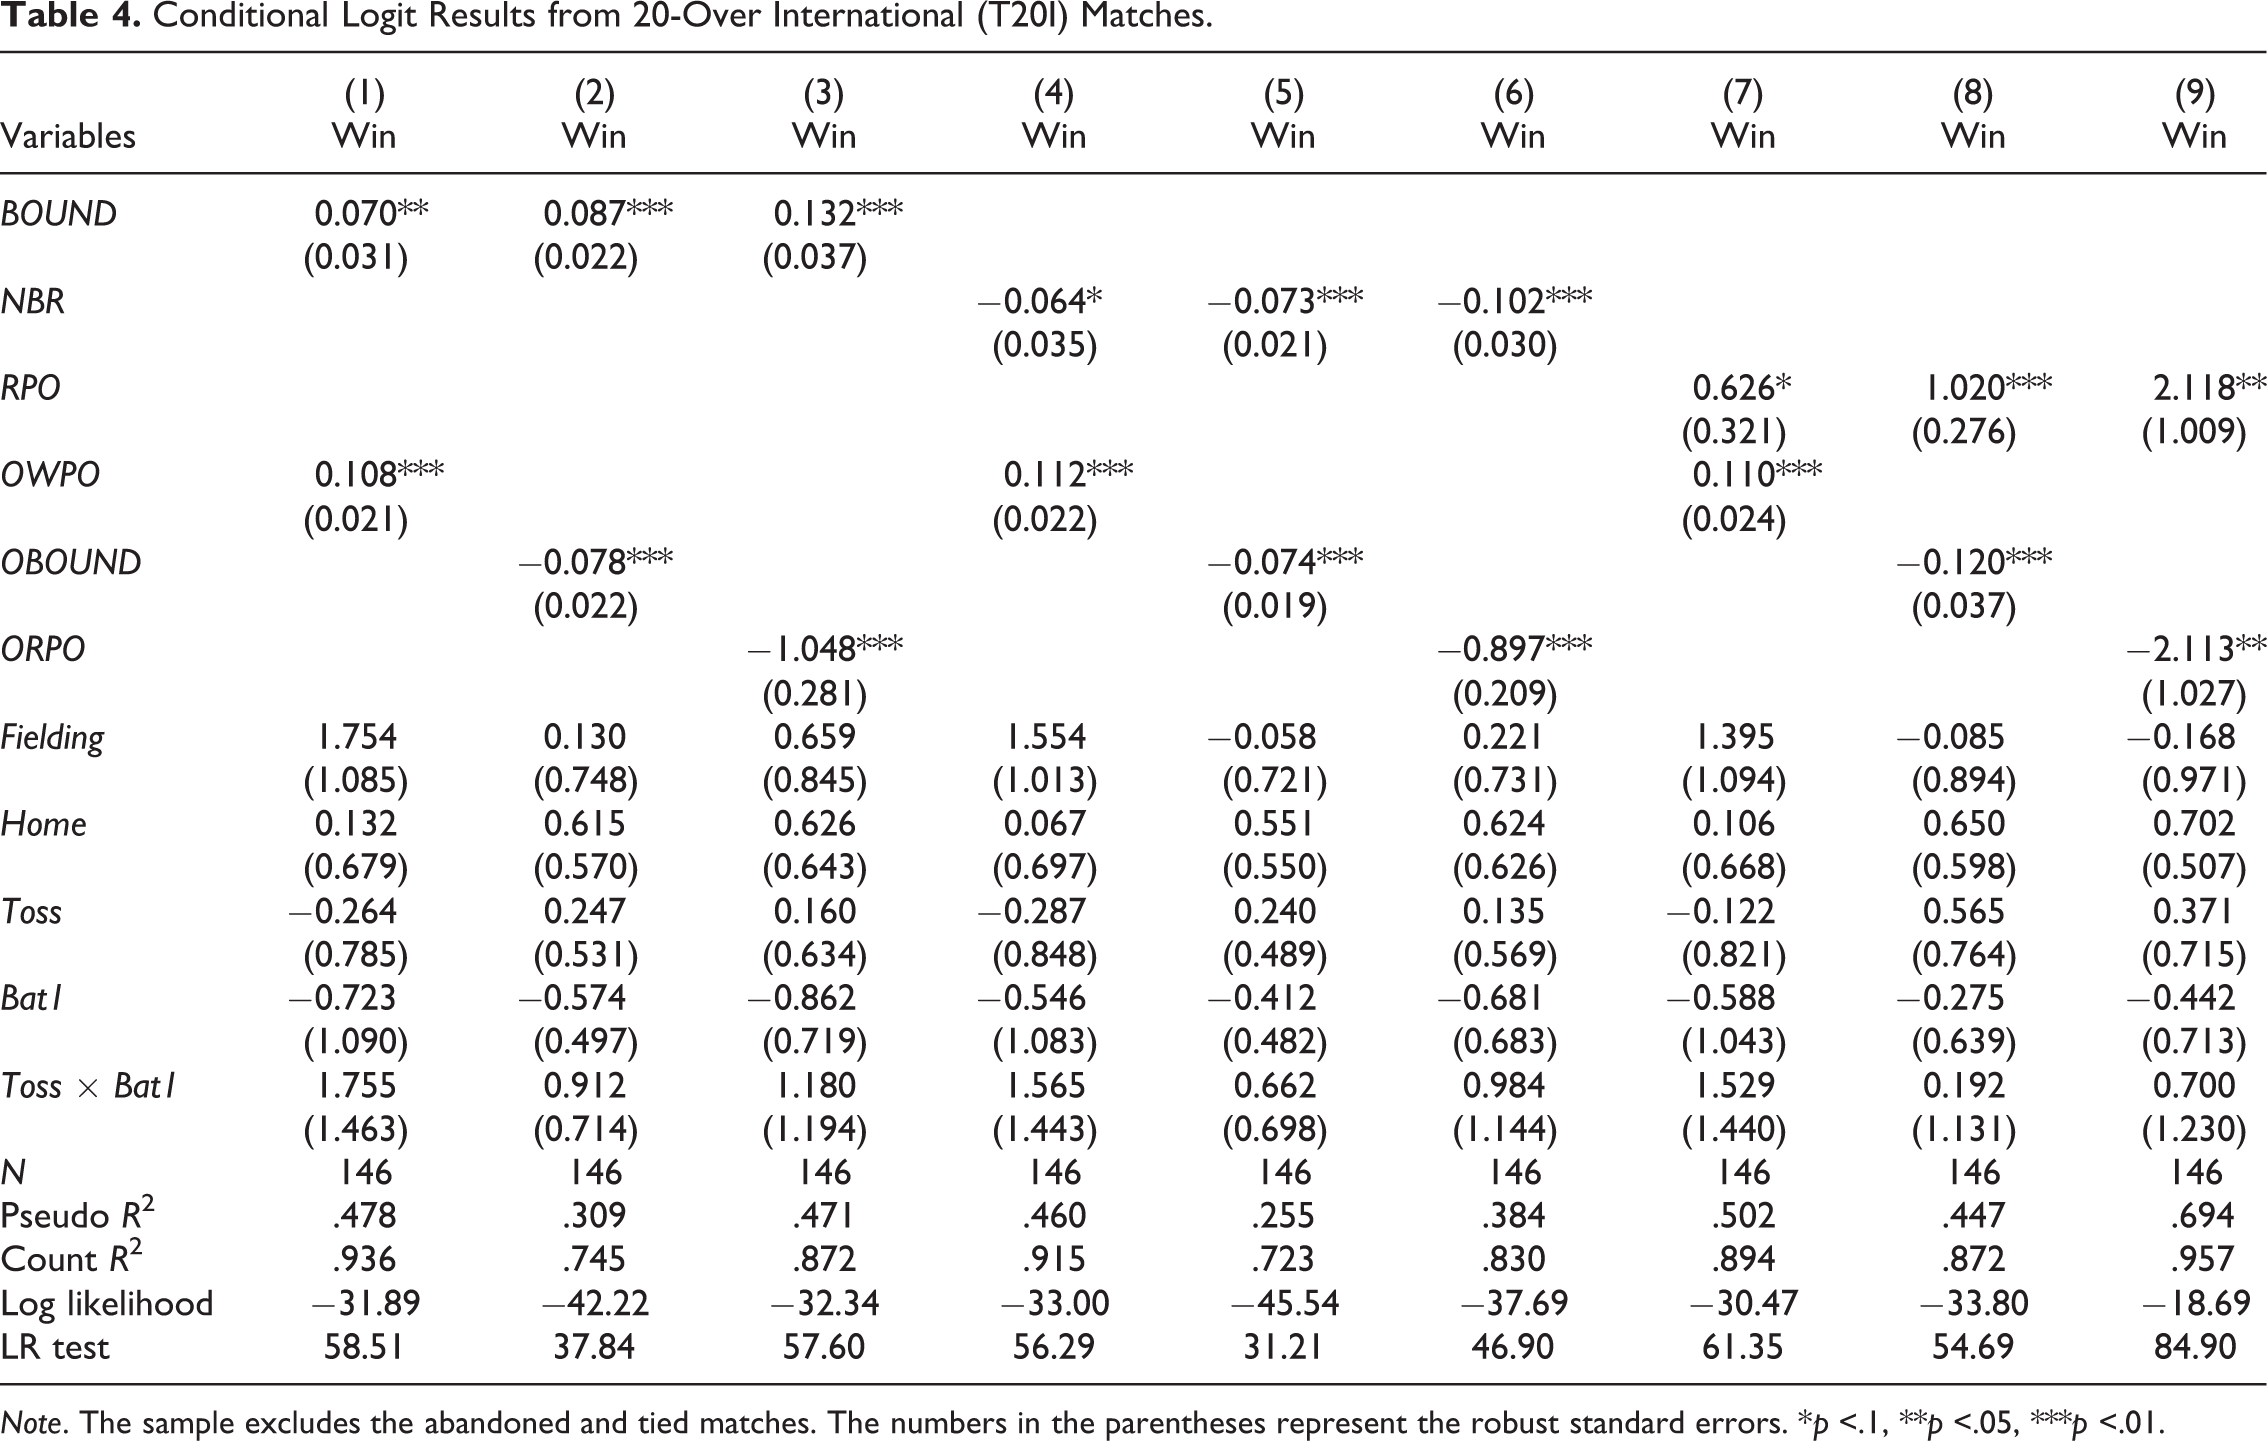
Note. The sample excludes the abandoned and tied matches. The numbers in the parentheses represent the robust standard errors. *p <.1, **p <.05, ***p <.01.
Conditional Logit Results from Indian Premier League (IPL) Matches.
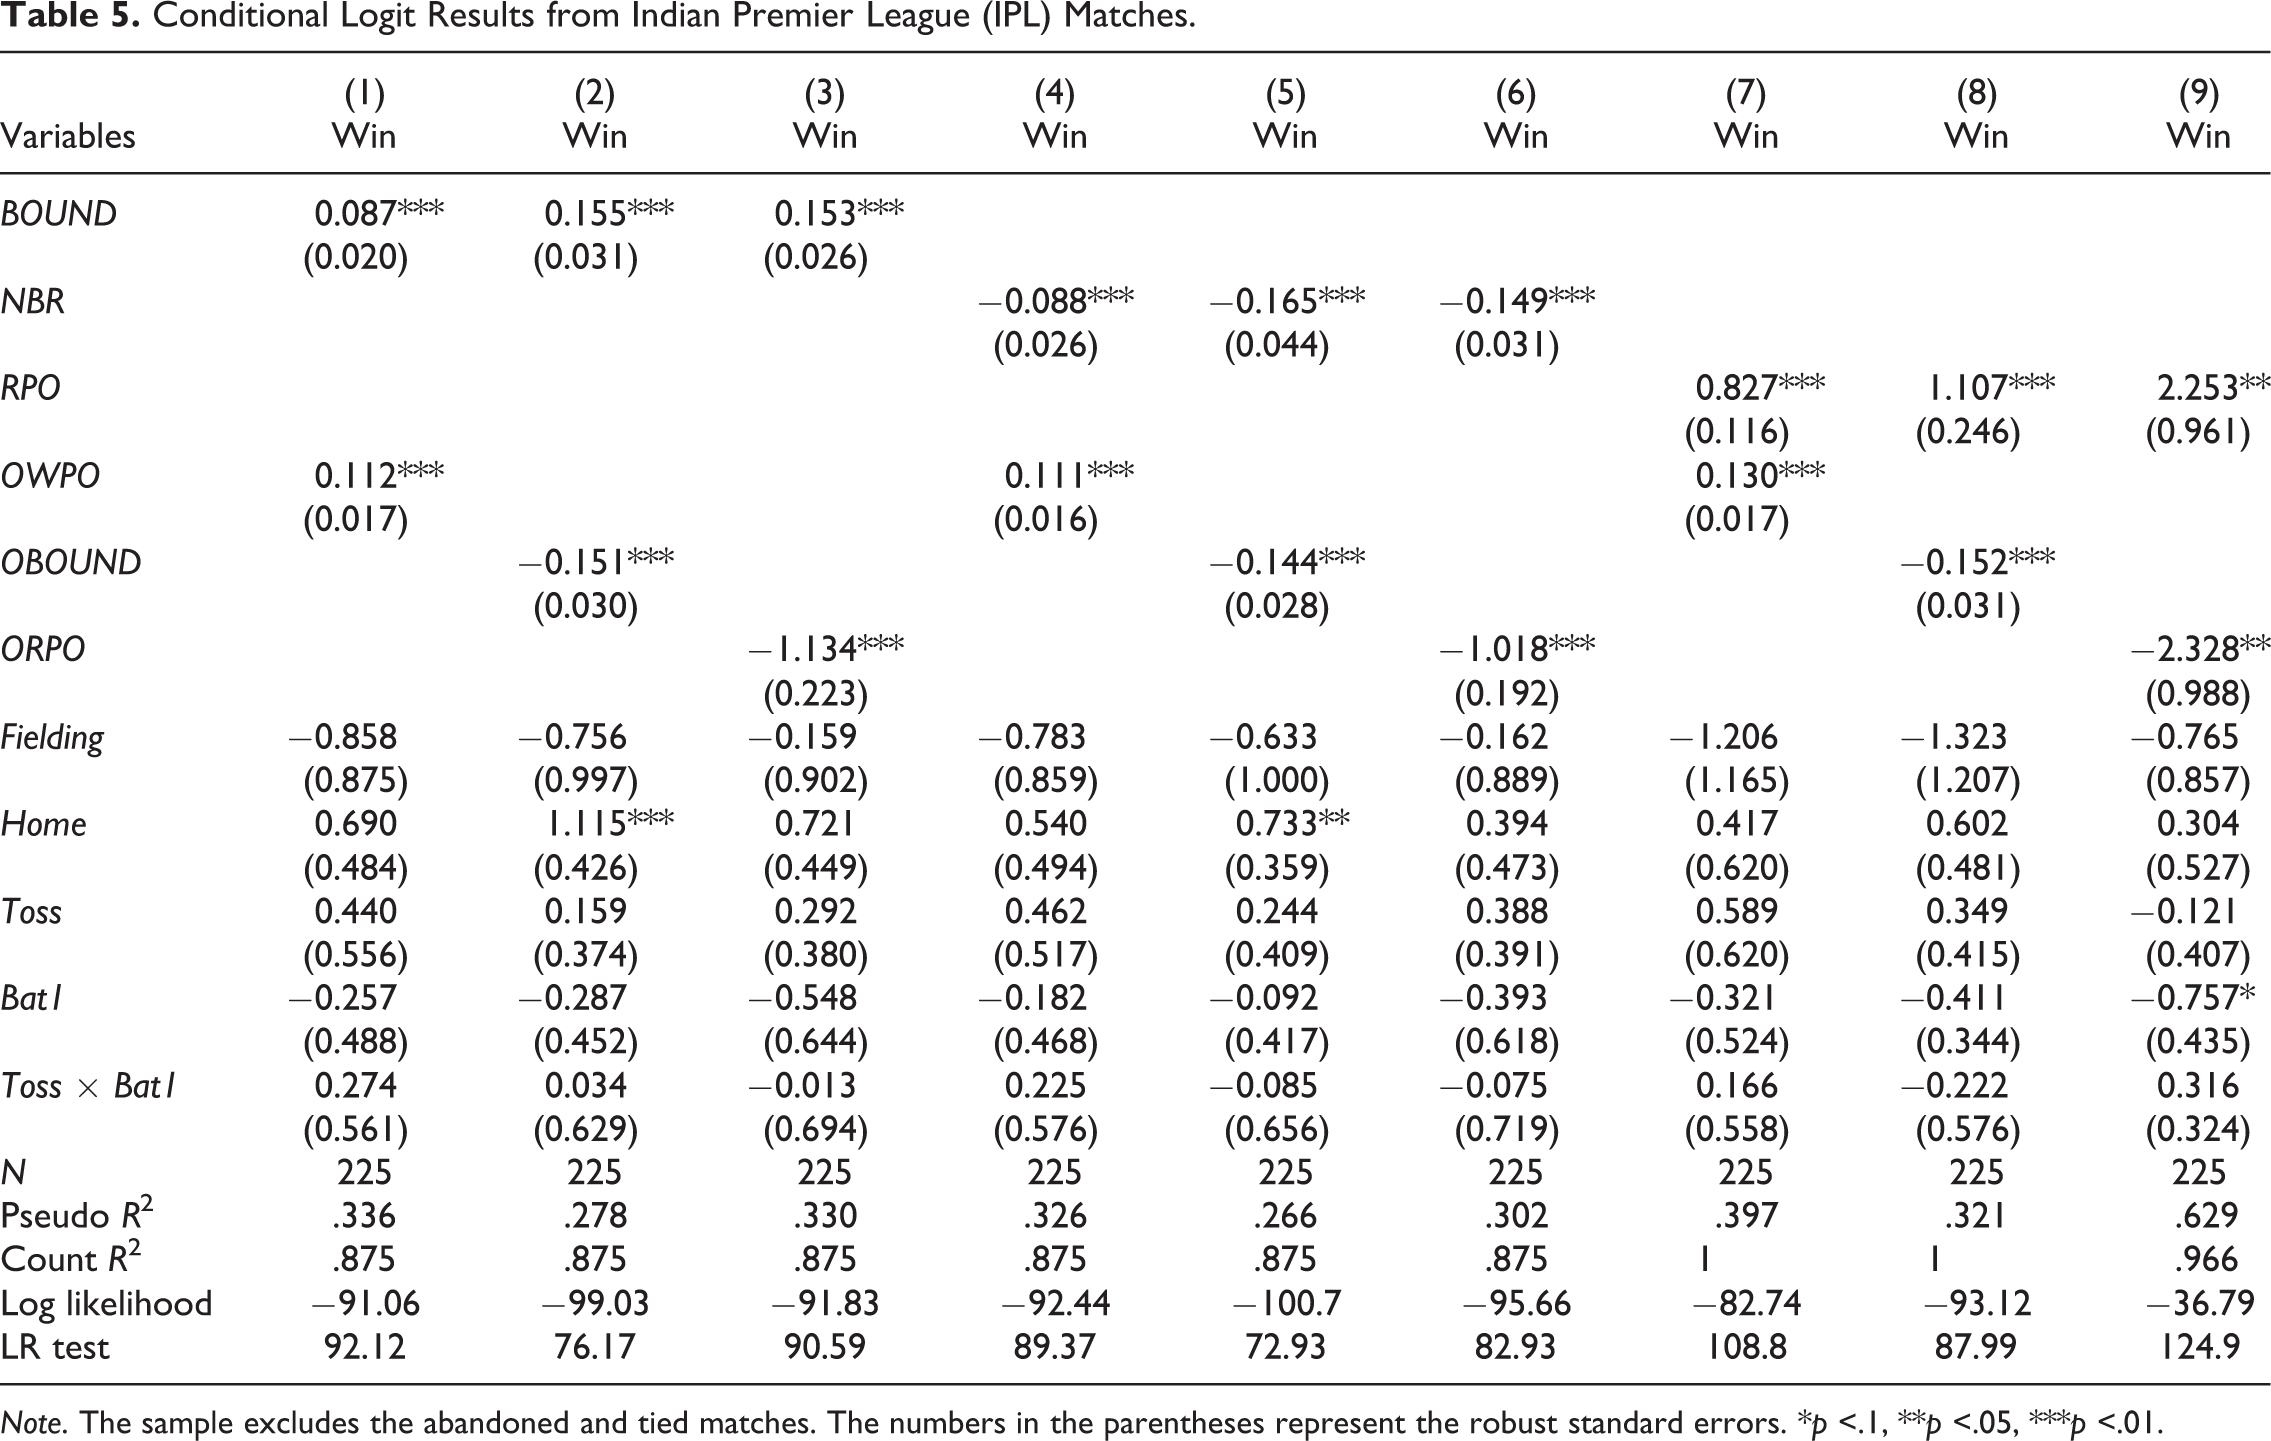
Note. The sample excludes the abandoned and tied matches. The numbers in the parentheses represent the robust standard errors. *p <.1, **p <.05, ***p <.01.
Batting Inputs
Table 3 reports the estimated coefficients for ODI matches. It is evident from columns (1) through (3) that the coefficient of BOUND enters at the 1% significance level in the regressions and has the expected positive sign. This implies that a team increases its likelihood of winning a match if it adopts an attacking batting intent, hence maximizing its total score by accumulating runs at faster pace through boundaries. However, as earlier discussed, there is a risk involved with this intent and a team might end up losing wickets quickly with a lower total score if this intent fails to succeed on the field. On the other hand, columns (4) through (6) reveal that our other variable of interest NBR enters at the 1% significance level in the regressions and has a negative impact on the likelihood of winning. By adopting defensive batting, while a team can limit its fall of wickets to bat through the entire 50 overs, it may end up with a relatively lower total score, hence reducing its chances of winning the match. Our results can be corroborated from the fact that in recent times, international teams have adopted a more attacking intent in the 50-overs format, hence attributing an increasingly important role to attacking batting. 19 Columns (7) through (9) report the results for the traditional attacking batting measure RPO. It can be seen that the variable enters at the 1% significance level and has the strongest impact on the log odds of winning. As earlier argued, this is not surprising, given that a team with higher run rate (RPO) wins the match by amassing higher total score if it bats through the entire 50 overs. This result is comparable to those of Schofield (1988) who finds a greater importance for attacking batting (RPO) in the limited-over John Player League in English county cricket.
Tables 4 and 5 report the estimated coefficients for T20I and IPL matches, respectively. As before, our variables of interest BOUND and NBR enter significantly with the expected signs in both sets of regressions. 20 The attacking batting measure BOUND clearly emerges as the best input choice in affecting the log odds of winning in this shortened 20-over format. In fact, the relative strength of BOUND increases, and the negative impact of NBR gets even stronger as we move from ODI to T20I and from T20I to IPL. Since there is relatively lower burden to limit the fall of wickets in the shorter duration of T20 cricket, there is significant premium on risk taking by adopting an attacking batting intent, thereby providing a larger target for the opposition. The premium is even higher in IPL given the financial incentives. The regression results involving the traditional batting measure (RPO) are reported in columns (7) through (9) in Tables 4 and 5. It can be seen that RPO enters significantly with positive signs in the regressions drawing support for observation made by Schofield (1988).
Bowling Inputs
While a team needs both attacking and defensive bowlers in its bowling portfolio, it is important to examine the relative importance of defensive and attacking bowling intents in different formats. In Table 3, the measure of attacking bowling OWPO enters at the 1% significance level in the regressions with the expected positive sign. This is an expected result since a team will increase its likelihood of winning by quickly dismissing the opposition whose total score will be minimal, regardless of whether the opposition bats first or second. While attacking bowling is important, given the length of the ODI innings, one may argue that whether or not the opposition gets bowled out, it is more important to restrict the opposition to a lower total score by restricting its run accumulation. This can be effectively done by restricting the boundaries scored by the opposition by adopting a defensive bowling intent. This is evident from Table 3 where the defensive bowling measure enters significantly in the regressions at the 1% significance level with the expected negative signs. Recall that a lower value of our defensive bowling measure OBOUND implies a more successful implementation of defensive bowling, hence increases the likelihood of winning. However, when compared in terms of absolute values, the attacking bowling OWPO emerges as the best bowling measure in improving the log odds of winning. 21
Similar to ODI, the attacking bowling intent OWPO in Table 4 emerges as a clear winner for T20I regardless of the chosen batting measure. However, it can be seen that while the relative strength of OWPO falls, the relative strength of OBOUND improves compared to the results of ODI. This is expected as T20 is an even shorter format where a team can still win if it restricts the opposition to a lower total without even dismissing it. On the contrary, in Table 5, defensive bowling OBOUND clearly outperforms the attacking bowling OWPO in IPL which implies that it is more important to limit the opposition to a relatively lower score total to win the match in IPL than to bowl them out. 22
Optimal Input Combination
We use the relative strength of the input measures and selected test statistics to identify the optimal combination. Looking at the strength of the batting and bowling inputs in columns (1) through (6) in Table 3, attacking batting and attacking bowling intents clearly emerge as the optimal batting and bowling combination for a team in ODI. A count R 2 value of .96 suggests that this combination explains 96% of the match outcomes. Similar conclusions can be drawn from the reported pseudo-R 2 which suggests that 62.7% of the match outcomes can be explained by this combination. Similar to ODI, attacking batting and attacking bowling also emerge as the optimal input combination in T20I. The reported count R 2 and pseudo-R 2 (column 1, Table 4) clearly suggest that this combination has the greatest explanatory power in determining match outcomes. In contrast to ODI and T20I, the optimal combination for IPL in Table 5 is attacking batting and defensive bowling. It can also be seen from count R 2 (column 2, Table 5) that the optimal input combination explains 87.5% of the match outcomes. 23 One of the striking features of these results is that while the optimal input combination is identical for ODI and T20I, it is different for the IPL. One possible explanation is that both ODI and T20I involve national teams where players have years of international and domestic cricketing experience and teams are developed through long-run training from professional coaches and tips from think tanks and managers. With such skilled batsmen and bowlers at its disposal, a team is expected to choose attacking batting and bowling measures where the respective objectives are to maximize run accumulation and to bowl out the opposition quickly. On the contrary, teams are a mix of domestic and a maximum of four international players in the IPL. Hence, it could be argued that the IPL teams lack the skill set and specialization that are present in a national team. Further, given that there is a premium on run accumulation, an IPL team might focus to strengthen its batting line up by recruiting international batsman and all-rounders, while relying more on local talent for bowling. Given this, one possibility might be that IPL teams lack the skill set and resources to pursue attacking bowling and in turn, focus on limiting the opposition to a relatively lower total to maximize the winning probability.
Fielding
Our article also contributes to this literature by including the fielding input as an additional explanatory variable in the model. Though Schofield (1988) considers fielding an important input in determining the success of a team, he does not test it explicitly due to lack of data. We construct a proxy for fielding as dismissals due to catches, run-outs, and stumpings as a proportion of total wickets taken. We discuss our results on the fielding variable only in conjunction with the optimal inputs. The fielding variable does not have any significant impact on the log odds of winning in ODI (column 1, Table 3), T20I (column 1, Table 4), and IPL (column 2, Table 5). In a limited-over format, a good fielding side not only plays an important role by creating better chances for the bowlers in dismissing the opposition, but it also plays a more important role in limiting the opposition’s run accumulation. However, our fielding variable is only based on the wickets resulting from fielding. Hence, it is likely that in a way it undermines the dual role played by fielding and therefore does not possess any significant explanatory power in the regressions. The construction of a fielding variable that takes its dual role into account requires a ball-by-ball analysis of each match which is beyond the scope of this article relying on aggregate match-level information.
Other Inputs
Additionally, we test the importance of toss and the presence of home team advantage for our optimal input combinations. Our empirical exercise does not provide any support for the importance of toss. Similarly, we do not find any evidence that winning the toss and batting first improves winning probabilities. 24 Finally, unlike the findings reported in de Silva and Swartz (1997), we do not find any evidence for home team advantage in ODI and T20I but find significant evidence for home team advantage in the IPL.
Predicting Outcomes: An Illustration
In this section, we provide both in-sample and out-of-sample predictions for our optimal input combination. Note that due to the nature of the estimation, as explained below, our predictions can at best be viewed as indicative and no more than an illustration. Table 6 reports the predictions for the optimal input combination using the conditional (fixed-effect) logit model. For comparison purposes, we also report the predictions using the logit estimates. The first two columns in the table refer to the in-sample predictions using the 2008-2009 data and the last two columns refer to the out-of-sample predictions using 2010 data. 25
Prediction Based on Optimal Input Combination.
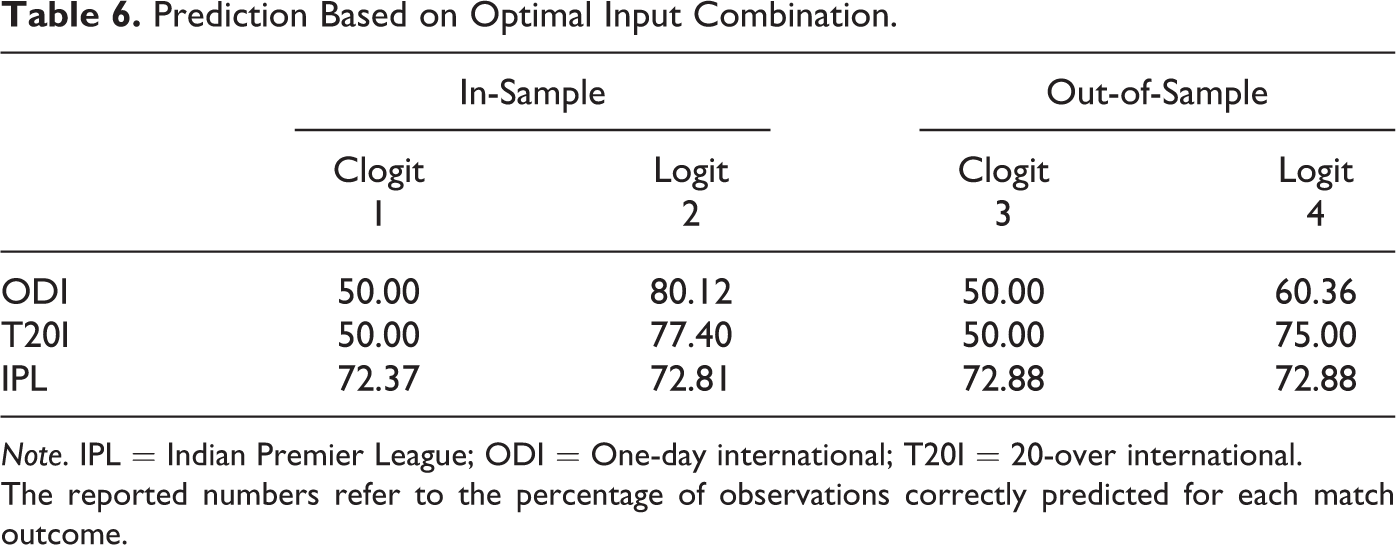
Note. IPL = Indian Premier League; ODI = One-day international; T20I = 20-over international.
The reported numbers refer to the percentage of observations correctly predicted for each match outcome.
We begin with two specific observations on our choice of models. Recall, in our sample, each match generates a pair of outcomes: One team wins while the other does not. It stands to reason that within each pair, the outcomes of a match are linearly dependent and hence the error terms are correlated. Therefore, the model chosen must account for correlation due to fixed effects (different intercept across matches) as well as correlation with other covariates in the model. The conditional logit is designed to address these issues and is thus preferred to the standard logit model. Under these conditions, the conditional logit produces more accurate and efficient estimates. Although some variant of the conventional logit model may be used (e.g., adding match dummies as covariates in the model), these require extremely large data sets.
Second, the results in Table 6 were derived from postestimation procedures. However, in both models, the postestimation procedures make the restrictive assumption that the estimated model has no fixed effects (i.e., the intercept is the same across all observations). This assumption is inherent in the logit model which, as already pointed out, will provide less efficient estimates. In terms of prediction, we find that in many instances the logit model outperforms the conditional logit model. This may partly be due to the fact that although the logit model does not include match-fixed effects, it does incorporate team-fixed effects through the team dummies. 26 In spite of the fact that predictions are not as precise as we would like them to be, we feel that this exercise is instructive.
Table 6 shows that while the conditional logit model successfully predicts 50% of the match outcomes for ODI and T20I, the logit model predicts more than 80% of the match outcomes for ODI and more than 77% of the outcomes for T20I for 2008-2009. This can be attributed to the fact that the logit controls for team-fixed effects using team dummies, whereas the conditional logit does not, resulting in lower prediction of outcomes. The out-of-sample predictions for 2010 using conditional logit model have remained steady at 50% for both ODI and T20I. However, the predictions for 2010 using logit are relatively lower at 60% for ODI and are fairly stable at 75% for T20I in comparison to their in-sample counterparts. One possible explanation for the low out-of-sample logit predictions for ODI may be related to greater variation in team quality arising from a number of factors related to coaching, team composition, and the increased participation of other teams over time. Contrast these results with those of the IPL where both models correctly predict almost 72% of the in-sample outcomes on average. The average out-of-sample predictions are also similar around 73%. Recall that in IPL the teams are constructed through auctions where the primary goal is to win, as opposed to national teams competing in ODI and T20I where other goals such as rebuilding the team with younger players (thus compromising quality) may be important. For the first 3 years of the IPL, the teams retained their core players, so that team composition and quality remained relatively stable over the period.
Conclusion
In this article, we use the production function approach to determine the outcome of a cricket game as a function of batting, bowling, fielding, and other variables. Using data from ODI and T20 games (comprising of IPL and T20I), the article determines the optimal combination of inputs for winning games. Our empirical results indicate that a team’s best winning input is a combination of attacking batting and attacking bowling in an international (ODI and T20I) setting. Thus, while a batting team should be committed to scoring as many runs by hitting boundaries by adopting an attacking batting and combine this with bowling that aims to dismiss the opposition quickly. Given that the international players have years of (international and domestic) cricketing experience and national teams are developed over the long run through professional coaching and team strategists, a team is expected to choose attacking inputs to maximize its winning probabilities. Interestingly, attacking batting and defensive bowling turn out to be the optimal input combination in the league version (IPL) of the 20-over format. Given the strong financial incentives and rules favoring batsmen in T20, it is important to adopt an attacking batting strategy to increase the scoring rate in a game. Quite possibly, since IPL teams pool international and domestic players for a limited period only, they lack the skill set and specialization that is present in a national team; therefore it might be necessary to restrict the opposition to a relatively lower score to maximize winning probabilities. Another possibility is that given its focus on batting or all-rounders, IPL teams may not have the ability to pursue an attacking bowling strategy.
Although bowling choices differ between international and league settings, the skill sets are fairly similar across formats. Consequently, this has implications for the choices that the players will make in the future and also for the future of the game as well. Given the popularity of T20 cricket and the significant monetary benefits associated with leagues such as IPL, players will possibly prefer the shorter format. In a recent survey of 45 players conducted by the Federation of International Cricketers’ Association, 40% of the players indicated a preference to play in the IPL over their country, while 32% of the respondents reported they could retire prematurely in order to keep playing unconditionally in these lucrative leagues (Times of India, June 03, 2011). Rumford (2011b) studies this phenomenon in more detail and expresses concern over the emergence of what he calls “freelance players” and “portfolio players.” Rumford (2011b) identifies successful Test match players like Shane Bond, Adam Gilchrist, Shaun Tait, and Brett Lee as “freelance players” who he argues retired prematurely from conventional cricket in order to keep playing in the lucrative T20 leagues. He is particularly concerned about the younger generation “portfolio” players who prefer to maintain a portfolio of T20 contracts from different countries in order to obtain significant financial benefits rather than to play conventional cricket for the national team.
Rumford (2011b) also argues that this has consequences for player development. The rise of T20 leagues along with the rise of the “portfolio players” poses a serious threat to player development since these leagues have little interest in developing cricketing skills as players are pooled over for few weeks in return for large sums of money. He argues strongly in favor of a “nested” version of cricket where players grow by playing different formats in domestic cricket across the year and gradually rise from the local level to the national level. On the other hand, it is also likely that in the future, cricketing nations will have specialized teams for the different formats. In fact, it is already the case that different national squads are chosen for Test cricket and ODI. Hence, we believe that due to the considerably more aggressive nature of T20, this will lead to very different squads for Test cricket and T20 with somewhat dissimilar squads for the two shorter formats.
Rumford (2011a) argues that the success of T20 poses a threat to the future of the game itself. The growing popularity of T20 is creating a pressure on national boards to accommodate more T20 matches in both their domestic and international calendars. This threat is more serious to the 50-over cricket, given the rise of too much of “context less” ODI cricket in recent years. Further, the emergence of IPL as a lucrative model has attracted many national boards to set up domestic T20 leagues which will further crowd out other formats. 27 On the spectator side, it is sometimes claimed that T20 has made a dent in the viewership and popularity of the 50-over format of the game (see, for instance, Raghunath, 2009). In his 2011 Bradman Oration lecture at Canberra, the well-known Indian batsman Rahul Dravid referred to the empty stands in a recently concluded India-England one-day series and suggested a reduction in the number of ODI matches. He went on to say that the game itself was at a crossroad and the future needs to be thought out carefully (Dravid, 2011). Quite likely though both ODI and Test cricket will continue to exist for the purists who will prefer formats where players can demonstrate finer talents, but there might be fewer games available to watch. Moreover, since the majority of the ICC’s revenues currently derive from ODI, their decline in importance will not be immediate, though it is hard to speculate about how fast this might occur.
Footnotes
Acknowledgments
We thank the editor and two anonymous referees for their careful reading and suggestions. We also thank Areendam Chanda, Rajnish Kumar, David Paton, Abhinav Sacheti, and Arabinda Sarangi for their insightful comments on the article.
Declaration of Conflicting Interests
The authors declared no potential conflicts of interest with respect to the research, authorship, and/or publication of this article.
Funding
The authors received no financial support for the research, authorship, and/or publication of this article.