
Abstract
A couple of weeks before the 2012 Super Bowl, Andrew Lehren of The New York Times advised fans wanting tickets to be “patient,” because prices in secondary ticket markets tend to fall “precipitously” as the time to kickoff nears. Using data compiled from SeatGeek.com on more than 46,000 ticket postings in the two weeks prior to the 2013 Super Bowl and more than 18,000 ticket postings prior to the 2012 NCAA Final Four, we find that average prices decreased in the last few days prior to these events, reaching their lowest levels on the mornings before kickoff and first tipoff. This evidence seems to support Lehren's recommendation that savvy fans should wait until the last minute to buy their tickets. But, we also show that savvy fans can often find similar or better bargains much earlier in the week by searching the available inventory. The greater variation in posted prices earlier in the week implies that fans can often find better bargains by searching than by being patient, especially for super-premium seats. We discuss how changes in technology have made it easier to search for bargains, while also insuring against being left ticketless if fans decide to patiently wait until the day of the game. Both strategies—patiently waiting until close to game time versus searching early and often—can produce bargains, although we suspect that changes in technology have increased the relative rewards to searching.
Introduction
A couple of weeks before the 2012 Super Bowl, Lehren (2012) of The New York Times advised fans wanting cheap tickets to “be patient,” because “to get the lowest price on the resale market, you may want to wait until the last minute.” As evidence, he pointed to the path of prices prior to the previous two Super Bowls. Using median and minimum ticket prices from the resale website Stubhub.com, he found that prices “spiked” after the conference championship games and then fell substantially over the following 2 weeks, plunging on the day of the Super Bowl.
Does it really pay to wait? Lehren thinks so, but his evidence is not persuasive, nor can he say whether the price of a given seat really decreases over time. 1 For example, his data cannot rule out the possibility that fewer premium seats will be available on game day and that those remaining will be much more expensive. In this case, the changing composition of tickets could cause average prices to decrease at the same time that premium ticket prices are increasing.
To address the question of whether it pays to wait, we obtained data on tickets posted for resale on the website SeatGeek.com over the 17 days prior to the 2012 National Collegiate Athletic Association (NCAA) Final Four and the 2013 Super Bowl. 2 We use the data to estimate hedonic price equations to obtain the path of prices, holding the quality of seats constant. Our approach follows Sweeting (2012), who finds that the quality-adjusted price of tickets to Major League Baseball games on secondary ticket markets decreases by 60% in the month before a game.
Even if quality-adjusted prices decrease as the game approaches, it will not pay to wait if there is a greater payoff from searching for bargains in the current period. If there is significant price dispersion, then savvy consumers might be better off searching for great deals among the existing ticket postings than waiting for average prices to decrease. Three innovations associated with the Internet have increased the return to searching. First, the birth of online resale markets, such as Stubhub.com in 2000, have made it much easier to compare prices and seat locations, injecting competition into markets once dominated by street scalpers (Harrington, 2009). Second, the entry of ticket aggregators, such as FanSnap.com in 2007 and SeatGeek.com in 2009, further reduced the cost of searching for bargains by collecting postings from numerous ticket venders and displaying them in one place. Third, the development of rating systems, such as SeatGeek’s Deal Score, helps buyers evaluate the value of tickets offered in the resale market, using statistical techniques akin to hedonic price regressions. Deal Score “reveals whether a ticket is a great bargain or a major rip-off” (Ritter, 2010), making it easier for consumers to identify bargains.
It may also not pay to wait because many fans must arrange to buy hotel rooms, airline tickets, and rental cars. Fans care about the cost of the entire package of goods and services, not just the price of tickets, which makes it risky to wait until the last minute to buy tickets. An increase in the price of these complementary goods may be one reason that ticket prices decrease as the day of the game approaches.
Previous studies of secondary ticket markets in sports have focused primarily on regular season games in Major League Baseball (Drayer & Shapiro, 2009; Sweeting, 2012) and the National Hockey League (Harrington, 2010), college football games (Harrington, 2009), and playoff games in the National Football League (NFL; Shapiro & Drayer, 2012). This article extends the literature by examining ticket resale markets for the Final Four and the Super Bowl. Secondary ticket markets for these two mega events are unlike those for regular season games, as the participating teams are not known well in advance. As a result, the secondary ticket markets for these mega events experience unique and significant surges in activity following the determination of the participating teams via the conference championship games in the NFL and the regional finals in the NCAA basketball tournament. This additional uncertainty can make it even more difficult for buyers to identify the optimal time to buy tickets.
Most previous studies look at average ticket prices in the resale market, either at a particular time or over time, ignoring the distribution of posted prices by sellers offering similar seats. In this study we look at both. We compiled a unique data set from more than 18,000 ticket postings for the 2012 Final Four and more than 46,000 ticket postings for the 2013 Super Bowl. 3 With an eye toward the broader question of whether it pays to wait, we use the data to address several other questions: When and to what extent do ticket prices decline? Does the path of prices vary with ticket quality? Do patterns in the secondary ticket market vary across the two events? Are bargains available early on or only late in the period?
Paths of Mean Price and Ticket Composition
2012 Final Four
We begin by plotting the average posted price and number of postings from March 15, the first day of the round of 64 in the NCAA tournament, through March 31, the day of the national semifinal games. Figure 1 illustrates that ticket postings for the Final Four rapidly declined following the regional finals, commonly referred to as the Elite Eight, held on the evenings of March 24 and 25.
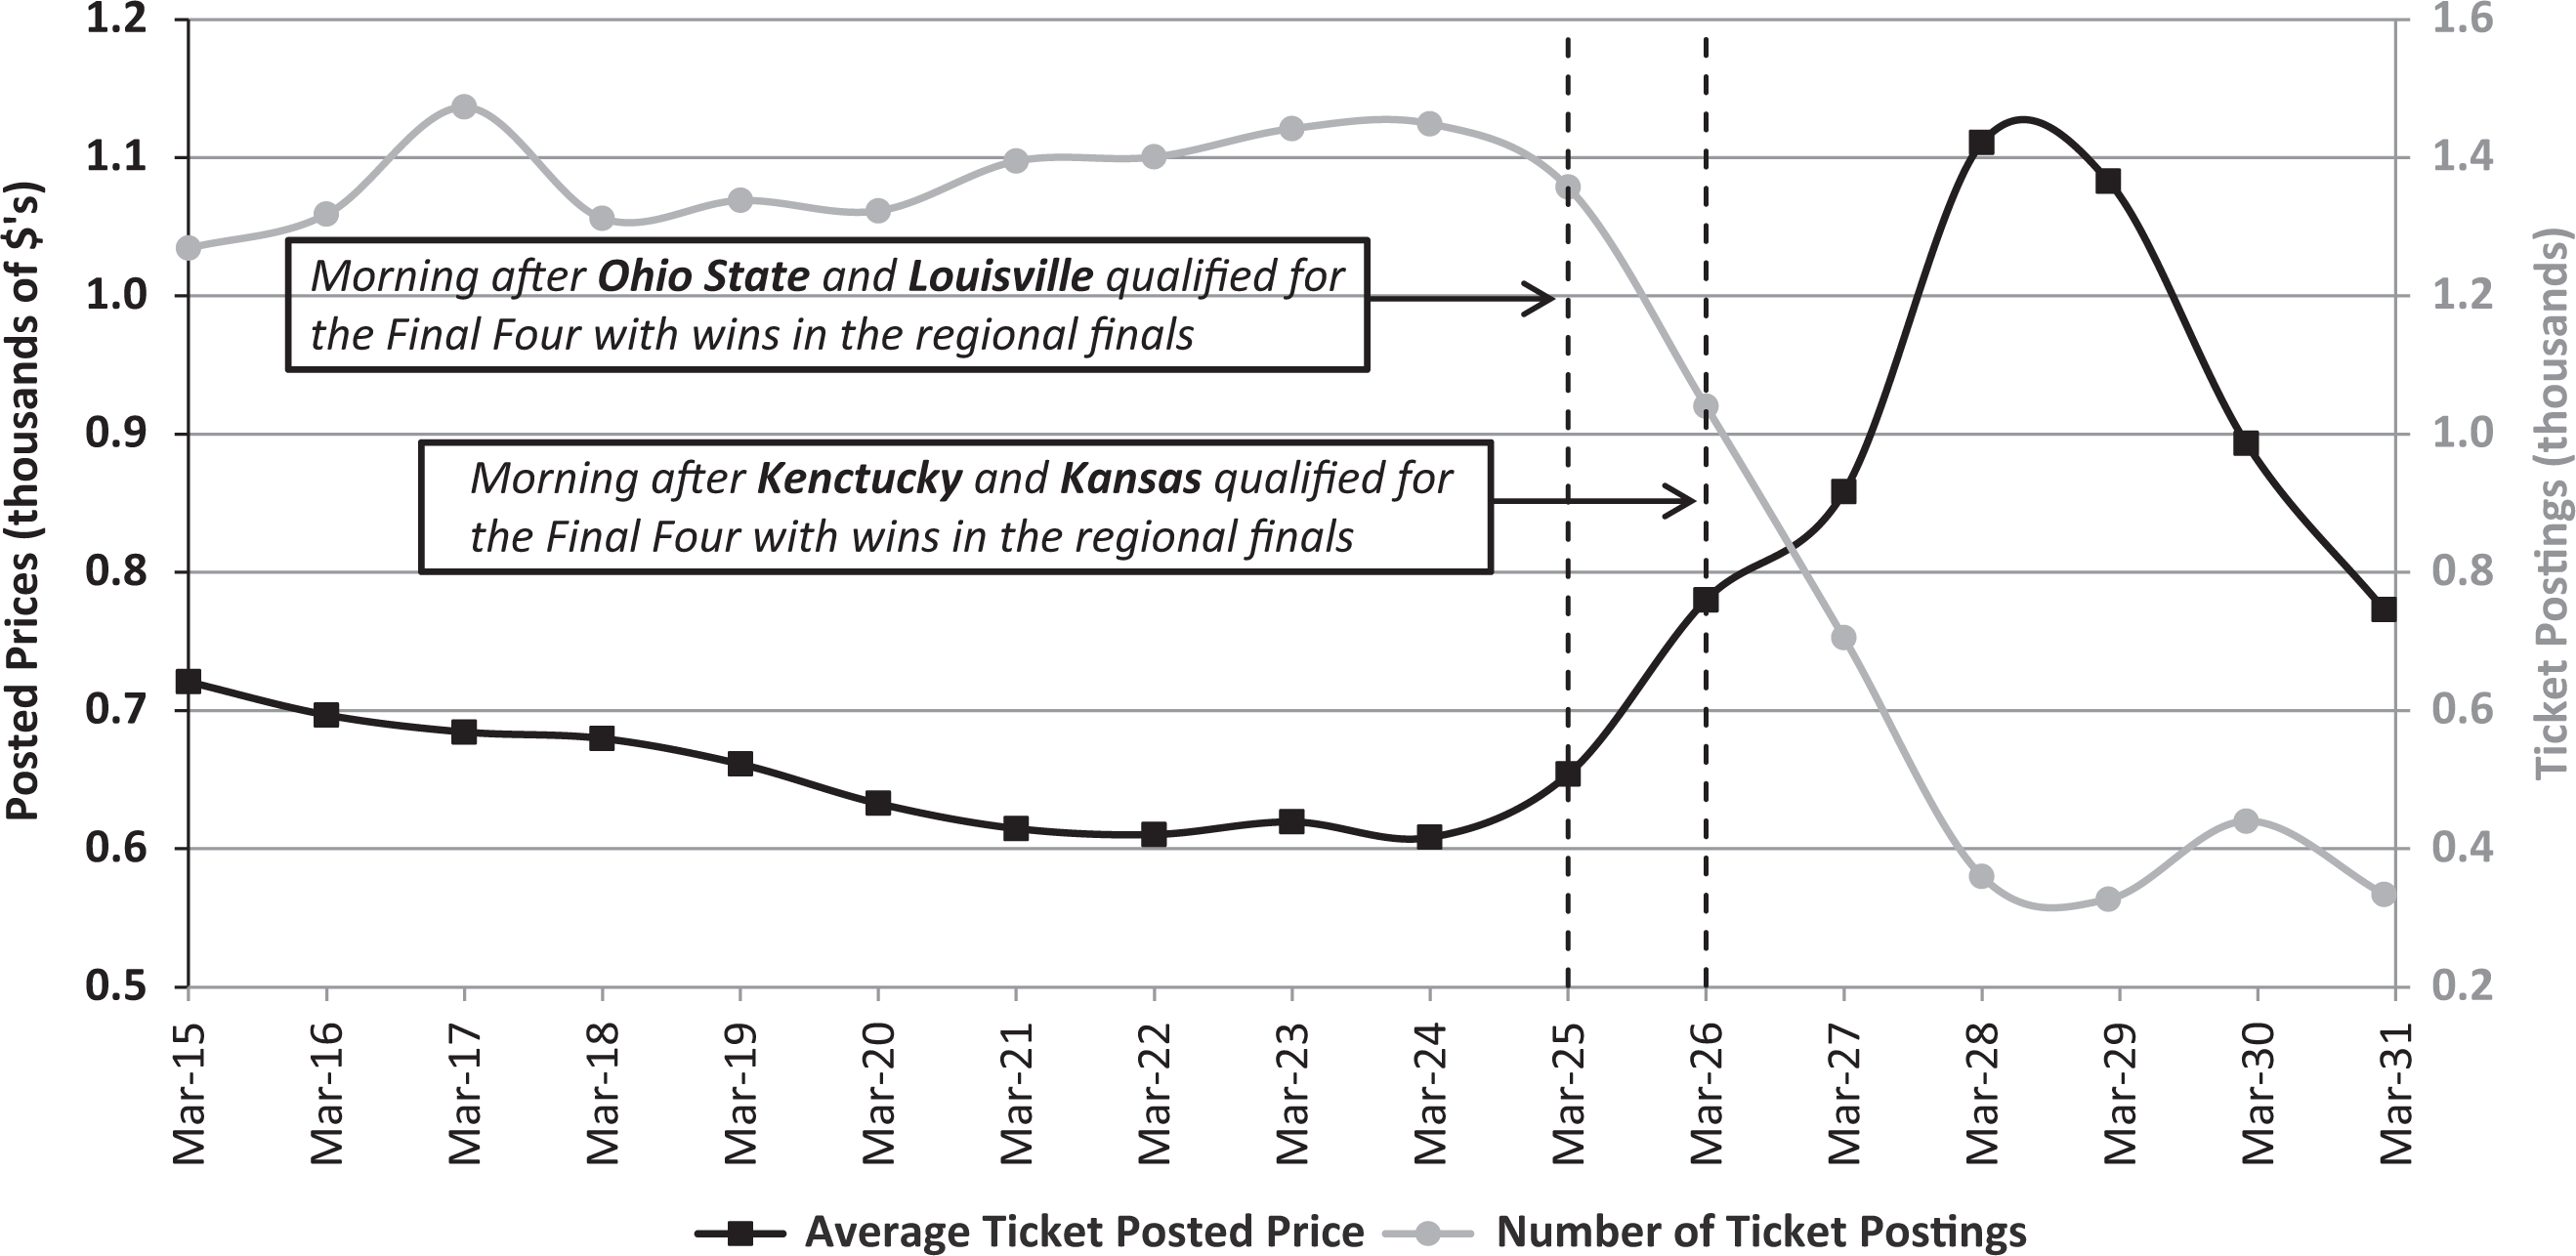
Prices and number of postings (2012 Final Four).
It is not surprising that the regional finals would trigger a decrease in postings, as demand in the secondary market would have experienced a surge from fans of the Louisville Cardinals, Kentucky Wildcats, Kansas Jayhawks, and Ohio State Buckeyes—teams that secured births to the Final Four with victories in the four regional finals. There would also be an increase in the supply of tickets, as some fans of teams that lost in the Elite Eight, who had bought tickets in case their teams won, offered to sell them on the secondary market. Hence, the number of ticket postings in the secondary market decreased rapidly, as tickets moved out of the pockets of brokers or of fans no longer interested in attending and into the hands of fans of teams that qualified for the Final Four.
The effect of the victories in the regional finals on the price of tickets in the secondary market is theoretically ambiguous. In this case, prices rose; but they do not have to, and certainly, they do not have to rise as much as they did in 2012. If four teams with rabid fans are defeated by four teams with tepid ones, it is possible that prices could fall, as the increase in the supply of tickets offered by fans of the losing teams could exceed the increase in demand by the fans of the winners. Comparing the price changes that occurred in 2011 and 2012 illustrates the dependence of the change in posted prices on the makeup of the Final Four. In 2011, two major basketball programs, the University of Kentucky and the University of Connecticut, were joined in the Final Four by two mid-major programs, Butler University and Virginia Commonwealth University. While two Cinderella teams qualifying for the Final Four makes for good drama, neither team had the national following of a major program. Contrast this with the 2012 Final Four, which included four powerhouse programs. Given the large followings of these programs, it is not surprising that Yellin (2012) of The Times-Picayune reported that average ticket prices during the week of the Final Four were 30% higher in 2012 than in 2011.
Market behavior appears to have shifted again on March 29, as ticket postings leveled off and the average posted price declined. One explanation for the decrease in posted prices as the Final Four approaches is that tickets are a perishable good. While of potentially great value prior to the event, tickets are worthless once the event is over. By the morning of March 29, the Final Four was only 2 days away. The window of opportunity to make a sale was rapidly closing for potential sellers who had unsuccessfully held out for higher prices. To avoid being left holding a worthless ticket, these sellers may have adjusted their behavior to ensure a sale. Sweeting (2012) provides compelling evidence of this behavior in the secondary ticket market for regular season Major League Baseball games, concluding that “sellers price as if their opportunity costs of sale are falling over time” (p. 1168).
Another explanation for the decrease in posted prices may be the prices of complementary goods. In addition to acquiring tickets, attending the Final Four typically requires the purchase of airline tickets and hotel accommodations. Price volatility in these complementary goods could impact demand for tickets. Shaun Hittle of the Lawrence Journal-World found that prices changed significantly during the week of the Final Four. When the local team, the University of Kansas, qualified for the 2012 Final Four, Hittle (2012) found that from Monday to Tuesday the price of flights from Lawrence, Kansas, to New Orleans rose US$500, and the price of hotel accommodations in New Orleans increased approximately US$200 per night. If the prices of complementary goods had continued to surge throughout the week, it is likely that ticket demand would have tapered off, causing ticket prices to fall.
Increasing supply due to the perishability of tickets and decreasing demand due to rising prices of complementary goods is consistent with the pattern observed in Figure 1 over the 2 days leading up to the Final Four. Despite the downward pressures on price, Figure 1 suggests that waiting until the last day to purchase tickets may not have been optimal for bargain hunters. On the morning of the first set of regional final games, the average posted price reached its minimum at US$608. After peaking at US$1111 on March 28, the average posted price fell to US$773 on the morning of the national semifinal games, still nearly US$200 higher than a week before. This does not appear to be driven by outliers, as median and minimum prices followed similar paths. However, before drawing any conclusions, we must consider the extent to which movements in average price were driven by changes in the composition of the tickets being offered for sale. In other words, is the pattern in Figure 1 being driven by a composition bias, yielding an apples to oranges, or in this case courtside to nosebleed, comparison?
Tracking average ticket quality is complicated. The many dimensions along which ticket quality can vary, such as the seat’s stadium level, location relative to the basketball court, row number, and access to amenities, makes it difficult to rank tickets by quality. Lacking a rank ordering of tickets, we began by focusing on stadium level. Figure 2 reveals the share of ticket postings on each level. 4 Over the course of the tournament, the share of ticket postings in the first and third levels increased, while the share of postings in the sixth level decreased. This is consistent with an increase in average ticket quality, as seats in the first and third levels are typically preferred to the “nosebleed” seats on the sixth level.
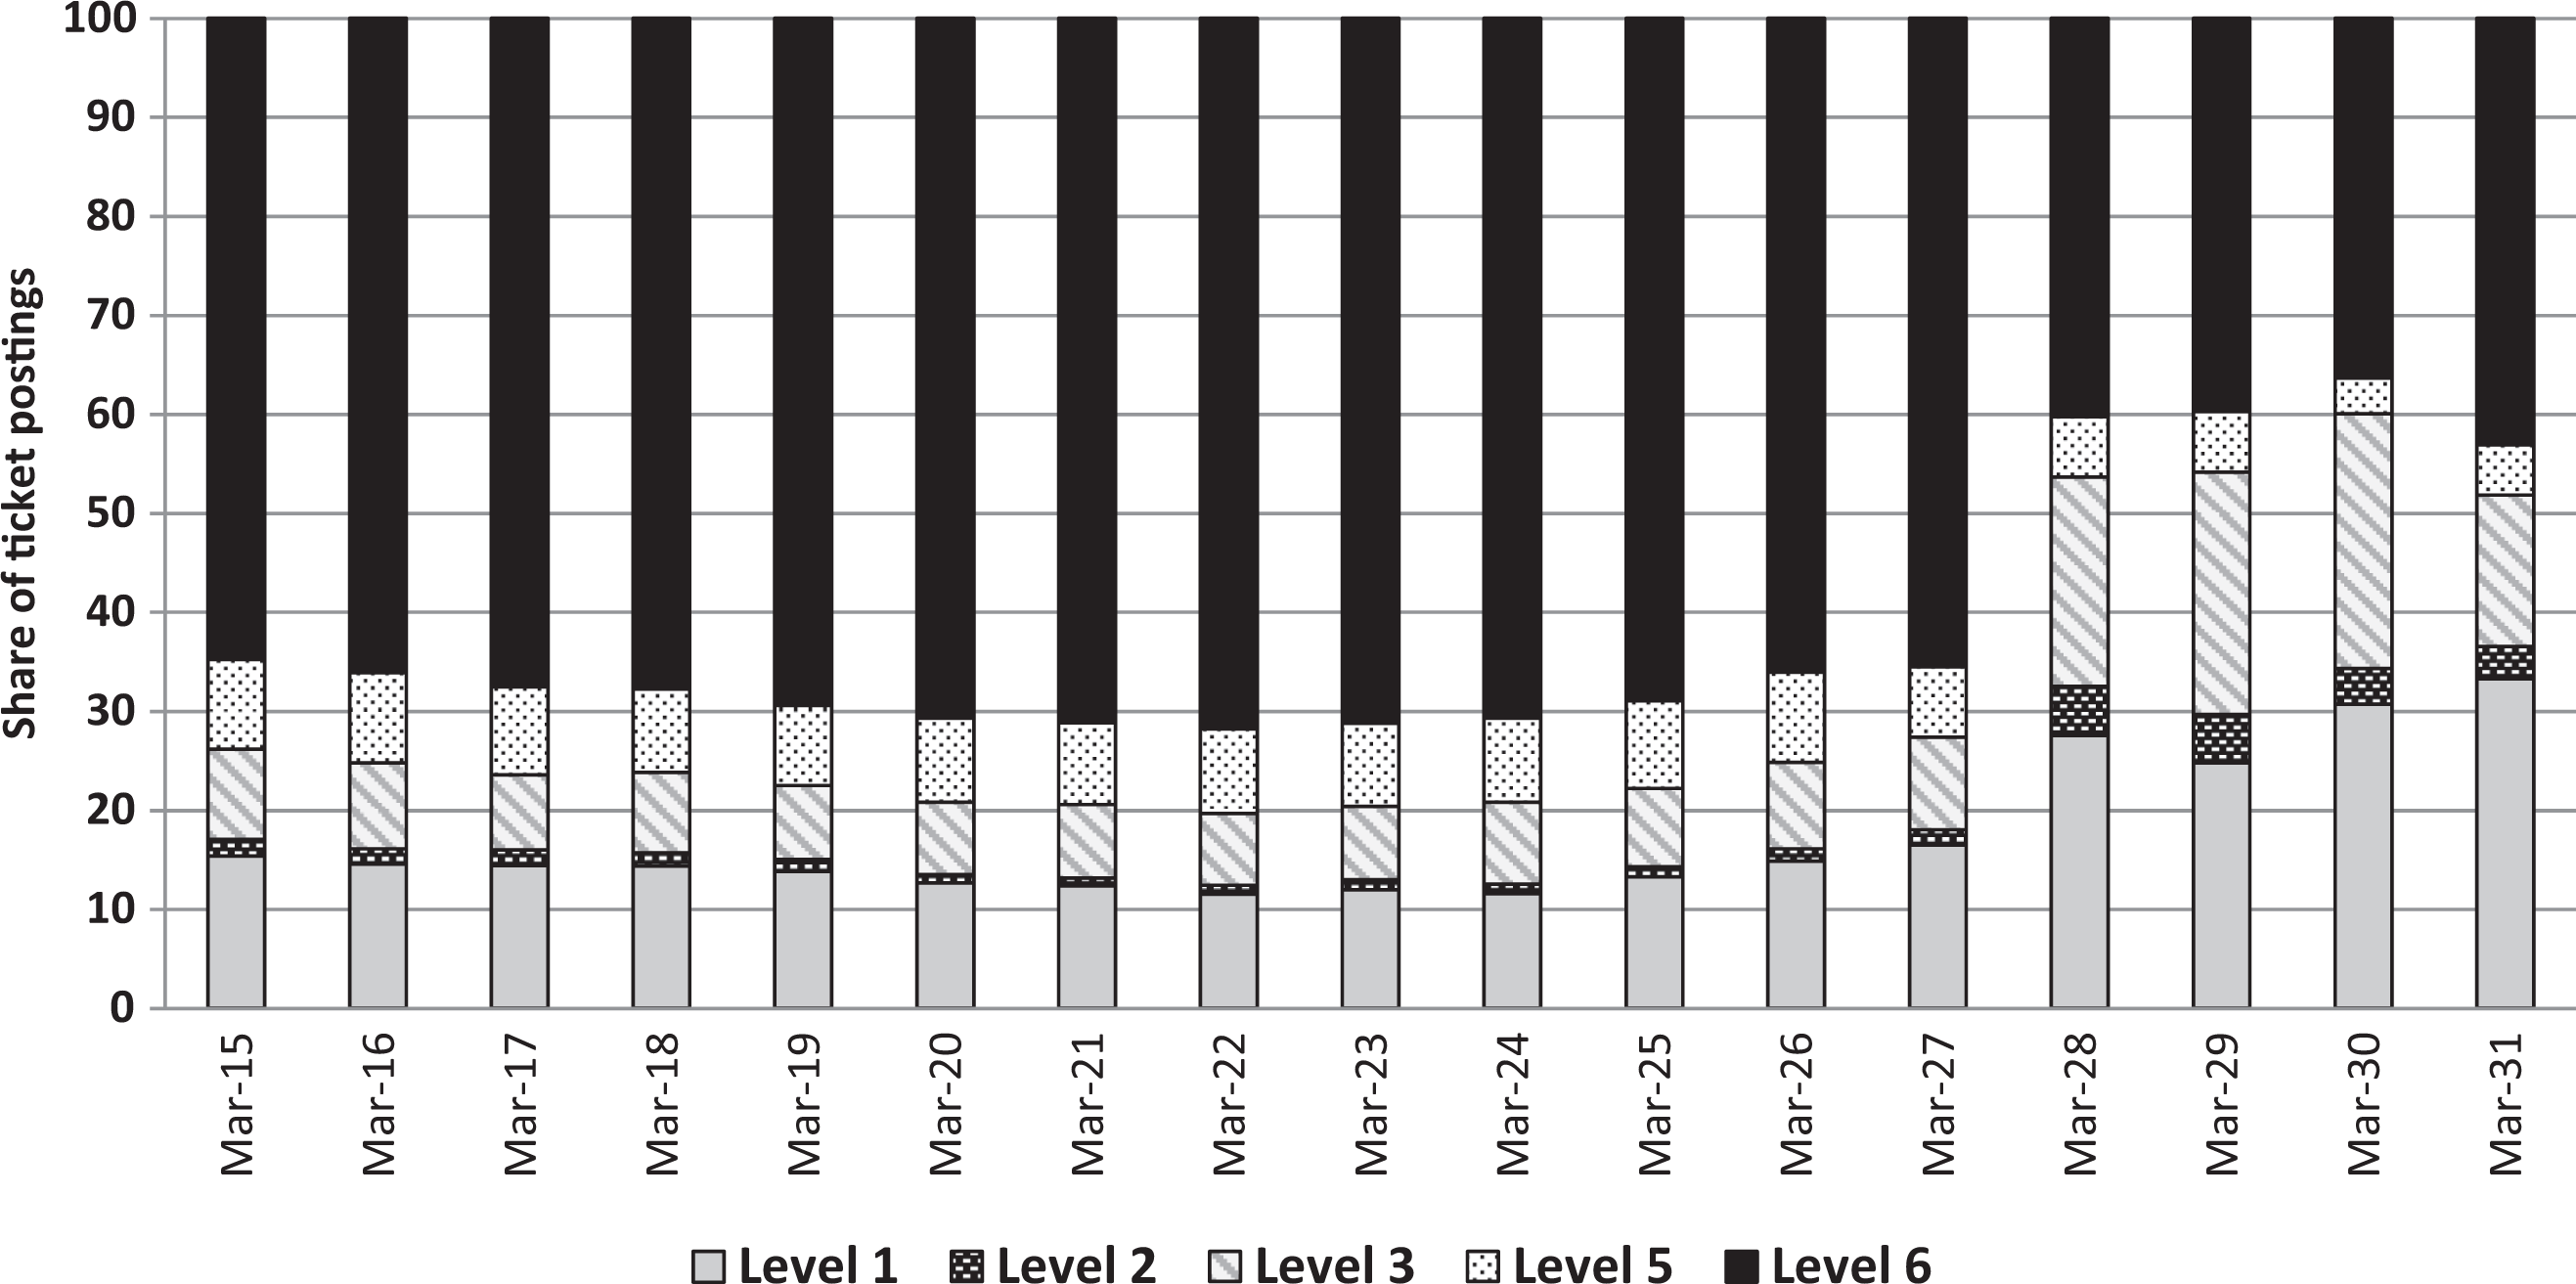
Share of ticket postings by stadium level (Final Four 2012).
Given the path of ticket composition suggested in Figure 2, it is likely that at least part of the changes in average posted price were the result of changes in ticket quality. To control for the impact of variation in ticket quality on the path of prices, we turned to regression analysis, using the following hedonic posted price model:
Posted Price Regression (2012 Final Four) Dependent Variable: ln(Posted Price).
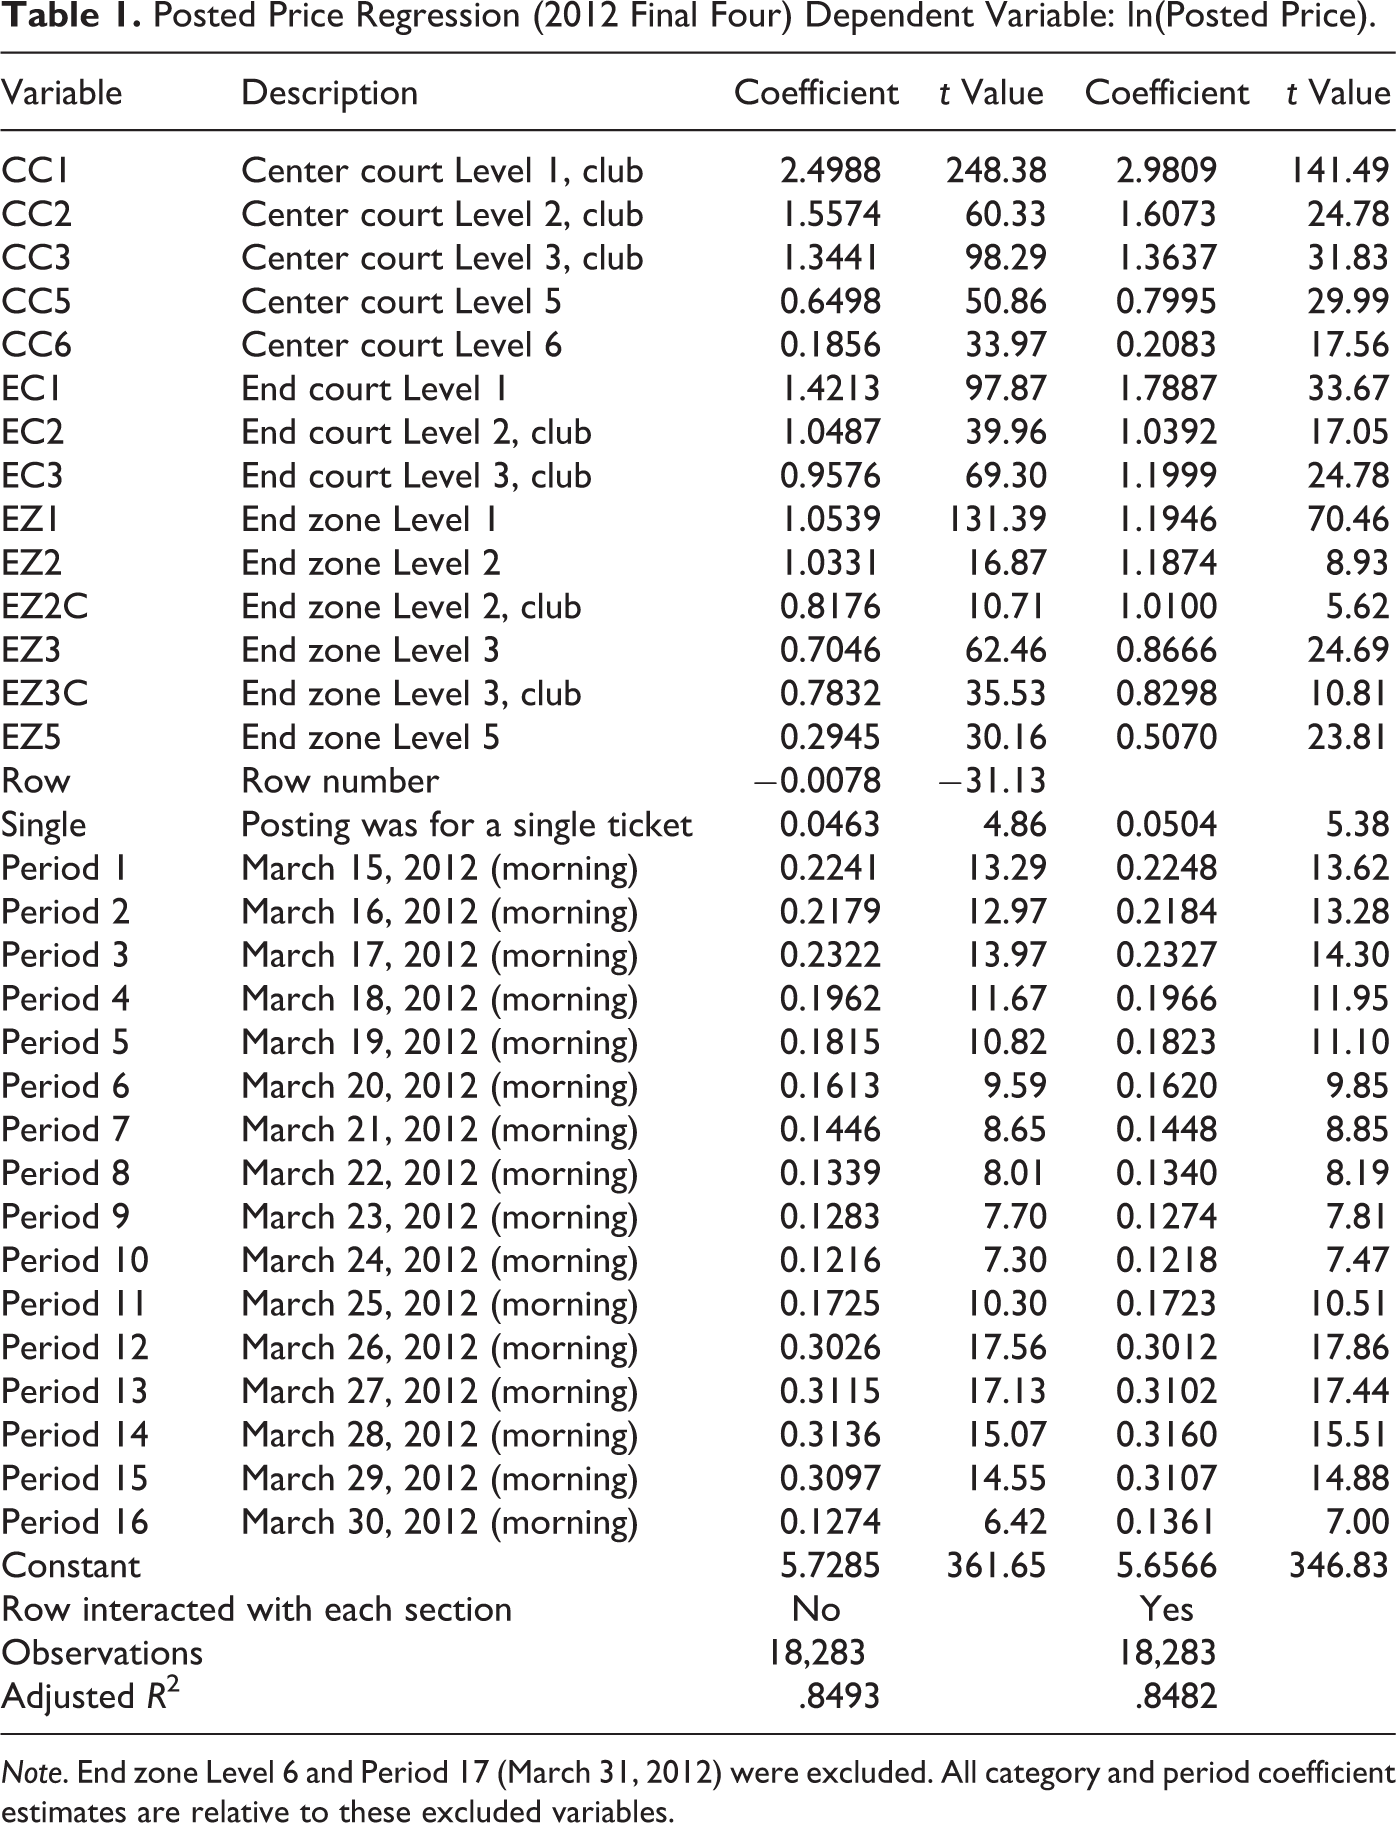
Note. End zone Level 6 and Period 17 (March 31, 2012) were excluded. All category and period coefficient estimates are relative to these excluded variables.
As expected, posted prices tended to decrease as stadium level increased, and center court tickets were more expensive than end court tickets, which, in turn, were pricier than end zone tickets typically located farther from the action. The positive and statistically significant coefficient estimates for the section variables indicate that the lowest posted prices were for end zone tickets on the sixth level, the reference group. This is not surprising, as these seats are the farthest from the action.
The period dummy variables were all positive and statistically significant. These estimates can be interpreted as differentials in posted prices relative to the excluded period, which was the morning of the Final Four. For example, the coefficient estimate for Period 13 suggests that posted prices were approximately 31.2% higher on Tuesday, March 27, than on Saturday, March 31, holding all other explanatory variables constant. These results indicate an alternative path for the average posted price. This is evident in Figure 3, where differentials calculated from the average posted prices used to create Figure 1 are plotted on the black line and the differentials obtained from the regression are plotted on the gray line.

Relative average ticket posted price (2012 Final Four).
The lines are similar in that posted prices decreased prior to the weekend of the regional finals, increased for a few days following these games, and declined again in the final 2 days leading up to the Final Four. However, controlling for ticket quality yields higher average posted prices prior to the regional finals and a smaller increase following these games. This suggests that much of the observed spike in average posted price, as illustrated by the black line, was the result of changes in the composition of ticket postings. Controlling for ticket quality also reveals that the average posted price reached its minimum on the morning of March 31, the day of the national semifinal games, rather than a week earlier as was true for the unadjusted average. Relative to March 31, quality-adjusted average posted prices were roughly 12% higher on March 24, the morning of the first two regional finals, and 30% higher during much of the week leading up to the Final Four. At least on average, it appears to have paid to buy late.
2013 Super Bowl
Purchasing Super Bowl tickets was not for the faint of heart. The average posted price in our data ranged from roughly US$2,400 to US$4,800, and the lowest posted price was US$1,212 for a ticket in one of the nosebleed sections of the Superdome. In comparison, New Orleans Saints fans could pay US$400 for a 10-game season ticket package in that same section or US$3,000 for season tickets at midfield on the first level of the Superdome. Such substantial differences in ticket prices may not be surprising, given that the Super Bowl is much more than just the NFL championship game; it is one of the biggest social events of the year. Many people with little or no interest in football may still be drawn to the Super Bowl by the accompanying festivities, such as the pregame and postgame parties and elaborate half-time show, creating a robust secondary ticket market. Figure 4 shows the average posted price and number of postings for the 17 days leading up to Super Bowl XLVII.
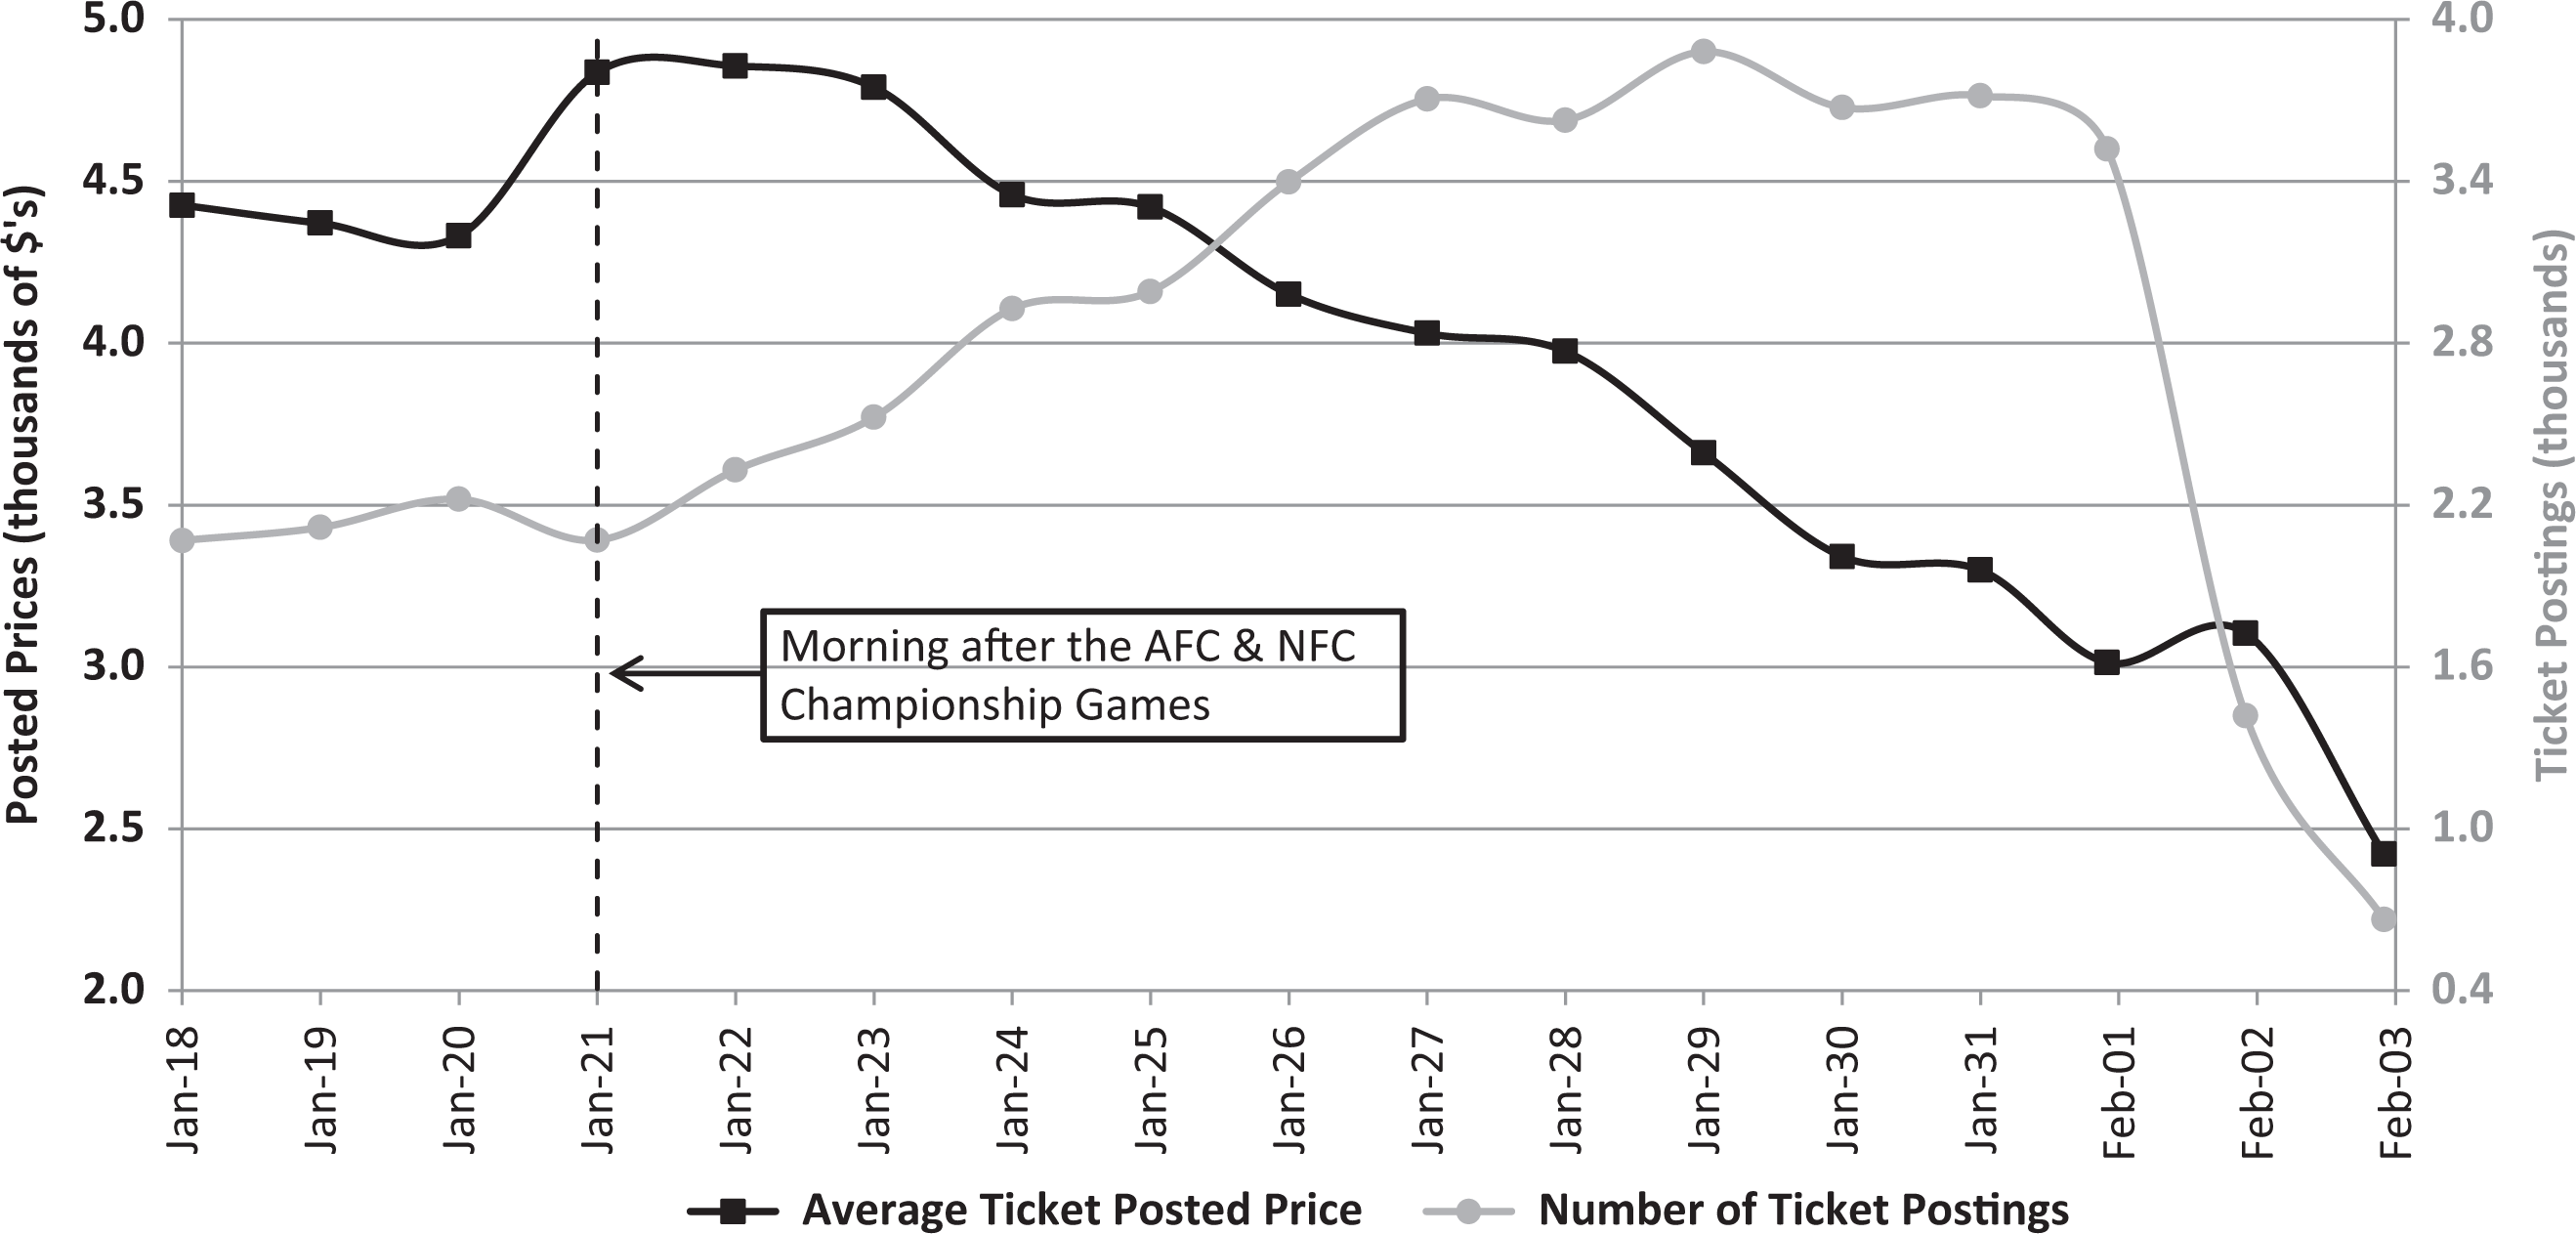
Prices and number of postings (2013 Super Bowl).
On January 20, the San Francisco 49ers and Baltimore Ravens reached the Super Bowl with victories in the National Football Conference (NFC) and American Football Conference (AFC) championship games. The following morning, the average posted price increased roughly 10%, likely the result of increased demand from fans of the 49ers and Ravens. This uptick was relatively short lived. By the end of the week, the average posted price had begun a steady descent that would persist through the rest of the period. By game day, the average posted price had fallen approximately 50% to US$2,422. Figure 5 suggests that the decline was not the result of a corresponding substantial decrease in ticket quality.
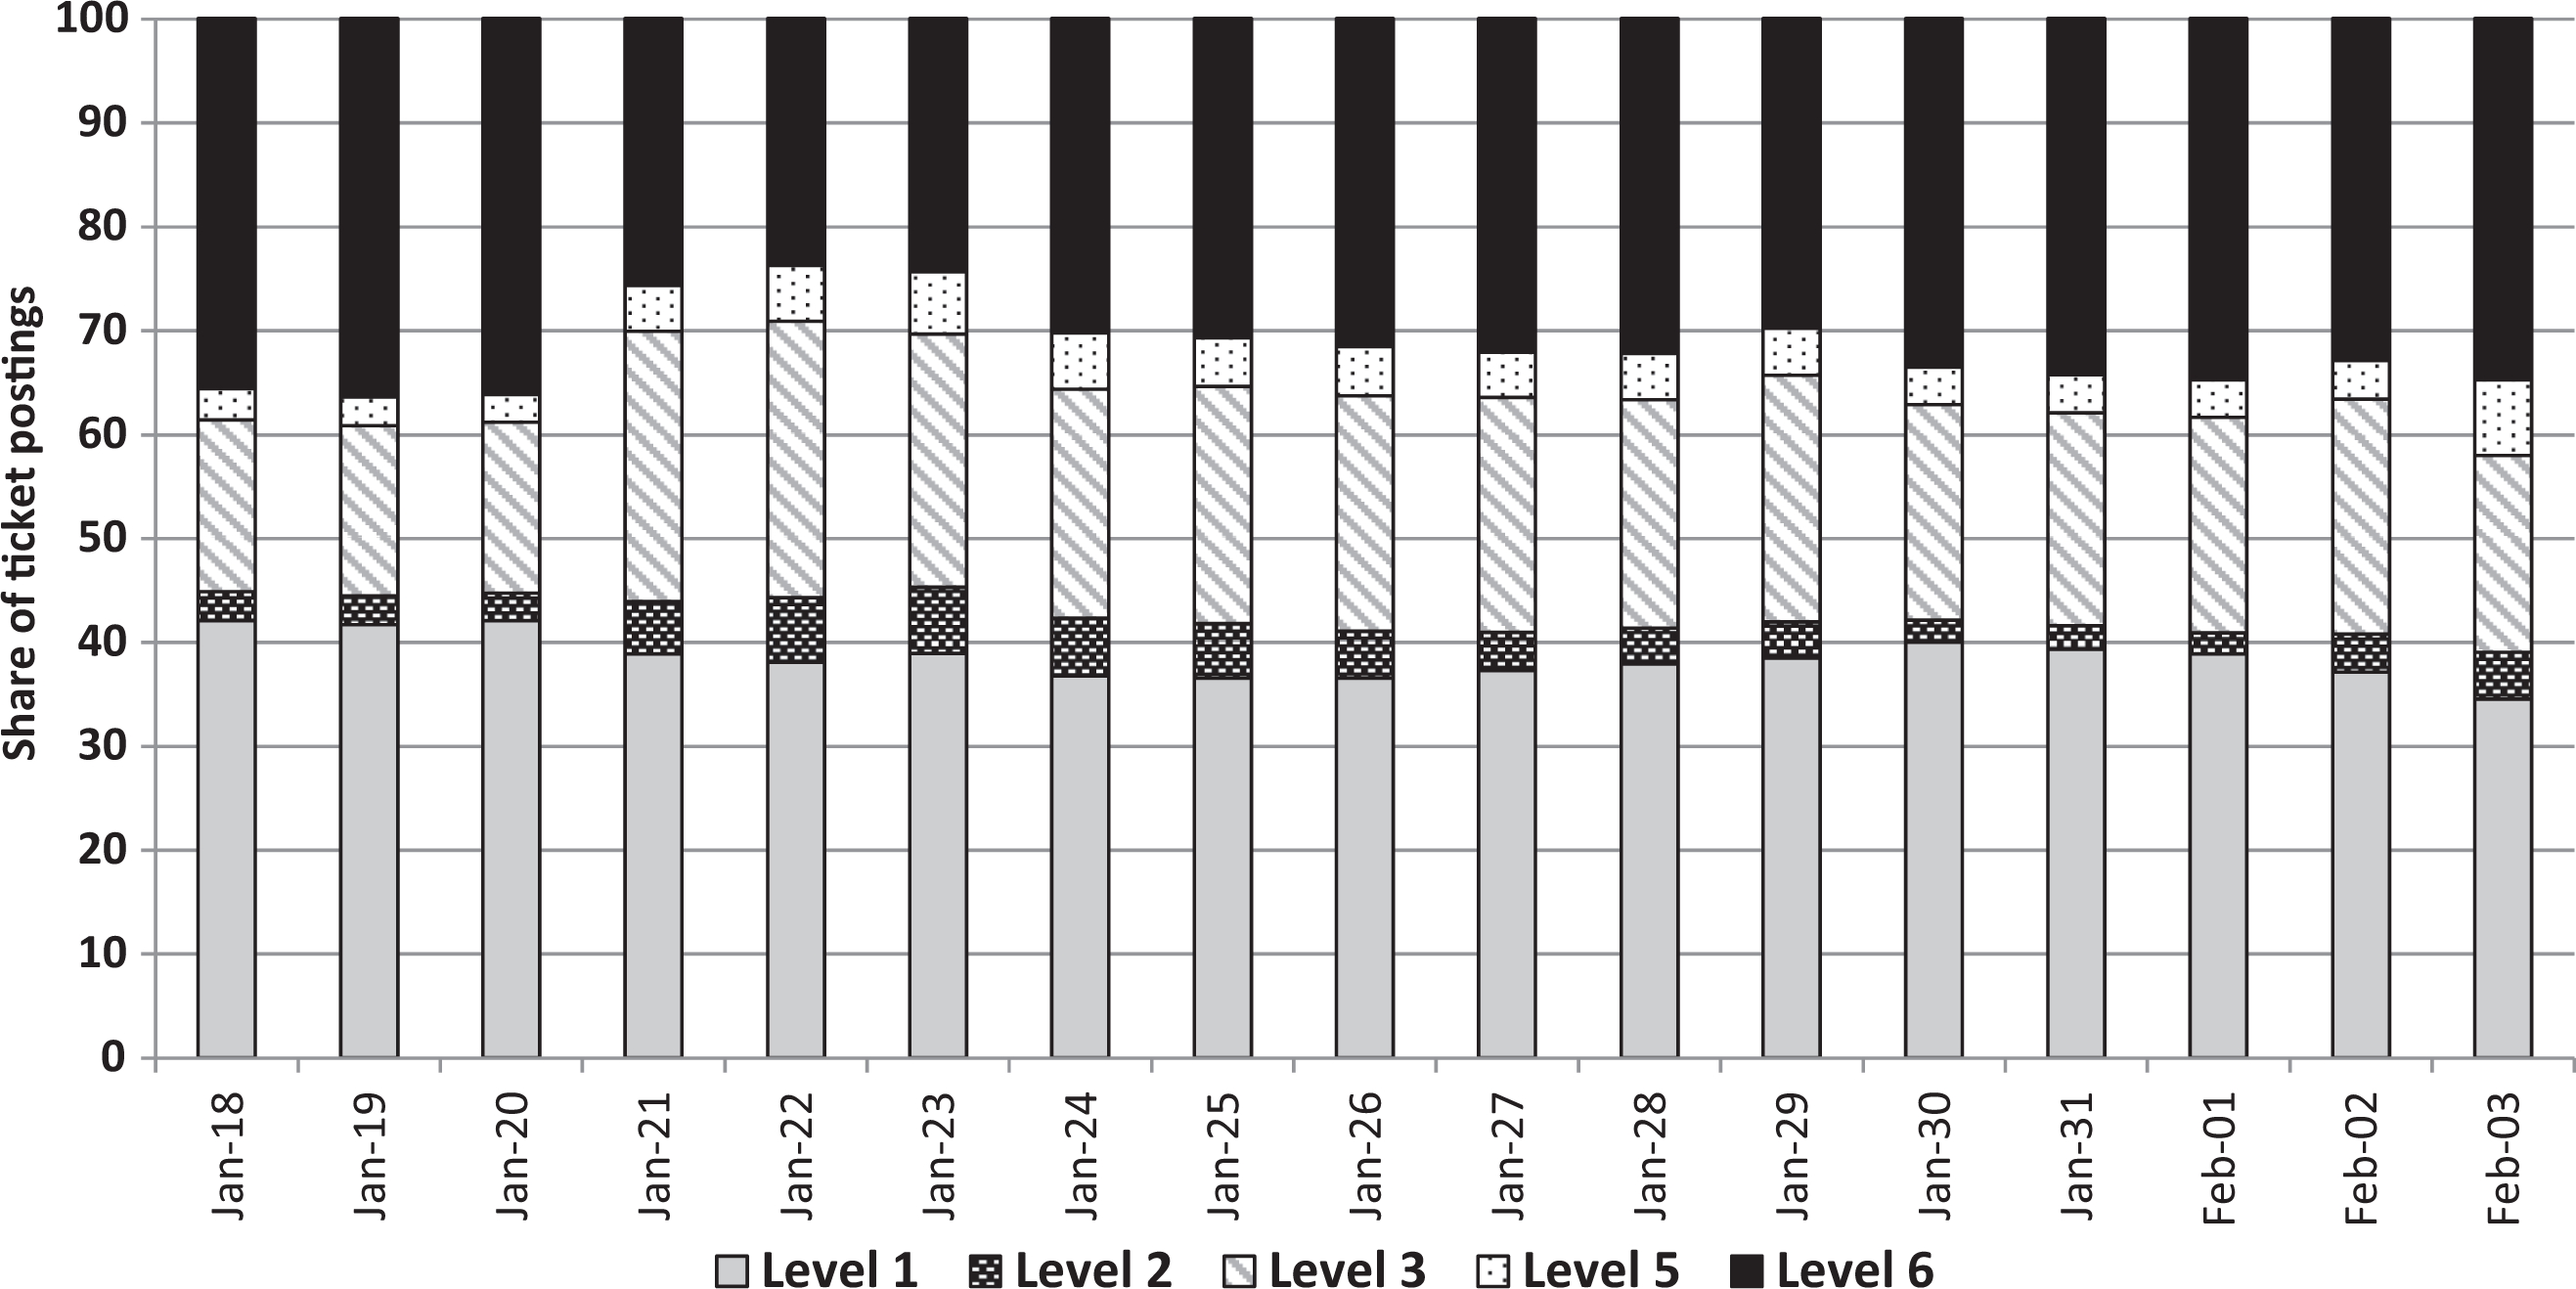
Share of ticket postings by stadium level (Super Bowl 2013).
The share of ticket postings on the first level of the Superdome remained relatively constant from January 21 to February 3, and the share of postings on the sixth level of the Superdome increased marginally, indicating only a slight decrease in average ticket quality.
Again, we used regression analysis to control for variation in ticket quality. We utilized the same specification as for the Final Four with a minor adjustment. Given the greater dimensions of a football field relative to a basketball court, there are more distinct viewing positions in the Superdome for football than for basketball. Thus, the Superdome was divided into 20 sections for the Super Bowl compared to the 15 sections used in the Final Four analysis. In estimating the model, EZ6 was again the excluded section, and the morning of the Super Bowl, Period 17, was the excluded period. The regression estimates are presented in Table 2.
Posted Price Regression (2013 Super Bowl) Dependent Variable: ln(Posted Price).
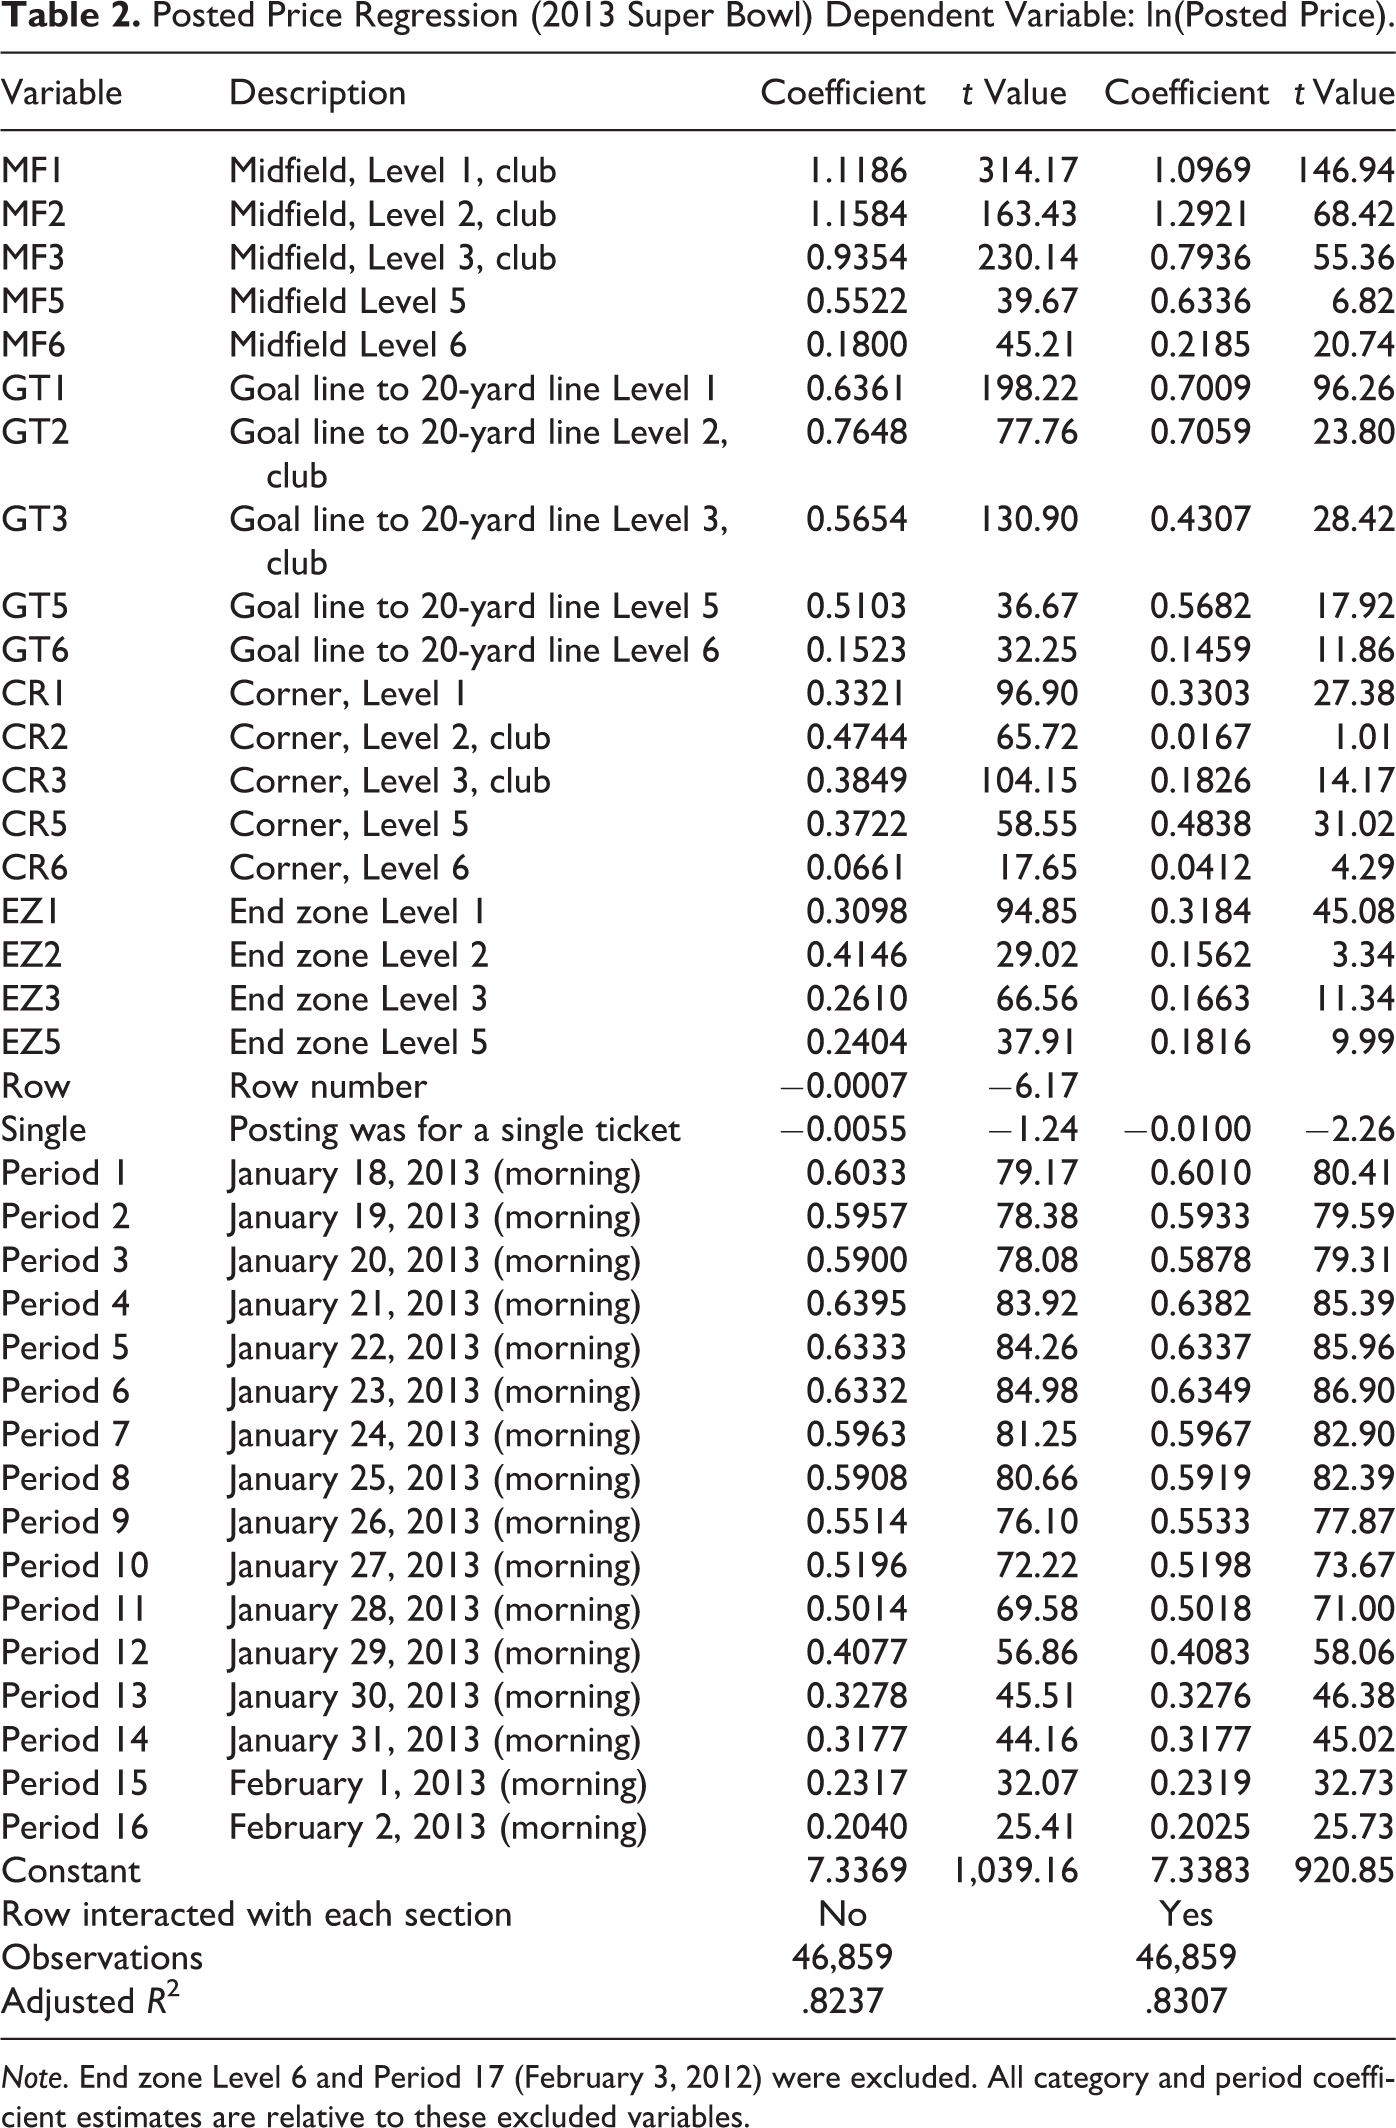
Note. End zone Level 6 and Period 17 (February 3, 2012) were excluded. All category and period coefficient estimates are relative to these excluded variables.
As expected, close proximity to the field and club seating were generally associated with higher posted prices. The coefficient estimates for the period dummy variables yield a pattern for average posted price similar to that obtained with the original, unadjusted data. Regression-based estimates in Figure 6, represented by the gray line, reveal a less pronounced bubble immediately following the NFC and AFC championship games but a similar subsequent decline in average posted price. This evidence suggests that fans seeking cheap tickets to the Super Bowl should “be patient” as Andrew Lehren advised.
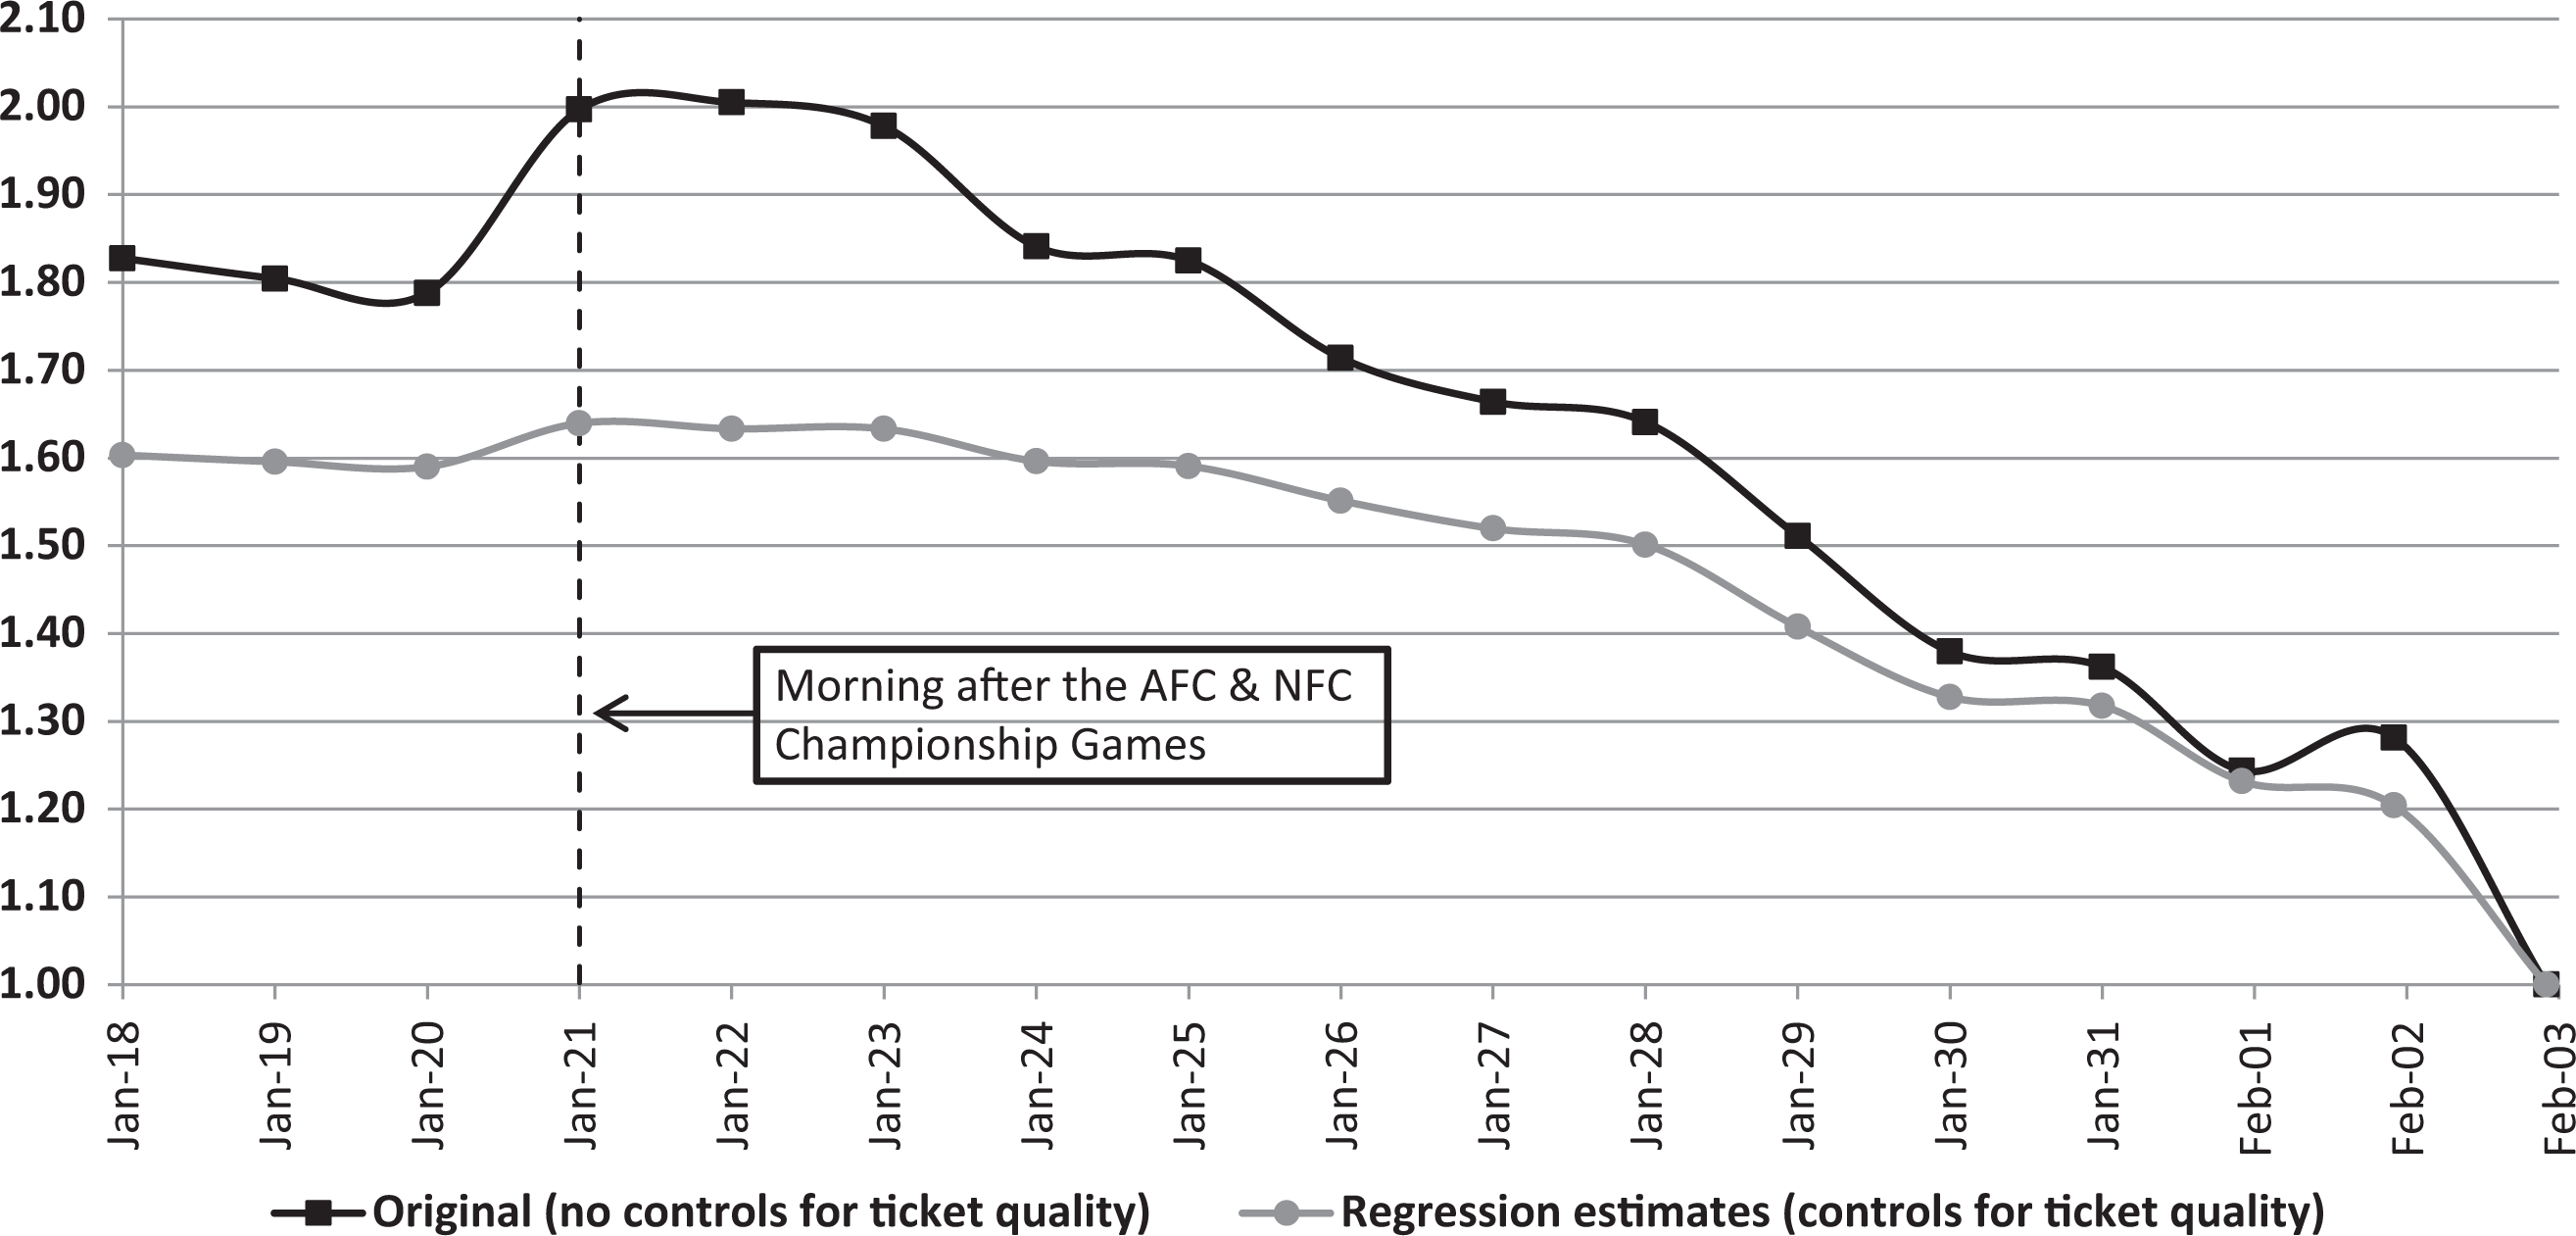
Relative average ticket posted price (2013 Super Bowl).
Comparing the Final Four and Super Bowl
Controlling for changes in ticket composition, the bottom line for ticket seekers was the same for both the Final Four and the Super Bowl: Average ticket prices were lowest on game day. Aside from this similarity, Figures 3 and 6 suggest quality-adjusted posted prices for the two events followed very different paths. For the Final Four, the average posted price trended slightly downward for the first 10 days then spiked and remained steady for a short period before descending sharply the last 2 days. Contrast this with the Super Bowl, where the average posted price was relatively constant for 3 days then increased slightly and remained steady for a short period before decreasing steadily over the last 11 days. Despite these apparent differences, the paths may not actually be so dissimilar when one considers the timing of an important aspect—the determination of event participants. While the Final Four participants were determined late in the period, the Super Bowl participants were determined early on. 7 Adjusting for this difference in timing yields greater similarity in the paths of quality-adjusted average posted prices. Over the 3 days leading up to the regional finals, March 22 through March 24, the average posted price for Final Four tickets was relatively constant. The same was true for the average posted price of Super Bowl tickets during the 3 days preceding the NFL conference championships. Average posted prices then increased for both events and remained steady at these higher price points for a couple of days before falling off. The more abrupt decline for the Final Four is likely attributable to the 6-day period between participant determination and the event compared to the 14-day period for the Super Bowl. Controlling for changes in ticket composition and differences in the timing of key events, the secondary ticket markets for the Final Four and Super Bowl appeared to have followed fairly similar posted price paths.
The same was not true for the number of ticket postings or the composition of tickets being offered for sale. Looking at Figure 1, Final Four ticket postings dropped sharply following the regional finals. Conversely, Figure 4 reveals that ticket postings for the Super Bowl increased steadily for 6 days following the conference championship games, remained relatively constant for 5 days, and then plunged the day before the game. Patterns in ticket composition also varied considerably. Figure 2 suggests that average ticket quality was relatively constant prior to the regional finals but increased thereafter, as lower level seats accounted for a greater share of total ticket offerings. Ticket composition for the Super Bowl does not appear to have varied a great deal. The most noticeable changes in Figure 5 are a decrease in the relative share of upper deck seats and a corresponding increase in the share of middle deck seats over the first few days following the conference championship games. However, these changes dissipate, so that shares at the end of the period appear fairly similar to the shares at the beginning of the period. Why the behavior of Super Bowl ticket holders differed from that of Final Four ticket holders is unclear. Regardless, it is interesting that this variation in ticket posting and ticket composition patterns did not result in divergent price paths for the two events.
Waiting Versus Searching
It is not easy to determine the best time to buy tickets. While the average price of tickets may decrease slowly over time and then plunge on the day of the game, it is also important to consider the dispersion of prices around the mean. For example, if the variance of posted prices decreases along with the average price, fans might be better off buying an unusually cheap ticket today, rather than waiting for average prices to decrease as fewer extraordinary deals may be available at that time.
Not surprisingly, there is no hard-and-fast rule for whether fans are better off waiting or searching, because it depends on the quality of seats they want to buy. To illustrate this, suppose a couple of Kentucky fans decided to buy tickets to the 2012 Final Four after their team qualified by beating Baylor University on the evening of March 25. Assume they decided to wait until the morning of the Final Four to purchase center court, lower level tickets but that they were undecided on whether to settle for any pair of seats in this section (premium tickets), or further limit their criteria to a pair of seats located in the front half of this section (superpremium tickets).
Suppose that they decided to buy premium tickets. On the morning of the Final Four, the best deal, according to SeatGeek.com, was for a pair of tickets in Row 41 at US$1,904 per ticket. Would these fans have saved money by waiting to buy their tickets until the morning of the Final Four? Figure 7 displays the posted prices of center court, lower level tickets available each morning over the 17 days prior to the beginning of the 2012 Final Four, excluding offers for single tickets. The tickets bought by the two Kentucky fans are represented by the gray square on March 31. If they had bought their tickets earlier, the cheapest prices they would have found for comparable (or better) tickets would have been US$2,433 per ticket on March 30, and US$2,537 on March 26. These postings are represented by the gray triangles on those days in Figure 7. Hence, our hypothetical Kentucky fans would have saved over US$500 per ticket by waiting until the morning of the Final Four. In this case, being patient would have paid off.
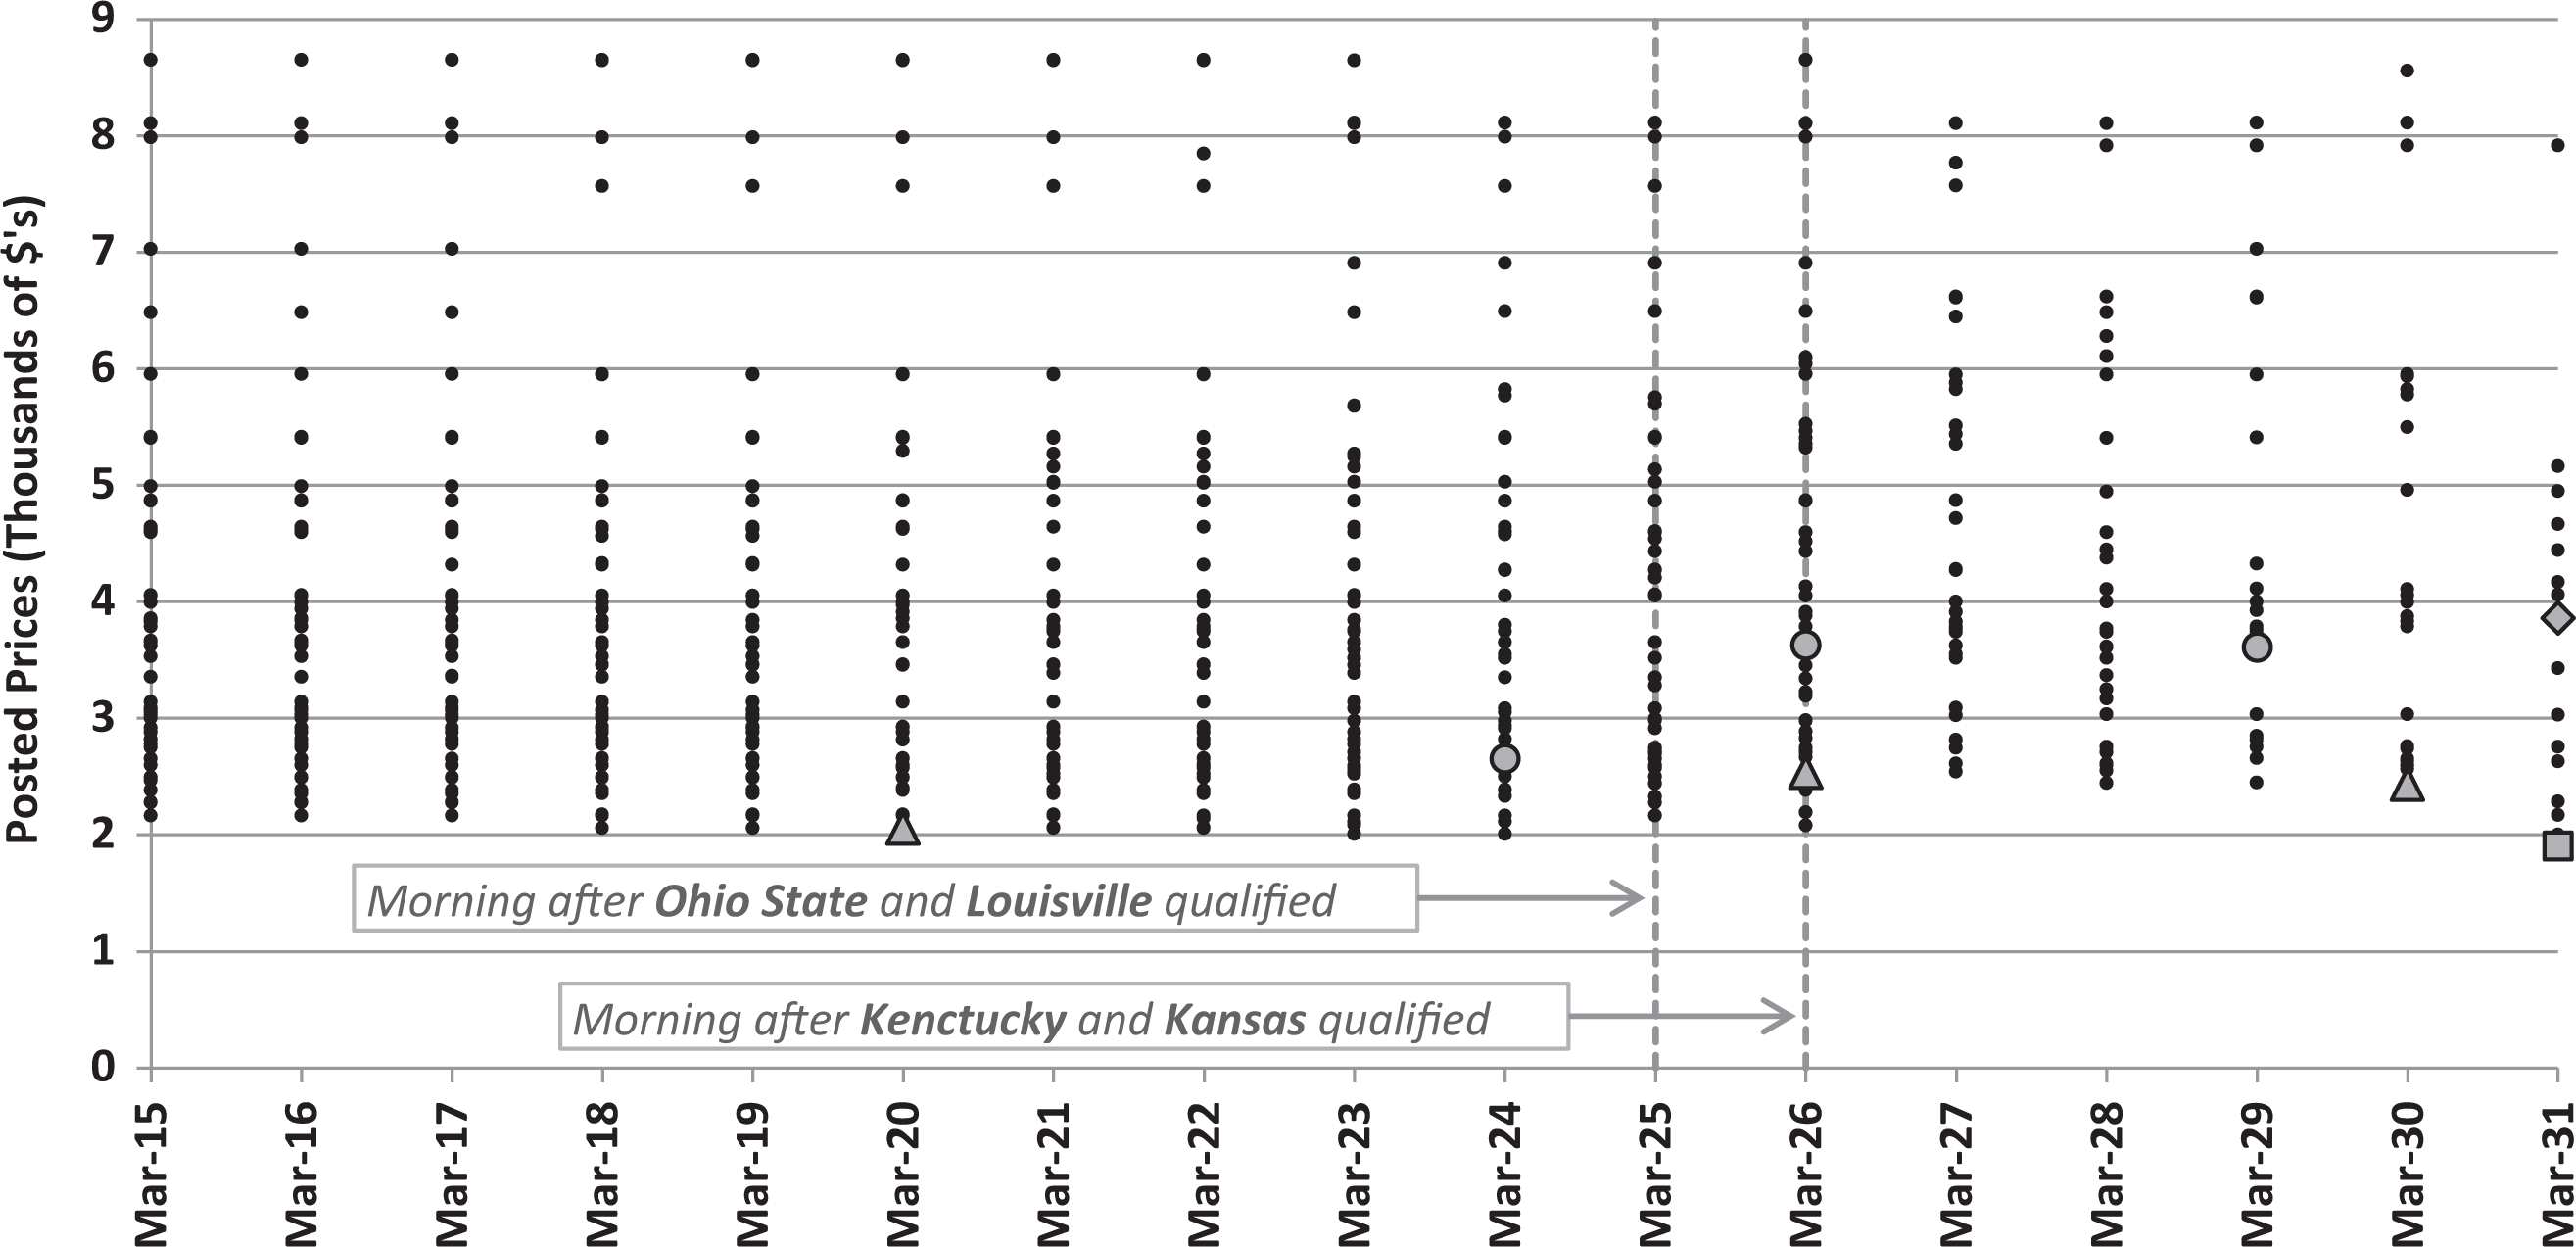
Posted prices for center-court lower level tickets (Final Four 2012).
Suppose the two fans instead decided to buy superpremium tickets. On the morning of the Final Four, the cheapest pair of center court, lower level, superpremium tickets on SeatGeek.com were selling for US$3,858 per ticket and were listed as a Great Deal. Being patient would not have paid off in this case. The superpremium tickets available on the morning of the Final Four are represented in Figure 7 by the gray diamond on March 31. On the morning of March 26, just a few hours after Kentucky clinched its berth to the Final Four, there was a pair of superpremium tickets in the same section selling for US$3,631 per ticket, which SeatGeek ranked as a Great Deal. These tickets are represented by the gray dot on March 26. A few days later, another Great Deal appeared on SeatGeek.com that they could have bought at a price of US$3,613 per ticket, which is represented by the gray dot on March 29. In this case, waiting to purchase tickets until the morning of the Final Four would have cost these fans nearly US$250 per ticket.
Whether our hypothetical Kentucky fans were better off searching for great deals or waiting until the morning of the Final Four depended on whether they wanted premium or superpremium tickets. Patience would have paid off in the case of premium tickets, but searching for great deals would have been the better strategy in the case of superpremium tickets.
The benefit of searching for superpremium tickets would have been even greater had the Kentucky fans been willing to buy them before their team qualified for the Final Four, and the reward from waiting to buy premium tickets would have been less. Tickets comparable to the Row 41 set represented by the gray square in Figure 7 were also available for US$2,057 on March 20. Similarly, tickets comparable to the set in Row 17, represented by the gray diamond in Figure 7, were available for US$2,651 on March 24. These postings are represented by the gray triangle on March 20 and the gray dot on March 24. Compared to the scenario in which the decision to purchase tickets came only after Kentucky qualified for the Final Four, these postings would reduce the benefit (or increase the cost) of waiting until the first day of the Final Four to purchase tickets. As Table 3 shows, the benefit from waiting to buy the Row 41 seats (premium ticket) would only be US$153 per ticket rather than US$529. The cost of waiting to buy the Row 17 seats (superpremium ticket) would be US$1,207 compared to US$245 under the original scenario where the decision to purchase tickets came after the Final Four teams were set.
Savings From Waiting to Purchase (US$ Per Ticket).
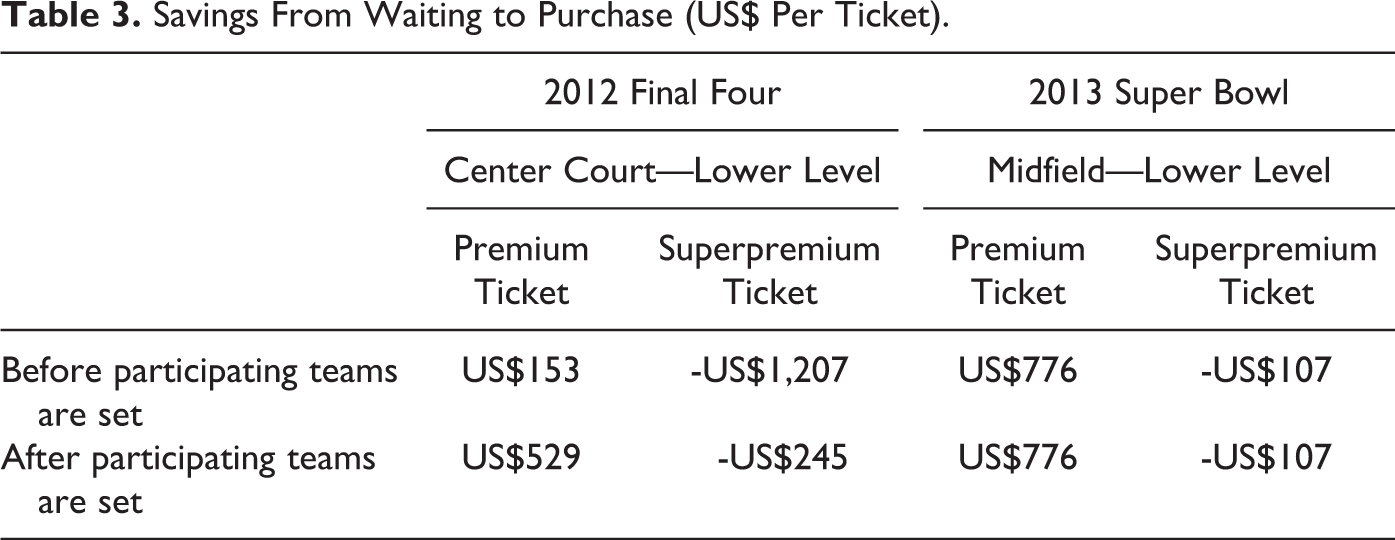
Table 3 also shows the savings from waiting versus searching for midfield—lower level tickets to the 2013 Super Bowl. For both events, there are negative savings from waiting to purchase superpremium tickets. While it may pay to wait for those fans less concerned with seat quality, it appears that searching for extraordinary deals early on may be optimal for those seeking higher quality tickets.
Conclusion
According to the U.S. Census Bureau (2007), Americans spend more than US$25 billion each year on tickets to concerts, plays, and sporting events. Many of these tickets are bought on secondary ticket markets. This means that consumers must decide when it is best to leap into the market to buy their tickets. The question they face is whether to buy their tickets quickly, search the distribution of posted prices over time for unusually good deals, or wait until the day of the event confident that they will be able to snare particularly attractive tickets at that point.
The idea for this article arose after one of us was asked whether it would pay to wait to buy tickets to the 2012 Super Bowl. We now have an answer—not always. We collected data on the posted prices of tickets offered for resale over the 17 days prior to the 2012 Final Four and the 2013 Super Bowl. For both of these events, the average posted price was lowest on the morning of the game, suggesting that it may pay to wait to buy tickets, as Lehren (2012) recommended. However, the variance in posted prices for some types of tickets also decreased, implying that there were fewer bargains on the morning of the game. While it often pays to wait, consumers who do so can be disappointed, finding fewer bargains and less variety of seats. Indeed, we present an example in which someone would have lost hundreds of dollars by waiting to buy premium tickets to the Final Four until the morning of the first game.
Our results also suggest that the benefits from searching are often comparable to the benefits of waiting and are sometimes much greater because of the existence of unusually cheap tickets. Great deals were once hard to find, being the proverbial needles in a haystack. But ticket aggregators have made it much easier to find great deals by collecting postings from numerous ticket venders and displaying them in one place. One of the aggregators, SeatGeek.com, has gone a step farther by developing an algorithm that identifies great deals, literally pointing out the needles in the haystack.
Ultimately, we believe that the optimal timing of purchases depends on the preferences of consumers and the prices of complementary goods. Consumers who want to purchase seats of a particular quality are less likely to benefit by waiting to buy their tickets. For example, we find that fans who wanted front-and-center seats in the lower level paid more on the morning of the Final Four and the Super Bowl than if they had acted earlier. Consumers who want to attend the Final Four or Super Bowl regardless of which teams are playing may also benefit from buying their tickets early, because there may be more great deals before the participating teams are set. Finally, consumers who need to buy complementary goods—hotel rooms, airline seats, and rental cars—are also less likely to benefit from waiting to buy their tickets because of increases in the price of complementary goods.
Our finding that the composition of tickets being offered for sale changes over time makes the path of mean prices a potentially misleading measure of the benefits of waiting. For example, the path of mean posted prices reaches its minimum a week before the Final Four begins, whereas it reaches a minimum on the day of the Final Four when one controls for ticket quality. Thus, consumers need to look at more than the means, implying that there is no simple answer to whether it pays to wait. The best strategy is to weigh the benefits of waiting against the benefits of searching, especially because the cost of searching has fallen due to innovations on the Internet.
Footnotes
Declaration of Conflicting Interests
The authors declared no potential conflicts of interest with respect to the research, authorship, and/or publication of this article.
Funding
The authors received no financial support for the research, authorship, and/or publication of this article.