
Abstract
The National Collegiate Athletic Association (NCAA) governs athletics at colleges and universities in the United States. Economists commonly view the NCAA as a cartel. We empirically reexamine evidence from the 1984 Supreme Court decision on football telecasts and find support for cartel behavior and evidence that this model does not fully explain. Our analysis indicates that the NCAA central organization may have behaved opportunistically by overregulating relative to what would maximize cartel net benefits. We provide a theoretical rationale and show that our empirical estimates are consistent with this behavior that occurs within the cartel framework.
The National Collegiate Athletic Association (NCAA) is a nonprofit organization widely viewed by economists as a unified cartel. 1 Member institutions vote on policies; these policies are articulated through rules and regulations administered by the NCAA central organization. The NCAA structure is a cartel of competing institutions whose joint interests are facilitated by the NCAA central organization. 2
The effectiveness of the NCAA central organization to promote joint member interests was called into question when two member institutions, the University of Oklahoma and the University of Georgia, sued the NCAA over the allocation of television broadcast rights in the early 1980s. This case resulted in a landmark decision in 1984 in which the Supreme Court found that the NCAA’s television packaging was anticompetitive and could not be justified by the NCAA “joint venture” argument. The Court also rejected the NCAA’s argument that the existing television packaging protected both competitive balance and attendance at games and that its practices were procompetitive. 3 In addition, the Supreme Court noted in its Opinion that beginning in 1977, the NCAA discontinued the practice of submitting its telecast plans to members for their approval and at the same time instituted multiyear (4-year) plans. In addition to investigating the market effects, this decision presents a unique opportunity to analyze agency behavior because it altered the rights structure in football television contract negotiations.
Economic analyses of the effects of this decision reach varying conclusions. Pacey (1985) examined legal briefs and Greenspan (1988) analyzed aggregate revenue and attendance data from college football to explore the consequences of the decision. Both found that this decision resulted in a larger number of televised games and increased benefits to consumers of football games, consistent with the predictions of the cartel model. However, these articles report other effects of the decision that cannot be explained solely by the cartel model. These articles contain evidence that the decision resulted in decreased football-related revenues to many NCAA member teams, advertisers, television networks, and television syndicators and redistributed resources among NCAA member teams. Thus, existing empirical evidence on the consequences of the 1984 Supreme Court decision for intercollegiate football contains both evidence consistent with the cartel model and evidence that cannot be fully explained by the cartel model alone. Although evidence supports the usual cartel outcome of restricted output (number of telecasts), evidence on attendance and competitive balance yields mixed results.
In this article, we take a closer look at the impact of the Board of Regents decision using alternative measures of competitive balance and empirically reexamine postdecision outcomes in terms of the composition of television broadcasts and attendance to evaluate the effects of the decision and its implications for cartel behavior. Our findings indicate that the Board of Regents decision altered the landscape in college football in significant ways and generally provide support for the cartel model. We also find some evidence of opportunistic behavior by the NCAA central organization in its role as regulator. We demonstrate that these results may not be fully explained by the cartel model but are not inconsistent with it.
Empirical Analysis
The existing empirical evidence about the effect of the Board of Regents decision contains mixed results. Our empirical analysis focuses on those areas with conflicting evidence related to the case: the number and composition of football telecasts, competitive balance, and attendance.
No research has yet examined the direct effect of the 1984 decision on the composition of college football telecasts. Because this decision focused directly on telecasts, an examination of the changes in the composition of these telecasts after the decision provides new insights into the nature of the predecision overregulation by the NCAA. Changes in the number and composition of intercollegiate football telecasts could also affect competitive balance and live game attendance. As part of its defense, the NCAA claimed that their regulation of football telecasts was necessary to maintain both the level of competitive balance and high attendance at games.
We recognize two limitations to this analysis. First, heterogeneity across the member institutions in the NCAA exists, which can create variation in objectives and decisions. We explore some of the implications of this heterogeneity for NCAA-agency behavior in our empirical analysis. In particular, we examine the diversity of member teams in the NCAA by analyzing the effects with two groups of member team principals: “power” versus “nonpower” teams. Harbaugh and Klumpp (2005) also divide NCAA institutions into similar groups. For our purposes, here, we define “power” teams as teams in the Big 10, Pacific 10 (PAC 10), Atlantic Coast Conference (ACC), Southeast conference (SEC), and Southwest conference (SWC), and Notre Dame.
Second, both television broadcasts and live game attendance are important sources of revenues for universities’ athletic departments; changes in revenues might also provide insight into the NCAA’s overregulation of intercollegiate football telecasts. Unfortunately, it was not possible to obtain revenue data for individual member teams. Other studies that have addressed revenue effects do so only in the aggregate (see, e.g., Greenspan, 1988), but this does not address how individual member teams are affected. Although data limitations do not permit us to estimate these effects, we address these later in this empirical section.
Data
Our data come from the college football seasons from 1977 through 1990, 7 years prior to the Board of Regents decision and seven seasons after. We focus only on Division I-A football, the NCAA classification composed of the largest intercollegiate football programs. The full sample consists of 137 institutions that played Division I college football in 1978. The full sample contains some teams, like the Ivy League schools, that eventually moved to Division I-AA but were Division I before that division was split into I-A and I-AA in 1980.
The vast majority of televised college football games were played between Division I schools during the sample period. The sample period includes seven seasons before the 1984 Supreme Court decision and 7 years following the decision. There were 8,467 games played between Division I teams during this period; 4,094 were played from 1977 to 1983 and 3,840 were played from 1984 to 1990. We use this period because it contains a relatively stable conference composition in Division I. There were a number of important changes to the conference structure in Division I in the early 1990s, including the establishment of two new major football conferences, the Big East and the Big XII, expansions of the Southeast, Atlantic Coast and Big 10 conferences, and the demise of the SWC. We end the sample in 1990 to avoid confounding the effects of the Supreme Court decision with the effects of these changes in conference alignment, which were clearly precipitated by the Board of Regents decision and continue to today. These changes in conferences affected intercollegiate athletics and college football telecast decisions on many margins and likely involved significant within-conference changes over time; the addition of a conference-specific effect to empirical models probably would not adequately control for the effects of conference changes, confounding the estimated direct effect of the Board of Regents decision with indirect effects related to conference changes.
The primary source of data on individual college football games is the comprehensive website College Football Data Warehouse (www.cfbdatawarehouse.com). This website contains an archive of the participating teams, date, location, and final score of nearly every major college football game ever played from the late 19th century onward. Data on television broadcasts of college football games were taken from various issues of the Report of the NCAA Football Telecast Committee for the period 1978-1983 and from USA Today for the period 1984-1990.
The data on individual games were supplemented with season-specific data on conference affiliation, total home attendance, number of home games, coaching changes, conference standings, postseason bowl appearances, and final rankings in polls. These data were primarily taken from various issues of NCAA Football, an annual publication of the NCAA. Final Poll rankings were obtained from various issues of the New York Times and USA Today.
Finally, institution-specific enrollment data were obtained from the Integrated Postsecondary Educational Data System (IPEDS), collected and published by the U.S. Department of Education’s National Center on Educational Statistics. The IPEDS Fall Enrollment survey contains detailed information on enrollment at all U.S. institutions of higher education as of October of each academic year, the approximate midpoint of the college football season.
The 1984 Supreme Court decision radically changed the property rights to college football telecasts, shifting the power to determine which teams appeared on television from the NCAA to teams and conferences. Although we do not have access to school-specific revenue data, an analysis of changes in telecasts will shed light on the effect of the decision on NCAA revenue maximization behavior.
In the period 1977-1983, the NCAA determined how many football games would be broadcast, which games were broadcast, and which networks would be permitted to broadcast college football games. Cave and Crandall (2002) discuss the related literature on television rights in professional sports leagues. In the postdecision period, schools and conferences were free to negotiate with networks, and any network could televise college football games. Given the striking differences between the pre- and postdecision environment, we first examined some basic sample statistics from our data to illustrate how college football telecasts were affected by the decision.
We restrict our analysis to regular season television appearances on national television networks or national cable stations like Entertainment and Sports Programming Network and Turner Broadcasting System. Before 1984, there were a number of additional over-the-air broadcasts and closed circuit telecasts of college football games limited to local markets, but these appearances did not produce any appreciable revenues or exposure beyond local markets. Broadcasts on networks or cable stations can be divided into two types: regional broadcasts and national broadcasts. National broadcasts were carried by all local network affiliates in the country. Regional broadcasts were carried by some subset of the local network affiliates. All games broadcast on cable stations are defined as national broadcasts.
Figure 1 shows the number of television appearances by type and year. The jump in the total number of games broadcast in response to the Supreme Court decision can be clearly seen. During the period of NCAA control of football broadcasts, there were more regional broadcasts than national broadcasts; but during the post-1984 period, the number of national broadcasts increased relative to the number of regional broadcasts. The NCAA generally negotiated 2-year contracts with broadcasters. The contract periods in the sample were 1978-1979, 1980-1981, and 1982-1983. From this figure, the NCAA was increasing the number of telecasts even before the 1984 decision, perhaps in response to the Board of Regents case which was filed on September 8, 1981. However, the almost 3-fold increase in the total number of telecasts after deregulation is striking. This increase in the number of telecasts has been interpreted as a direct result of the 1984 Supreme Court decision.
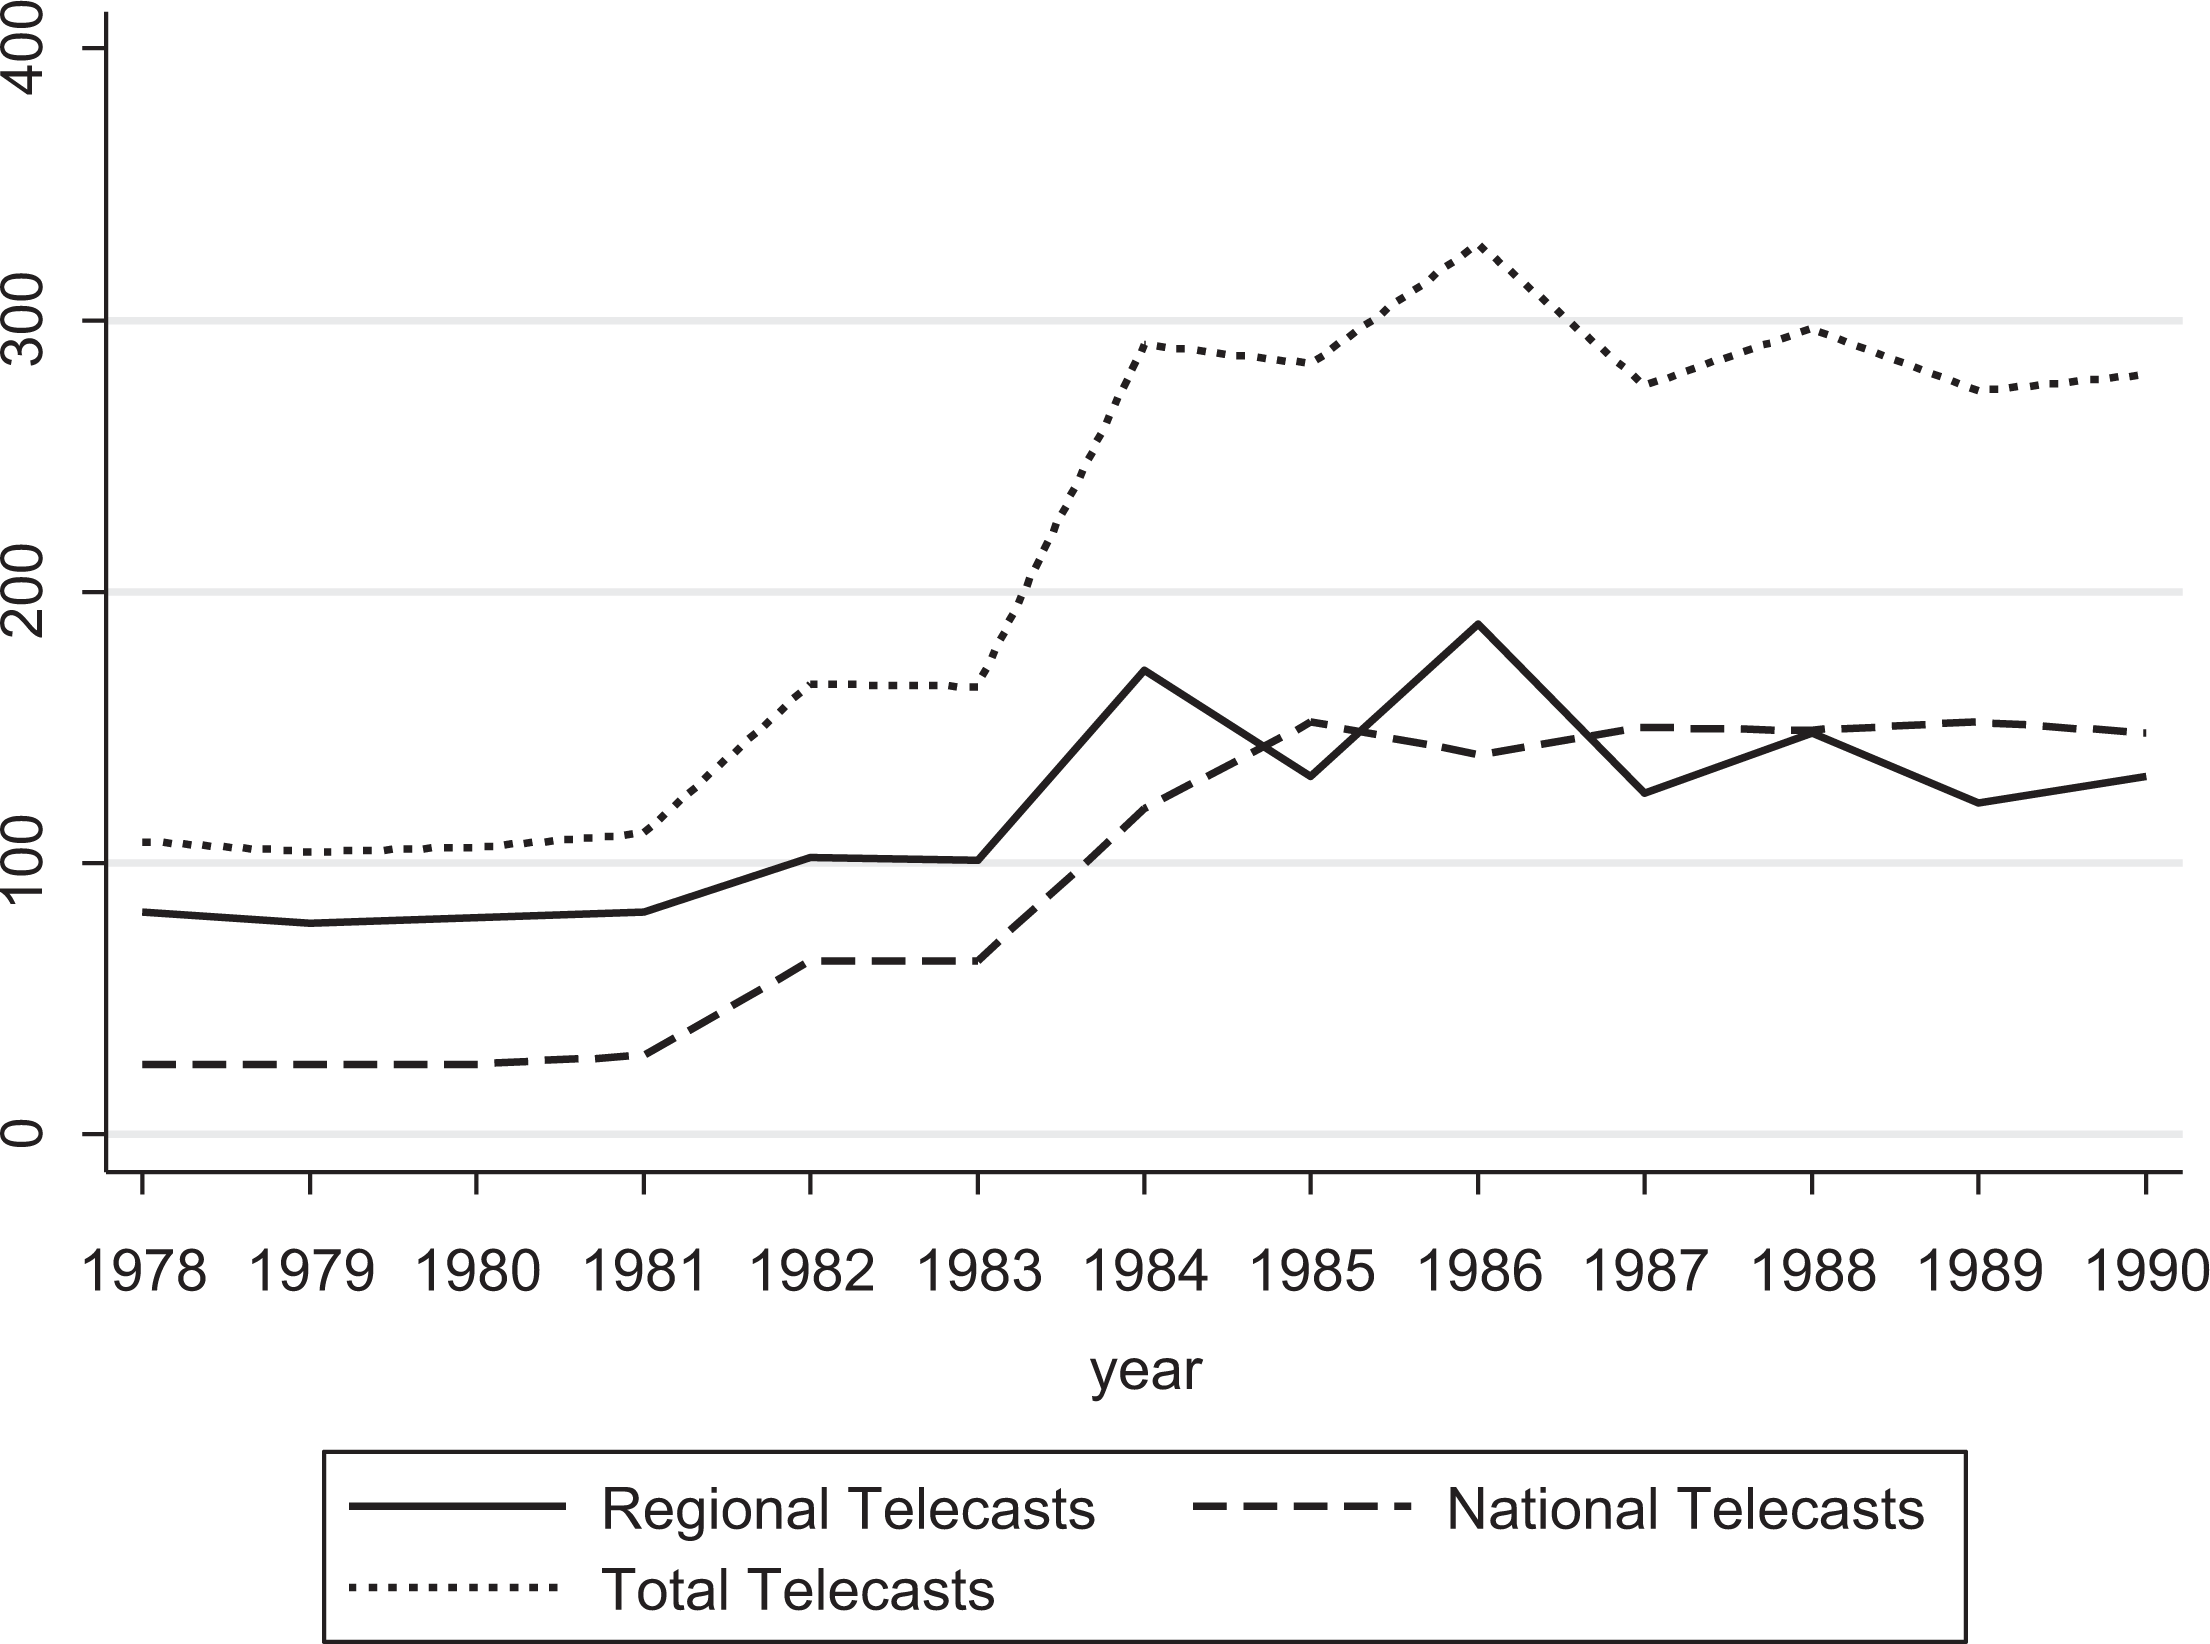
TV appearances by year.
Figure 1 also shows a change in the composition of telecasts after the decision, but a closer look at the distribution of college football telecasts before and after 1984 provides additional insight into the nature of the changes brought on by the Supreme Court decision. There are two ways to look at the distribution of football telecasts in the sample: by team-seasons and by teams. Table 1 shows the distribution of telecasts by team-season in the sample. The sample contains 137 teams and 13 seasons for a total of 1,781 team-seasons in the sample. Note that the columns of Table 1 sum to 100%.
Distribution of TV Appearances by Team–Season.
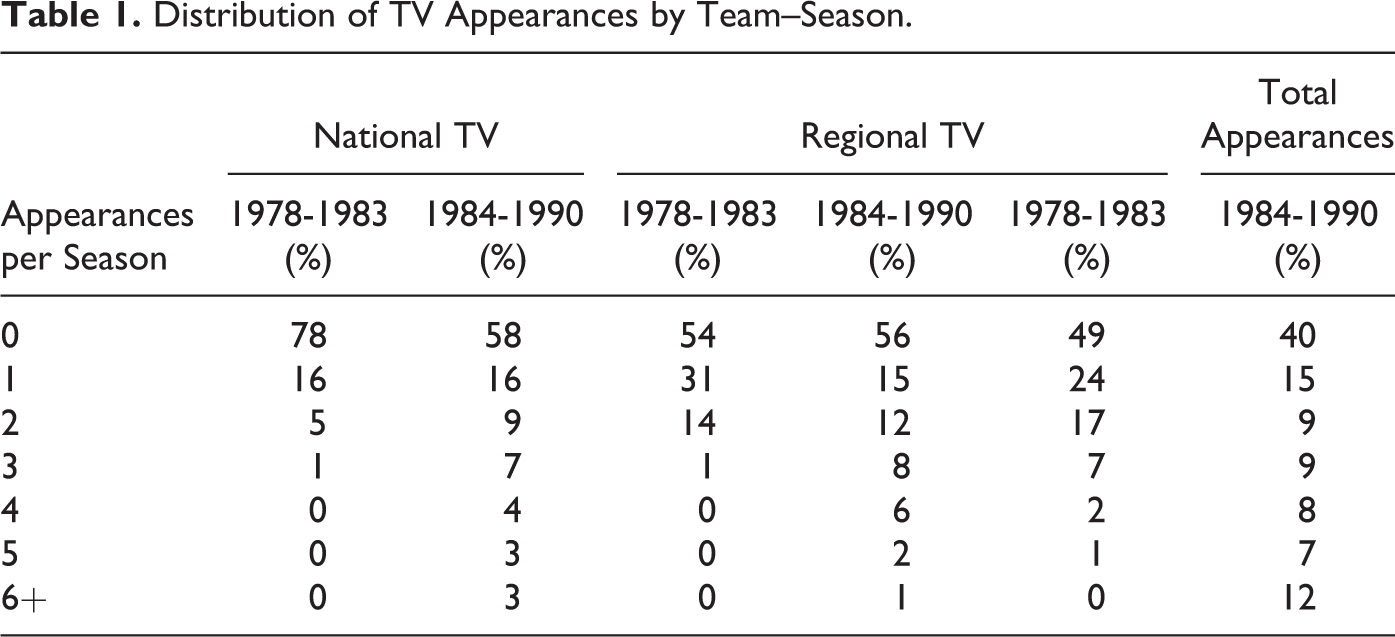
From the rightmost two columns on Table 1, most teams in the sample (49%) had no TV appearances in an average season prior to the 1984 season. Of the other half of the teams that appeared on television in a given season, most (24%) appeared once, fewer (17%) appeared twice, and a small number of teams (10%) made three or more appearances. Following the Supreme Court decision, the total number of telecasts increased dramatically. Some of these additional telecasts were spread around college football, reducing the number of teams that did not appear on television in a given season to 40%. However, a large number of these additional telecasts were distributed among a small number of teams that appeared on TV many times each season. So telecast deregulation provided TV exposure to more member institutions and also greatly increased the number of appearances that a relatively small number of institutions made in a given season.
The team-season distribution of both regional and national broadcasts shows a similar pattern. The probability that a team made no national TV appearances in a given season declined from 78% to 58%, indicating that more teams appeared on national broadcasts. However, the tail of the distribution also increased dramatically, as only 1% of the average pre-1984 team-seasons included three national TV appearances, but 17% of the average postdecision team-seasons included three or more national TV appearances. The probability that a team made no regional TV appearances was unchanged after the decision, but the tail of this distribution also got larger.
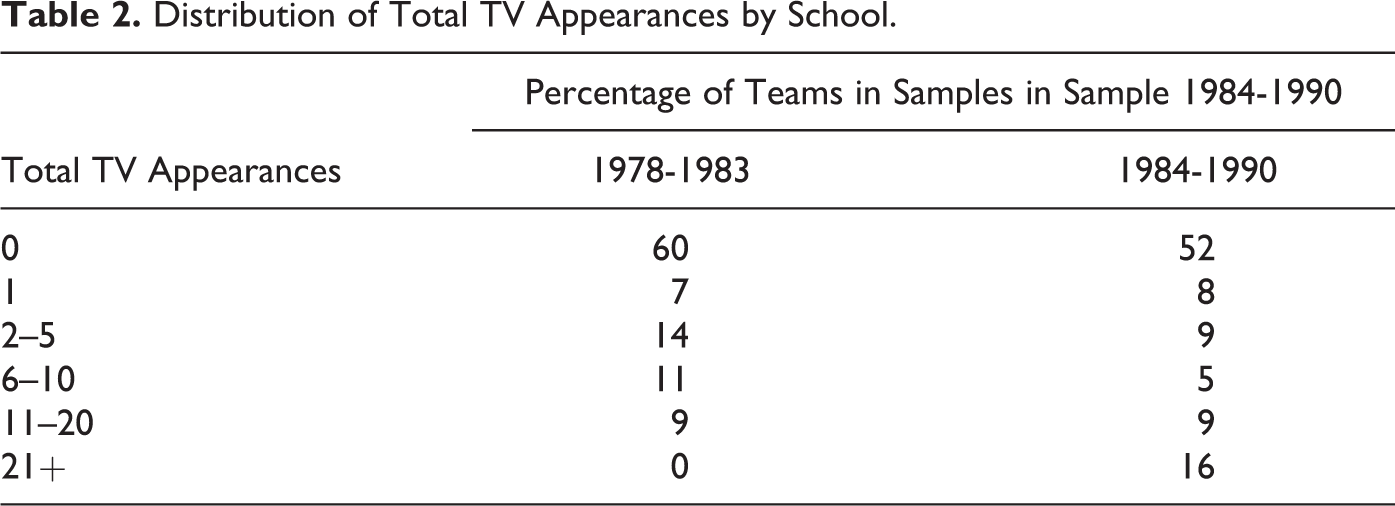
Another way to characterize the distribution of television broadcasts is to look at the number of total TV appearances made by each member institution over time. Table 2 shows the distribution of total TV appearances for the 137 schools for the two periods before and after the Supreme Court decision. Again, looking at the data this way shows that the probability that an institution did not appear on TV at all declined from 60% in the predecision period to 52% in the postdecision period. But the postdecision period also saw a large increase in the number of total TV appearances by a small group of member institutions. No member institutions made more than 21 TV appearances in the predecision period, but 16% of the member institutions made more than 21 TV appearances in the postdecision period.
Distribution of Total TV Appearances by School.
Based on the distribution of telecasts shown in Tables 1 and 2, the increase in the number of telecasts after 1984 was not spread evenly across the NCAA member institutions. Deregulation of college football telecasts also changed the characteristics of the games that were televised. In order to further explore the impact of deregulation on TV appearances, we analyzed the factors that explain which games appeared on television before and after deregulation. To do this, we created a binary variable, TVAi,t
, which takes the value of 1 if school i appeared on television in year t. We then estimated the parameters of the following logit model
using the sample data described previously. W is the number of wins by team i in the previous season, RANK 20 is an indicator variable that is equal to 1 if team i was ranked in the United Press International or Associated Press Top 20 in the previous season, TV is an indicator variable that is equal to 1 if team i appeared on TV in the previous season, BOWL is an indicator variable that is equal to 1 if team i played in a bowl game in the previous season, ENR is total headcount enrollment in thousands at school i, EXP is the number of years of head coaching experience of the football coach at school i, CAP is stadium capacity in thousands at school i, and e is an error term that is assumed to be normally distributed with zero mean and constant variance. Notice that this specification includes a school-specific fixed effect on the probability of appearing on TV, γ i . This school-specific effect captures unmeasured factors like reputation and prestige, and time-invariant market characteristics, on the probability of a school’s football team appearing on television.
Table 3 shows the results of estimating Equation 1 for several different subsamples and types of telecasts. The estimated school-specific effects are not reported but are available from the authors on request. These results show a clear difference in the characteristics of games that were televised before and after 1984. Before 1984, television appearances in the previous season and bowl appearances in the previous season were the most important factors affecting a television appearance in the current season. Success in the previous season, as measured by the number of regular season wins, had no effect on television appearances in the pre-1984 period. Appearing on television in the previous season reduced the probability of appearing on television in the following year, holding the school-specific effect constant. This reflects the NCAA policy of distributing television appearances widely across teams. Note that the results on Table 3 are robust to the exclusion of the lagged dependent variable. The results from a fixed-effects Poisson regression were qualitatively identical to the results reported here.
Fixed-Effect Logit Regressions.
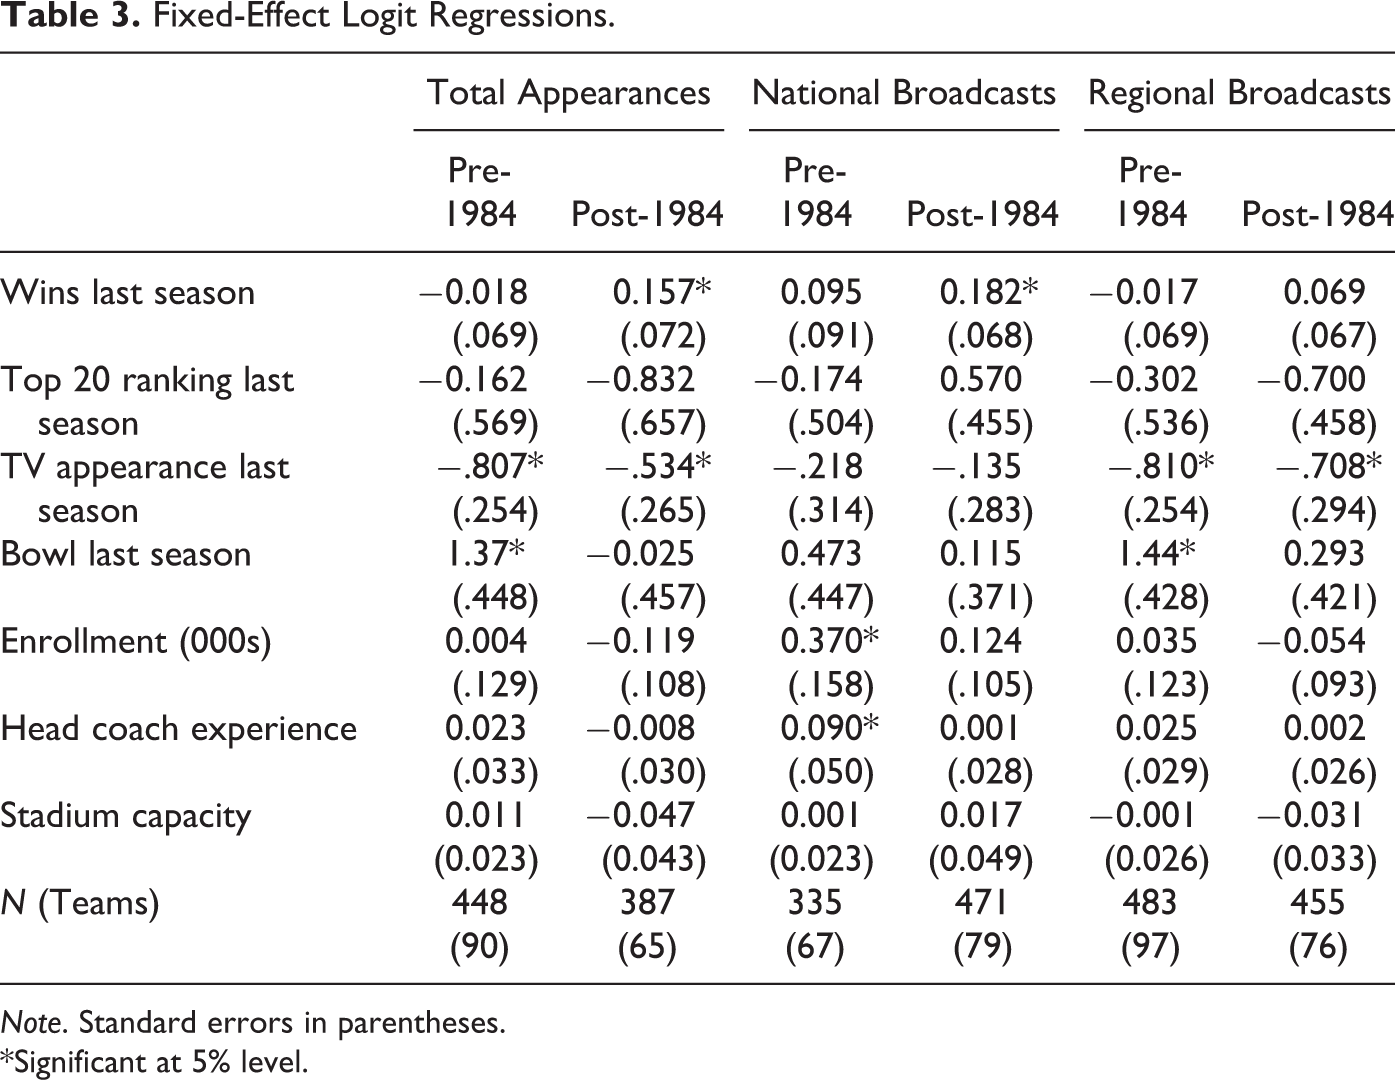
Note. Standard errors in parentheses.
*Significant at 5% level.
In the later period, the primary determinant of a television appearance is success in the previous year. Prior television appearances still reduce the probability of appearing on television in the current season, but the marginal effect fell from −6% to −3.8%. The difference may be due to network’s preferences for games between successful teams in order to maximize the size of the viewing audience.
There is also a difference in the determinants of regional telecasts and national telecasts. In the pre-1984 period, national telecasts tended to involve colleges that are large in terms of enrollment, and teams led by experienced coaches, a proxy for the reputation and stability of the football program. The NCAA appears to have rewarded large and stable football programs with national television appearances. In the later period, size and the experience of the head coach do not predict national television appearances; only success in the previous season is a good predictor of television appearances in the current season. For regional broadcasts, there is little difference in the two periods, perhaps because many of the post-1984 regional broadcasts are syndicated broadcasts of conference games that are not part of major network programming. The ACC may be able to force a syndicated carrier to televise games between some of the weaker teams in the league and a nationally recognized team like Florida State as part of the season package of games.
Competitive Balance
Did the 1984 Supreme Court decision affect competitive balance in college football? The issue is important because competitive balance affects fan interest and thus demand for tickets and telecasts which in turn affects revenue earned by the schools and the NCAA. Two previous studies examined the impact of the Board of Regents decision on competitive balance in college football. Bennett and Fizel (1995) and Eckard (1998) analyzed only conference winning percentages to measure competitive balance. Bennett and Fizel used the ratio of the actual standard deviation of winning percentage to the idealized standard deviation for each conference, as well as summary statistics for the two top and bottom teams in each conference in each year to capture the effects of turnover in relative standings. They conclude that there was an increase in competitive balance in conferences after 1984. Eckard proposed decomposing the variance of conference winning percentages into a time component and a cumulative component. He also calculated Hirfindahl–Hirschman Indexes (HHIs) of bowl game appearances, top 20 poll finishes, and conference championships. Eckard also concluded that competitive balance increased after 1984 within Division I-A conferences. Note that Depken and Wilson (2006) also used HHIs to analyze competitive balance in college football, although the emphasis in that article was the effects of NCAA enforcement of recruiting violations on competitive balance.
Telecast deregulation may have had a differential impact on games played within a conference and those played outside a conference. However, assessing the effects of the Board of Regents decision on competitive balance using only conference games is problematic for several reasons. First, conference affiliation played no role in the Board of Regents case decision. The Supreme Court ruling applied to all college football games, not just for conference games, and the conference affiliation of teams was never mentioned as an important issue. Why then should the impact of this decision be judged only by its impact on conference games? Further, if nonconference schedules changed in response to the decision, then those changes are, by definition, part of the impact of the decision. Ignoring nonconference games misses some part of the impact of the decision on competitive balance. Second, over the period 1977-1991, between 20% and 25% of all Division I-A football teams did not belong to a football conference in any given season. Focusing only on conference games ignores over 20% of the Division I-A college football games played during this period, a sizable portion of the sample.
The competitive balance literature has primarily focused on end-of-season winning percentages or winning percentages over longer periods of time. However, the outcome of individual games can also reveal important information about how competitive any game was and thus shed light on the level of competitive balance. At the level of an individual game, the final margin of victory, the difference between the number of points scored by the winning team and the number of points scored by the losing team, is one possible measure of the competitiveness of a game. The smaller the final margin of victory, the more competitive the contest, other things equal.
One way to test for an impact of telecast deregulation on competitive balance in Division I-A college football is to examine the distribution of the margin of victory in games played before and after the 1984 Supreme Court decision. If this decision had no impact on the competitiveness of individual games, then the average margin of victory (AMV) in games in the period before the decision should be the same as the AMV in games in the period following the decision. If the NCAA’s defense of its telecast regulations was well founded, then the AMV should increase following the decision. Sutter and Winkler (2003) used a similar measure, the difference between the average winning score and the average losing score in college football games, when looking for evidence that scholarship limits affect competitive balance.
Formally, we test the null hypothesis against the alternative

using a standard t-test of differences in means. Again, AMV is the average margin of victory in all Division I-A college football games.
Table 4 shows the results of the hypothesis tests. The “All Games” category includes games between Division I-A and I-AA teams, but the other two categories include only games between teams that were in Division I-A each season in the sample period. Clearly, the margin of victory in college football games was larger after the 1984 Supreme Court decision. The AMV was about 0.63 points larger in the post-1984 period. To the extent that closer games are more competitive, the results on Table 4 suggest that the decision reduced competitive balance in college football. The results from two-tailed hypothesis tests (Ha : AM V 77−83 ≠ AM V 85−91) were similar.
t-Tests on Average Margin of Victory.
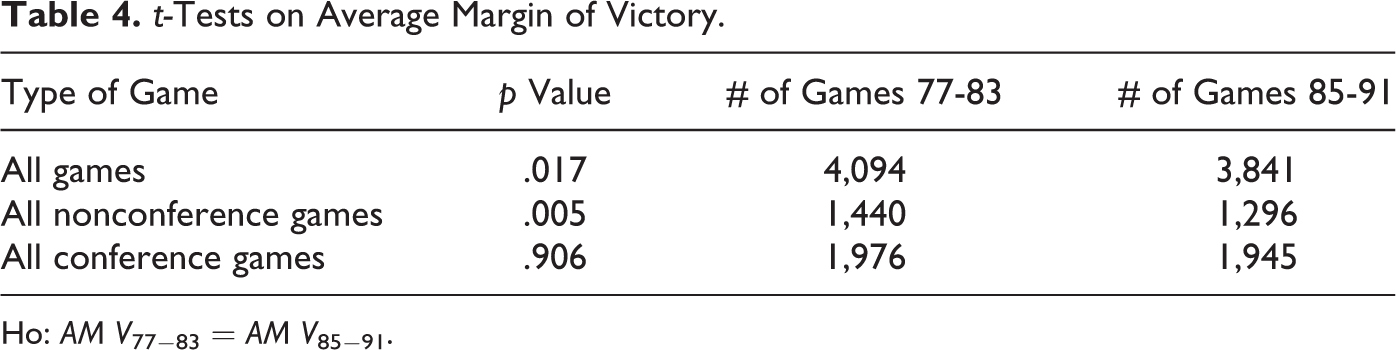
Ho: AM V 77−83 = AM V 85−91.
However, the second two rows of Table 4 show that, as Eckard (1998) and Bennett and Fizel (1995) suggested, the impact of the decision was different for conference games and nonconference games, although not in the direction they predicted. There was no difference in AMV in conference games, but nonconference games were less competitive on average in the period following the 1984 decision. It is difficult to rationalize this difference as due to the influence of television networks on nonconference schedules, because more competitive games should draw larger television audiences, other things equal, implying that television networks would prefer to televise more competitive games. One possible exception to this is the effect of the reputation of “big name” or well-known teams on TV audience size regardless of the expected competitiveness of games. The increase in AMV overall suggests that there was some basis for the NCAA’s defense of its telecast regulations.
Competitive balance can also be analyzed using overall winning percentages for teams over a number of seasons using the standard “Noll–Scully” measure of competitive balance. This measure of competitive balance is the standard deviation of the won–loss percentage of the teams in a sports league or conference over some number of seasons. Define WPCTit
as the winning percentage of team i in season t. WPCTit
is the number of wins for team i in season t divided by the number of games played in season t by team i. This measure of competitive balance for a league or conference composed of N teams over a total of T seasons is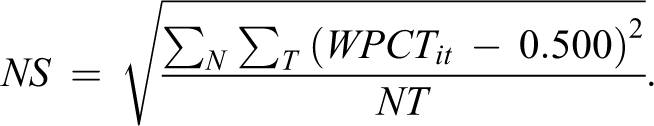
The Noll–Scully measure of competitive balance also has an ideal value that depends on the number of games played. The idealized value, NSI , is the standard deviation of winning percentages if all teams were of equal playing strength. The larger the difference between N S and NSI , the less the degree of competitive balance over the period. NSI is 0.15 for teams with 11 game schedules, which is the approximate average number of games played by Division I-A college football teams over the sample period.
There are 1,580 team–seasons in this sample over the period 1977-1991; 1213 of these team–seasons consist of teams in conferences and 367 consist of independent teams. The overall Noll–Scully statistic for the sample is 0.23, well above the ideal value of 0.15. Table 5 shows the Noll–Scully statistics for the entire sample as well as for the eight Division I-A football conferences that existed throughout the sample period, broken down into the pre- and post-Supreme Court decision periods. The equality of the standard deviation of winning percentages across these two periods can be tested using a variance ratio test which has an F-distribution. The p value column on Table 5 is on the hypothesis test

Standard Deviations of Winning Percentage.
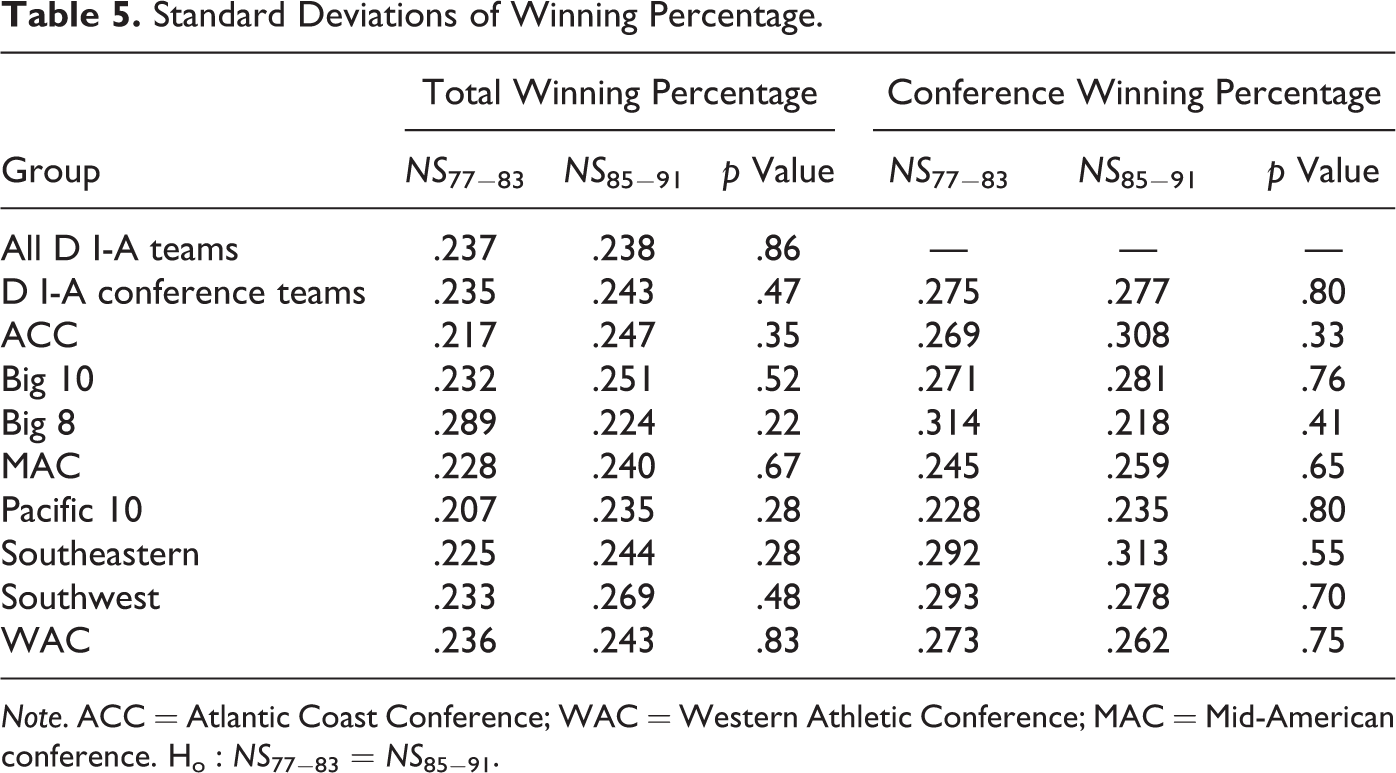
Note. ACC = Atlantic Coast Conference; WAC = Western Athletic Conference; MAC = Mid-American conference. Ho : NS 77−83 = NS 85−91.
based on a standard variance ratio test.
The results on Table 5 show no difference in competitive balance, as measured by the Noll–Scully statistic, before and after the 1984 decision, as the p values suggest that the null hypothesis is accepted in all cases. The results of one-tailed tests (Ha : NS 77−83 > NS 85−90 or Ha : NS 77−83 < NS 85−90) are identical. The results are the same using either conference winning percentages or overall winning percentages. Note that the standard deviations for conference winning percentages cannot generally be compared across conferences because NSI depends on the number of conference games and each conference does not play the same number of games.
Fizel and Bennett (1989) reported changes in competitive balance based on the Noll–Scully ratio, in the ACC, SEC, and Big 8 conferences following the Board of Regents decision. However, their periods of analysis were 1980-1983 and 1985-1988. The difference in results can be attributed to the shorter period of analysis used by Fizel and Bennett and suggests that the effects on competitive balance were short lived. Eckard’s (1998) analysis used HHIs and a variance decomposition approach.
Recall that NS does not reflect changes in relative standings over time. This means that NS for a conference where the same team finished first in each year and NS for a conference where a different team finished first in each year could be identical. If the 1984 Supreme Court decision affected only the relative standings in each year, then this metric might not reflect this type of change.
Humphreys (2002) proposed an alternative measure of competitive balance, the competitive balance ratio (CBR) that can detect changes in relative standings. The CBR scales the standard deviation of the winning percentage, which is essentially a measure of within-conference variation in winning percentage, by a team-specific measure of variation in winning percentage. The CBR expresses team-specific variation as a fraction of conference-specific variation in winning percentage, so this statistic varies between 0 and 1.
Table 6 shows CBRs for all Division I teams and the eight Division I-A football conferences in the sample. This table also shows the p value on a hypothesis test with a null hypothesis that the team-specific variation in winning percentage, the numerator of the CBR, is the same in the 7-year periods before and after the Supreme Court decision. From Table 6, the denominators of the CBRs for each conference are the same.
Competitive Balance Ratios.
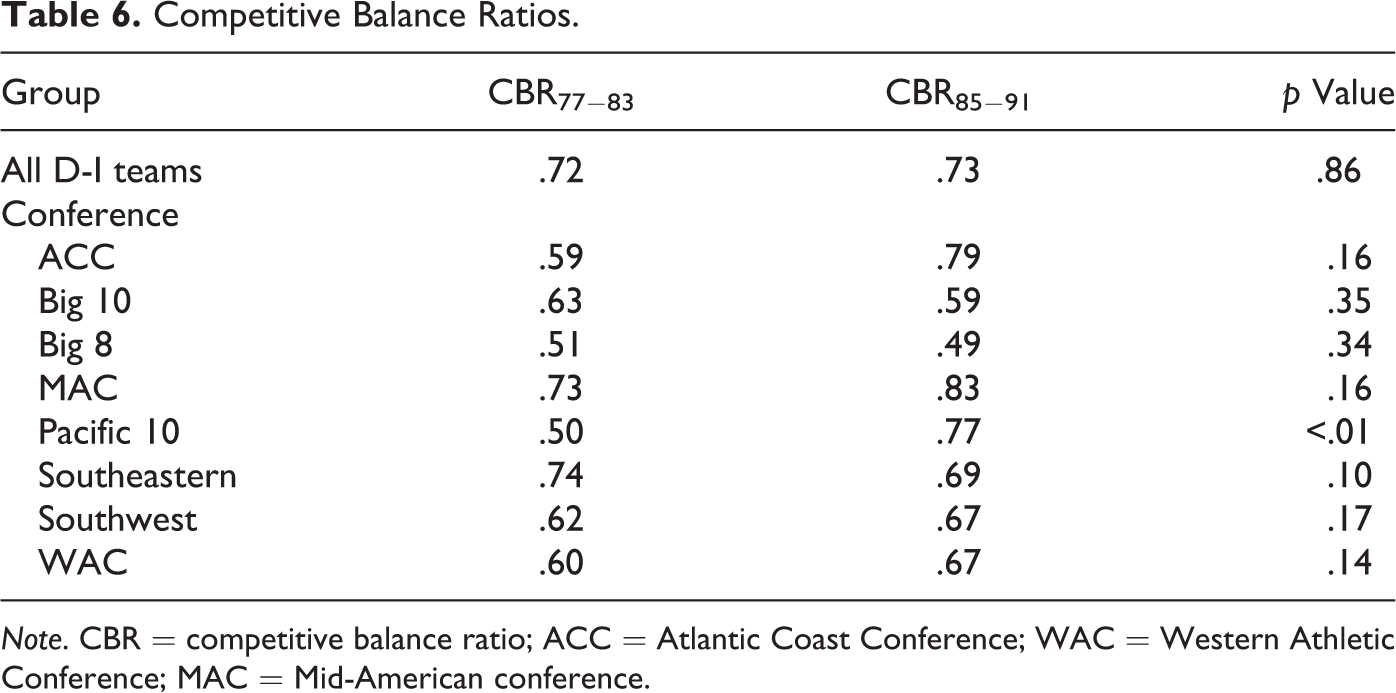
Note. CBR = competitive balance ratio; ACC = Atlantic Coast Conference; WAC = Western Athletic Conference; MAC = Mid-American conference.
The results on Table 6 suggest that competitive balance was essentially unchanged across Division I, as shown in the first line. Competitive balance changed within some conferences after 1984, but the direction of the change differs across conferences. A rise (fall) in the CBR indicates more (less) turnover in relative standings and thus more (less) competitive balance within a conference. The CBR rose in five conferences and fell in three conferences. One rise (PAC 10) and one fall (Southeastern) is significant at the 10% level, although the remaining three increases in the CBR (ACC, Mid-American conference [MAC], Southwest, and Western Athletic Conference [WAC]) are nearly significant. Thus, the changes in the CBRs in Table 6 suggest that competitive balance in the Southeastern conference was reduced after 1984 and competitive balance increased in the PAC 10, ACC, MAC, Southwest, and WAC. The differential impact on competitive balance may be due to differences in revenue sharing procedures across conferences. These differences have been documented and analyzed by Brown (1994).
Attendance
The relationship between telecasts and attendance was debated extensively in the NCAA v. Board of Regents case. The NCAA argued that regulation of football telecasts was needed to protect the existing market for attendance at football games. The courts rejected this idea, finding no evidence to support it. Understanding the impact of the Supreme Court decision on attendance at football games is important in any analysis of the impact of the decision.
Three previous studies examined the relationship between attendance and television broadcasts of college football before and after 1984. Kaempfer and Pacey (1986) found that telecasts and attendance at games were complements, implying that attendance should increase as a result of the increase in own-game telecasts. Fizel and Bennett (1989) and Mawson and Bowler (1989) found that although own-game broadcasts and attendance were complements, the overall increase in football telecasts after 1984 led to a decline in attendance after controlling for increases in own-game telecasts.
The basic approach in the literature has been to estimate a regression model for attendance at college football games. As Kaempfer and Pacey (1986) point out, these models are additive functions of individual’s demand functions for a given product and thus can be derived from the basic constrained utility maximization problem from consumer theory. As with any empirically viable attendance model, the explanatory variables capture the effect of prices, the number of potential consumers, factors that affect the utility associated with attending games, and substitute and complementary activities. The general form of the attendance model we use is
where ATTit is total attendance at college football games at institution i in season t, Zi is a vector of variables reflecting those factors that affect demand for tickets to college football games at institution i that do not change over the sample period, X is a vector of variables reflecting factors that affect demand for tickets to college football games at institution i that also vary over the t seasons in the sample, Ct is a vector of factors that affect demand for tickets to college football games in general, and α β, and φ are vectors of unknown parameters to be estimated. uit is an error term with mean zero, constant variance, and autoregressive covariance following an AR(1) process that is assumed to be uncorrelated with the other right-hand side variables and captures the effects of other omitted factors on demand for college football attendance. The empirical attendance model also includes conference dummy variables. Table 7 describes the variables included in the regression model.
Variables in Attendance Model.
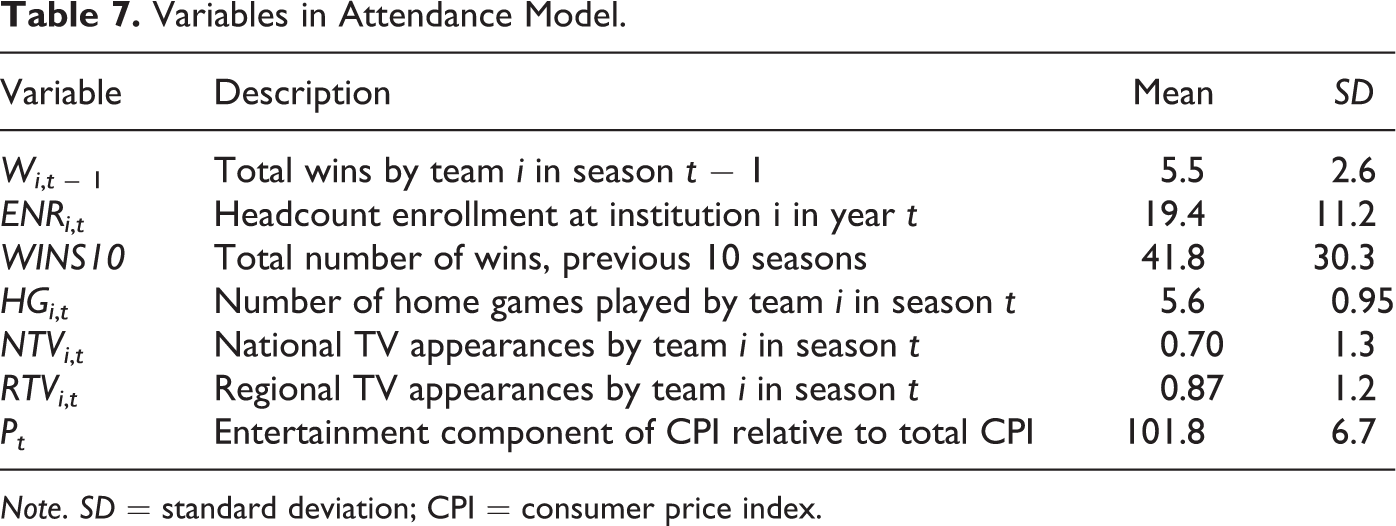
Note. SD = standard deviation; CPI = consumer price index.
Note that we do not include a ticket price variable in the attendance model. Our reasons for this omission are discussed subsequently. Instead, we use implicit variables to capture the effect of prices on attendance. These implicit variables are an institution-specific intercept and an institution-specific time trend. We also include the Entertainment component of the consumer price index (CPI) relative to the total CPI in the empirical attendance model. This variable should capture general changes in the price of leisure activities over the sample.
There are three problems with including an own-price variable in the attendance model. First, no comprehensive source of ticket prices by team for the sample period exists. Kaempfer and Pacey (1986) collected average price data for a football ticket for 72 Division I-A and I-AA teams over the period 1978-1981; Fizel and Bennett (1989) collected average price data for a football ticket for 93 Division I-A teams for 1980-1985; Carroll (1991) collected average price data for a football ticket for 30 Division I-A teams for 1979-1990. However, these studies did not include the same subset of teams.
Second, a single average ticket price to a college football game for a given school may be difficult to measure correctly and may not reflect the actual cost of attending a game. Athletic departments have some market power and price discriminate. They charge different prices to many different groups of consumers. Students typically pay an athletic fee that covers admission to football and basketball games whether or not the student attends. Prime seats, and in some cases nearly all seats in a stadium, often can be purchased only after a large donation to the athletic department or an associated athletic booster clubs, and most of these can only be purchased as part of a season ticket package. Local businesses who donate to the athletic department may be given tickets to distribute to customers. The visiting team is typically provided with several thousand tickets to each game to sell. And seats in the end zone or far reaches of the stadium often have a different price than seats in other locations. All these factors make the construction of an appropriate “average” ticket price a difficult proposition.
Finally, there appears to be a relationship between the ticket price variable and stadium capacity in the existing literature. Both Kaempfer and Pacey (1986) and Fizel and Bennett (1989) have to interact their price variables with a percentage of capacity variable to get the point estimate of the coefficient on price to have the predicted sign. These transformations suggest that the price variable may not be measured well.
Also, we note that attendance and television broadcasts may be in some sense jointly determined. We treat the decision to televise games and fan’s decision to attend games as independent decisions. While broadcast networks may decide to televise games with high attendance, to the extent that television schedules are set in advance of games, the broadcast schedule is predetermined in a statistical sense in this context.
The results of estimating Equation 2 using the Prais–Winston AR(1) correction for the ordinary least square estimator are shown in Table 8. The parameters on the conference dummies, school dummies, and school-specific time trends are not shown. Almost all were statistically significant.
AR(1) Estimates of Attendance Model.
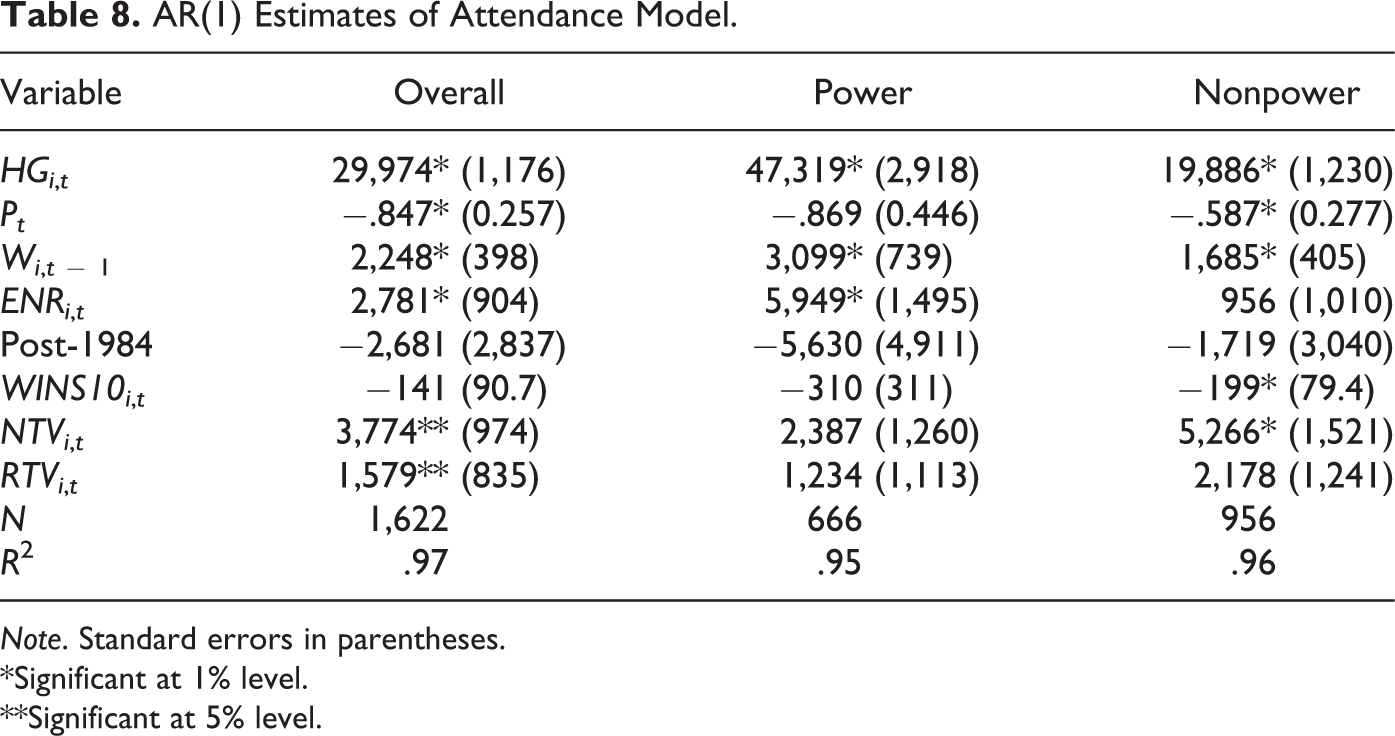
Note. Standard errors in parentheses.
*Significant at 1% level. **Significant at 5% level.
The results in Table 8 are in general correctly signed and plausible. The first column is for the entire sample. Home games, wins in the previous season, and headcount enrollment all raise attendance. Television appearances also raise attendance at games, suggesting that telecasts and attendance are complements and not substitutes as the NCAA argued. This implies that the NCAA’s regulation of telecasts was reducing attendance at games and also revenues earned by college football programs. The parameter on the price of entertainment variable is negative and significant, suggesting that as the price of entertainment rose relative to the CPI, consumers purchased less entertainment, including tickets to college football games. The parameter on the post-1984 dummy variable is negative, but it is not statistically significant. The overall increase in the number of college football broadcasts in the postdecision period did not appear to affect attendance. This result is consistent with those in Forrest, Simmons, and Szymanski (2004) who also found no evidence that cartel manipulation of television broadcasts had an effect on attendance at matches in the English Premier League.
Many previous studies have split the sample of institutions when analyzing the impact of the 1984 Supreme Court decision on attendance, because the decision may have had a differential impact on schools. Past studies have split the sample by groups of conferences and nonconference schools. The two rightmost columns on Table 8 split the sample into “Power” schools, which are schools in the Big 10, PAC 10, Big 8, ACC, SEC, SWC conferences and Notre Dame, and “Non-Power” schools. We further split the sample by the number of national telecasts in the pre-1984 period. Our group of power teams were the roughly 20 teams that appeared on national television 4 or more times from 1978-1983. However, splitting the sample by conference groups, or including teams with three or more national television appearances, had no impact on the results.
There are significant differences in the estimates from the two subsamples, but the important point is that the post-1984 dummy variable is not significant for either. The p value on this parameter for the “Non-Power” schools is about .2, so there is some weak evidence that attendance was lower at these schools after 1984. The key differences are that the relative price of leisure, television appearances, and headcount enrollment has no effect on attendance at the “Power” schools. These colleges, listed in the Appendix, have national reputations and draw customers to their games from outside their students and alumni, to the extent that the enrollment variable also reflects relative differences in the number of alumni. The increase in attendance from each home game is also much larger for these teams as is the effect of stadium size.
Discussion
Our results suggest that the NCAA’s regulation of college football telecasts generated several distinct effects. The decision changed both the number of telecasts (output) and the composition of output. The competitive balance effects appear mixed: Some measures indicate that competitive balance was lower ex post; while other evidence shows the reverse. Analysis of live game attendance indicates no effect, that is, either no reduction or increase in attendance ex post.
The cartel model predicts output restrictions and the empirical analysis supports this prediction. The cartel model, however, does not speak to the changes in the composition or nature of output. These outcomes are reflected in the variation in team appearances in telecasts, the competitiveness of contests, and the willingness of consumers to trade off one form of consumption (telecasts) for another (live games).
These additional effects could reflect opportunistic behavior by the NCAA central organization in its execution of the regulations agreed to by cartel members. In this section, we develop a model to explain how the NCAA might engage in opportunistic behavior in this setting. Note that opportunistic behavior can be viewed as an agency problem similar to the referee favoritism problem identified in other sports contexts. See Buriamo, Simmons, and Maciaszcyzk (2012) and Rickman and Witt (2008) for a discussion of agency problems and referee decisions.
Previous research suggests that the NCAA central organization has a motive for opportunistic behavior. Like the individual member institutions, the NCAA central organization is a nonprofit organization. Although residual earnings or profit may matter to nonprofit decision makers, unlike a for-profit firm, this may not be the primary objective of a nonprofit organization. Nonprofit organizations are frequently modeled as revenue maximizers (see, e.g., James & Rose-Ackerman, 1986). Revenue maximization models predict that output will be higher than the profit maximizing level, assuming that nonprofit and for-profit firms produce identical outputs; this is the reverse of the cartel prediction. More general models of nonprofit behavior assume utility maximization by the relevant nonprofit decision maker. Utility maximization models include revenue, income, authority, and prestige as arguments in the decision maker’s utility function.
Both Zimbalist (1999) and Koch (1983, 1986) posit that the NCAA central organization operates out of self-interest, although neither explicitly considers the nonprofit nature of the NCAA central organization or of the member institutions. In particular, Koch (1986) proposed that the NCAA central organization has its own power, size, and permanence as its primary concerns. Carroll and Humphreys (2000) found that the behavior of the NCAA is consistent with prestige maximization, not profit maximization. This interest in prestige provides a motive for opportunistic behavior.
Opportunistic behavior can occur under conditions of market power, when market discipline from competition is limited or absent and with high transactions costs of monitoring and enforcing behavior (Furubotn & Richter, 2005; Jap, Robertson, Rindfleisch, & Hamilton, 2013; Williamson, 1993). The NCAA is subject to both of these conditions. First, the NCAA operates as a regulatory organization with respect to intercollegiate athletics. In this capacity, it functions essentially as a monopoly. 4 In its ruling, the Supreme Court notes that the NCAA market power was clearly demonstrated by the District Court.
Second, NCAA member institutions authorize the NCAA central organization to facilitate the operation of the cartel by (1) voting to develop and enforce regulations that govern athletic contests (DeBrock & Hendricks, 1996) and (2) engaging in negotiations that will make each member institution better off than if each acted independently. 5 Certain characteristics create high transactions costs for the member institutions to monitor the NCAA central organization and to individually or collectively act to change the form of NCAA regulations. One is that the individual member institutions are diverse. Our empirical analysis attempts to recognize this by distinguishing “power” and “nonpower” teams. In addition, the NCAA central organization is itself a complex organization separate from the member institutions both structurally and geographically. Finally, as nonprofit organizations, the NCAA and its member institutions are subject to a nondistribution constraint that legally prohibits the distribution of any earned residual to any group or individual associated with the organizations. There is no legal owner as residual claimant, and the lack of any capital market makes it more difficult to monitor.
If the NCAA central organization has objectives of its own that differ from those of the member institutions, then it may behave opportunistically in its execution of the regulations that the member institutions have charged it with implementing. We model this behavior by distinguishing the different objective functions of a typical member institution and the NCAA central organization. After developing this model, we show how our empirical results can reflect opportunistic behavior.
The Objective Function of a Representative Member Institution
Recent research emphasizes the importance of heterogeneity in the NCAA (Bronars & McFall, 2010; Harbaugh & Klumpp, 2005). It is possible to capture the potential effects of opportunistic behavior by modeling a representative member institution despite this heterogeneity. An NCAA member institution obtains benefits b from the way in which some quantity of NCAA regulation x affects revenues (TR) and institutional reputation (REP). A member institution also incurs costs associated with NCAA regulations. These costs are the opportunity cost, c, associated with the payment to the NCAA, which is the member institution’s share of revenues contributed to the NCAA, s(TR), and the constraints that each institution faces as a result of the regulations.
Let the benefits, b, to a member institution from any level x of the relevant NCAA regulation be defined, so that TR(x) = b
1(x) and REP(x) = b
2(x). Similarly, the opportunity cost to the member institution of any level of the relevant NCAA regulation be defined as c(x). The member institution’s utility function associated with an NCAA regulation may therefore be stated as
or by substitution
The Objective Function of the NCAA Central Organization
The NCAA central organization derives benefits from two sources: income or revenues of the organization and the prestige and authority of the NCAA in the field of intercollegiate athletics. 6 Higher income to the NCAA central organization provides greater discretionary ability for NCAA managers to engage in opportunistic behavior. Because profit is not explicitly measured or accounted for, with opportunistic behavior as revenues increase costs and expenditures also may increase. The NCAA’s role as regulator and monitor of intercollegiate programs is important to the coordination and effective operation of the athletic programs. The NCAA central organization is dependent upon these programs for its own revenues. We incorporate this into our behavioral model as the NCAA’s share of revenue, s, it receives from any member institution, s(TR).
Prestige and authority reflect the NCAA central organization’s power and ability to exert control over the individual athletic programs. As stated earlier, the NCAA’s regulation of these programs is important to their effective operation. The NCAA as producer of these regulations also places the organization’s management in a clear position of authority and generates a high profile and significant prestige in the sports community and beyond. Our model incorporates the relationship of NCAA’s prestige and authority to the NCAA’s role as regulator through the inclusion of the variable (AUTH).
The NCAA’s decision on the form and implementation of any particular regulation x is made with these potential benefits in mind. Therefore, from the NCAA’s perspective, income and authority each depend on x.
Let the benefits, b, to the NCAA from any level x of the relevant NCAA regulation be defined, so that s[TR(x)] = s[b
1(x)] and AUTH(x) = b
3 (x). The NCAA agent’s utility function associated with an NCAA regulation may therefore be stated as
so that
The NCAA Cartel: Joint Utility Maximization and Opportunistic Behavior
We model optimizing cartel net benefits as maximizing the joint utility function of the representative member institution and the NCAA central organization.
With no opportunistic behavior by the NCAA central organization, b
3(x) = 0, so that the NCAA seeks to maximize the member institution utility plus its own income. The relevant cartel utility function is therefore
The optimization problem may be stated as
or
Let 
The first order condition for a maximum is
which may be stated as
or
which yields the optimal level of regulation is x*.
If the NCAA central organization behaves opportunistically, it seeks to maximize its own utility, which, while related to the objective of the member institutions (through the revenue effect) is distinct from the utility of the principal. The relevant cartel utility function therefore becomes the combined utility functions of the member institution and the NCAA central organization:
With opportunistic behavior by the NCAA, the optimization problem may be stated as
The revenue payment from the member institution to the NCAA again nets out, so that the optimization problem now becomes
where
The first-order condition for a maximum is
The level of regulation with NCAA opportunistic behavior is x o > x*. This indicates that the NCAA central organization, if behaving opportunistically, will overregulate to promote its own self-interest, as Zimbalist (1999) and Koch (1983) suggest.
Interpretation of Empirical Results
Opportunistic behavior by the NCAA central organization can take a variety of forms. In addition to overly restricting the number of telecasts (i.e., limiting output), this could include influencing the content of the telecasts. These two represent direct effects of this opportunistic behavior. In addition, there can be indirect effects of these actions on the nature of the contests and on consumer response. These effects, while still allowing for benefits for the member institutions, can reallocate some benefits from the member institutions to the NCAA central organization. We examine this possibility for each of the impact areas subsequently.
Telecasts
Our estimated effects on telecasts of the NCAA regulations support the cartel model and also provide support for opportunistic behavior on the part of the NCAA. First, evidence shows that the total number of games telecast nationally increased following the Supreme Court decision. This evidence is consistent with our prediction above of a higher level of regulation than is in the interest of member teams by restricting output below the level that maximizes their net benefits.
Second, the difference in characteristics of the teams most likely to appear on television before and after the decision provide additional evidence of NCAA opportunistic behavior. During the period of regulation, the NCAA restricted the ability or eligibility of teams to participate in telecasts. The teams that were most likely to be included in the NCAA package offered to the networks were those at larger schools and whose head coach had greater experience in that position. The included teams were more likely to be well known and command higher TV audiences and higher value as part of the package. In addition, teams that had appeared in previous seasons were less likely to be included in the NCAA package. This created scarcity and increased the value of these individual teams. Preceding season success had no statistical effect on the NCAA’s choice in the period of regulation prior to the Supreme Court decision.
Together, the significant determinants suggest that the NCAA’s packaging strategy was one that maximized revenue from the package. Because the price paid to each team for a telecast was the same for each school, regardless of size, maximizing total package revenue maximizes revenue for the NCAA, not for the individual teams. This outcome is consistent with cartel theory and is also consistent with opportunistic behavior. Maximizing total package revenue promotes NCAA central organization interests by directly increasing revenues available to its management and also by expanding its role of authority over member teams.
In contrast, following the 1984 decision, the primary predictor of individual team appearances in any season was success in the preceding season. Televising teams successful in the previous season indicator would promote audience size and TV ratings, increasing market value of the individual team to the broadcaster. The postdecision characteristic of teams likely to be telecast thus suggests revenue maximization for individual teams rather than for the NCAA. These differences in characteristics of telecast teams before and after the decision suggest that NCAA’s regulations were designed to promote its own interests at the expense of the interests of the member teams. In addition, televising teams that were successful in the previous season increases nonpecuniary benefits to the member teams, such as prestige and reputation, but does not necessarily or proportionately expand such benefits to the NCAA central organization. Although the market value effects are consistent with the cartel model, these latter effects are not, but would be consistent with NCAA opportunistic behavior during the period of regulation.
Competitive Balance
Overall, the evidence that we find on the impact of the Supreme Court decision on competitive balance in college football is mixed. Based on evidence from the outcome of individual games, the decision appears to have reduced competitive balance, as the AMV in some games increased significantly in the period after the decision. This result supports the NCAA position of defense in the case and does not support the premise of opportunistic behavior by the NCAA. Based on evidence from final winning percentages, competitive balance improved within some conferences and worsened in others. However, there is no evidence that the overall level of competitive balance changed across all teams in Division I-A. Measuring competitive balance on the basis of winning percentage overall provides some support for the prediction that the NCAA behaved opportunistically and indicates overregulation by the NCAA.
The NCAA argued that one purpose of the restrictions on television broadcasts was to promote equalization of competition across teams. Our principal-agent model supports the view that regulation of college football telecasts reduced competitive balance. Imperfect agency behavior would generate regulations to promote the NCAA’s own interests rather than the interests of the member team principals. Our model therefore predicts either increased competitive balance or no change in competitive balance in the period following the decision.
Attendance
Despite data limitations that require the use of aggregated attendance figures, our analysis of attendance before and after the Supreme Court decision indicates no significant effect of NCAA telecast regulations on live game attendance. Importantly, however, we show that attendance did not decline following the removal of these telecast regulations. The NCAA had argued that their regulations were essential to protect live game attendance. That this was not the case indicates that the NCAA opportunistically engaged in overregulation of football telecasts.
Conclusions
Our empirical analysis of the 1984 Supreme Court decision that deregulated intercollegiate football telecasts by reassigning property rights from the NCAA to individual member institutions supports the cartel model and also provides support for opportunistic behavior by the NCAA within a cartel setting. The position of the NCAA in that suit was that its regulation of football telecasts was in the interest of the member institutions by protecting competitive balance and live game attendance through limiting the total number of games that could be telecast and the number of appearances of any particular team. Our findings indicate that although the Supreme Court decision increased the total number of televised football games, it had essentially no impact on either competitive balance or live game attendance. NCAA predecision regulation therefore did not serve to improve these areas for member teams.
Our analysis of television appearances by member institutions, previously overlooked in this literature, provides strong support for the prediction of NCAA opportunistic behavior as well as entrenching cartel operation. Although the total number of telecasts increased following the decision, we find that the characteristics of the individual teams whose games were likely to be televised changed, as did the distribution of the telecasts across member institutions. Each of these effects supports the prediction of overregulation resulting from imperfect agency behavior by the NCAA, which the cartel model does not address. The characteristics of teams appearing on television under NCAA regulation signals a system of packaging broadcasts that was revenue enhancing for the NCAA central organization but not necessarily for the member institutions.
Our findings on competitive balance before and after the Supreme Court decision depend on the metric employed. The increase in AMV in the postdecision period indicates a decrease in competitive balance, which supports the position of the NCAA and does not support opportunistic behavior. However, changes in winning percentage, and changes in measures of competitive balance related to winning percentage, show no change in competitive balance. This does support the prediction that the NCAA behaved opportunistically through overregulation.
Our empirical analysis of live game attendance before and after the Supreme Court decision indicates no significant effect of NCAA telecast regulations. As we noted, the evidence that attendance did not decline ex post provides some support of opportunistic behavior by the NCAA by prescribing a greater level of regulation than would be required to maximize net benefits to the cartel.
Overall, our empirical findings on telecasts, competitive balance, and attendance together provide support for the likelihood that NCAA’s regulation of football telecasts reflects opportunistic behavior by the NCAA central organization. We note, however, that our results on the number of telecasts also support the existing view of the NCAA as a cartel. The existence of market power, as the NCAA has, provides an environment conducive to opportunistic behavior. In addition, the NCAA central organization’s opportunistic behavior could exacerbate the impact of an effective cartel. By behaving opportunistically to serve its own interests, the NCAA central organization would overregulate relative to a cartel outcome that would be optimal for member institution teams. The implication of our analysis is that the NCAA was able to divert benefits from the member institutions to the NCAA central organization as a way to promote its own prestige, power, and authority. While our analysis in general is consistent with the cartel model of the NCAA, we demonstrate behavior that cannot be explained entirely by this model and is consistent with opportunistic behavior. We find that the telecast packaging engaged in by the NCAA was clearly revenue enhancing which, along with the position of authority that it generates for the NCAA central organization, would promote that organization’s own interests relative to those of the member institutions. Our analysis indicates both motivation and opportunity for opportunistic behavior. We provide a simple model that predicts overregulation consistent with these findings.
Footnotes
Appendix
Declaration of Conflicting Interests
The author(s) declared no potential conflicts of interest with respect to the research, authorship, and/or publication of this article.
Funding
The author(s) received no financial support for the research, authorship, and/or publication of this article.