
Abstract
Pope and Schweitzer (2011) study predictions of prospect theory for the reference point of par on the current hole in professional golf. We study prospect-theory predictions of three other plausible reference points: par for recent holes, for the round, and for the tournament. A potentially competing force is momentum in quality of play, that is, the hot or cold hand. While prospect theory predicts negative serial correlation in better (worse)-than-average performance across holes, the hot (cold) hand implies the opposite. We find evidence that, for each of the reference points we study, when scores are better than par, hot-hand effects are dominated by prospect-theory effects. These effects can occur via two mechanisms: greater conservatism or less effort. We find evidence that the former (latter) dominates for scores closer to (further from) the reference point. We also find evidence of prospect theory effects (greater risk seeking) when scores are worse than par for the round in Round 1 and of cold-hand effects for scores worse than par for the tournament in Round 3. The magnitudes of some of the joint effects are comparable to those found by Pope and Schweitzer and other related papers. We conclude by discussing how, rather than compete, prospect-theory and cold-hand forces might also cause one another.
You get to like the 12th hole and I’m three under par and I don’t want to have one hole hurt a round so I end up laying up
Introduction
Pope and Schweitzer (2011; hereafter PS) find that professional golfers make putts for a score of par around three percentage points more often than putts of the same difficulty for a score one stroke better than par (birdie). Since nearly all strokes have roughly the same expected effect on final tournament standing and earnings, golfers should, normatively, treat otherwise equivalent par and birdie putts equally and thus perform equally well on them. PS’s finding violates this normative standard but is consistent with predictions of prospect theory (Kahneman & Tversky, 1979) that individuals are often influenced by arbitrary reference points, in this case par for the current hole, and have greater motivation to avoid a loss versus the reference point than to attain a gain. While prospect theory had been studied extensively in the lab, PS’s paper was one of the first to study the topic in a context with experienced decision makers and high stakes.
In this article, we develop the analysis of PS further by studying three other types of reference points: par for very recent holes (the combined score for the current and last holes), par for the current round, and par for the tournament. The Phil Mickelson quote above reflects prospect-theory-type thinking with respect to the round-level reference point in particular, but the others we analyze are plausible a priori as well.
Our analysis of reference points is motivated by several goals. First, we hope our results contribute to the literature on the determinants of reference points that most affect behavior. As discussed in Barberis (2013; an excellent review of the elements of prospect theory and follow-up theoretical and empirical work), one of the challenges in applying prospect theory has been that the reference point’s definition is often ambiguous. Our work addresses the importance of expectations for determining reference points, and the relevance of multiple reference points in a given context. There has been some recent experimental work on these topics (Abeler, Falk, Goette, & Huffman, 2011; Baucells, Weber, & Welfens, 2011), but such research using nonlab data is highly limited. Second, we dig deeper into the possible mechanisms underlying reference-point effects, effort versus risk attitudes. PS discuss both of these mechanisms driving their results—that players may exert more effort and/or become more risk seeking in putts for par, causing the improvement in average performance. But PS do not analyze which factor is dominant, or how this may depend on context. Third, we hope to enhance the understanding of the general prevalence and magnitudes of prospect-theory effects.
This analysis is made more complex, however, by the fact that golfers may experience periods of momentum in quality of play. That is, being in what prospect theory refers to as “the domain of gains” (a position preferred to the reference point, i.e., having a score below par for holes relevant to a given reference point) could be indicative of the golfer having the “hot hand” and therefore being likely to play better on subsequent holes. The “domain of losses” (a score above par) is analogous and may imply a “cold hand.” While the conventional wisdom in behavioral economics as of just a few years ago was that “the hot hand is a widespread cognitive illusion” (Kahneman, 2011, p. 117), the hot hand is now recognized to exist in a variety of settings. 2 Hot (cold) hand theories predict positive serial correlation in the chance of outcomes being better (worse) than average, and prospect theory typically predicts the opposite. The hot hand—or the hot-hand bias, that is, overestimation of one’s own momentum—could thus be viewed as a confound to the analysis of prospect theory. But the hot and cold hands, and the bias, are of interest also. 3 Thus, most of our results do not purely capture either prospect-theory or momentum effects but instead can be viewed as the outcome of a potential horse race between these competing forces. We also conduct a limited analysis in which the two types of effects are better separated; the results from this support our interpretation of the results from the main analysis.
Our main findings are as follows. For each of the three types of reference points, we find evidence that when in the domain of gains, prospect-theory effects dominate hot-hand effects: Recent success predicts a decline in quality of subsequent performance. The evidence on effort versus risk mechanisms is somewhat murky, but overall the results suggest that the prospect-theory effects are driven more by risk aversion when scores are closer to the reference point, and more by lower effort for scores further from the reference point. There is some evidence of a hot-hand bias (that golfers become overconfident), which could also account for this decline in performance in the domain of gains.
We also find several types of evidence indicating that the actual reference points golfers use are influenced by both salience and expectations that players adjust expectations, and thus reference points, based on their own overall ability, how play is going in a particular round, and the difficulty of the relevant holes. Since these factors diminish the observability of reference-point effects, these results imply our more aggregated results are, in general, likely attenuated.
When golfers enter a hole in the domain of losses, results are different. We find some evidence of greater risk-seeking behavior (as predicted by prospect theory), as being in the domain of losses for the round in Round 1 is associated with greater chances of both below- and above-par scores on the current hole. We also find a general decline in quality of play when scores are above par for the tournament in Round 3, consistent with the cold hand (we restrict analysis to Rounds 1 and 3 for reasons we explain in the Other Controls section). This effect occurs for both relatively high- and low-ranked players, indicating it is not just driven by lack of experience, skill, or lower stakes. While the exact mechanism behind the effect is somewhat unclear, the stronger result in Round 3 indicates it is unlikely to be caused entirely by a few plausible alternative factors we discuss.
We also estimate the joint effects of the reference points across sets of holes (rounds and half-rounds). Our estimates for these joint effects are precise and mostly small (less than 0.1 strokes) for round-level effects. However, the joint effect for all of Round 3 starting with a tournament score substantially above or below par is around 0.2 strokes, which is similar to the round-level effects found by PS and related papers. PS discuss how such a magnitude extrapolated for an entire tournament could imply annual losses of hundreds of thousands of dollars. Some of our estimated half-round effects are larger on a per-hole basis, and all of these estimates should be conservative due to the attenuation issue, and so while these estimates are certainly not huge, they seem economically significant.
In summary, our results confirm the importance of reference points in real-world behavior, as their effects are large enough to be observable and substantial despite heterogeneity, unobserved expectations, and competing forces. Our results also provide evidence consistent with the existence and importance of momentum in performance and the asymmetry of hot and cold momentum. In the final section, we discuss reconciling our seemingly inconsistent results—the variation in dominance of risk, effort, and cold-hand effects. Rather than being competing forces, cold-hand and prospect-theory effects may actually, at least in part, cause one another.
Data and Prior Literature
Data
We use data from the Professional Golfers’ Association (PGA)’s ShotLink database available to the public online. The database includes information on every shot at PGA tournament events from 2003 to the present, excluding the four major tournaments. We use data through the 2014 season. Variables include the tournament, course, round, hole, player, the score on the given hole, and, based on laser-determined location, the location of the ball and distance to the hole for each shot.
The unit of observation used for our analysis is player-year-tournament-round-hole. We start with 3,549,186 observations. We deleted 627 rounds that were labeled the fifth round (which occurs rarely in certain tournaments) and dropped 109 rounds for which there were missing scores. We considered dropping the five tournaments that comprise the golf play-offs, the FedEx Cup (the Tour Championships, Deutsche Bank Championship, The Barclays, and the BMW Championship), but found results were similar and prefer to keep these observations to maximize sample size. We code hole number in the order in which holes are played by the player, so if a player starts a round on Hole 10, which happens somewhat regularly, this hole is coded as Hole 1, Hole 11 as 2, and so on.
Related Literature
Other papers (in addition to PS) that analyze prospect theory in golf are Sachau, Simmering, and Adler (2012) and McFall (2015). The former finds that, consistent with prospect theory, amateur golfers are more risk seeking after a bogey versus after a par or birdie. In addition to analyzing the behavior of amateurs and not pros, their paper also differs from ours by using survey data and not data on performance. The latter finds that PGA players penalized a shot for hitting a par-5 tee shot out of bounds are more likely to “go for the green” on the shot after the do-over drive, indicating more risk-seeking behavior. This finding supports the importance of par on the current hole as a reference point.
Another paper particularly closely related to ours is Smith et al. (2009) as they also study the competition between prospect-theory and competing forces, including perceived hot or cold streaks, but for a different context, (online) poker. Their main finding is that play becomes more risky and aggressive after big losses, as predicted by prospect theory.
Other economics papers using PGA tour data include the following. Brown (2011) finds that the presence of Tiger Woods demotivated other top players, causing them to perform worse by 0.8 strokes per tournament. Kali, Pastoriza, and Plante (2015) study the effects of nonmonetary incentives on performance and find that players perform worse when these incentives (Ryder Cup points) are higher. They find effects that range from 0.29 to 0.81 strokes per tournament. The study by Rosenqvist and Skans (2015) is similar to our paper in that they study the effects of confidence, closely related to the hot/cold hand, and indeed find evidence of positive correlation in performance; their paper differs from ours in their focus on performance variation across, and not within, tournaments.
Other papers in this genre differ from ours by analyzing effects for specific holes or small sets of holes, and not entire rounds of play. Hickman and Metz (2015) show that players choke on putts on the final holes of tournaments when monetary stakes are higher, and Balsdon (2013) shows that risk strategies are affected by tournament standing, more so when players are trying to make the cut rather than at the end of tournaments. Ozbeklik and Smith (2014) show that risk strategies do vary with tournaments but only analyze match play (a nonstandard format of tournament); as the authors discuss, the incentives to change risk strategy are much stronger in the match play format, which supports our assumption that risk attitudes, normatively, should not change for the large majority of holes we analyze.
Theory and Identification
Prospect theory predicts that decisions are made based on salient changes or differences in a variable of interest, as compared to the so-called reference point. The reference point is a psychologically plausible baseline and is typically arbitrary from a normative perspective. By contrast, standard economics of course assumes choices are made based on the levels of relevant variables. For example, if an agent is proposed a “50–50 win US$150, lose US$100 gamble,” prospect theory assumes the agent makes his choice ignoring the value of his initial wealth, since this value is the natural reference point, and only the possible changes in wealth are relevant to the decision. That is, prospect theory predicts the same choice whether initial wealth is US$100 or US$1 million. Obviously, this factor could be normatively significant.
Prospect theory includes three other key elements, in addition to reference points: (1) Agents evaluate a “value” (contra utility) function of outcomes versus the reference point, whose slope is 2–3 times as steep in the domain of losses (negative values of the difference/change variable) versus that of gains (positive values), implying loss aversion; (2) there are diminishing marginal effects of both gains and losses on the value function; and (3) “probability weighting,” in particular, very low probabilities are weighted upward in calculating expectations. Since most of the decisions we analyze do not involve very low probabilities, and in the interest of parsimony, we do not consider probability weighting in our analysis (however, this may be worth studying in future work).
We present an illustrative value function, applied to the context of golf for the reference points that we consider, in Figure 1. Discussion of this figure is sufficient for understanding the key forces at play in our empirical setting; a detailed formal analysis, which could include dynamic effects across holes, is beyond our scope. Note that, for now, scores below par are gains and thus imply positive values of x (score relative to par for a given reference point) and vice versa for scores above par. For the moment, assume that x represents the score on just the current hole being played. The value function is steeper in the domain of losses due to loss aversion, which implies the return to making a shot to avoid a loss (x = −1) is greater than the return to attaining a gain of the same size (x = 1). PS pointed out that this could cause golfers to put more effort into putts for par than for birdie (x = 1) and focus on this explanation for their result that par putts are indeed made more often. Effort, in this context, refers to time and focus, which does plausibly vary at least to some extent from hole to hole. The figure also shows that, since the value function is convex to the left and concave to the right, golfers may be more risk seeking for shots to avoid losses (or further losses) and more risk averse on shots to attain gains.
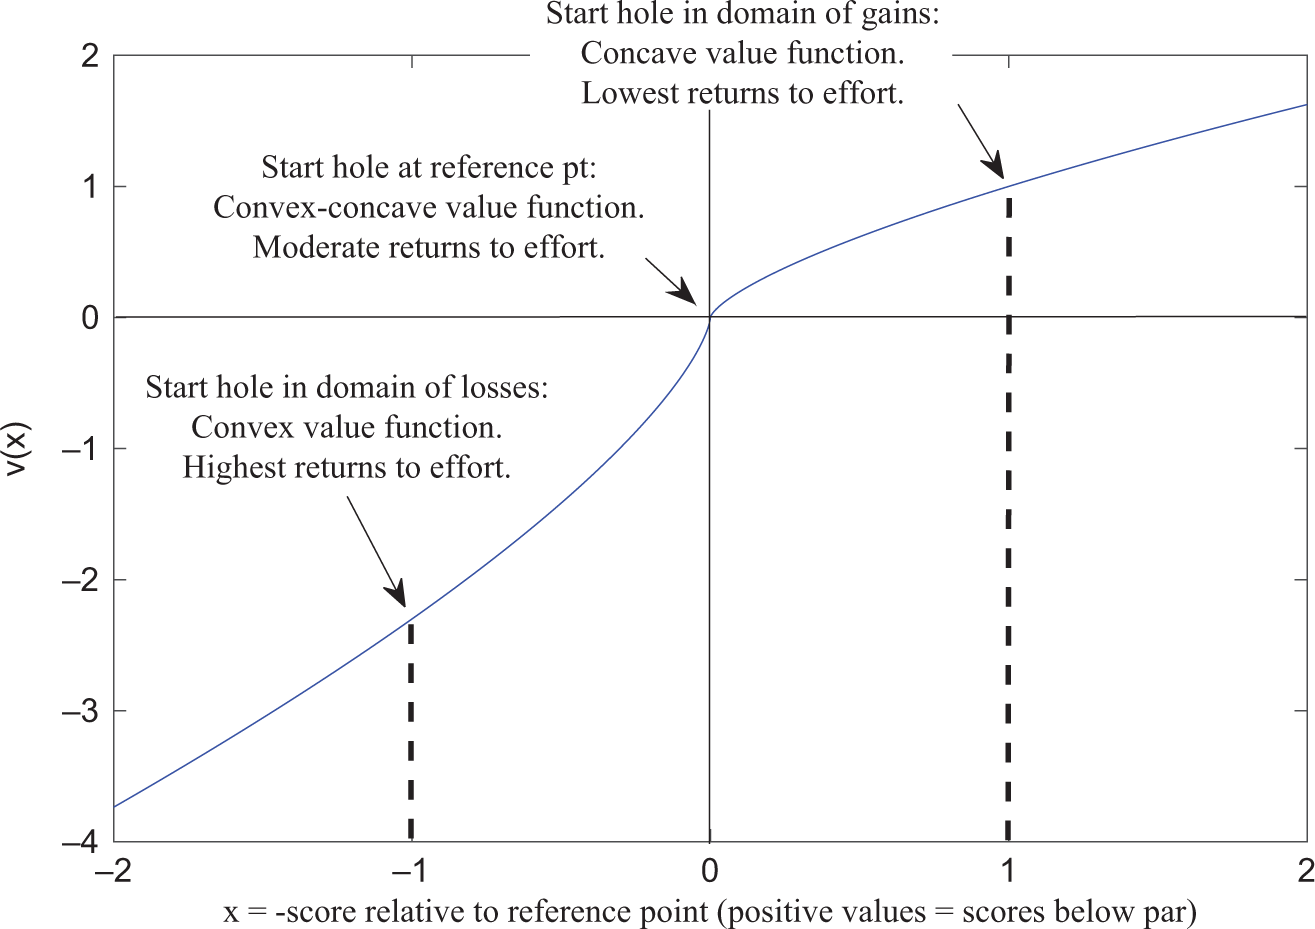
A prospect-theory value function for golfers (
As discussed above, our work is motivated, first and foremost, by the existence of several other plausible reference points in golf, beyond par on the current hole. When a golfer steps up to the tee, he is not in the domain of gains or losses for that particular hole. If he performed well on the previous hole, he might still feel the emotional benefit from the gain and thus continue to act as if he is in the domain of gains. And he might also consider to score relative to par for the round and/or for the tournament. That is, x could represent the combined score from the current hole and any of a few different sets of relevant previous holes.
If x > 0 at the start of a hole (the golfer is in the domain of gains), this could make him exert less effort than otherwise, since the returns to further gains and costs of losses are both relatively low. This would make him less likely to attain birdie, more likely to attain bogey, and have a higher mean score on the current hole. At the same time, x > 0 could also cause conservatism due to the concavity of the value function (making the golfer less likely to attain both birdie and bogey, possibly also increasing the mean score). If x < 0, the value function is convex and steep, which would cause relatively high risk seeking and/or effort. 4
However, performance versus each of these reference points could also be indicative of the extent to which a player is currently hot or cold. If a player performed better than par on the last hole, his ability level might be temporarily elevated (due to confidence, physical factors, etc.), implying he is likely to perform better on the current hole as well (higher chance of birdie, lower chance of a bogey, and lower mean score). The reverse would be true for players who performed poorly on recent holes. We note that results consistent with the cold hand could be caused by injuries or other physical problems.
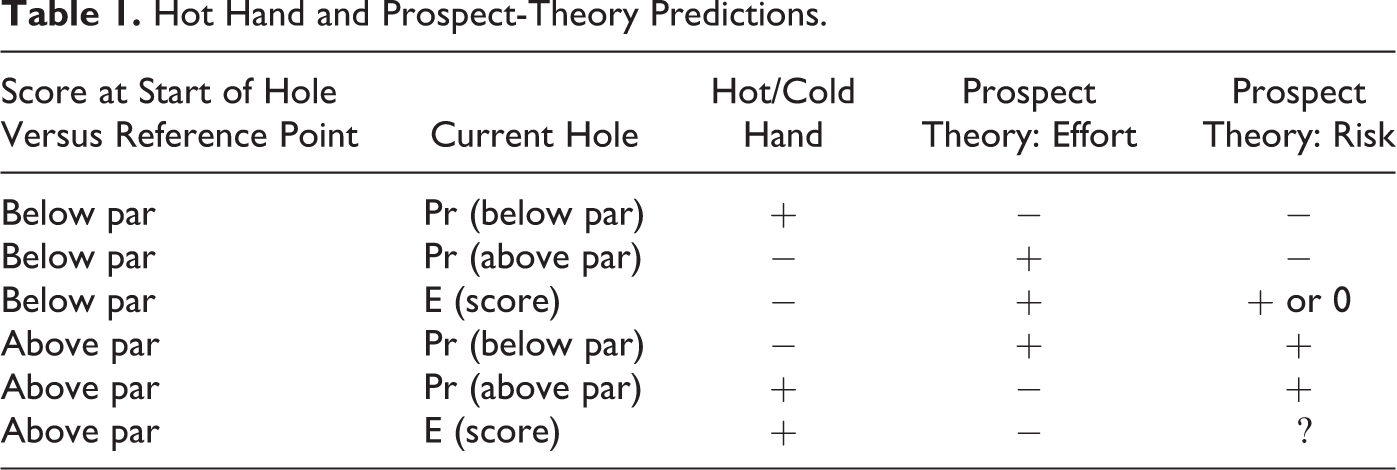
Table 1 summarizes the predicted effects for various outcomes for the different forces. Since each of the three mechanisms—hot/cold hands, effort, and risk preferences—makes a unique prediction of the combination of three types of outcomes (above par, below par, and mean performance), we can, loosely speaking, identify which of the three forces is dominant, by examining the effects of position versus the reference point for each of the three outcomes. 5 In the next section, we discuss the methods we use for estimating these effects.
Hot Hand and Prospect-Theory Predictions.
Empirical Methods
Model and Left-Hand Side (LHS) Variables
To test these predictions, it might be ideal to estimate a model that jointly analyzes more than one of the outcomes, such as multinomial logit (ordered logit would not be appropriate since the signs of the predicted effects are ambiguous). However, a nonlinear model like this is computationally infeasible, given the size of our data set and the need to include large sets of fixed effects (FEs). Instead, we use linear probability models for each of the probability outcomes (bp and ap, binary variables for below and above par on the current hole, respectively), and a linear model also for the outcome of score (s).
Right-Hand Side (RHS) Variables
To capture the effects of par for the round and tournament as reference points, we include, in all regressions, shots above par for the current round, rounda, shots below par for round, roundb, and (after Round 1) shots above par and below par for the tournament, tourna and tournb. Each of these variables thus takes a value of 0 or a positive integer. While we focus on linear specifications, we also examine nonlinear ones to examine how marginal effects and mechanisms may change as position versus the reference-point changes.
To capture the effects of score versus par for the last hole (to address the reference point of par for the rolling pair of the current and last holes), we include, in all regressions, lastb and lasta (strokes below and above par on the last hole, respectively). These variables are again weakly positive and integer valued. We explored including analogous variables for the last two and last three holes, but they do not qualitatively change the results and make the results harder to interpret and the presentation much more complex.
We include the last, round, and tourn variables in all models because they are obviously correlated and act as controls for one another, and it would be difficult to interpret results with these variables included in separate models. A natural alternative specification would be to include the scores for individual lagged holes as separate regressors. We think our specification is preferable because it maps directly to reference-point theory. It would be very difficult to interpret round and tournament reference-point effects with a lagged-hole score specification. However, one should note that our specification does imply that, in general, the coefficients cannot be interpreted as marginal effects, and it is more appropriate to consider the joint marginal effects over a set of holes such as a round, as we discuss in Magnitudes section.
Other Controls
In addition to the last/round/tourn variables acting as controls for one another, there are many factors that could confound our analysis. An important one is tournament standing. Players may sometimes have strategic incentives to go for riskier or more conservative shots to out-compete players with similar scores, and these incentives could be correlated with our regressors of interest. In particular, players likely vie to make the cut in the late holes of Round 2 (finish in the top half in order to proceed to Rounds 3 and 4) and vie to out-compete players with similar scores in the final holes of Round 4. Controlling for these incentives is very difficult and could create a “bad control” problem, since standing at the start of a hole would be affected by the regressors of interest. Thus, we limit our analysis to the rounds in which strategic incentives such as these should be minimal, Rounds 1 and 3. Since we have such a large sample, we can still obtain precise results for this limited scope. Moreover, in auxiliary analyses reported in the working paper version of this article (available on www.ssrn.com), we show results for Rounds 1 and 2 are similar, as are results for 3 and 4.
Other important confounding variables are player and course heterogeneity. FEs are clearly the ideal way to control for these factors. We include FEs for each hole-day, which accounts for variation in difficulty of courses, holes within courses, placement of the pin, and weather across rounds (we cannot control for weather changes within a round). Accounting for player heterogeneity is more difficult. We consider several types of FEs: player-year, player-year-par value, player-year and player-par value combined, and player-course. 6 Each of these, except the latter, accounts for player ability changing over time; player-course-year FEs would be equivalent to player-tournament FEs, which would be very collinear with the tourn variables. Accounting for par value is important since some players may be relatively good at longer or shorter holes, and par values are not independent across holes.
Including any of these FEs could cause a dynamic panel endogeneity bias, also known as Nickell bias (Nickell, 1981). The lagged dependent variable is endogenous in FEs panel data models, and the last/round/tourn variables are highly correlated with the lagged dependent variable in our models. 7 A standard way to address this problem is to use other lags as instruments (e.g., the Arellano–Bond estimator), but we cannot do this since we do not know which, if any, lags are exogenous. However, this bias disappears as T (number of observations per FE group) grows large. 8 Thus, we can minimize this issue by dropping FE groups with insufficiently large T. We determine what cutoff to use for T empirically. We do this by checking results for each type of FEs with progressively higher (minimum) T thresholds. If results change substantially from one threshold to another, this means the results for the lower threshold are very likely biased. If results are similar across thresholds, this means the bias has likely become small.
We report a large set of these results in the working paper but only summarize these results here in the interest of brevity. We find the Nickell bias is severe for player-course FEs, as results change sharply as the threshold grows until a large majority of the sample is lost. But the bias appears fairly mild for other FEs; results are roughly stable for a range of thresholds that maintain the large majority of the sample. Using our best judgment, we choose to proceed using player-year-par FEs with a threshold of 50 observations per FE group. These FEs are more conservative than both player-year and the player-year and player-par combination (since player-year-par allows player ability to vary by par-value across years), but more aggressive than player-year-par with higher thresholds, which lead to substantial sample losses (over 30% for a threshold of 100) but largely similar results. Still, we should keep in mind that we do not control for player-course effects.
The final (baseline) regression equation we use is thus:

The subscript i denotes the player-year-par FE group, and h denotes the course-hole-day FE group. The dependent variable, y, is below par (bp, 0/1), above par (ap, 0/1), or the score (s,…, −2, −1, 0, 1, 2, … ). Standard errors are clustered by player tournament. Summary statistics for our final sample, and variable definitions, are provided in Table 2. Scores tend to be better for last and round variables in Round 3, likely due to the better golfers making the cut to continue to Round 3. 9
Summary Statistics for Final Sample.
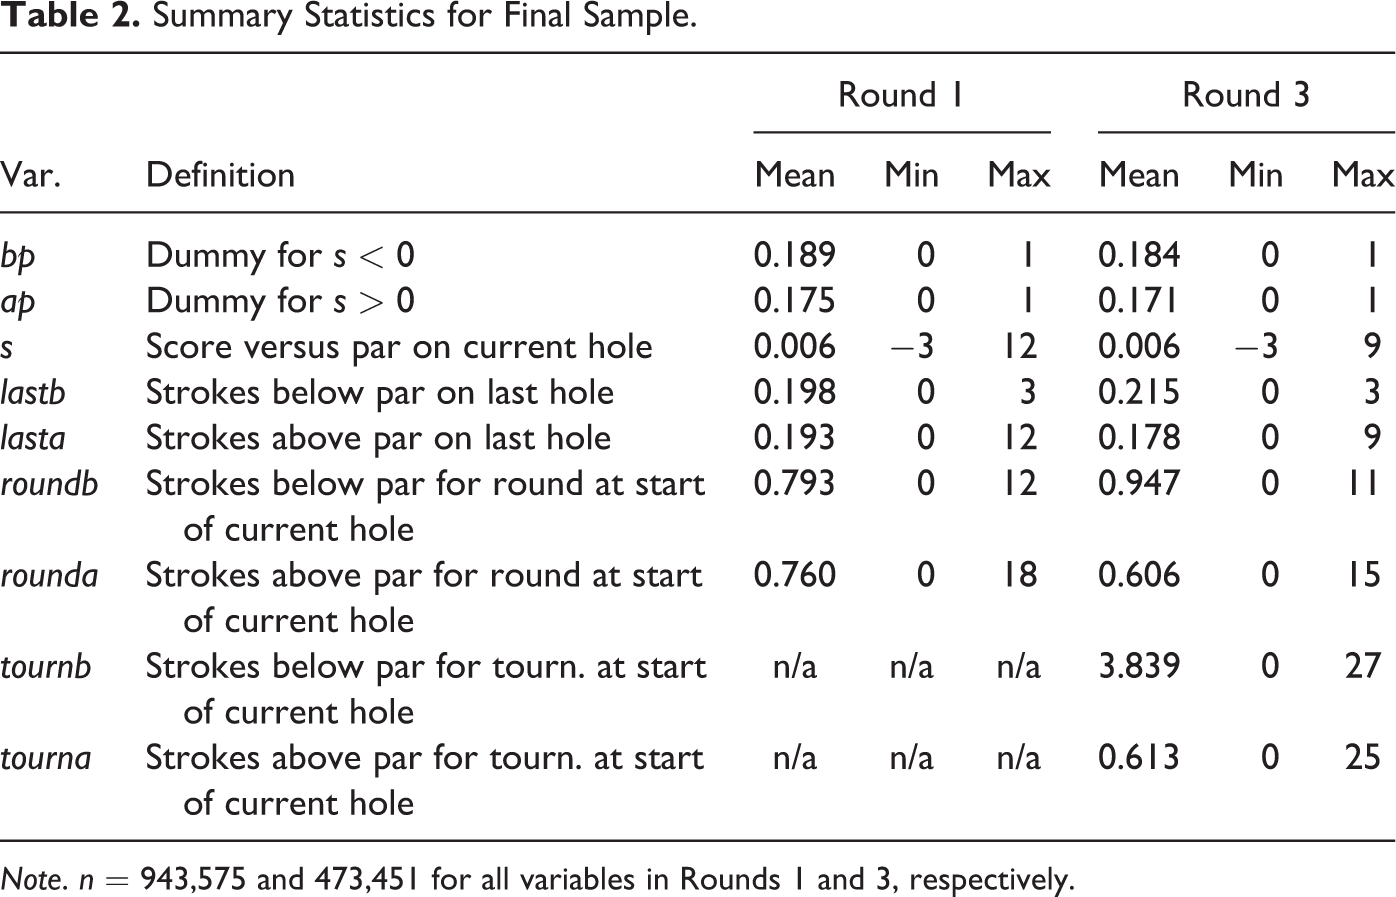
Note. n = 943,575 and 473,451 for all variables in Rounds 1 and 3, respectively.
Results
Main Results
Table 3 presents the various results for the baseline model. We interpret these results using the predictions of Table 1 and focus our discussion on the significant results. We do not present tests of joint significance for any of the variables because joint effects are analyzed in the Magnitudes section. We first discuss the variables measuring gains and then those for losses.
Main Results.
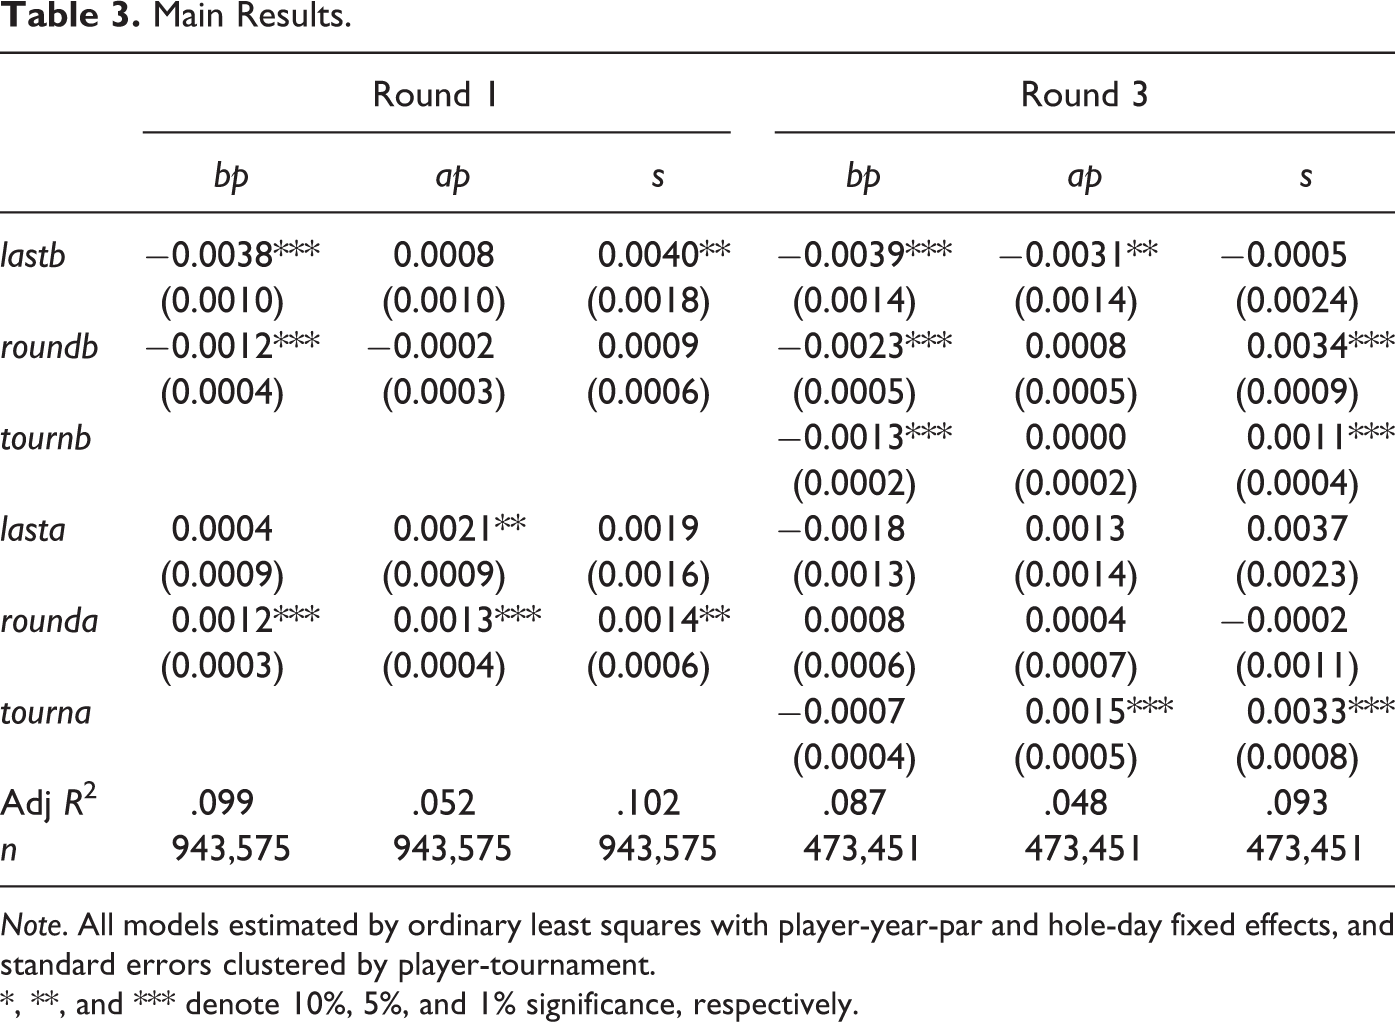
Note. All models estimated by ordinary least squares with player-year-par and hole-day fixed effects, and standard errors clustered by player-tournament.
*, **, and *** denote 10%, 5%, and 1% significance, respectively.
All five of the variables increasing in gains versus reference points (lastb, roundb, and tournb, with the first two included in the models for both Rounds 1 and 3) have significant negative effects on the probability of scoring below par on the current hole. This is quite strong evidence that prospect-theory effects (effort and/or risk) dominate hot-hand effects for this outcome. As players move further into the domain of gains for each reference point, they do not exert as much effort or play more conservatively on subsequent holes.
In Round 3, an increase in lastb is also associated with a lower probability of scoring above par on the current hole. This result, together with the lower probability of birdie, is consistent with the prospect-theory risk prediction that golfers become more conservative when they have gains they wish to preserve. The evidence for a lower above-par probability in the domain of gains is insignificant for the other gains variables but usually directionally consistent with conservatism.
Turning to the outcome of average score, three of the five gains variables have significant positive coefficients, and there are no significant negative ones. The positive sign is consistent with both (prospect-theory) risk and effort predictions and inconsistent with the hot-hand prediction.
In the domain of losses, three of the five variables have significant positive effects on the probability of scoring above par on the current hole: lasta, rounda in the first round and tourna in Round 3. There are no significant negative effects for this outcome. In Round 1, being above par for the round also is associated with a higher probability of a score below par. The combination of these two effects (higher chances of scores below and above par) is consistent with the risk prediction (greater risk seeking). In Round 3, tourna is also associated with higher average scores (and no increase in the chance of birdie). The combination of effects for this variable is most consistent with the cold hand. It is unlikely that this result is driven by within (current) round weather changes, since tournament scores during Round 3 are mostly based on performance in the previous two days. Player-course effects should affect performance in both rounds in a similar way, so these effects likely do not explain the stronger cold-hand results in Round 3. It is possible that these results are influenced by injuries (or other factors), but these likely should also cause similar results in Round 1. Therefore, we interpret our results as implying that cold-hand forces are at least relatively strong in Round 3 when tournament scores are high.
We explore these results further in several ways. First, we examine nonlinear specifications. As discussed above, diminishing marginal sensitivity is an important part of prospect theory. Thus, the benefit of an additional gain declines as scores fall further below par. But this means the cost of an additional loss also declines. This could cause golfers to actually reduce effort as scores rise above par (for the round or tournament). On the other hand, if golfers integrate the value they could receive by eliminating losses on future holes, effort could continue to grow as scores rise further above par. Moreover, changes in the curvature of the value function at different values of x could cause changes in risk attitudes.
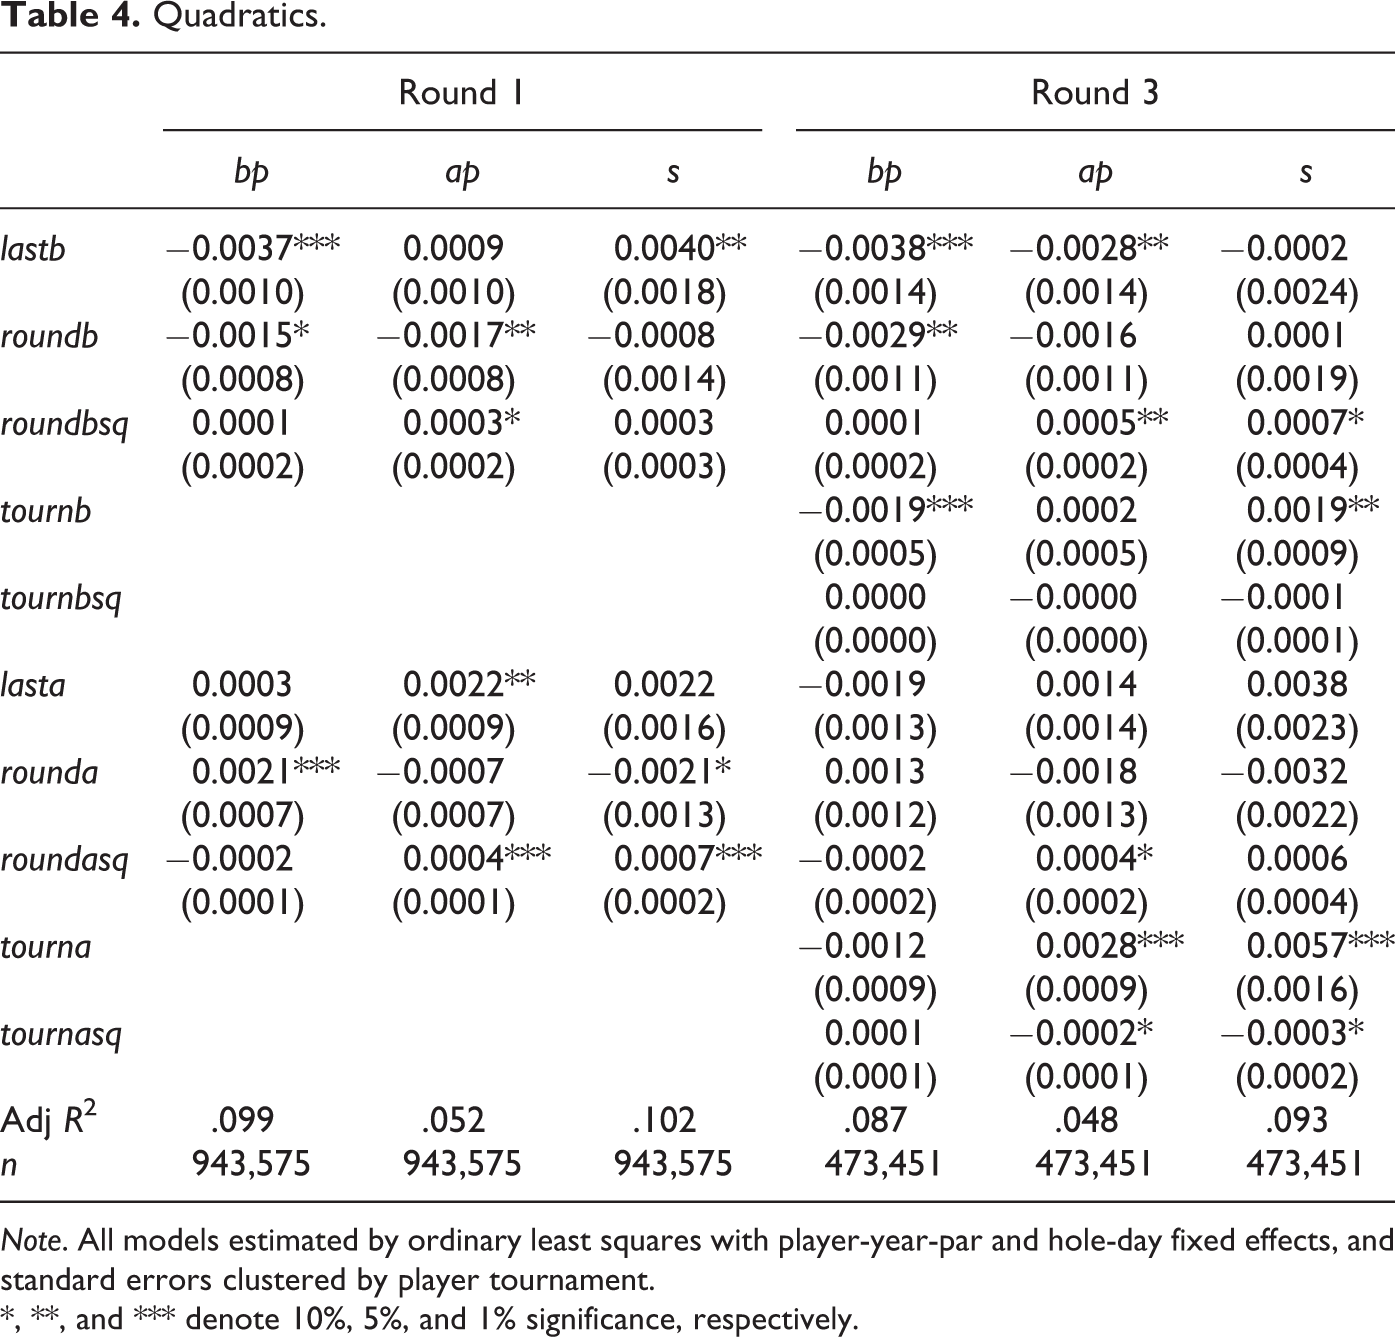
We use two nonlinear specifications; first, a relatively flexible quadratic, allowing marginal effects to grow, shrink, or neither. These results are in Table 4. The roundb linear terms for outcomes bp and ap are both negative in Round 1, indicating risk effects that were less clear in Table 3. However, the squared term is positive and significant at the 10% level, indicating that the ap (bogey) effect disappears as roundb increases. Thus, the combination of these results implies risk (effort) effects are stronger for scores closer to (further from) the reference point. Moreover, in Round 3 the roundb-square term is significantly positive for ap and s, further indicating that effort effects are relatively dominant for higher values of roundb.
Quadratics.
Note. All models estimated by ordinary least squares with player-year-par and hole-day fixed effects, and standard errors clustered by player tournament.
*, **, and *** denote 10%, 5%, and 1% significance, respectively.
Regarding the domain of losses, for Round 1 the rounda-square terms for the LHS variables ap and s are both positive, indicating the marginal cold-hand and/or risk effects grow as a golfer moves further into the domain of losses and that effort effects may be dominant for scores just above par. That is, golfers may successfully “try harder” when scores are just above par in Round 1, but this extra effort does not occur, or is less effective, as scores go further over par. For Round 3, again there is no evidence of any type of increase in the chance of birdie. The cold-hand effect indicated by higher scores for the tournament increases as scores grow, but the marginal effect declines (the tourna-square terms are negative and significant for outcomes of above par and average score).
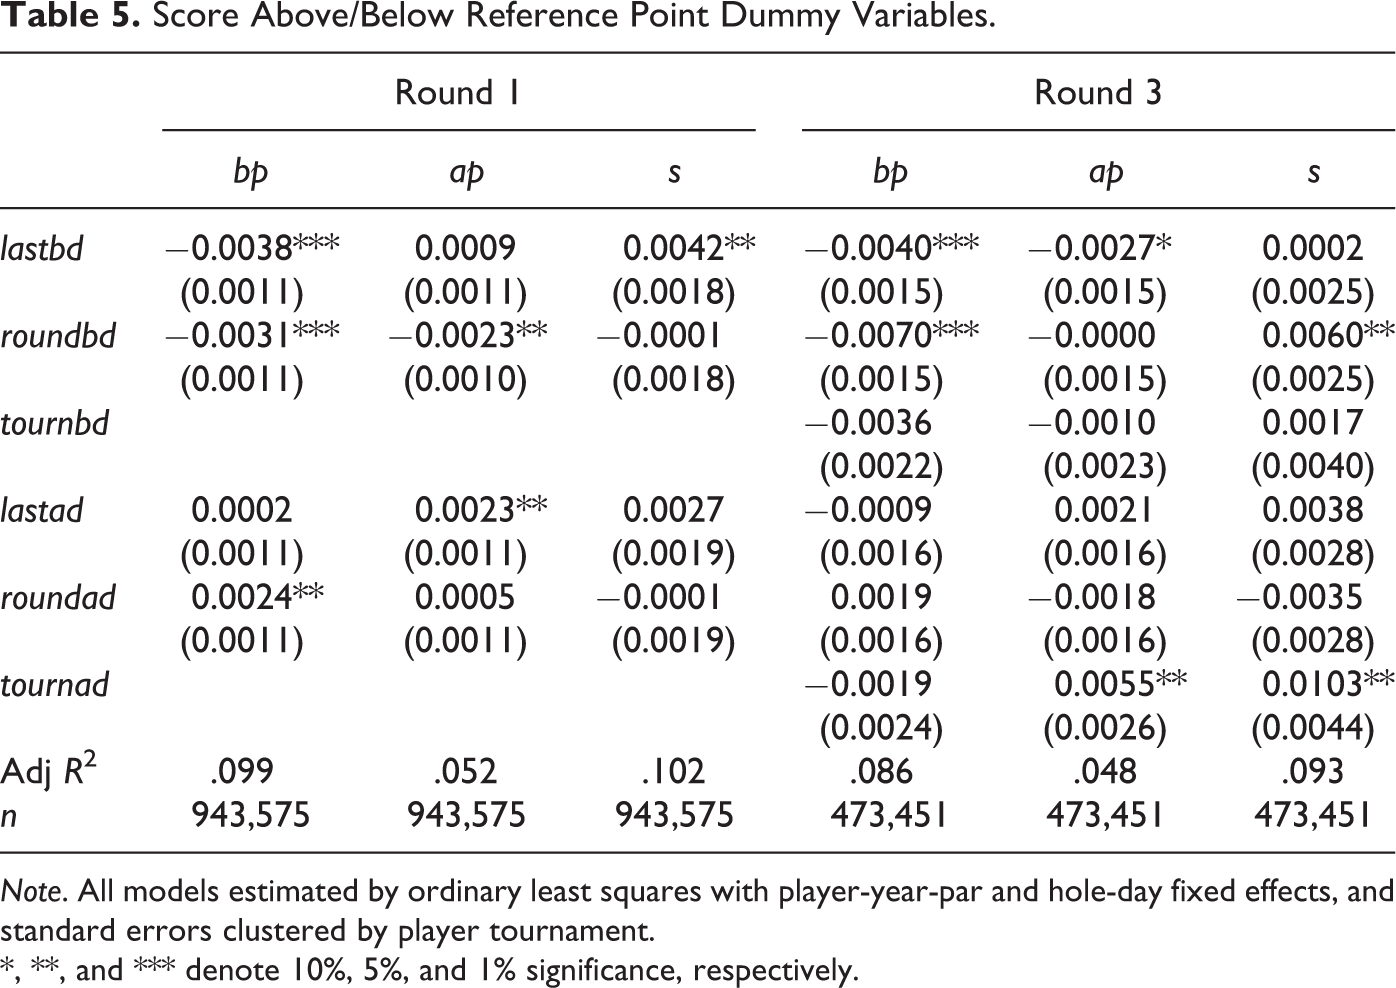
Next, we examine a specification in which the RHS variables are recoded as dummies equal to 1 if the original regressors took strictly positive values. This of course is a much less flexible specification but is appropriate if golfers focus on whether or not they are in the domain of gains or losses, and not “where” they are in either of these domains. These results are presented in Table 5. There are some intriguing results here that did not emerge in Table 3. In particular, being below par for the round (roundbd=1) decreases the chance of ap = 1 in Round 1 and does not increase the chance of ap = 1 in Round 3. These results differ from analogous results for roundb reported in Tables 3 and 4. These new (Table 5) results are more indicative of risk effects than effort effects. Since the Table 6 results are relatively highly influenced by lower values of roundb, and the Tables 3 and 4 results more by higher values, this comparison supports the conclusion that risk effects are stronger for lower values of roundb, and effort effects stronger for higher values. For the domain of losses, the results are also supportive of the interpretation of Table 5 discussed above.
Score Above/Below Reference Point Dummy Variables.
Note. All models estimated by ordinary least squares with player-year-par and hole-day fixed effects, and standard errors clustered by player tournament.
*, **, and *** denote 10%, 5%, and 1% significance, respectively.
Koszegi and Rabin (2006) Reference Points.
Note. All models estimated by ordinary least squares with player-year-par and hole-day fixed effects, and standard errors clustered by player tournament. See text for definition of adjusted variables.
*, **, and *** denote 10%, 5%, and 1% significance, respectively.
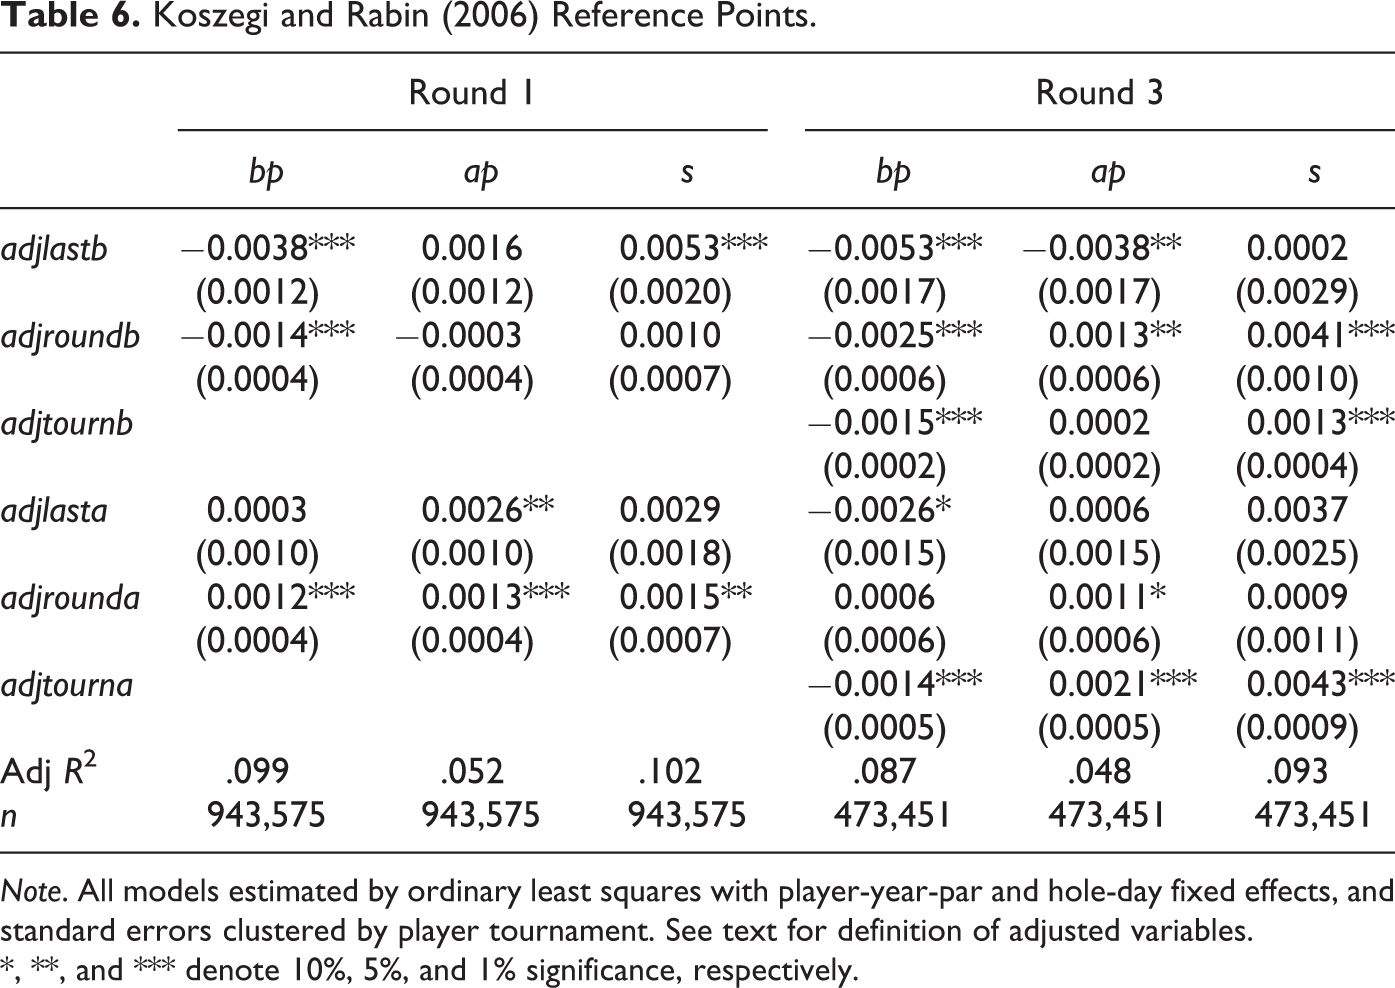
A potential critique of our analysis is that par is not always the most relevant reference point that players expect better scores on relatively easy holes and worse scores for tougher holes. 10 Consequently, a bogey on a difficult hole may be perceived as a relatively small loss and a birdie on an easy hole a small gain. This theory of expectations-dependent reference points was first developed formally by Koszegi and Rabin (2006). PS analyze this theory in their context and find support for it.
We conduct a similar analysis, subtracting the mean score for each hole–tournament–round from each player’s score and then reconstruct the last, round, and tourn variables with these difficulty-adjusted scores. The new variables are referred to as adjlast, adjround, and adjtourn. For example, if a golfer birdied Hole 1 in Round 1, but every golfer birdied that hole, then adjlastb=0 on Hole 2, while lastb=1. The results are in Table 6. The point estimates are indeed generally a bit stronger than their analogs in Table 3, supporting the theory, and largely consistent with the interpretation of the original results discussed above. A difference worth noting is that adjroundb has a significant positive effect on ap in Round 3 (while roundb did not), supporting the effort prediction of that situation.
Hole and Player Heterogeneity
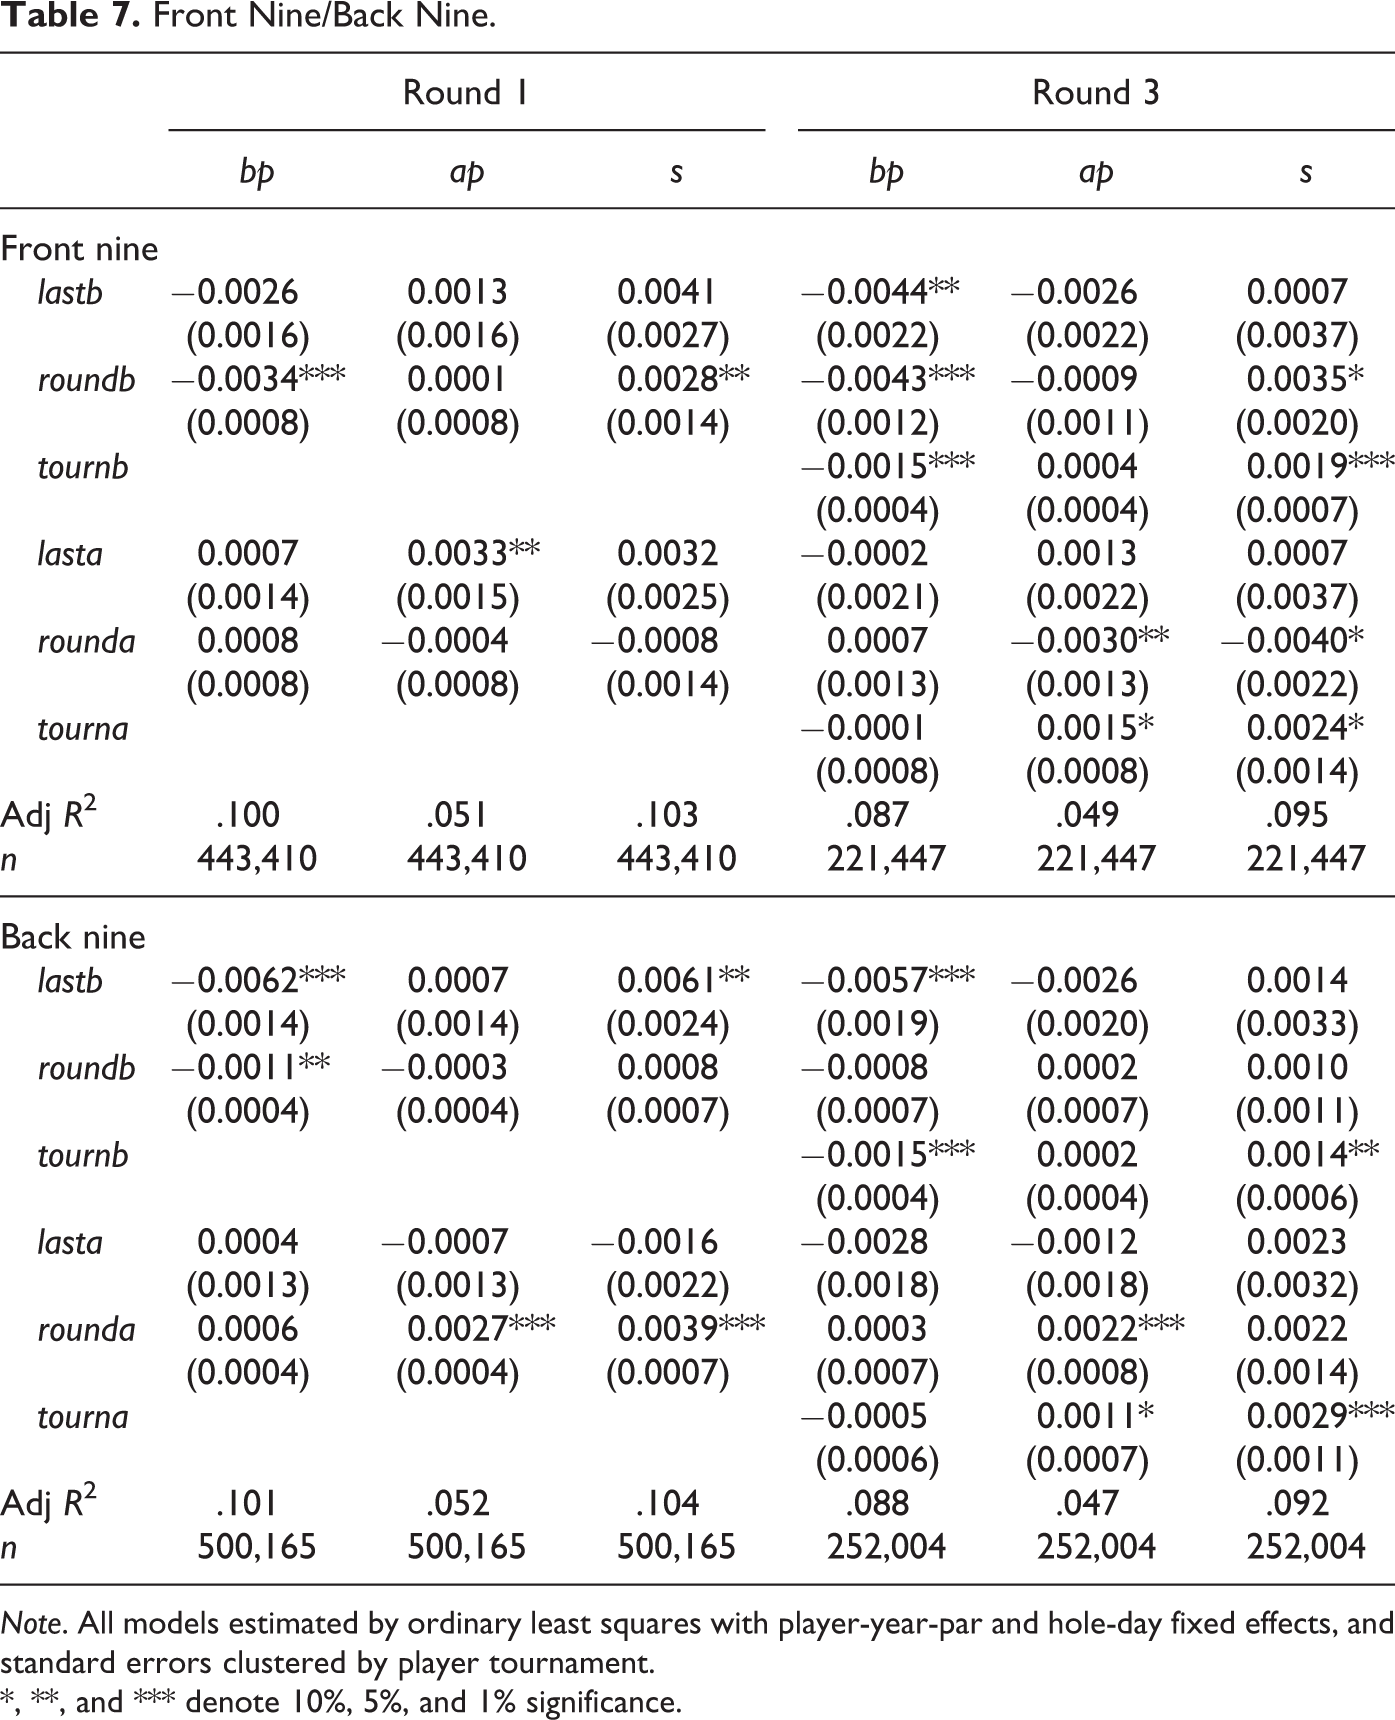
In order to better understand these results, we disaggregate the sample in several ways. First, we split it into “front nine” holes (first nine holes played in the current round, which sometimes are the course’s Holes 10–18) and “back nine” holes and estimate the baseline models for each of these subsamples. 11 The results, in Table 7, indicate that lastb effects are larger on the back nine, and roundb effects greater on the front nine. This is consistent with the idea that score relative to par for the round could be especially salient early in the round, when one has recently started from the reference-point score of 0. Later in the round, golfers may become accustomed to being below par and adjust their reference point (and focus more on the most recent holes). Thus, this is additional evidence of expectations-adjusted reference points. Table 7 results also suggest that cold-hand effects (for the round and tournament) accelerate on the back nine.
Front Nine/Back Nine.
Note. All models estimated by ordinary least squares with player-year-par and hole-day fixed effects, and standard errors clustered by player tournament.
*, **, and *** denote 10%, 5%, and 1% significance.
In Table 8, we present results for an analysis split by par value per hole. Effects are generally stronger for the longer holes, consistent with the effects compounding across shots. In particular, in Round 3, the roundb and tourna positive effects on score increase for larger par values. We might expect, a priori, the risk effects to be relatively visible for par-5 holes, as players then face the strategic choice of whether to “go for the green” on the second shot. And indeed, the rounda effects in Round 1, consistent with greater risk seeking, are strongest for par-5 holes. However, the separate par-5 analysis does not reveal changes in other risk attitudes obscured by the more aggregated analysis.
Par 3/4/5.
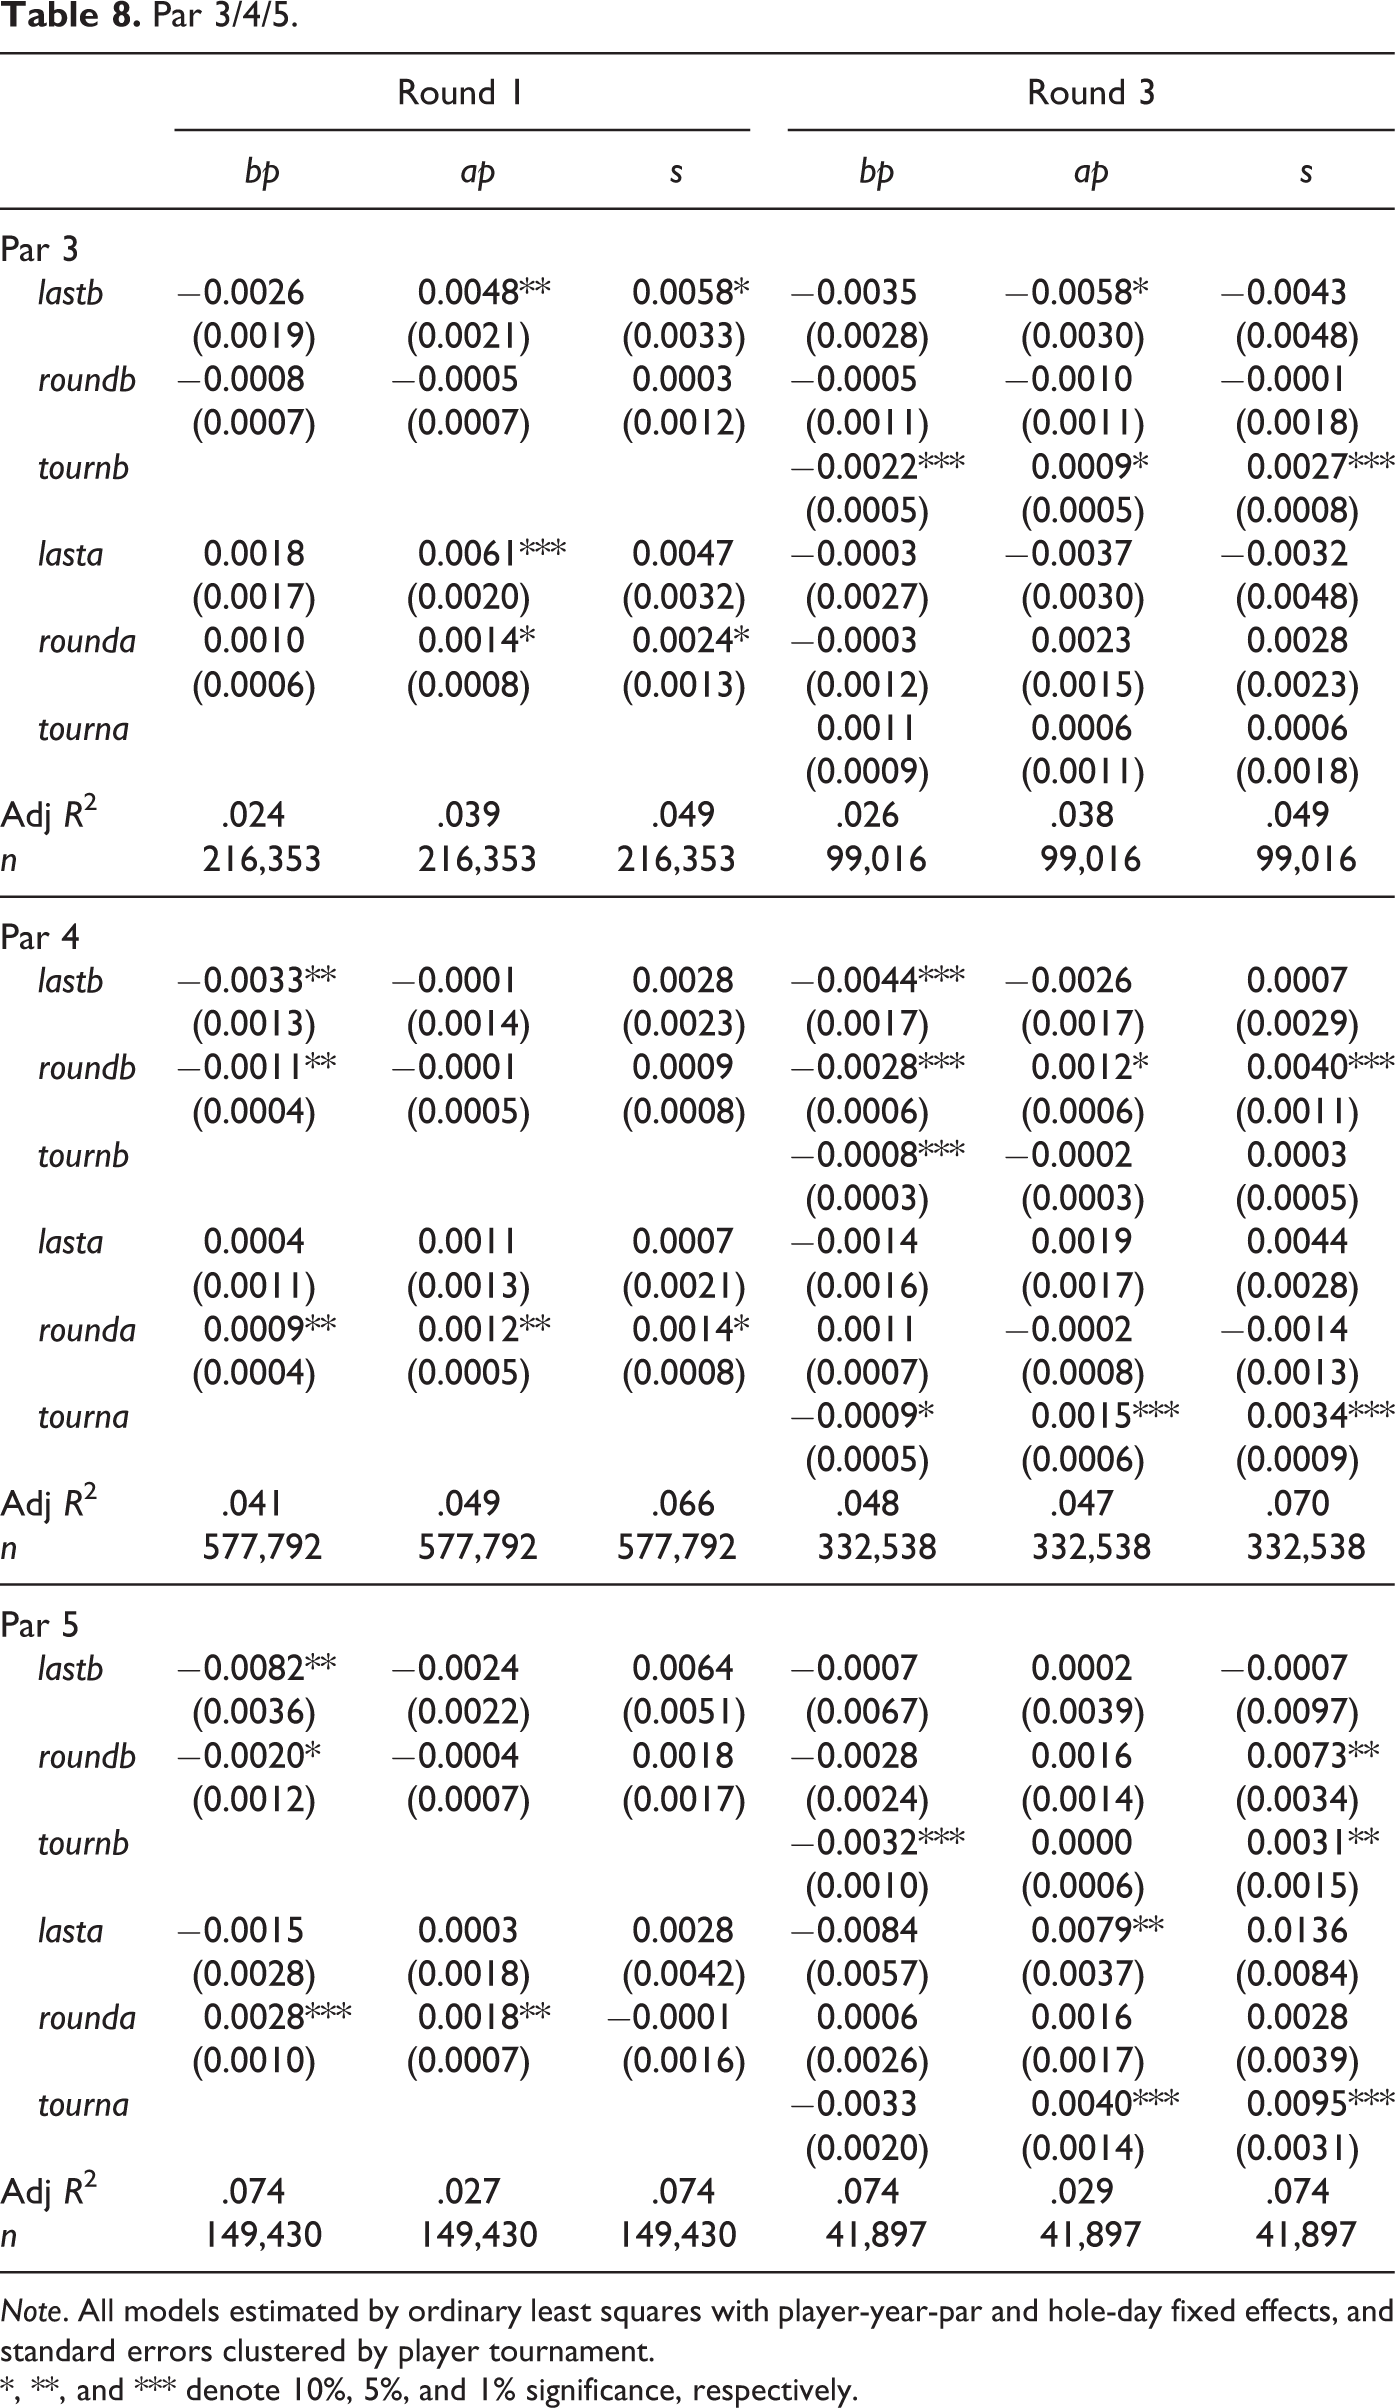
Note. All models estimated by ordinary least squares with player-year-par and hole-day fixed effects, and standard errors clustered by player tournament.
*, **, and *** denote 10%, 5%, and 1% significance, respectively.
We next split our sample by official world golf ranking (for the end of the prior calendar year) and present results in Table 9. 12 Results are fairly similar for higher and lower ranked players. Important differences are that roundb effects in Round 1, and tournb effects in Round 3, are stronger for the worse ranked players, consistent with worse ranked players having expectations-based reference points closer to par in Round 1 and for the tournament in Round 3. However, we also find roundb effects for better ranked players in Round 3. Perhaps this is because, after making the cut, their initial expectations/goals have been met, and the reference point of par for the current round becomes more relevant. The tourna effects in Round 3 are similar for both groups of players.
Player Rank.
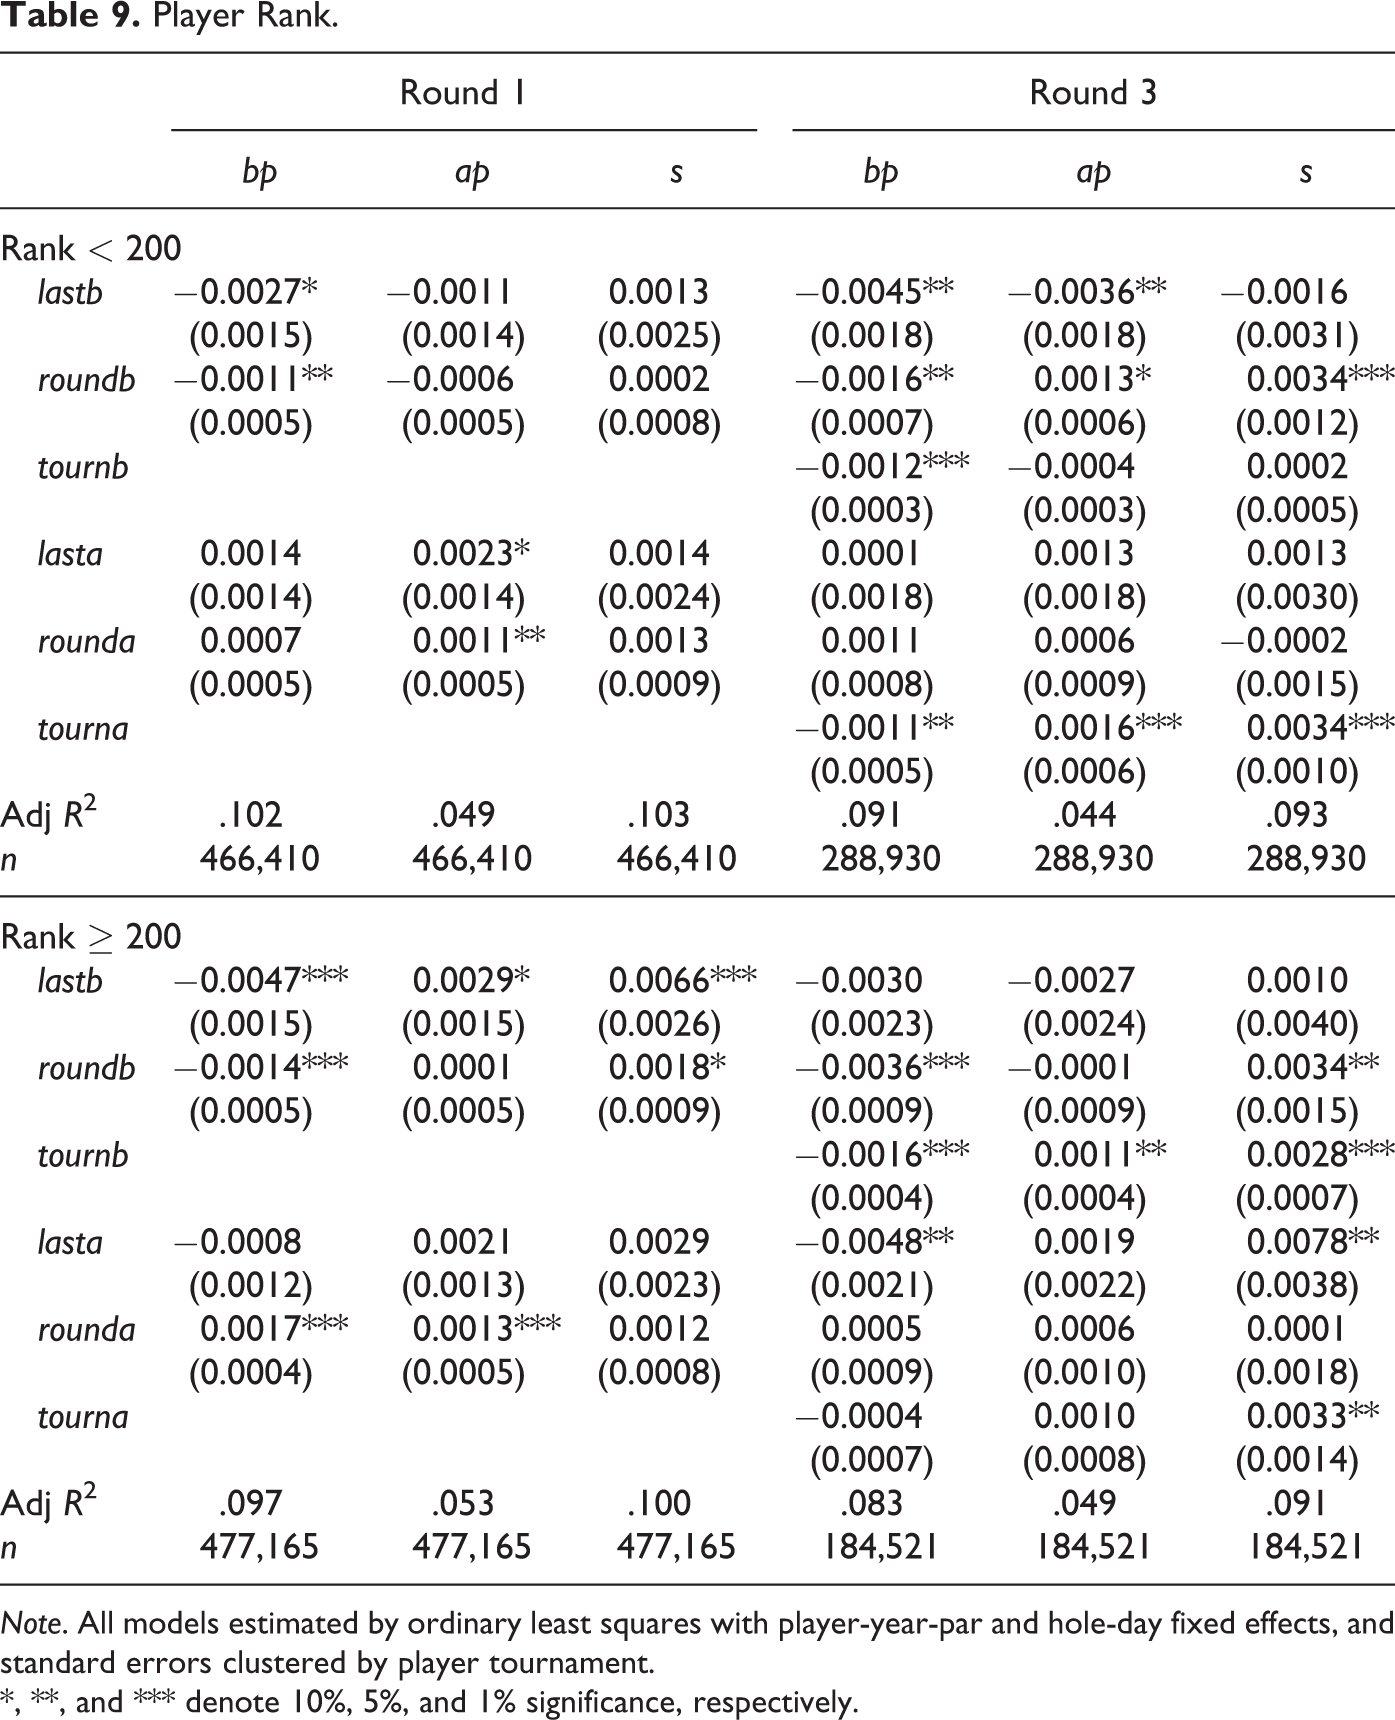
Note. All models estimated by ordinary least squares with player-year-par and hole-day fixed effects, and standard errors clustered by player tournament.
*, **, and *** denote 10%, 5%, and 1% significance, respectively.
Drives, Approaches, and Putts
There are three main types of golf shots: drives, approaches, and putts. We analyze the effects of reference points on these different shots to gain further insight into the various types of behavior.
For drives, we use two LHS variables: distance and a dummy for whether or not the drive landed on the fairway (0/1). Improvements in both distance and fairway accuracy would indicate greater effort, while different signs for these effects would indicate a change in risk attitude (longer drives and lower accuracy would indicate a riskier strategy and vice versa for a more conservative strategy). We exclude holes that have an average drive distance of less than 260 yards, as these are likely holes in which drive distance is shortened by the layout of the hole.
For approaches, we use a sample of the first shot on a given hole for which the ball is between 100 and 200 yards from the hole and on the fairway. We examine three LHS variables, average distance from the hole after the shot, a dummy for “close” distance (within 8 feet of the hole), and another dummy, “far” (20 feet or more from the hole). Results are similar with different cutoff values. These cutoff values defining close and far are based on the probability of making a putt from a given distance: 8 feet is a cutoff for which anything closer has, on average, a 50% or higher probability of having the putt made, while putts beyond 20 feet have less than a 15% probability of being made. These three outcomes map to the three outcomes used for the analysis of hole-level results, representing mean performance, and probabilities of above- and below-average performance, respectively. We include a seventh-order polynomial for distance from hole to account for difficulty of the shot.
For putts, we use a binary dependent variable (miss/make) and controls of seventh-order polynomial for distance and an interaction of distance groups and elevation-change-to-hole decile; (own) putt number for the hole; dummies for whether the putt is for eagle, birdie, bogey, or double-bogey or greater. Our results for these variables, which are not reported, are similar to those of PS but slightly smaller in magnitude. 13
These results are in Table 10. In general, results are stronger for drives and approaches, indicating reference points based on scores from past holes are more important for initial shots on the hole, and the reference point of par on the current hole is most important for the final shots on the hole (putts), supporting the idea that more salient reference points have greater impacts. lastb is associated with a shorter drive in both rounds, and lasta a longer drive in Round 3. These results could be evidence of risk or effort effects. In Round 3, being above par for the round also leads to riskier (longer and less accurate) drives. Being below par for the round in Round 3 leads to shorter drives and worse all-around approach shots, consistent with effort effects.
Drives/Approaches/Putts.
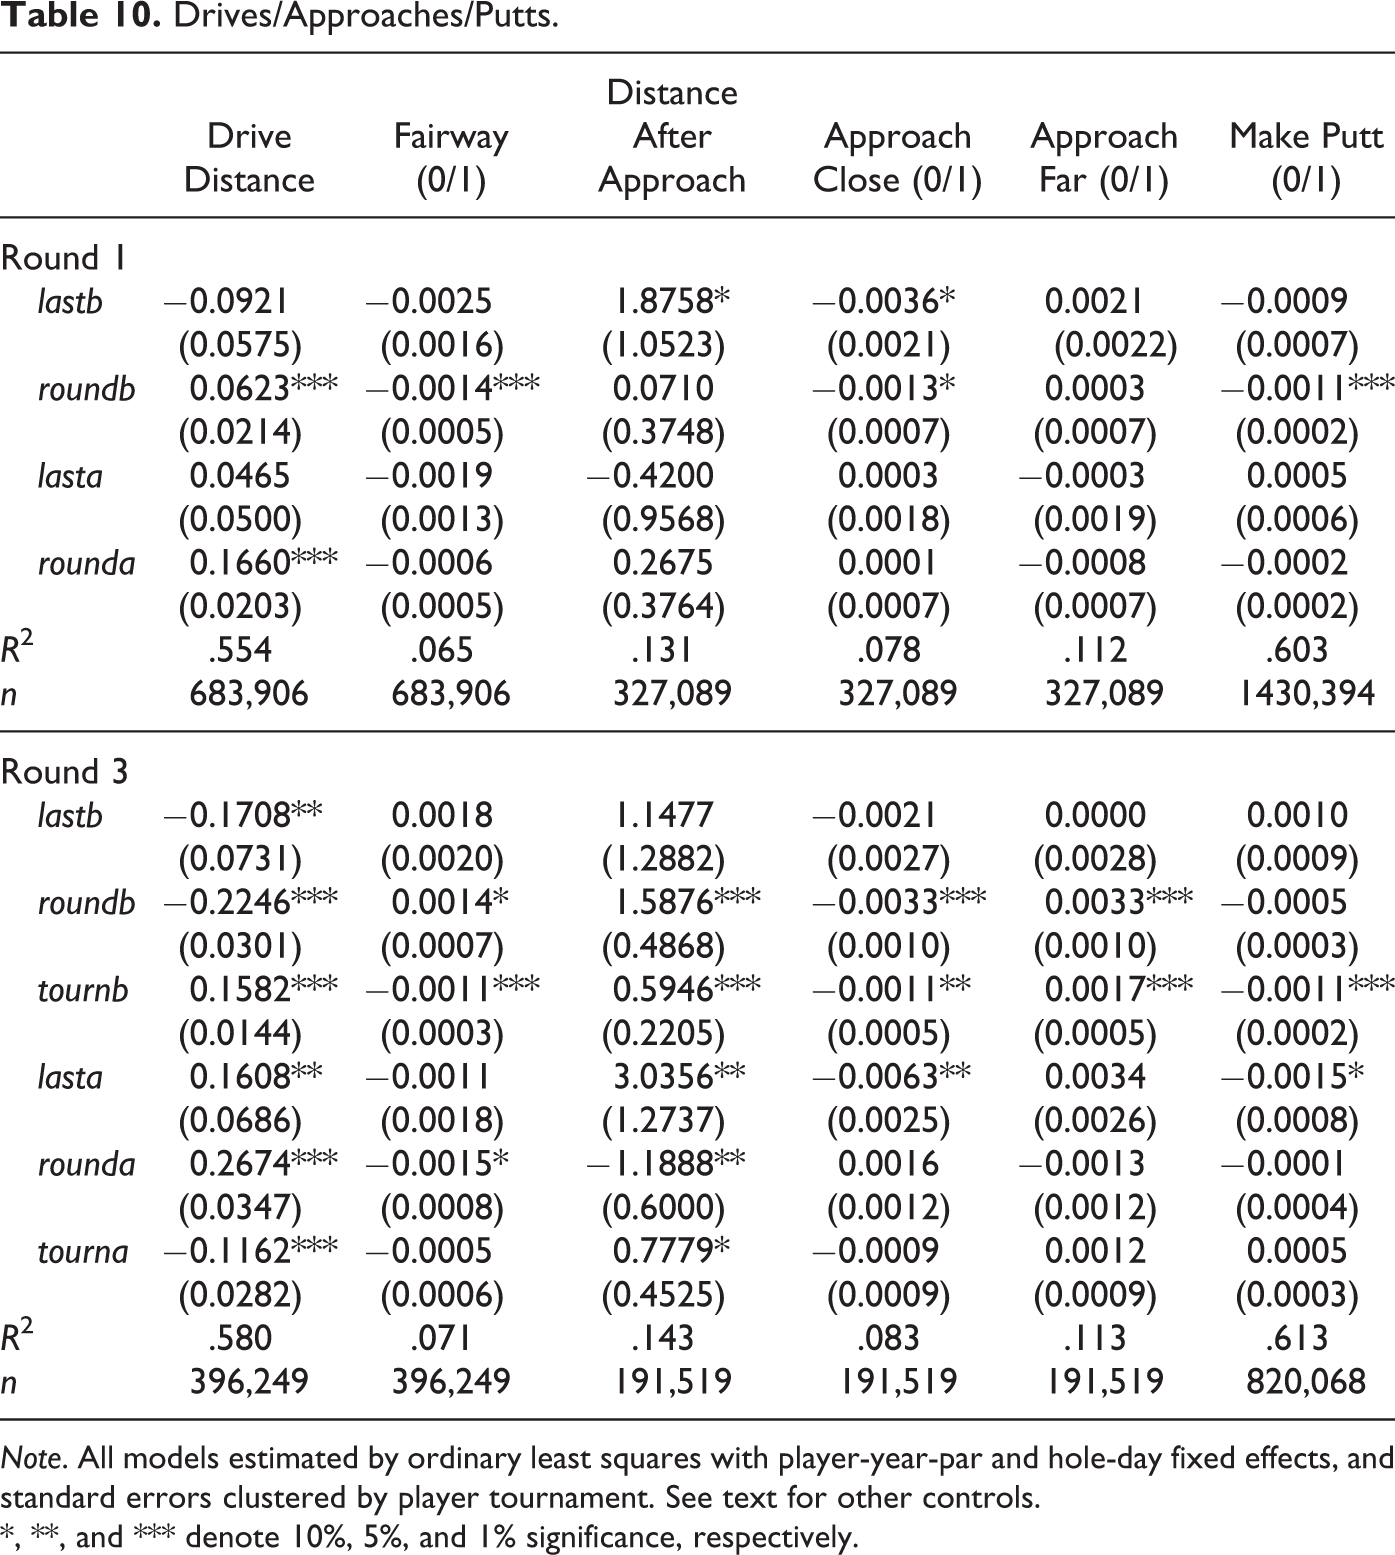
Note. All models estimated by ordinary least squares with player-year-par and hole-day fixed effects, and standard errors clustered by player tournament. See text for other controls.
*, **, and *** denote 10%, 5%, and 1% significance, respectively.
Scores below par for the round in Round 1, and for the tournament in Round 3, are both associated with riskier drives (longer distance and lower accuracy). The combination of these effects (greater risk but worse “quality”) is not consistent with any of the predictions from Table 1 but could result from the hot-hand bias, that is, a misperception of being hot leading to riskier shots. These same variables, lastb and tournb, are also associated with lower probabilities of making putts, and (all-around) inferior approach shots in Round 3. Since our approach shot sample is limited to shots taken from the fairway, this means the drive leading to the approach must have been accurate. This suggests an interpretation of the results in which golfers who are playing well for the tournament take aggressive drives, then “shirk” on the approach shot and perhaps the putt as well (the putt effects could also be due to conservatism). This contrast in behavior across types of shots for a given reference-point effect is somewhat puzzling. Perhaps taking aggressive drives is simply highly appealing or fun (there is a saying that you “drive for show, putt for dough”). It is also possible that the decline in all-around performance on approach shots and putts when in the domain of gains could be caused by the hot-hand bias causing golfers to exert less effort due to overconfidence.
In the final analysis of this section, we exploit the disaggregation of shots within a hole to better separately identify momentum and prospect-theory effects. We do this by controlling for lagged performance for the particular shot type, in addition to the standard last/round/tourn variables. The lagged shot-type performance controls provide a relatively direct measure of recent quality of play for that particular shot type and should thus capture momentum effects in a more pure way. Consequently, the last/round/tourn should now more directly capture the more decision-theoretic prospect-theory effects. We conduct this analysis as a final extension rather than as the primary analysis of the paper for two reasons. First, and foremost, we are ultimately interested in total effects on scores. If the phenomena interact, exacerbate, or mitigate one another with respect to these effects, so be it. The net effects are still most important, and the hole-level score-based analysis implicitly addresses this bottom-line issue of score effects most directly. Second, controlling for past performance for a particular shot type opens up a new can of methodological worms. In fact, we limit this new analysis to just one shot type, drives, since measuring past performance for other shot types is more difficult. Despite these issues, however, we feel this additional analysis clarifies and complements the main results.
We control for recent performance on drives in two ways: (1) with lagged distance (lagdist) and fairway (lagfairway) and (2) with a moving average of distance on the last three holes (M Adist) and fairway accuracy on the last three holes (M Afairway) calculated using just one or two values when they are the only ones available (for holes 2–3 of a round and when one or more of the last three holes was a par 3 or dropped par 4 or 5). Results are in Table 11. We include the results for drives reproduced from Table 10 for ease of direct comparison. The coefficients for the last/round/tourn variables with either type of lagged drive controls are typically stronger and directionally the same as the original coefficients. This supports the interpretations discussed above, in particular, the point that the estimated effects were mitigated somewhat by countervailing momentum effects. Moreover, the coefficients for the lagged drive performance variables are generally consistent with momentum. However, we cannot tell to what extent they are driven by the hot versus cold hands.
Additional Analysis of Drives (Round 3 only).
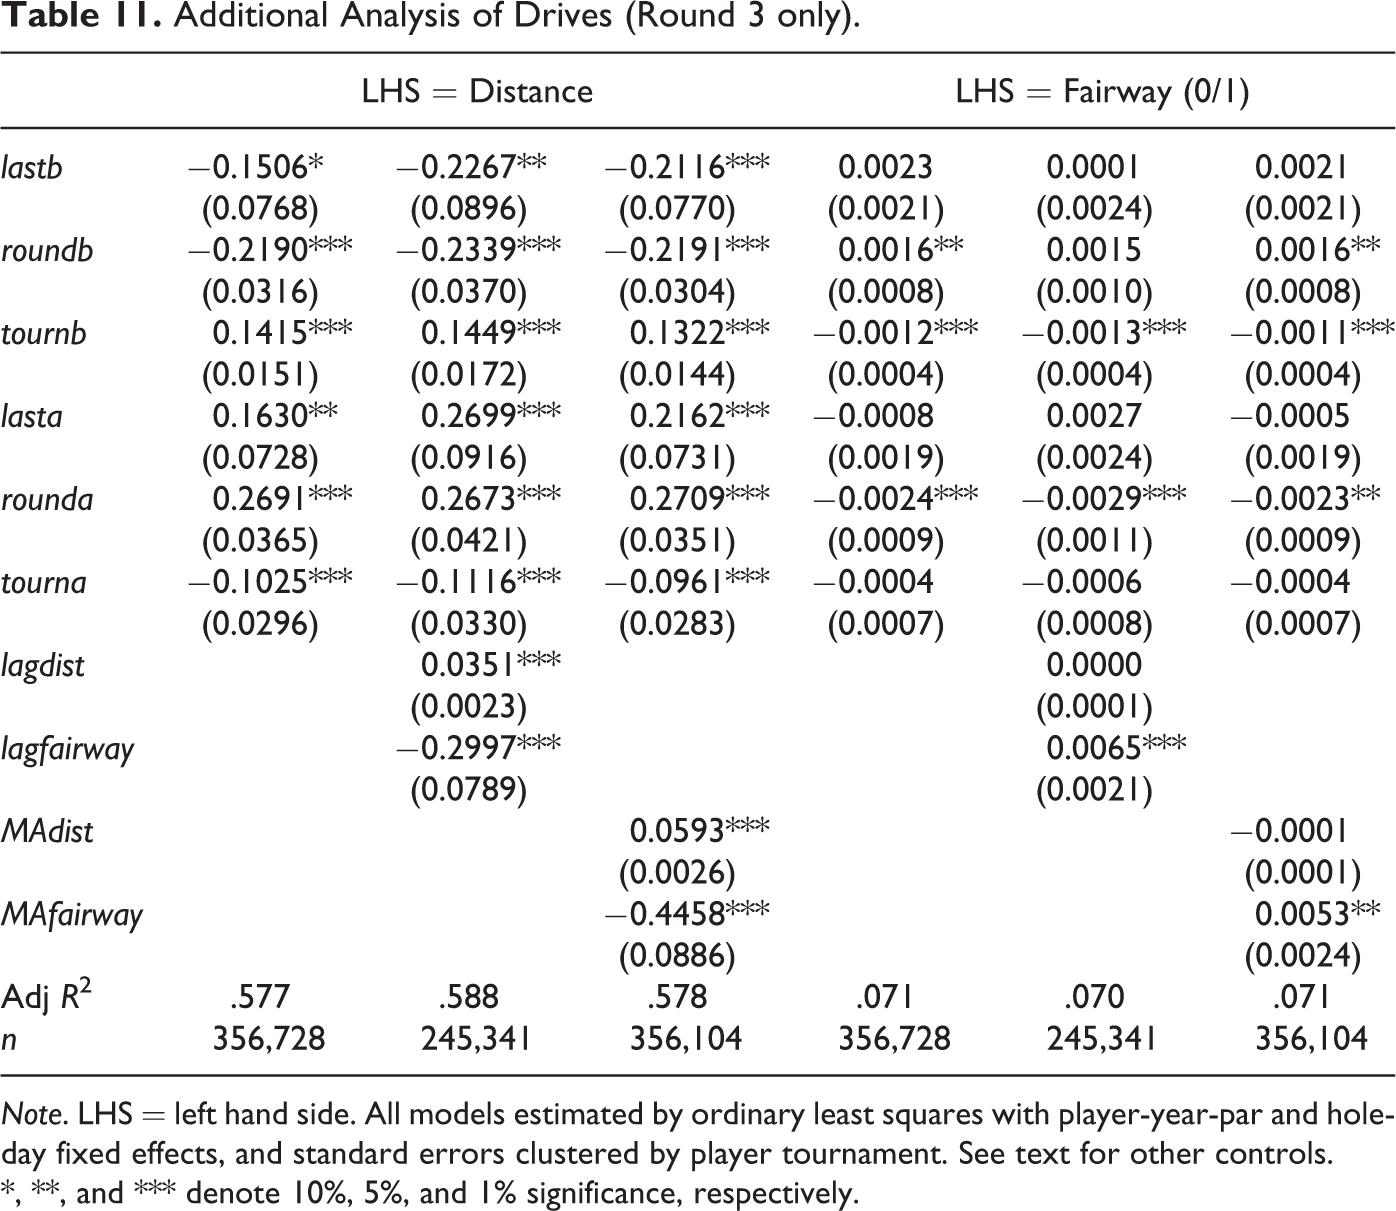
Note. LHS = left hand side. All models estimated by ordinary least squares with player-year-par and hole-day fixed effects, and standard errors clustered by player tournament. See text for other controls.
*, **, and *** denote 10%, 5%, and 1% significance, respectively.
Magnitudes
Thus far we have omitted discussion of the magnitudes of effects due to the complexity caused by interactions and dynamic effects across holes. When a golfer gets, say, a bogey on one hole, this certainly increases the value of lasta for the next hole, but may increase, decrease, or have no effect on all of the round and tourn regressors. Moreover, the bogey also affects the values of these regressors for future holes. In general, it is misleading to interpret the magnitude of any individual estimate alone as a marginal effect and is more appropriate to estimate the reference-points’ joint effect for a larger set of holes, such as a round. Thus, in this section we estimate the expected total score for various sets of holes, for example,
We use the following simulation-based procedure. For simplicity, and to be consistent with the empirical models used for the LHS variables ap and bp in Results section, we restrict the score for each hole to be −1, 0, or 1. We assume
This procedure yields a distribution across simulation runs of round- or half-round-level effects for a given set of point estimates for the last/round/tourn coefficients. The mean of this distribution should be an unbiased estimate of the expected (half)-round-level joint effect (of the last/round/ts variables). We find by “guess and check” that 100,000 simulation runs are necessary to get the mean of this distribution to stabilize within 0.01 strokes across nearly all simulation runs, and we therefore use this number of runs for this procedure.
This distribution across simulation runs is driven by randomness in hole-level score draws and does not yield a confidence interval for the round-level effect. To obtain such a confidence interval, we need to use the estimated sampling distribution of the coefficient estimates. A naive way to do this would be to just use lower and upper bounds of the (analogous) confidence intervals for each of the coefficients, but this would ignore the joint distribution of the coefficient estimates. Thus, instead we take draws from a multivariate normal distribution with means equal to the coefficient estimates, and covariance of the estimated covariance matrix, at the start of each simulation. We conduct a different 100,000 run (half)-round-level simulation for each of these draws, storing each mean effect. We repeat this procedure 1,000 times, giving us a distribution of 1,000 estimates of (half)-round-level effects reflecting sampling uncertainty. We then use the 2.5th and 97.5th percentiles from this distribution to construct a 95% confidence interval for the average (half) round effect.
To summarize, the procedure for a round-level effect is as follows (the half-round procedure is analogous): draw one coefficient vector from two multivariate normal distributions, one with parameters equal to the bp model estimates, and one using the ap model estimates, draw a score of −1, 0, or +1 for Hole 1 using probabilities 0.195, 0.640, and 0.165, respectively, use this score and coefficients from Step 1 to calculate predicted probabilities for Hole 2, continue this procedure for Holes 3–18; sum scores for Holes 1–18 to get a round score, repeat Steps 2–4 100,000 times and store the mean to obtain a precise estimate of the mean round score for the coefficients from Step 1, and repeat Steps 1–5 1,000 times to obtain an estimated sampling distribution of this mean round score. Use the mean of this distribution as the point estimate, and the 2.5th and 97.5th percentiles as the 95% confidence interval, for the expected round-level score.
Results are presented in Table 12. We report the implied joint effects of reference points compared to the null; these are equal to the differences between our estimated half round/round scores and the corresponding expected scores under the null of i.i.d. scores across holes, 18*(0.165−0.195) = −0.54 strokes under par per round, and −0.27 per half-round. 15 There is only a small effect for Round 1, less than 0.1% of a typical score of around 70 strokes per round, but the confidence interval is so small the effect is significant at the 5% level. This interval is likely especially small due to the large sample for this analysis and negative covariances of many of the coefficient estimates. Results on the back nine, however, are larger; a point estimate of 0.044 strokes that narrowly fails to be significant at 5% when starting the back nine five strokes below par, and a significant effect of 0.104 strokes when starting five strokes above par. Prospect theory causes golfers to “take it easy” and/or “play it safe” to protect gains after starting the round well, both of which cause performance to decline on the back nine; the cold hand/risk seeking causes a larger effect.
Joint Reference-Point Effects for Sets of Holes.a
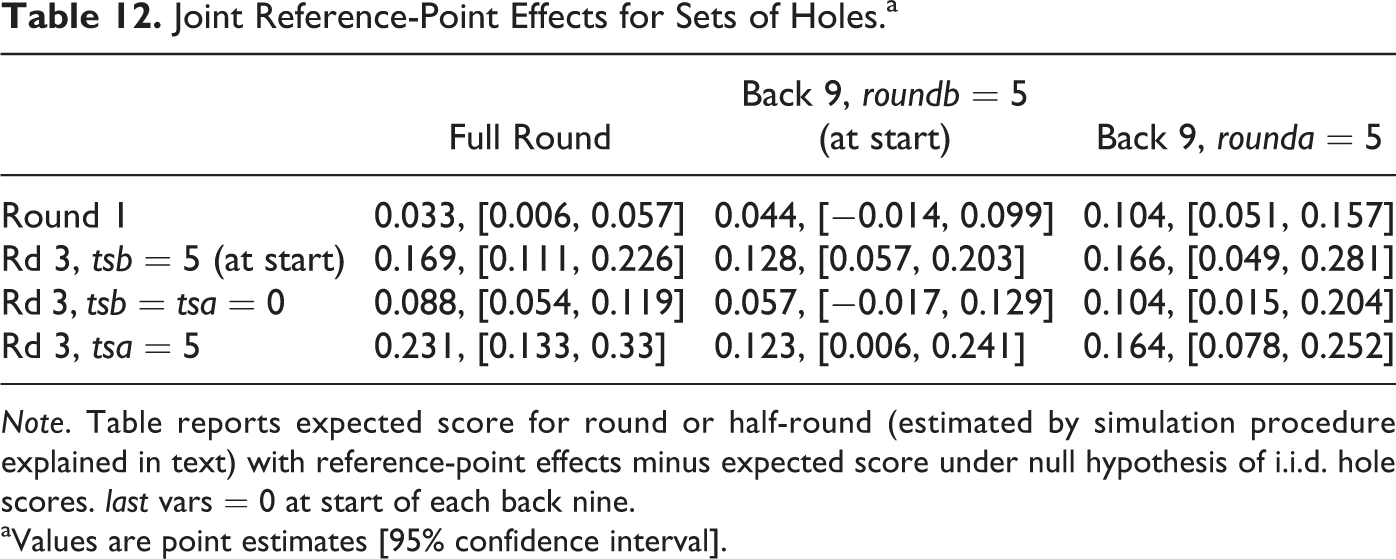
Note. Table reports expected score for round or half-round (estimated by simulation procedure explained in text) with reference-point effects minus expected score under null hypothesis of i.i.d. hole scores. last vars = 0 at start of each back nine.
aValues are point estimates [95% confidence interval].
For Round 3, the results are stronger, both for the back nine and for the entire round, especially when the tournament score at the start of the round is nonzero. Round-level effects are higher (worse), with increases in scores of 0.09 (starting at par), 0.17 (starting five under), and 0.23 strokes (starting five over), all of which are significant. Back-nine effects range from 0.06 to 0.17 strokes. The round-level effects, per hole, are smaller because effects in the domain of gains cause negative feedback. When golfers play well early in a round, pushing scores below par, prospect-theory forces cause future scores to be higher, causing average scores to be closer to what they would be under the null.
By comparison, the mean round-level effects found by Brown (2011) and Kali et al. (2015) were both around 0.2 strokes, and PS’s estimate was 0.25 strokes per round. Our estimates are in the same ballpark (somewhat smaller for round effects but larger, per hole, for half-round effects). Our estimated effects are, however, likely lower bounds, since we impose the same reference points on all players, whereas we know reference points actually vary depending on expectations. We are essentially measuring players’ reference points with error, which attenuates our estimated effects. And again, to the extent that the hot-/cold-hand effects mitigate prospect-theory effects, we are understating the effects of the reference points; we are (again) just estimating net effects.
Conclusion
We provide new evidence that highly experienced agents acting in a high-stakes environment are influenced by a variety of reference points. The results indicate that the reference points actually used vary considerably across and within players depending on subjective expectations and context. When putting, the reference point of par on the current hole is (by far) the most powerful. Reference points based on past holes are more important for initial shots on a hole (drives and approaches) and have some influence on putts as well. Past-hole reference points appear to affect both risk attitudes and effort, with risk effects (greater conservatism) dominating after small gains, and effort effects dominating as gains grow. There is some evidence of golfers becoming more risk-seeking after losses, and evidence that overall performance worsens as losses grow (the cold hand).
Our results reinforce the conclusion that prospect theory yields insight into behavior beyond the standard model. The effects of individual past-hole reference points are substantially smaller than the current-hole reference-point effect on putting found by PS. But past-hole reference-point effects interact within and across holes and can yield a total effect over a set of holes of a similar magnitude to that found by PS.
How can we reconcile the differing results—prospect-theory effort effects “far” into the domain of gains, risk effects after small gains, and cold-hand effects in the domain of losses? A careful theoretical analysis is beyond our scope and could be a good topic for future work, but we provide a few speculative comments here. The variation within the domain of gains is perhaps relatively straightforward and consistent with Figure 1—the decline in effort after large gains could be due to the flattening slope of the value function; the steeper, more concave, value function closer to the reference point may cause the greater conservatism there. An alternative explanation for the decline in effort is overconfidence due to the hot-hand bias. The cold-hand dominance in the domain of losses is more puzzling. This could be due to a decline in confidence or some other psychological problem greater than the corresponding increase (if any) in the domain of gains. The cold hand could also be due to lower effort in the domain of losses, since the value function does flatten far to the left (in the domain of losses) as well as to the right. Thus, prospect-theory and momentum effects may not be in conflict as much as we initially suggest.
Another potential reason for the cold hand in the domain of losses is that golfers do try harder (as we initially thought prospect theory predicted), but that greater effort in golf can, at some point, actually harm performance. See, for example, Cao, Price, and Stone (2011) for a discussion of how too much effort can hurt performance for skill tasks, that is, performance can be an inverse-U-shaped function of effort. Perhaps good scores versus reference points push golfers toward the left end of the hill, and poor scores toward the right end. This would again mean the cold hand is actually the result of a prospect-theory effect, again implying the forces may cause, rather than compete with, one another.
Last, we note the causality between prospect theory and the cold hand could go in the other direction as well. The cold hand that seems to occur when scores go above par may help to rationalize the emphasis that players put on avoiding a bogey on the current hole found by PS, and the conservatism we find after small gains. Similarly, a subconscious attempt to mitigate the hot-hand bias could push players to play more conservatively when in the domain of gains. Hence, some aspects of prospect theory may actually be adaptive or “ecologically rational” (Smith, 2003), given psychological factors causing the potential for cold momentum.
Footnotes
Acknowledgment
We thank Peter von Allmen (the editor), two anonymous referees, Neil Metz, Josh Price, Dan Sachau, Skip Sauer, Yao Tang, Dan Wood, and participants at the 2015 NAASE/WEAI meeting, and seminars at Clemson University and the University of Virginia for helpful comments.
Declaration of Conflicting Interests
The author(s) declared no potential conflicts of interest with respect to the research, authorship, and/or publication of this article.
Funding
The author(s) received no financial support for the research, authorship, and/or publication of this article.