
Abstract
We develop evidence of bettors with sentiment bias in the betting market on National Basketball Association (NBA) games. We use measures of team popularity (arena capacity utilization and team all-star votes received) as proxies for the presence of biased bettors. Analysis of point spreads and bet outcomes for more than 32,000 NBA games played in 1981-2012 shows that bookmakers increase prices on games involving popular home teams, an outcome consistent with sentiment bias. These changes in prices do not translate into higher returns for bettors, suggesting that bookmakers shade point spreads to increase profits.
Keywords
Introduction
A growing body of evidence supports the idea that investor sentiment affects outcomes in financial markets. Investor sentiment occurs when the actual price of a financial asset differs from the price that would be expected based on the present discounted value of future cash flows generated by the financial asset (Bernile & Lyandres, 2011). In general, this mispricing can come from two sources: systematic forecast errors associated with the probability that some future outcome will occur (Baker & Wurgler, 2007) and systematic overvaluation of the value of the resolution of uncertainty about a future outcome, perhaps because of an emotional reaction to the resolution of this uncertainty (Hirshleifer, 2001).
For example, consider an individual placing a bet on the outcome of a basketball game played by her favorite team. Economic theory predicts this individual forms an expectation of the present value of the outcome of this bet, compares this present value to the cost of the bet, and makes a bet if the expected present value of the bet exceeds the cost. The expected present value depends on both the expected probability the team will win this game and the total value of the win realized after the uncertainty about the outcome of the game is resolved. In either case, the individual arrives at a value of the future event that differs from the present discounted value implied by the objective probability of a win. This difference is called sentiment bias (Avery & Chevalier, 1999).
Much of the evidence supporting the presence of sentiment bias in financial markets comes from sports betting markets. Avery and Chevalier (1999) reported evidence of sentiment bias, in the form of abnormally large losses on bets placed on “glamorous” National Football League (NFL) teams in point spread betting markets in the United States. Forrest and Simmons (2008) found similar evidence for popular football teams in Spain and Scotland in fixed odds betting markets in Europe. Franck, Verbeek, and Nüesch (2011) found favorable odds on popular football teams in the UK in fixed odds betting markets, especially on weekends when more biased bettors may participate.
Compared to financial markets, sports betting markets contain two factors complicating the analysis of sentiment bias. First, the early sports betting literature often assumed bookmakers attempted to balance bet volume on either side of wagering on individual games in order to earn a certain profit regardless of game outcomes (Woodland & Woodland, 1991). Levitt (2004) challenged this assumption, observing betting on individual games did not appear balanced in some settings, and showing the presence of bettors with behavioral biases generated increased bookmaker profits from unbalanced betting. Sandford and Shea (2013) provided a model supporting this result. Second, bettor heterogeneity may obscure evidence of sentiment bias. Makropoulou and Markellos (2011) identified three types of participants in sports betting markets: informed bettors who make profit-maximizing decisions based on information available in the public domain, insider bettors who hold information about game or match outcomes unknown to bookmakers, and noise bettors who bet randomly. As an example of randomness, they observed noise bettors may bet for their favorite team at any price. The presence of noise bettors with sentiment bias in the market can affect the odds or point spreads offered by bookmakers, but only if enough of them are present in the market. Also, bookmakers may adjust odds or point spreads to take advantage of bettors with sentiment bias but cannot adjust them too much because the informed or insider bettors could bet against the odds or lines reflecting sentiment, reducing the bookmaker’s profit. Franck, Verbeek, and Nüesch (2013) suggested bookmakers take future trading into account, further complicating pricing decisions in these markets.
We develop evidence that outcomes in betting markets for point spread betting on National Basketball Association (NBA) games appear consistent with the presence of bettors with sentiment bias in these markets. Our sample contains regular season NBA games from the 1981-1982 through 2011-2012 seasons, an extensive sample period in which to examine sentiment bias. We use two different measures of sentiment bias: the difference in percentage of each arena’s seating capacity filled in the previous season for the two teams in each game, a variable used in previous research (Forrest & Simmons, 2008) and the difference in the share of all-star votes for each of the two competing teams. This measure incorporates more than local popularity of individual teams and has not previously been used. The results from a least squares dummy variable model explaining observed variation in point spreads indicate that bookmakers account for the popularity of NBA teams when setting point spreads, systematically changing point spreads by making popular teams stronger favorites, consistent with the presence of price insensitive bettors in the market (Franck et al., 2011). Furthermore, analysis of bet outcomes based on a probit model shows the point spread changes have no effect on the probability that a bet on the popular team wins, suggesting the point spread movement is not large enough to generate profitable betting strategies in this market.
Overall, bookmakers appear to adjust point spreads based on the difference in popularity of NBA teams involved in games. This result suggests that betting market participants make bets based on team popularity and bookmakers adjust point spreads to reflect that behavior. More broadly, the evidence developed here is consistent with the idea that point spreads are both accurate predictors of game outcomes (Sauer, 1998) and efficiently aggregate information in a market where sentiment bias exists. In addition, this article contributes to this literature by examining other fundamental factors that influence point spreads on NBA games (Brown & Sauer, 1993) as well as shows that individuals with sentiment bias exist in a wider number of financial markets over a long period of time.
Sentiment in the Sports Betting Literature
Investor sentiment can be broadly defined as “any nonmaximizing trading pattern among noise traders that can be attributed to a particular exogenous motivation” (Avery & Chevalier, 1999, p. 493). Avery and Chevalier (1999) identified two major sources of sentiment: unanticipated and anticipated. Unanticipated sentiment can be attributed to an unanticipated demand shock, which results in the price of the asset shifting away from the true market value of that asset. Anticipated sentiment is known to the parties prior to the completion of trading and “merely shifts the position of the demand curve” (Avery & Chevalier, 1999, p. 498). They identified specific conditions affecting the demand curve of an asset like a bet on a sporting event. These conditions included dynamic uncertainty, myopic pricing, irrationality of the market maker, defined in sports betting markets as bookmakers underestimating the power and degree that the particular sentiment has in the market, price discrimination, and composition of the market in terms of informed and uniformed bettors.
The prevailing assumption regarding bookmaker’s behavior was prices set by the bookmakers balance the dollar value of bets of each side of the bet. Under this strategy, the bookmakers could pay the winning bets from the money collected from the losing bets. The profit is the commission, called the vigorish or “vig” for short, that was paid to the bookmaker by the bettors. Under the balanced book assumption, Levitt (2004) outlined three strategies that bookmakers can potentially implement in posting money lines or point spreads. Levitt (2004) challenged the traditional balanced book assumption. Rather than setting a point spread to maximize the total money bet on each side of a point spreads, this body of research showed bookmakers taking a position regarding the outcome of the match and “exploit bettors’ biases” (Levitt, 2004, p. 226). With this behavior, however, bookmakers have to be careful not to adjust point spreads and money lines too much to exploit these biases, as bookmakers would be taking on an increase in risk on the outcome of the match or spread. As a result of bookmakers taking too high of a risk to exploit biases, informed bettors could wager a large amount of money against these biases. Research by Gandar, Dare, Brown, and Zuber (1998) found informed traders influenced the opening point spread set by bookmakers as well as the movement in the point spread from the opening line until the closing line. This large wager by informed bettors could result in large losses for the bookmakers and threaten their gambling operation. Thus, it is important for the bookmakers to recognize bettor biases that they could exploit for a larger profit or be able to balance the spread on each side of the wager.
Brown and Sauer (1993) identified fundamental factors, like investor biases, that could influence point spreads and betting odds in professional sports betting markets. These various fundamental factors are all potential sources of investor sentiment bias. Much of the early research on sports betting markets focused on market efficiency (Sauer, 2005), in particular documenting the existence of the favorite/longshot bias. Golec and Tamarkin (1991) analyzed point spread betting on both professional (i.e., NFL) and college football games and found significant biases existed in the NFL betting market against home teams and for favorites. Over the sample period, both markets appeared to become more informationally efficient in that point spreads became better predictors of game outcomes. Evidence of biases was not found in the college football betting market. Humphreys, Paul, and Weinbach (2013) found that bettors in the NFL betting market have clear and predictable tendencies for betting on the best team and, thus, identified significant bettor biases that are both persistent and predictable. Furthermore, Vergin and Sosik (1999) found in a subset of NFL games that included Monday Night Football and playoff games that betting on the home team was a profitable betting strategy. Recent research by Fodor, DiFilippo, Krieger, and Davis (2013) and Woodland and Woodland (2015b) found performance of NFL teams in the prior season affects the betting strategies in the current season, while Woodland and Woodland (2015a) found the same heuristics in the NBA season wins total betting market. In European football, Kuypers (2000) found that bookmakers offered lower odds against the team that was considered the favorite in the match in order to take advantage of biased bettors who miscalculated the strength of the favorite. Recent research examining stock returns of publicly traded European football clubs concluded investors do not correctly estimate the probability of an outcome of an event to occur, resulting in a reduction in the club’s stock price of approximately 1% following the match day (Bernile & Lyandres, 2011).
Sentiment for popular teams and individuals can also affect bettor’s decisions and prices offered by bookmakers. Forrest and Simmons (2008, p. 120) defined this type of sentiment as “different returns to betting according to whether one wagers on more or less glamorous teams.” Forsythe, Rietz, and Ross (1999) developed evidence that bettors in political prediction markets purchased “shares” of the candidates of the political party in which they were affiliated. In sports betting, Avery and Chevalier (1999) found in their study of NFL games that bettors bet on teams that were covered more in the media. Later research by Strumpf (2003) examining illegal sports betting in New York City found that gamblers were more likely to bet on the local teams (e.g., New York Yankees) compared to teams outside of the New York City area. As a result, these illegal bookmakers offered higher prices to bettors betting on local teams.
Researchers using data from European (football) soccer also concluded bookmakers account for bettor sentiment, in terms of the popularity of certain teams or countries. Forrest and Simmons (2008) found evidence of bettor sentiment in their examination of betting on Spanish and Scottish football leagues. Using the difference in average attendance from each team’s previous season as their measure of sentiment, Forrest and Simmons (2008) concluded that betting odds were more favorable for the more popular team in the match. Franck et al. (2011) developed a theoretical model regarding investor sentiment in sports betting markets, predicting the price set by a profit-maximizing bookmaker depends on both the type of sentiment bias exhibited by bettors and the bettors’ price elasticity of demand. This model predicts that bookmakers could increase or decrease prices in the presence of bettors with sentiment bias. Based on an empirical analysis of betting on English football matches, Franck et al. (2011) developed evidence supporting the findings of Forrest and Simmons (2008). In addition, Franck et al. (2011) examined the impact of weekend versus weekday matches on investor sentiment. These results showed that more favorable odds are offered on weekend matches. The authors attributed this difference to the amount of casual bettors participating in the betting market for weekend games compared to weekend games.
Braun and Kvasnicka (2013) examined the sentiment from national team football matches across Europe. Using data from qualification matches for the Union of European Football Associations (UEFA) Euro 2008 and from 12 different countries, they found evidence of biases in the prices that bookmakers offer for a country’s national football team. Braun and Kvasnicka (2013) explained their result as reflecting perception bias, the confidence of the bettors that their home country will win, and loyalty bias, wagers strictly on the national team to win due to the loyalty of bettors. Finally, Flepp, Nüesch, and Franck (2016) examined sentiment bias in a specific type of betting market, the market for the over/under 2.5 total goals scored in an individual soccer match. The reason they chose this market was 2.5 is roughly the average amount of goals scored in a soccer match. Thus, the expected probability of this bet is roughly around 50%. Examining the betting volume for these markets in close to 4,500 soccer matches around the world, Flepp et al. (2016) found that even though 80% of the betting volume is on the bet to have more than 2.5 goals scored in the match, there was no indication of sentiment bias. Rather, the authors concluded bookmakers tended not to be profit maximizers in this market; instead, bookmakers set prices closer to the actual outcome of the match.
In summary, bookmakers have to recognize various biases in order to set a point spread or betting odds to offer on a game or match. Recent research suggested that bookmakers try to exploit these various biases, which can be interpreted as a form of investor sentiment. Academic research has examined many biases including favorites, underdogs, the “hot hand” phenomena, and the popularity of teams. The NBA has been a popular setting for research on betting biases. The present research focuses on the degree in which the popularity of NBA teams is priced into the point spread of NBA games, adding to the growing literature from Brown and Sauer’s (1993) research on additional fundamental factors that affect the point spread for NBA games.
Empirical Analysis
Background and Approach
Following the general practice in this literature, observable factors likely to be associated with the presence of bettors with sentiment bias in this market are identified and included in regression models of the determination of prices and bet outcomes. Recall that point spreads can be interpreted as prices in these simple financial markets (Sauer, 1998). The key decision for empirical research on sentiment bias involves identifying observable factors that can be plausibly linked to the presence of some bettors with sentiment bias in the market. Avery and Chevalier (1999) used expert opinions, performance in the previous year, and conference affiliation as proxy variables for the presence of bettors with sentiment bias in NFL betting markets. Forrest and Simmons (2008) used the difference in average attendance at home matches in the previous season for each team in a football match in La Liga, the top Spanish football league. The first measure of popularity used here is the difference in the percentage of arena seating capacity filled in the two team’s home arenas in the previous season. This measure of the number of bettors with sentiment bias wagering on games is similar to the one used by Forrest and Simmons (2008).
Like Forrest and Simmons (2008), we develop evidence of bettors with sentiment bias by analyzing variability in both the prices set by bookmakers and in game outcomes relative to point spreads. We estimate reduced form models of the determination of point spreads in NBA games using ordinary least squares (OLS) and reduced form models of the outcomes of bets, based on a dichotomous dependent variable that is equal to one if a bet on that team won, using a probit model. Both models include proxy variables for the presence of bettors with sentiment bias in the market. The sign of the estimated parameters on these variables will be statistically significant if bettors with sentiment bias bet on these games, or if bookmakers believe such bettors are present.
Previous research indicates that other biases affect NBA game outcomes. For example, previous research on NBA betting and outcomes examined biases like the favorite-longshot (Paul & Weinbach, 2005), “hot hand” (Camerer, 1989), referees’ racial bias (Larsen, Price, & Wolfers, 2008), bias based on a team’s racial composition (Igan, Pinheiro, & Smith, 2015), and tanking (Soebbing & Humphreys, 2013). The favorite-longshot bias affects only games with large point spreads. Hot hand effects only apply to teams on long winning streaks. Referee bias affects fouls called, which may or may not affect point spreads or game outcomes. Tanking affects only a small number of games played at the end of the season by teams eliminated from the playoffs. In all these cases, the proxy variables for the presence of sentiment bias used in the current study are unlikely to be correlated with these other types of bias affecting NBA games, as these other types of bias vary within seasons while the sentiment bias proxy variables only vary across seasons.
Data
We analyze point spreads and game outcomes from NBA regular season games played in the 1981-1982 season through the 2011-2012 season. Point spreads from recent seasons were collected from various online websites reporting point spreads set by Las Vegas sports books including Sports Insights, Goldsheet, and StatFox. Point spreads for games early in the sample were collected with the assistance of Richard Gandar. 1 Game, arena, and player data were collected from a variety of online sources including ESPN and Basketball Reference. The unit of observation is a game season. There were a total of 34,105 NBA games played during the sample period. Of the 34,105 games, there were approximately 0.8% (254) of the observations that point spreads either could not be found or were not offered. As a result, the sample contains data from 32,664 games. Table 1 presents the summary statistics for these sides.
Summary Statistics, NBA Games 1981-1982 to 2011-2012.
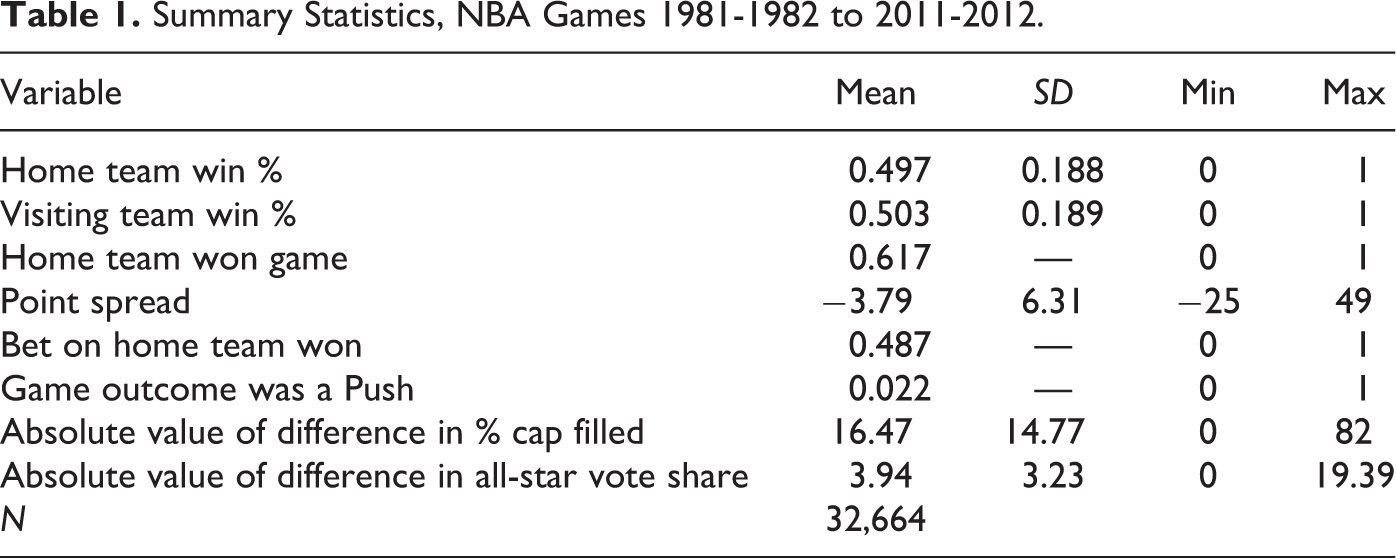
Both the mean home and away team-winning percentages prior to playing each game were around 0.500. The home team won about 62% of the games, reflecting home court advantage. The average point spread was −3.79, meaning the average home team was just under a 4-point favorite to win the matches during the sample period. Bets on the home team won in just over 49% of the matches and 2% of the matches were a push, meaning the score differential was equal to the point spread set by the bookmaker.
The average difference, in absolute value, between the percentage of arena capacity filled for teams was about 16.5%. We use absolute values because teams play each other multiple times over the course of a season. Suppose Boston’s attendance was 85% of capacity and Los Angeles’ (LA) was 90% of capacity. When Boston plays LA in LA, the difference is +5%; when LA plays Boston in Boston, the difference is −5%. The averaging over the season would be zero without taking the absolute value. The difference in the share of all-star votes was about 4%. We do not report standard deviations for the home team win indicator, the bet on the home team won indicator, and the push indicator because these variables only take the value 0 or 1.
Analysis of Point Spread Data
In order to determine how the popularity of NBA teams affects point spreads, we estimate the following reduced form model of the determination of point spreads by OLS:

where h indexes NBA home teams, v indexes visiting NBA teams, i indexes games, and k indexes seasons. θ j (j = h, v) are team-specific effects for home and visiting teams, γ k is a season fixed effect, α j ,k (j = h, v) is a team × season fixed effect for home teams and visiting teams, and ∊ hvit is the equation error term. The regression model controls for unobservable heterogeneity in teams over the sample, seasons in the sample, and unobservable team-season heterogeneity. We assume that ∊ hvit is a mean zero, constant variance, identically and independently distributed random variable. PS, the dependent variable in Equation 1, is the point spread for game i played by home team h and visiting team v in season k. Winpct hik is home team h’s win percentage prior to game i in season k. Winpct vik is visiting team v’s win percentage prior to game i in season k. Popular is the variable of interest since it proxies for the presence of bettors with sentiment bias in the market.
One difficulty of identifying sentiment bias in betting markets is to find a reasonable measure of a team’s popularity. In the current study, we use two different measures. The first measure is the difference in the average fraction of the seating capacity filled, arena capacity utilization, in each team’s home arena in the previous season. For example, if the LA Lakers play the Denver Nuggets in LA and the Lakers averaged 90% of the capacity of their arena in the previous season and the Nuggets averaged 80% of the capacity of their arena, then Popular = 10 for that game. Forrest and Simmons (2008) used a similar variable, the difference in per game average attendance from the previous season. As this difference in the fraction of the team’s home arena filled in the previous season increases, there will be more bettors with sentiment bias toward the team with the largest attendance relative to capacity in the betting market. Attendance-based proxies for sentiment bias can be criticized for three main reasons. First, capacity utilization might be just a measure of the local popularity of the team, that is, it strongly depends on the market potential in the surrounding area, while biased bettors might exist in a larger area or even nationwide. Second, the capacity utilization of the arena can—to some extent—be influenced by the team. For example, reducing the ticket price or intensifying promotional activities might affect attendance, which may or may not reflect a team’s popularity. Third, capacity utilization does not reflect the actual size of the audience in the arena. For example, suppose two teams filled 90% of their arena capacity. According to this capacity utilization measure, each is equally popular and the difference capacity utilization is 0. If Team 1’s arena is much larger than Team 2’s arena, however, this measure does not reflect the difference in attendance, and potentially the difference in popularity.
Thus, we use a second measure of popularity to proxy for the presence of bettors with sentiment bias. The alternative measure, data from NBA All-Star Team voting, is not based on the local market size or population and also not under the control of the team. The NBA organizes an annual All-Star Game between the best players from the Eastern and Western Conferences. 2 To determine the starting team for each conference, fans vote for players for each position for each conference: two guards, two forwards, and one center. Our hypothesis is the share of a team’s all-star votes compared to the total number of all-star votes cast by fans reflects the team’s popularity, even if the fan votes are only an expression of player popularity. This measure appears to be a reasonable measure of team popularity, given data availability and assuming that team popularity depends in part on the individual popularity of the team’s players.
Since the complete list of all-star votes for all players is not available, all-star votes for the top 25 players (10 guards, 10 forwards, and 5 centers) from each conference were collected from the Basketball Reference website. 3 In total, voting data are available for 1,419 player–season observations throughout our observation period. If one of these players was traded in the current season (56 of the 1,419 cases), his votes have been included with the team where he played most of that season’s games. To calculate the share of all-star votes received by each team, the total number of reported all-star votes in each season are summed up, and each team’s total votes received divided by the total reported votes. The variable Popular is defined as the difference in the share of the all-star votes for each of the two competing teams. Since the voting concludes at mid-season, just prior to the All-Star Game, all matches following the All-Star Game use the shares from that All-Star Game until voting concludes in the following season. For example, team shares based on the all-star voting for the 1981-1982 season are used to construct the variable Popular until the All-Star Game voting for the 1982-1983 season ends; Popular reflects all-star votes for the second half of the season and the first half of the following season. Team shares from the all-star voting for the 1997-1998 season are used until the All-Star Game played in the 1999-2000 season, since the 1998-1999 All-Star Game was canceled.
Table 2 contains parameter estimates, estimated standard errors, p values, and other summary statistics. Estimates of the various fixed effects parameters are available upon request from the authors. Equation 1 explains nearly 86% of the observed variation in point spreads in these games. Recall that the dependent variable, the point spread, is negative if the home team is favored to win the game and positive if the visiting team is favored to win. The estimated parameter on the home team’s winning percentage going into the game indicates that an increase in the home team’s winning percentage makes the home team a bigger favorite or a smaller underdog. This movement increases the price of a bet on the home team. As expected, the stronger the visiting team, the less of a favorite the home team is, other things equal. The difference in the capacity of each team’s arena filled in the previous season is negative and significant. Specifically, for every 1% increase in the difference in arena capacity utilization, the spread favors the home team by an additional 1.3 points. The larger the difference in relative arena capacity utilization, the more the spread moves in favor of the home team. This movement increases the price of a bet on the home team. Bookmakers appear to adjust the point spread based on the relative popularity of teams in each game, where popularity is measured by relative arena capacity utilization in the previous season. This result can be interpreted as evidence that bettors with sentiment bias are present in NBA betting markets.
Sentiment Bias and Bookmaker Prices.

Note. Dependent variable is point spread on the game. Estimated by ordinary least squares. Regression model includes team, season, and team × season fixed effects for all teams.
Using the team all-star votes as a proxy for the popularity of the teams reveals very similar results. First, the explanatory power of the model remains high at around 86%. Other things equal, the stronger the home team, the bigger a favorite or the smaller an underdog the home team is. The stronger the away team, measured by the team’s winning percentage going into the game, the smaller a favorite or the bigger an underdog the home team is in the observed game. Moreover, these parameters show very similar values to the values reported in the empirical specification using the difference in the percentage filled of the two stadiums capacity. Our alternative measure of relative popularity, the difference in the team’s share of all-star votes, displays a highly significant and negative coefficient. This result means the larger the difference in the shares of all-star votes between the teams, the more the point spread changes in favor of the home team. Specifically, for every 1% increase in the difference in all-star voting shares, the spread favors the home team by an additional 0.2 points. Thus, the results from the all-star vote model also support the notion that bookmakers adjust the point spread based upon the relative popularity of teams in the observed games.
Analysis of Bet Outcomes
The results in the previous section suggest point spreads reflect both the relative strength of the teams and the teams’ relative popularity. To determine how this change in point spreads influences the likelihood of a bettor winning a bet placed on team i, the following probit model is estimated:

where h indexes home teams, v indexes visiting teams, i indexes games, and k indexes seasons. The dependent variable is equal to one if a bet placed on home team h playing visiting team v won or was a push in game j in season k. We include two separate measures of “cover.” The first measure of cover means a team either won against the spread or game was a push, meaning the exact difference in the point spread was the actual difference in the game. The second measure of cover was if the team won against the spread.
Table 3 contains the results from the probit model and the corresponding marginal effects. The top panel contains results for relative capacity utilization as the sentiment bias proxy; the bottom panel contains relative share of all-star votes. Results on the left side use a dependent variable equal to one if a bet on the home team won or was a push; results on the right side use a dependent variable equal to one if a bet on the home team won.
Sentiment Bias and Bet Outcomes.
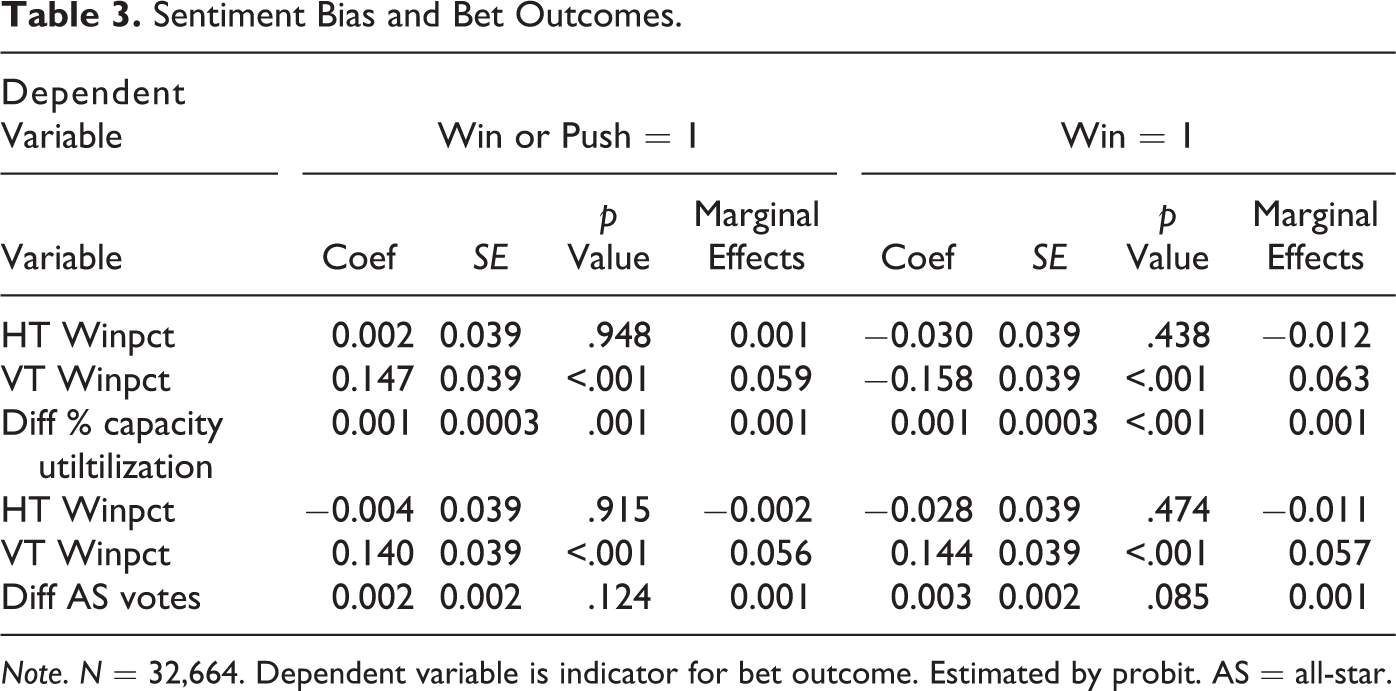
Note. N = 32,664. Dependent variable is indicator for bet outcome. Estimated by probit. AS = all-star.
From Table 3, the strength of the home team, as measured by the home team’s winning percentage before the game, has no relationship to the probability that a bet on the home team wins for both models. The strength of the visiting team has a positive and statistically significant relationship to the probability that a bet on the home team wins for both models. This result is consistent with bookmakers offering favorable point spreads to bettors wagering on home teams when the opponent is stronger. Recent research in the sports betting literature focused on the determinants of NBA betting volume (Paul & Weinbach, 2010) and understanding bettor misconceptions (Paul & Weinbach, 2005). Research by Paul and Weinbach (2005) found bettors wagering on large home underdogs earned profits, while Paul and Weinbach (2010) found the strength of the road team increased the betting volume on NBA games. Taken together, these results suggest bettors tend to overestimate the quality of the road team when placing bets, providing the bettors who prefer to wager on the home team with an opportunity to earn excess profits.
Finally, the arena capacity utilization sentiment bias variable has a positive and statistically significant parameter estimate, meaning an increase in the difference in the relative area capacity utilization last season increases the probability a bet on the home team wins in game i in season k. However, the marginal effect of this parameter estimate shows that the effect is very small—about one tenth of 1%. Thus, even though sentiment bias is present in point spreads, reflecting the presence of bettors who want to bet on popular teams, this sentiment bias does not increase the probability of winning a bet by much at all. For the second measure of sentiment, all-star voting shares, the results from Table 3 show popularity has no effect on winning a bet during the sample period. In other words, loosening the restrictions on popularity so it is not based on local market or team influences does result in the presence of bettors who want to bet on popular team, it does not result in any significant effect on the probability of winning a bet.
Discussion
The results here indicate sentiment bias exists in NBA betting markets. The popularity of a team, as captured by both differences in average attendance relative to arena capacity at games in the previous season and differences in the team’s share of all-star votes based on the last vote taken, affects point spreads and bet outcomes in a way that suggests bookmakers offer point spreads that make popular teams bigger favorites. This point spread change does not translate into substantial increases in the probability that a bet on the more popular team pays off. At the 90th percentile of the popularity variable, the home team averaged 26% more of its home arena capacity filled compared to the visiting team. Based on the marginal effect reported on Table 3, this increase in popularity is associated with a 0.1% increase in the probability that a bet on a more popular home team pays off; this strategy would be unlikely to generate excess returns to bettors with sentiment bias following a strategy of betting on only popular teams.
The results of betting simulations confirm the inability of betting strategies based on popular teams to generate excess returns. Betting on the home team when the difference in percentage of arena capacity filled (difference in team’s all-star voting shares) was in the top 75% of the distribution of this variable provided 4,630 (4,299) wagering opportunities in this sample. A strategy of betting on the home team in these games resulted in only 51.42% (50.80%) of these bets winning; this strategy would not be a profitable betting strategy under the standard “risk 11 to win 10” Las Vegas style point spread betting rules (Sauer, 1998). Betting on the home team when the difference in percentage of capacity filled was in the top 95% of the distribution of this variable provided 1,235 wagering opportunities. A strategy of betting on the home team in these games resulted in only 51.85% (51.23%) of these bets winning. Even though bookmakers made more popular teams bigger favorites, this change had no affect on the return on bets. Forrest and Simmons (2008) reported identical results in regard to the likelihood of winning a bet on football matches in La Liga based on the popularity difference of clubs. They stated their results could be due to sentiment bias; however, it could also be due to bookmakers not clearly controlling for teams’ popularity. Here, we find that bookmakers clearly make more popular home teams larger favorites. Thus, the reason bookmakers change point spreads on games involving popular teams must be to take advantage of this popularity to increase profits.
Since the probit results show point spread shading cannot be exploited as a profitable betting strategy, the increased volume of bets on these popular teams would increase the commission earned by the bookmaker in the long run. Why would bettors continue to bet on their team, even when this approach does not yield above average returns? The utility of gambling model developed by Conlisk (1993) provides one explanation. If bettors derive utility from betting on their team, then they would continue to place bets no matter what the financial return on those wagers. Sometimes the opposite behavior, where bettors with a strong affiliation to a given team bet against that team, a form of “emotional hedging” has been observed in experimental settings (Bosman, Sutter, & van Winden, 2005). In this context, bettors wagering against their favorite team to win offset the immediate loss in utility with financial gains from bets on the opposing team. Since our results contain evidence of bettors with sentiment bias in this market, these bettors with sentiment bias may be present in larger numbers than bettors undertaking emotional hedging.
Conclusion
Previous research found evidence of bettors with sentiment bias in sports betting markets. We develop new evidence suggesting that the popularity of certain NBA teams, as reflected by both difference in the fraction of seats in each team’s home arena filled on average and the team’s share of all-star votes, influenced the point spreads set by bookmakers over the period 1981-2012. Our results support the idea that bookmakers adjust the point spread based on the difference in popularity of NBA teams. However, these changes in point spreads cannot be exploited by bettors to earn excess profit in the market. Our findings confirm previous evidence of sentiment bias in other settings, including betting on NFL games and European football matches. However, sentiment bias in the NBA is not as large as in Europe, where evidence of abnormal returns has been reported. We believe this difference reflects the closed nature of the NBA compared to the promotion and relegation system in European football. Furthermore, research by Franck et al. (2011) found evidence bookmakers offer discounts to bettors on popular teams as a long run strategy to generate customer loyalty. This study develops evidence from betting on NBA games, suggesting that shading in terms of the point spread is not that large compared to Europe, potentially reflecting the impact of widespread availability of sports betting in Europe market compared to North America.
The presence of sentiment bias in these simple financial markets has broader implications for understanding other financial markets. The recent financial problems experienced by economies around the world raise important questions about the operation of financial markets, and their propensity to experience upheavals. Sentiment bias represents a market inefficiency, as it reflects factors affecting the price of financial assets not related to fundamentals like expected future revenues generated by the financial asset. The results here suggest that sentiment bias exists in a simple financial market, but the effect of this bias is not large enough to generate opportunities for excess profits for market makers or investors. These sports betting markets contain inefficiencies generated by sentiment bias, but they are not very large, suggesting that asset prices in this market do not drift too far from their fundamental values. If these results generalize to other financial markets, then sentiment bias is unlikely to lead to bubbles in other asset prices that could generate turmoil in financial markets.
Future research on sentiment bias in professional sports, both in the United States and in Europe, could also include alternative measures of team popularity. The popularity of social media around the world provides opportunities for researchers to study phenomena that was unavailable in the past (Edelman, 2012). Future research examining sentiment bias could measure team’s popularity in terms of Facebook “likes” or Twitter followers. These measures might better examine the reach of the team’s sport brand around the world, not confining to the local residents who consume the live sporting event. Since these measures cannot be influenced by team actions, such as the reduction in ticket price to encourage people to attend games or other promotional event to encourage attendance, social media can potentially provide a more accurate measure of a team’s popularity. In addition, the use of social media measures for proxies of investor sentiment presents an opportunity for researchers to more accurately measure investor sentiment and its effects in the market.
Finally, the idea that sentiment bias exists but cannot be exploited to earn excess profits by bettors raises interesting questions about the operation of bookmakers. If bettors cannot exploit the changes in point spreads set by bookmakers, then bookmakers may be earning higher profits by “shading” the point spread to favor popular teams. Although the probability of a bet placed on a team that benefits from sentiment bias is not more likely to win, sentiment bias could affect bet volumes if making popular teams stronger favorites induces more bettors with sentiment bias to bet on that team. If the point spread shading done by bookmakers leads to increased betting on games involving popular teams, then bookmakers could earn higher profits, even if the change in the point spread is small. Additional research should focus on betting volume, and not simply point spreads or betting odds, to better understand the effect of sentiment bias in this market.
Footnotes
Declaration of Conflicting Interests
The author(s) declared no potential conflicts of interest with respect to the research, authorship, and/or publication of this article.
Funding
The author(s) received no financial support for the research, authorship, and/or publication of this article.