
Abstract
This study examines how running performance (intensive runs, total distance covered) of football teams in previous games impacts betting markets as it relates to expected win probability. Theoretically, bookmakers could interpret team’s running performance as effort or fatigue, with sports science studies suggesting that distance covered reflects effort and intensive runs signal fatigue. Using data from the 2011/12-2018/19 seasons of the German Bundesliga, beta regression models reveal that bookmakers interpret team’s running performance in previous games contrary to physiological explanations in sports sciences. Tests of market efficiency incorporating these findings do not find a profitable betting strategy for bettors.
Introduction
The sports economics literature looking at sports betting market efficiency generally finds these markets to be efficient over a long period of time (e.g. Deutscher et al., 2018). This finding results from the fact that the market reflects all available information regarding the event in which the bet is placed. As a result, a bettor cannot use a strategy to make a profit in the long-term. Over short periods of time, however, there are instances where market inefficiency could occur (Buckle & Huang, 2018; Deutscher et al., 2018). The reason is market makers (i.e. bookmakers) are still gathering information that is crucial to the outcome of the game. For example, in professional football, Deutscher et al. (2018) found that at the start of the season in the German Bundesliga, betting on recently promoted clubs would represent a profitable betting strategy. The rationale they provided for this short-term profit is that bookmakers are not quite sure on the overall ability of the recently promoted clubs and how they will adapt to the new league. Similarly, Buckle and Huang (2018) found weak forms of betting market inefficiency when studying arbitrage trading within Super Rugby.
Another instance where market inefficiency may occur is with the development of new technology or data that emerges from new technology. One recent case is the use and dissemination of individual player running data in the German Bundesliga starting in the 2011/2012 season. This innovation allows internal and external stakeholders to look at individual player’s performance as it relates to distance covered throughout the match and the number of intensive runs or sprints that were performed by a player. Previous research using these data found the distance covered compared to the opponent had a significant positive impact on the likelihood of a team to win a match (Weimar & Wicker, 2017). However, total distance covered had no significant effect on player market values (Wicker et al., 2013), indicating that the labor market in professional football does not reward running performance appropriately (Weimar & Wicker, 2017). Similar to Moneyball in professional baseball (e.g. Hakes & Sauer, 2006; 2007), Weimar and Wicker’s (2017) result is another example of how publicly available data can be used to detect labor market inefficiencies.
The present study extends this line of examination to the betting market by studying the impact of running performance of teams in previous matches on the bookmakers’ probability of winning the next match. We propose the following two research questions: (1) how does a team’s running performance in previous matches compared to the current opponent affect the expected win probability by bookmakers? In case of a significant impact we ask: (2) Can a profitable betting strategy be identified based on teams’ running performances? Looking at individual match data from the 2011/2012 to the 2018/2019 season of the German Football Bundesliga, the results from calculating the expected win from the final betting lines indicate that teams who covered more distance in the previous match than their current opponent were assigned a significantly lower win probability. This result also holds for the previous five matches, where, however, the difference in the number of intensive runs has a positive effect. Teams performing more of these runs than their current opponent were awarded with a higher probability of winning the match of interest. These findings will be discussed in the light of fatigue and effort—two possible theoretical mechanisms which are introduced in the next chapter. Our findings using these betting strategies do not lead to a profitable betting strategy.
Theoretical Framework and Literature Review
Market Efficiency in Sports Betting Markets
Understanding and testing for efficiency in a sports betting market is a popular area of betting research within sports economics (e.g. Paul & Weinbach, 2013; Sauer, 2005). Paul and Weinbach (2013) outlined some of the underlying assumptions guiding the research on sports betting market efficiency. As a whole, existing research generally finds that betting markets are efficient in the long-term (e.g. Deutscher et al., 2018). However, there are instances in prior research where results do find a market inefficiency and profitable betting strategy. As Paton et al. (2009) noted, many of these inefficiencies in the market come from various biases such as sentiment, hot hand, and favorite longshot bias.
Research detecting betting market inefficiency also finds inefficiencies as it relates to league policies, game assignments, and game conditions such as weather. Deutscher et al. (2018) looked at market efficiency as it relates to promotion and relegation of clubs. They proposed that with a promoted team, bookmakers would be unsure regarding the performance of the club and this uncertainty could cause the betting market to be inefficient in the short-term. Looking at over a dozen years of German Bundesliga football, their results found a bet on a promoted club from the second Bundesliga to the first Bundesliga to be a profitable bet when the promoted team had an away game. However, this profitable bet occurred only in the season. As the season goes by, the profitable bet on a recently promoted team goes away which is consistent with their hypothesis.
Mills and Salaga (2018) examined market efficiency in the context of Major League Baseball (MLB) umpire assignments. Their findings from six seasons of MLB regular season games suggest a return on investment of a bet based on umpire assignments of close to 10%, exceeding the general threshold for market efficiency. Finally, Paul (2017) collected and utilized weather data as it relates to scoring in the National Football League (NFL). Within his study, Paul (2017) looked at whether there were profitable betting strategies based on humidity, precipitation, temperature, and wind speed. Results indicated that high or low humidity were profitable and combining high humidity with low wind speed led to an inefficient and profitable betting market.
Collectively existing research indicates that there are some instances where changes in the league structure, game assignments, and game conditions can lead to an inefficient market and profitable betting strategies for bettors. We add to this literature by exploring running and physical exertion on the soccer pitch. More specifically, we look at the role of additional information for both bookmakers and bettors that is provided by new technology and that may take some time for the parties to adjust.
Running Performance: Signal of Fatigue or Effort?
To understand betting market efficiency as it relates to running data, it is important to first understand how bookmakers could interpret running performance of teams in previous matches when they calculate the betting odds for the current match. Examining the literature reveals two possible mechanisms, which are referred to as fatigue and effort. These theoretical mechanisms are discussed next and existing research examining running performance in professional football through the lenses of fatigue and effort is reviewed. The review is informed by studies from both sports economics and sports sciences.
First, running performance in previous matches can be considered a signal for player fatigue, meaning that players are expected to be tired because they ran a lot. Conceptually, metabolic fatigue involves a low energy level and a feeling of tiredness (Bangsbo et al., 2007), with peripheral fatigue being caused by reductions in oxygen delivery to the exercising muscles—as opposed to central fatigue which refers to the central nervous system (Grantham et al., 2010). Previous research documented football players run less toward the end of a match due to fatigue (Bangsbo et al., 2007). In light of these conceptualizations, the above assumption that players are tired and show fatigue might be intuitive for bookmakers setting betting lines for matches. In the NBA, for example, Ashman et al. (2010) looked at how teams performed when playing games in consecutive days. They found home teams performed worse against the spread in general and performance declined when traveling over multiple time zones to play in a second consecutive game. The authors concluded their finding was due to team fatigue.
However, a nuanced look at the different types of running performance parameters is necessary (i.e. total distance covered during a match and high-intensity running at speeds of over 20 km/h). Within sports sciences, a good level of aerobic fitness is regarded as necessary to meet the physiological demands of soccer in terms of intensive running and sprinting (Bangsbo, 1994; Reilly, 1997; Stolen et al., 2005). Such a level of aerobic fitness also allows covering longer distances during a match. However, and importantly, total distance covered is not a concern for sport scientists as the overall distance players run during a 90-minute match is not physiologically challenging.
On the contrary, what is considered challenging is the ability to repeatedly perform high-intensity running during such a match (Rampinini et al., 2009). Accordingly, previous research indicated players do not reduce the total distance they cover toward the end of a match, only their levels of high-intensity running as a result of fatigue (Aughey, 2010). In the present study’s context, if bookmakers were aware of the knowledge in sports sciences and physiology, then they would only regard high-intensity running (i.e. intensive runs) as a signal for fatigue, not total distance covered by players.
For total distance covered, previous research suggests that it might actually be positively correlated with team performance. For example, previous studies reported a significant relationship between distance covered and competitive ranking or performance level (Bangsbo & Lindquist, 1992; Krustrup et al., 2003, 2005). Moreover, Weimar and Wicker (2017) found the winning probability of teams to be at least 30% higher when every player on the field ran 1 km more than the opponent. These findings can be interpreted as follows: Constant running at slow pace creates space on the field and allows teams to play in a way as if they had one additional player on the pitch.
Second, regarding total distance covered as a signal of effort will yield similar expectations as the ones above. Considering the overall amount of distance covered during a 90-minute match, previous research suggested that running performance of football players is more a reflection of individual effort than ability. Comparing the running demands of a football game to a marathon, a professional marathon runner will run the whole marathon at the speed of an intensive run (i.e. >20 km/hour) of a football player (Weimar & Wicker, 2017). Given the good aerobic fitness level of professional football players (Bangsbo et al., 2006), previous research provided evidence that players are in a position to choose the amount of effort they put forth on the pitch by running more or less. For example, Weimar and Scharfenkamp (2019) documented that players reduce their effort in terms of total distance covered per minute in the remaining games of a season after they have signed a new contract with another team, supporting the notion that total distance covered is rather an indicator of player effort than fatigue. Collectively, these findings suggest that bookmakers, if they were aware of these relationships, would assign teams who covered more distance in previous matches a higher chance of winning the current match, while awarding a lower win probability to teams who have performed many intensive runs. We explore this potential bookmaker behavior below.
Methods
Data Collection and Variables
The present study looks at German Bundesliga games from 2011/2012 through 2018/2019. The 2011/2012 season was the first season that the collected running data were publicly posted by the German Bundesliga. Altogether, 2,448 games were played during this period, resulting in 4,896 team-game-season observations. For 12 games (24 team-game-season observations), the running data were not recorded because of technical problems, reducing the number of observations to 4,884. The use of one-game and five-game lags further reduces the sample to 4,780 and 4,010 observations, respectively.
The dependent variable in the study is the estimated win probability for an observed game as calculated from the betting odds (WinProb) obtained from the website bet365.com. Within the betting literature, numerous formulas are presented to convert betting lines into win probabilities (e.g. Berkowitz et al., 2018; Deutscher et al., 2018; Kuypers, 2000). For the present study, we use the formula outlined by Deutscher et al. (2018) for calculating win probabilities from betting lines.
Our main explanatory variables focus on the running data retrieved from the German Football League (DFL) website (dfl.de). The data are at the player level for each game he played and were aggregated to the team level for the observed game, taking into consideration the number of minutes each player was on the field for the observed game. Hence, the running data were weighted by playing time. Three running variables are available from the DFL website: distance (Dist); runs (Runs); and sprints (Sprints). Dist is the total distance covered per game in meters per minute. Runs reflects the number of intensive runs per game which are classified by the DFL as player movements at a speed faster than 20 km/hour, but below 24 km/hour. Sprints are the number of sprints per game reflecting player movements exceeding the threshold of 24 km/hour. Due to the high correlation between sprints and runs, we exclude sprints from the analysis. For the remaining runs and distance variables, we calculate the weighted average for the observed team and its opponent and subtract the values for the observed team from the opponent (DistDiff; RunsDiff).
The analysis includes a number of control variables to isolate the impact that running performance has on the implied probability of winning. The first set of variables captures the general characteristics of the observed game. The first variable is an indicator variable stating if the observed team is the home team (Home). Home field advantage in the German Bundesliga is well documented throughout the literature studying expected team performance (e.g. Soebbing et al., 2015; von Hanau et al., 2015). The second variable measures whether the observed game is a derby game (Derby). We specify a derby game as a game between two teams that are less than 50 km apart from each other, consistent with prior research (Bäker et al., 2012; Weimar & Wicker, 2017). We expect a derby game to have a negative impact on the expected probability of the observed team winning.
The next set of variables focuses on the team’s current performance. The first variable captures the difference in ranking of the observed team compared to its opponent (RankDiff). We also consider the difference in points between the observed team and its opponent (PointsDiff). This information was gathered from the league’s webpage over the course of the sample period. Consistent with prior research on expected game outcomes in the Bundesliga (e.g. Soebbing et al., 2015; von Hanau et al., 2015), we anticipate PointsDiff to have a positive and significant effect on the win probability and the RankDiff to have a negative impact.
We control for off-field decisions made by the club. The first variable looks at mid-season coaching changes and measures the difference in coaching changes between the two clubs (CoachChangeDiff). Previous research by Soebbing et al. (2015) found a change in coach did affect the expected outcome of a Bundesliga match as expressed by win probability. However, this change did not come until four games into a new coach’s tenure. We also look at the difference in team market values between the observed team and its opponent (ValueDiff) with the expectation that the variable coefficient will have a positive and significant impact on expected match outcomes. Player market values were obtained from transfermarkt.de.
The present research also focuses on the team composition of players that participated in the match. The first characteristic is the difference in age (AgeDiff). Weimar and Wicker (2017) used this variable to proxy experience, finding that the difference in age led to an increased likelihood of actually winning a match. The second characteristic is the difference in height between the observed team and its opponent (HeightDiff). Wicker and Weimar (2017) concluded that height difference did not impact actual match outcomes. The difference in tenure with the club (TenureDiff) of the players on the field reflects tacit knowledge that could be gained for multiple seasons with the organization (Berman et al., 2002). It is expected that this variable has a positive and significant effect on the expected win probability. The next characteristic looks at the difference in the amount of rest the participating teams have prior to the observed game (RestDaysDiff). Previous research for leagues throughout the world delivered mixed results as it relates to the amount of rest (e.g. Foreman et al., 2016; Scoppa, 2015; von Hanau et al., 2015).
The final on-field characteristic is the difference in the percentage of German players on the field (GermanDiff) between the observed team and its opponent. Weimar and Wicker (2017) did not find this difference to impact actual game outcome. However, the percentage of German players could impact expected match outcomes if the bookmaker believes that the betting public’s sentiment could be to bet on the team with more German players participating in the game. This logic would be consistent with the findings of Braun and Kvasnicka (2013) for national soccer team matches and betting markets.
Finally, we include a group of dummy variables for season (Season), kickoff time (Hour), day of the week (Day), the game number in the season (GameNum), referee (Ref), observed team (Team), its opponent (Opp), coach of the observed team (Coach), coach of the opponent (OppCoach), and the starting formation of the observed team (Formation) and its opponent (OppFormation).
Empirical Strategy
To answer the first research question, a set of regression models is run to identify whether team’s running performance, measured by distance and runs, impacts expected game outcomes. Equation 1 presents the broad empirical model to be estimated:
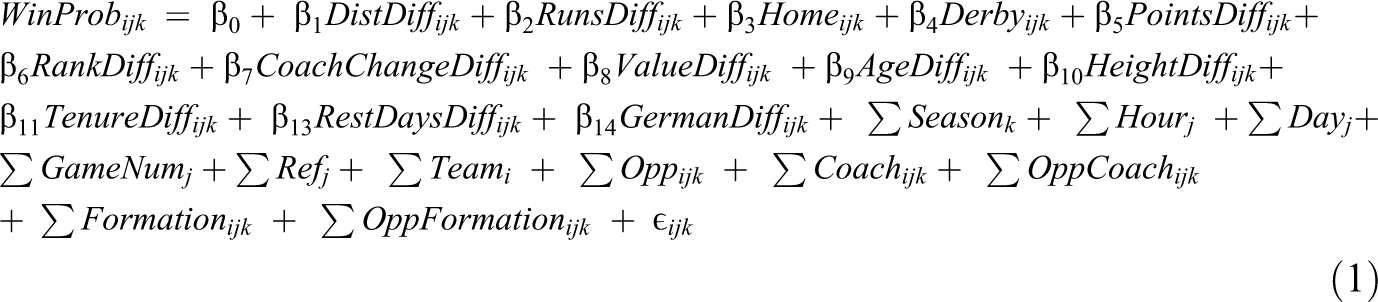
where i indexes team, j indexes game, and k indexes season. We estimate this model using a couple of different time periods. Given that we look at the win probability for team i in game j during season k, we take the approach that running statistics, on-field characteristics, and off-field characteristics are lagged one game (j−1) and averaged the last five games (j−1 to j−5). The reason for also estimating models with the previous five games is that bookmakers may tend to consider if teams are on a run.
We provide results from three empirical techniques for the sample including one-game lags and five-game lags, resulting in six regression models. First, equation (1) is estimated using ordinary least squares (OLS). Our second and preferred model is a beta regression model (Murteira & Ramalho, 2016; Papke & Wooldridge, 1996; Ramalho et al., 2011). This generalized linear model is useful when the dependent variable is bounded between 0 and 1 like the variable WinProb (Ferrari & Cribari-Neto, 2004), but does not have a concentration of values at either 0 or 1 (Hausman & Leonard, 1997). The estimation uses a quasi-likelihood estimator, which models the mean of WinProb conditional on the explanatory variables. Such fractional response models were used in previous research in sports economics (e.g. Hausman & Leonard, 1997; Soebbing et al., 2015). A maximum of 100 iterations are employed.
As a robustness check, and to mitigate the issue of potential autocorrelation between the two observations per game (Leard & Doyle, 2011), the third model randomly selects the observation of the home or the away team for each match. It is estimated using OLS and uses the average parameter estimates of 10 regressions. Such a random model has already been applied in previous research (Leard & Doyle, 2011; Weimar & Wicker, 2017). The analysis is expanded by a further set of beta regressions (with one- and five-game lags) which were estimated for each season separately to analyze whether the betting market has adjusted to the information provided by new technology over time.
To answer the second research question, we examine the efficiency of the betting market as it relates to presence of running data. Similar to previous work (e.g. Brown & Abraham, 2002; Paul, 2017; Paul & Weinbach, 2005), we construct betting strategies based on the findings and look at the winning percentage of those strategies throughout the sample period.
Results and Discussion
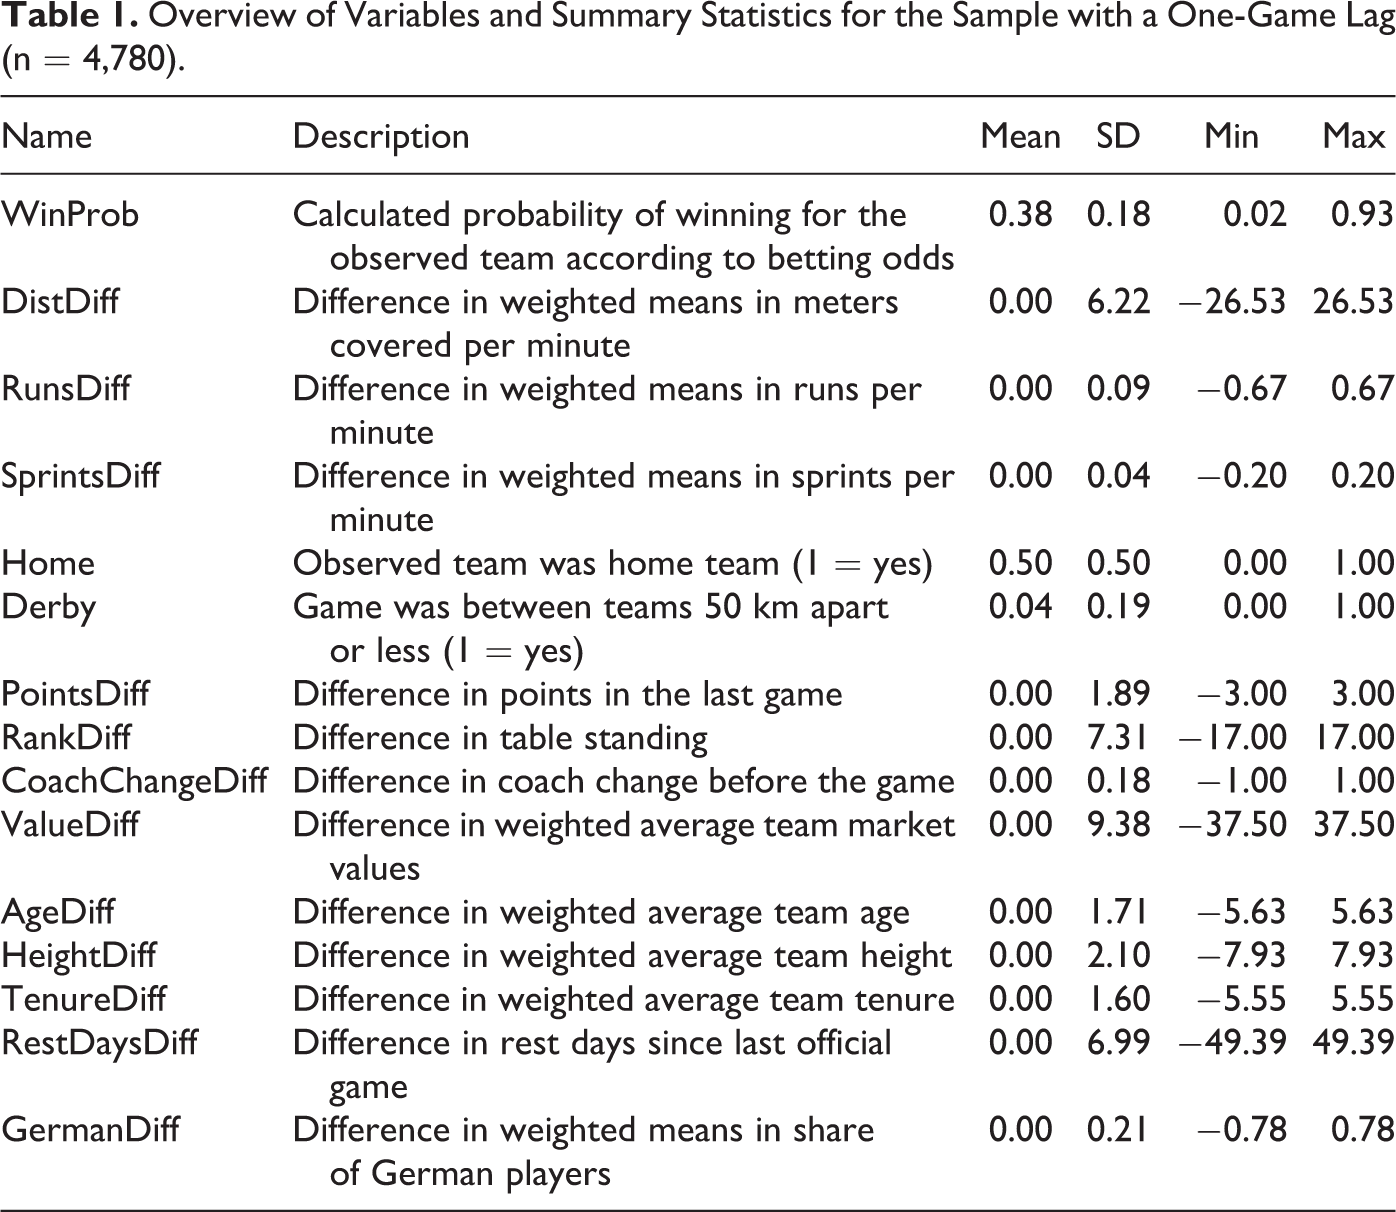
Recall that the present research takes the approach of estimating Equation 1 by lagging the explanatory variables by the previous game (short form: 1G) and the last five matches (5G). Table 1 describes the variables and provides the summary statistics for 4,780 observations which coincides with the number of observations using the one-game lag. This table shows that the calculated average win probability for observations is 38%. Table 2 presents the regression results for the variables over the previous game and the previous five games. The focus of the discussion of results will be on the beta regression estimations (i.e. Models 2 and 5), while the other estimations serve as robustness checks to these two estimations.
Overview of Variables and Summary Statistics for the Sample with a One-Game Lag (n = 4,780).
Regression Models for the Dependent Variable Win Probability.
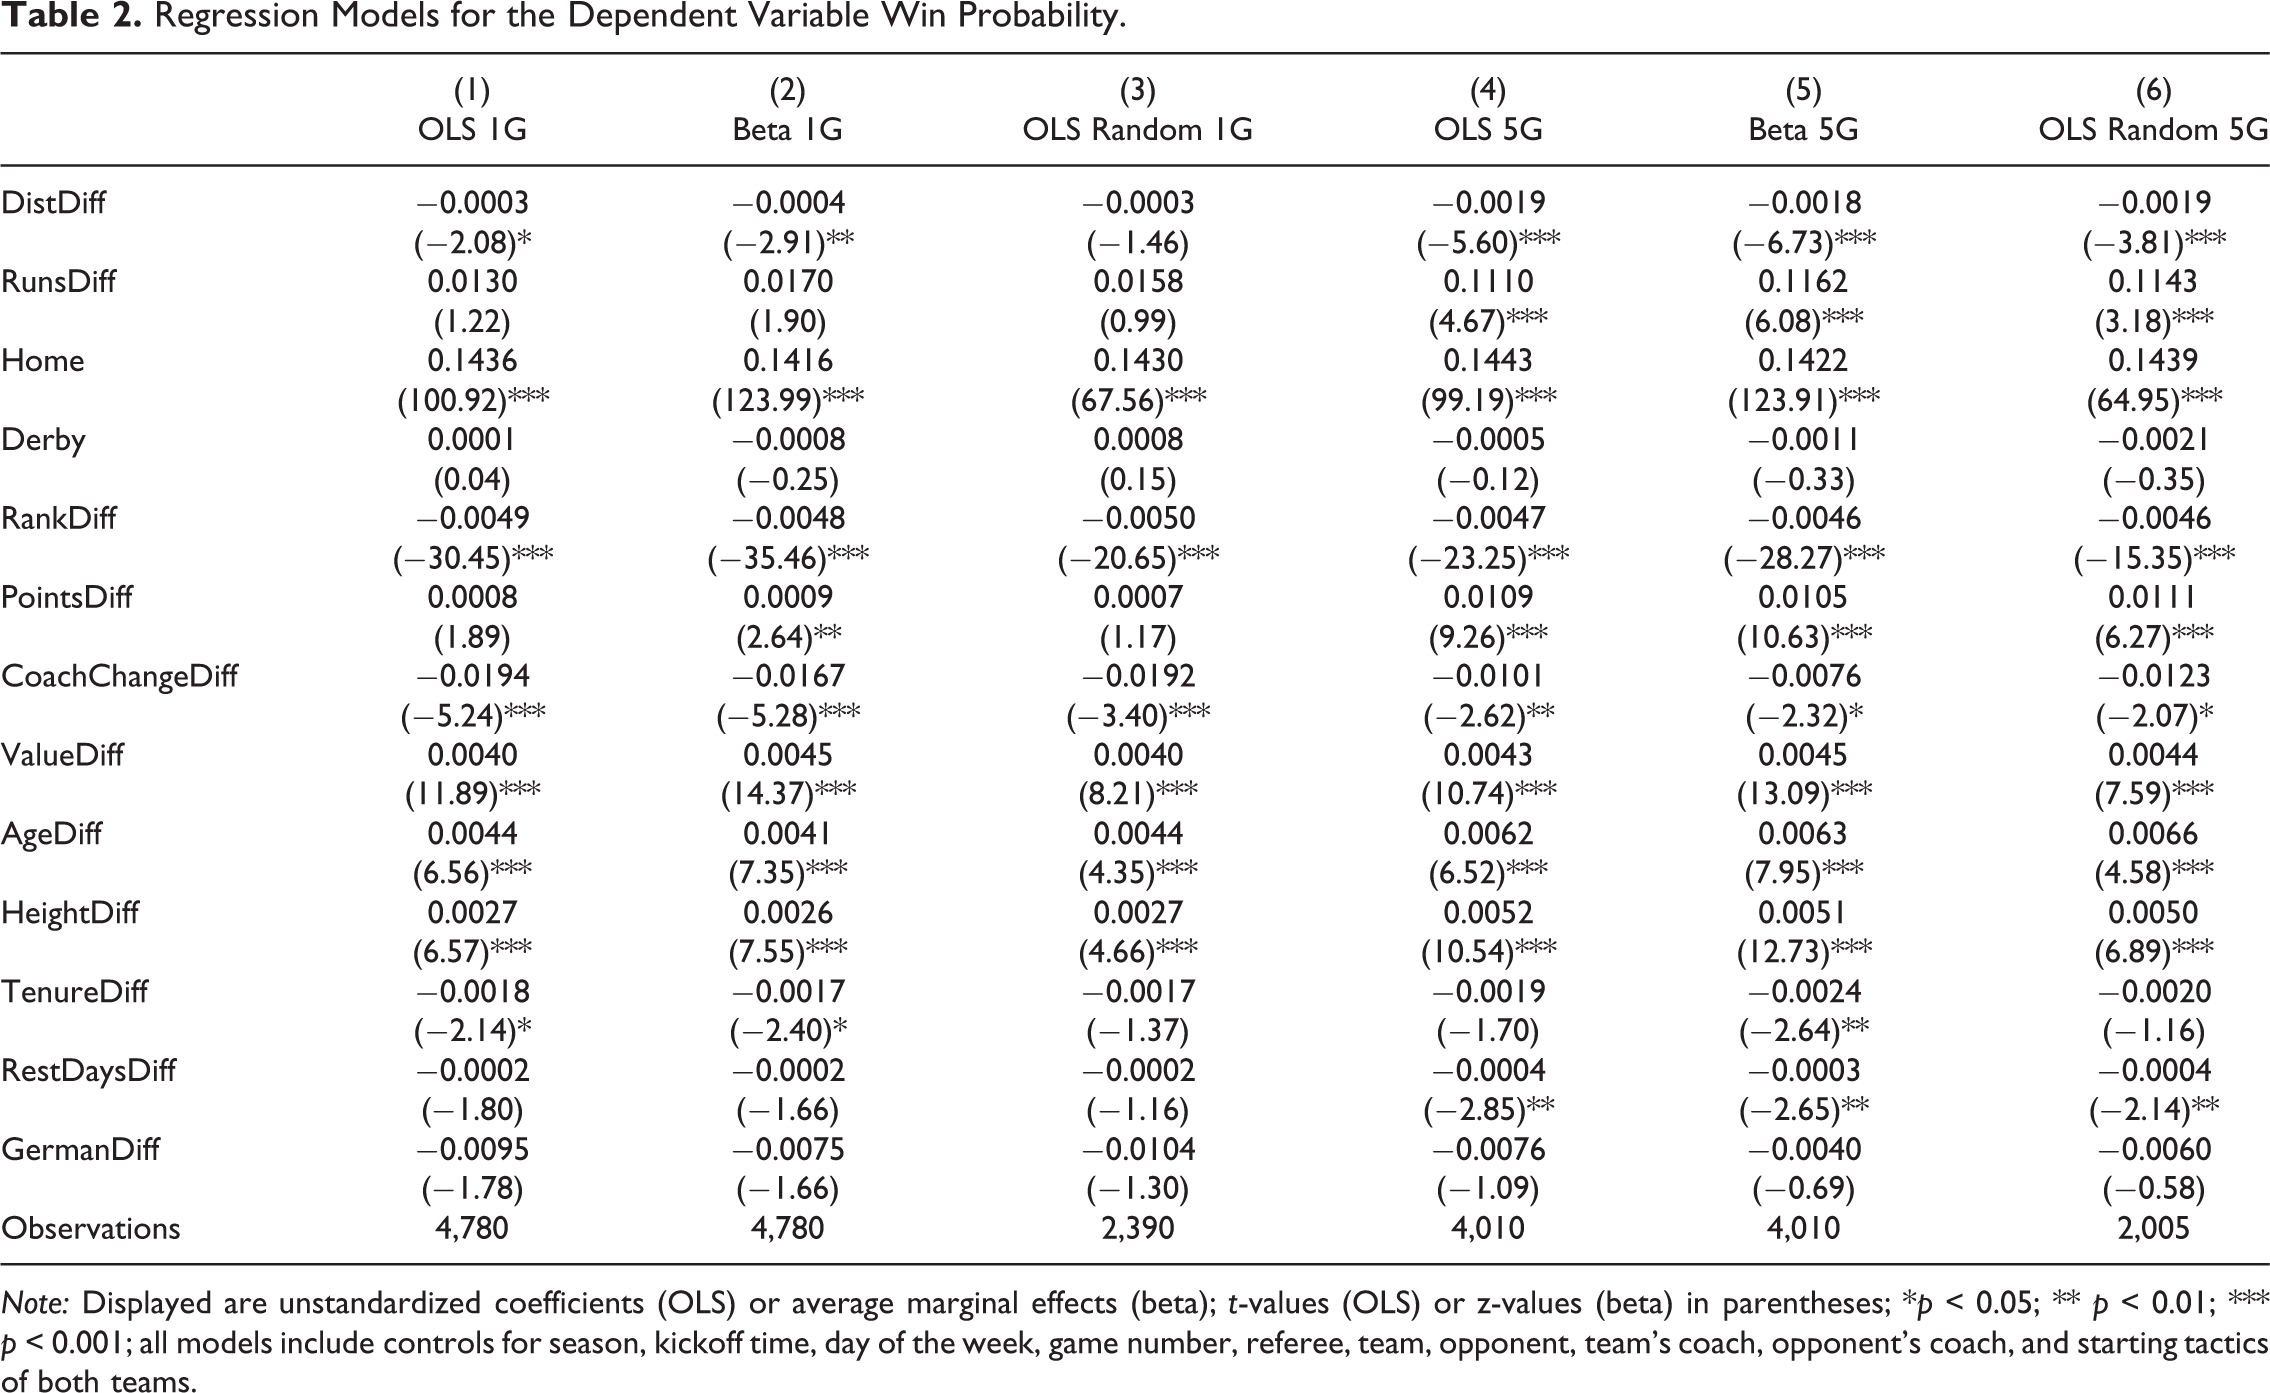
Note: Displayed are unstandardized coefficients (OLS) or average marginal effects (beta); t-values (OLS) or z-values (beta) in parentheses; *p < 0.05; ** p < 0.01; *** p < 0.001; all models include controls for season, kickoff time, day of the week, game number, referee, team, opponent, team’s coach, opponent’s coach, and starting tactics of both teams.
Results for the Last Game (1G)
Regarding running performance, we find an increase in the weighted average of total distance covered by the observed team compared to the opponent in the previous game leads to a decrease in expected win probability. This finding is contrary to Weimar and Wicker (2017) who found distance covered in relation to its opponent led to an increase in actual win probability. The difference between their study and the present research is Weimar and Wicker (2017) examined actual match outcome and not expected outcome. Hence, bookmakers believe teams who covered large distances on the field in the previous match are tired and, therefore, expect a lower winning probability. This expectation is contrary to knowledge in sports sciences, suggesting total distance covered during a football match cannot be considered an indicator of fatigue and professional football players at that level have a good level of aerobic fitness (e.g. Bangsbo et al., 2006). This finding suggests the betting market is potentially inefficient when evaluating total distance covered: Bookmakers interpret it as fatigue, while it is rather an indicator of effort.
The other running variable, RunsDiff, is statistically insignificant in Model 2. Thus, the bookmakers are not thinking the difference in runs between the observed team and its opponent are any signal of fatigue that would affect the expected win probability. Taken together, we find that the breakdown of the high-intensity running statistics in the previous game provided by the league for each player does not influence bookmakers’ win probability. This finding is surprising because high levels of high-intensity running cause fatigue (Bangsbo et al., 2006; Rampinini et al., 2009), which should, therefore, be associated with the expectation of a reduced winning probability. This expectation of a reduced winning probability is not the case, suggesting that bookmakers could be misinterpreting the running parameters from the last game.
Examining the control variables, we find home field advantage does impact expected win probability. This effect is in line with previous research studying performance expectations (e.g. Soebbing et al., 2015). The interpretation is that being the home team improves the expected win probability around 18%. A derby game, one which the competing clubs are located within 50 km from each other, has no impact on expected win probability. This result is consistent with previous research by both von Hanau et al. (2015) and Soebbing et al. (2015). Moreover, the effects of on-field team characteristics are in line with previous research on performance expectations using absolute and relative team quality (Soebbing et al., 2015; von Hanau et al., 2015). Since this study controls for various factors that could potentially influence expected win probability and their effects are consistent with existing research, the findings regarding running performance can be considered credible. The results presented in Model 2 are similar to the OLS model (1) and the random sample model (3). The only difference is that Model (3) does not have a statistically significant variable coefficient as it relates to the difference in distance covered in the game. However, the sign on the variable coefficient is similar to Model (2).
Results Over the Past Five Games (5G)
When comparing the two beta models (Model 2 and Model 5), we find the same effect as it relates to the weighted average difference in distance: Teams who covered more distance on the field in the previous five games than their opponent are expected to have a significantly lower winning probability. Again, bookmakers interpret total distance as a sign of fatigue rather than a sign of effort as previous research in both sports sciences (Bangsbo et al., 2006) and sports economics (Weimar & Scharfenkamp, 2019; Weimar & Wicker, 2017; Wicker et al., 2013) suggests. Bookmakers even seem to think that fatigue is accumulated over five games as the size of the coefficient is much larger in Model 5 compared to Model 2. This assumption by bookmakers is not reflected in the sports sciences literature as good levels of aerobic fitness facilitate quick recovery (e.g. Bangsbo, 1994; Rampinini et al., 2009).
A significant effect is also evident for intensive runs. Specifically, we find a difference between the model considering the last game (Model 2) and the model including the last five games (Model 5). In the latter, the number of intensive runs has a positive and significant impact on expected win probability. The positive sign on the coefficient suggests that they interpret this information as effort. In other words, bookmakers recognize the additional high-intensity running by the observed team over the previous five games, and the interpretation of effort leads them to assign a higher win probability. As indicated by previous research in sports sciences (Bangsbo et al., 2007; Rampinini et al., 2009), however, repeated high-intensity running (e.g. performing intensive runs) yields fatigue. Hence, the effect on expected winning probability should be negative. In addition, the difference in intensive runs between a team and its opponent does not increase actual team performance and the likelihood of winning the game, respectively (Weimar & Wicker, 2017). Given this knowledge available from existing research, it is not clear why bookmakers consider intensive runs as effort and assign teams with many intensive runs in the previous five games a higher winning probability.
Taken together, bookmakers’ assumptions are contrary to the existing body of knowledge, with distance being considered fatigue (rather than effort) and intensive runs being regarded as an indicator of effort (even though they cause fatigue). The results for the last five games are also credible and robust: The effects of the control variables are mainly consistent with those in Model 2, supporting the credibility of the running performance results. The results in Model 5 are also robust as the effects are also evident in the OLS model (4) and the random sample model (6).
Results by Season
Table 3 presents beta regression estimates with a one-game lag (1G). For the distance covered difference, we do not find any statistically significant finding for individual seasons in the sample. Likewise, we find no statistically significant coefficients for the number of intensive runs. While the latter finding is consistent with Table 2, the former differs in the sense that the difference in distance run had a negative effect on the expected win probability. The present findings differ from Deutscher et al. (2018) who found that the early games of recently promoted teams led to market inefficiency; however, this advantage was only present in the short-term. There does not seem to an early advantage from running information resulting from the implementation of new technology in our sample.
Table 4 presents the beta regression results with a five-game lag for each season. Recall from Table 2 that the full model revealed significant effects for both the difference in distance and the difference in intensive runs. For the difference in distance, the first two seasons in the sample are insignificant. From the 2013/2014 season onward, every season except the 2017/2018 are negative and statistically significant for the DistDiff variable.
For the difference in intensive runs (RunsDiff), we do not see a significant effect for the 2011/2012 season. After this initial season in the sample period, the results show a positive and significant effect for the next four seasons. These findings mean that for the next four seasons, teams who performed more intensive runs in the previous games than their current opponent were awarded a higher win probability by bookmakers. The final three seasons in the sample period are insignificant. Overall, the results for intensive runs show that they matter early in the time period in the eyes of the bookmaker. However, it seems like the bookmakers adjust later in the sample period. This finding over time could present itself as a source of market inefficiency. Overall, the results in Tables 3 and 4 show differences between seasons when looking at the running variables. We explore these variables as it relates to betting strategy below.
Beta Regression Models for Each Season (with One-Game Lags).
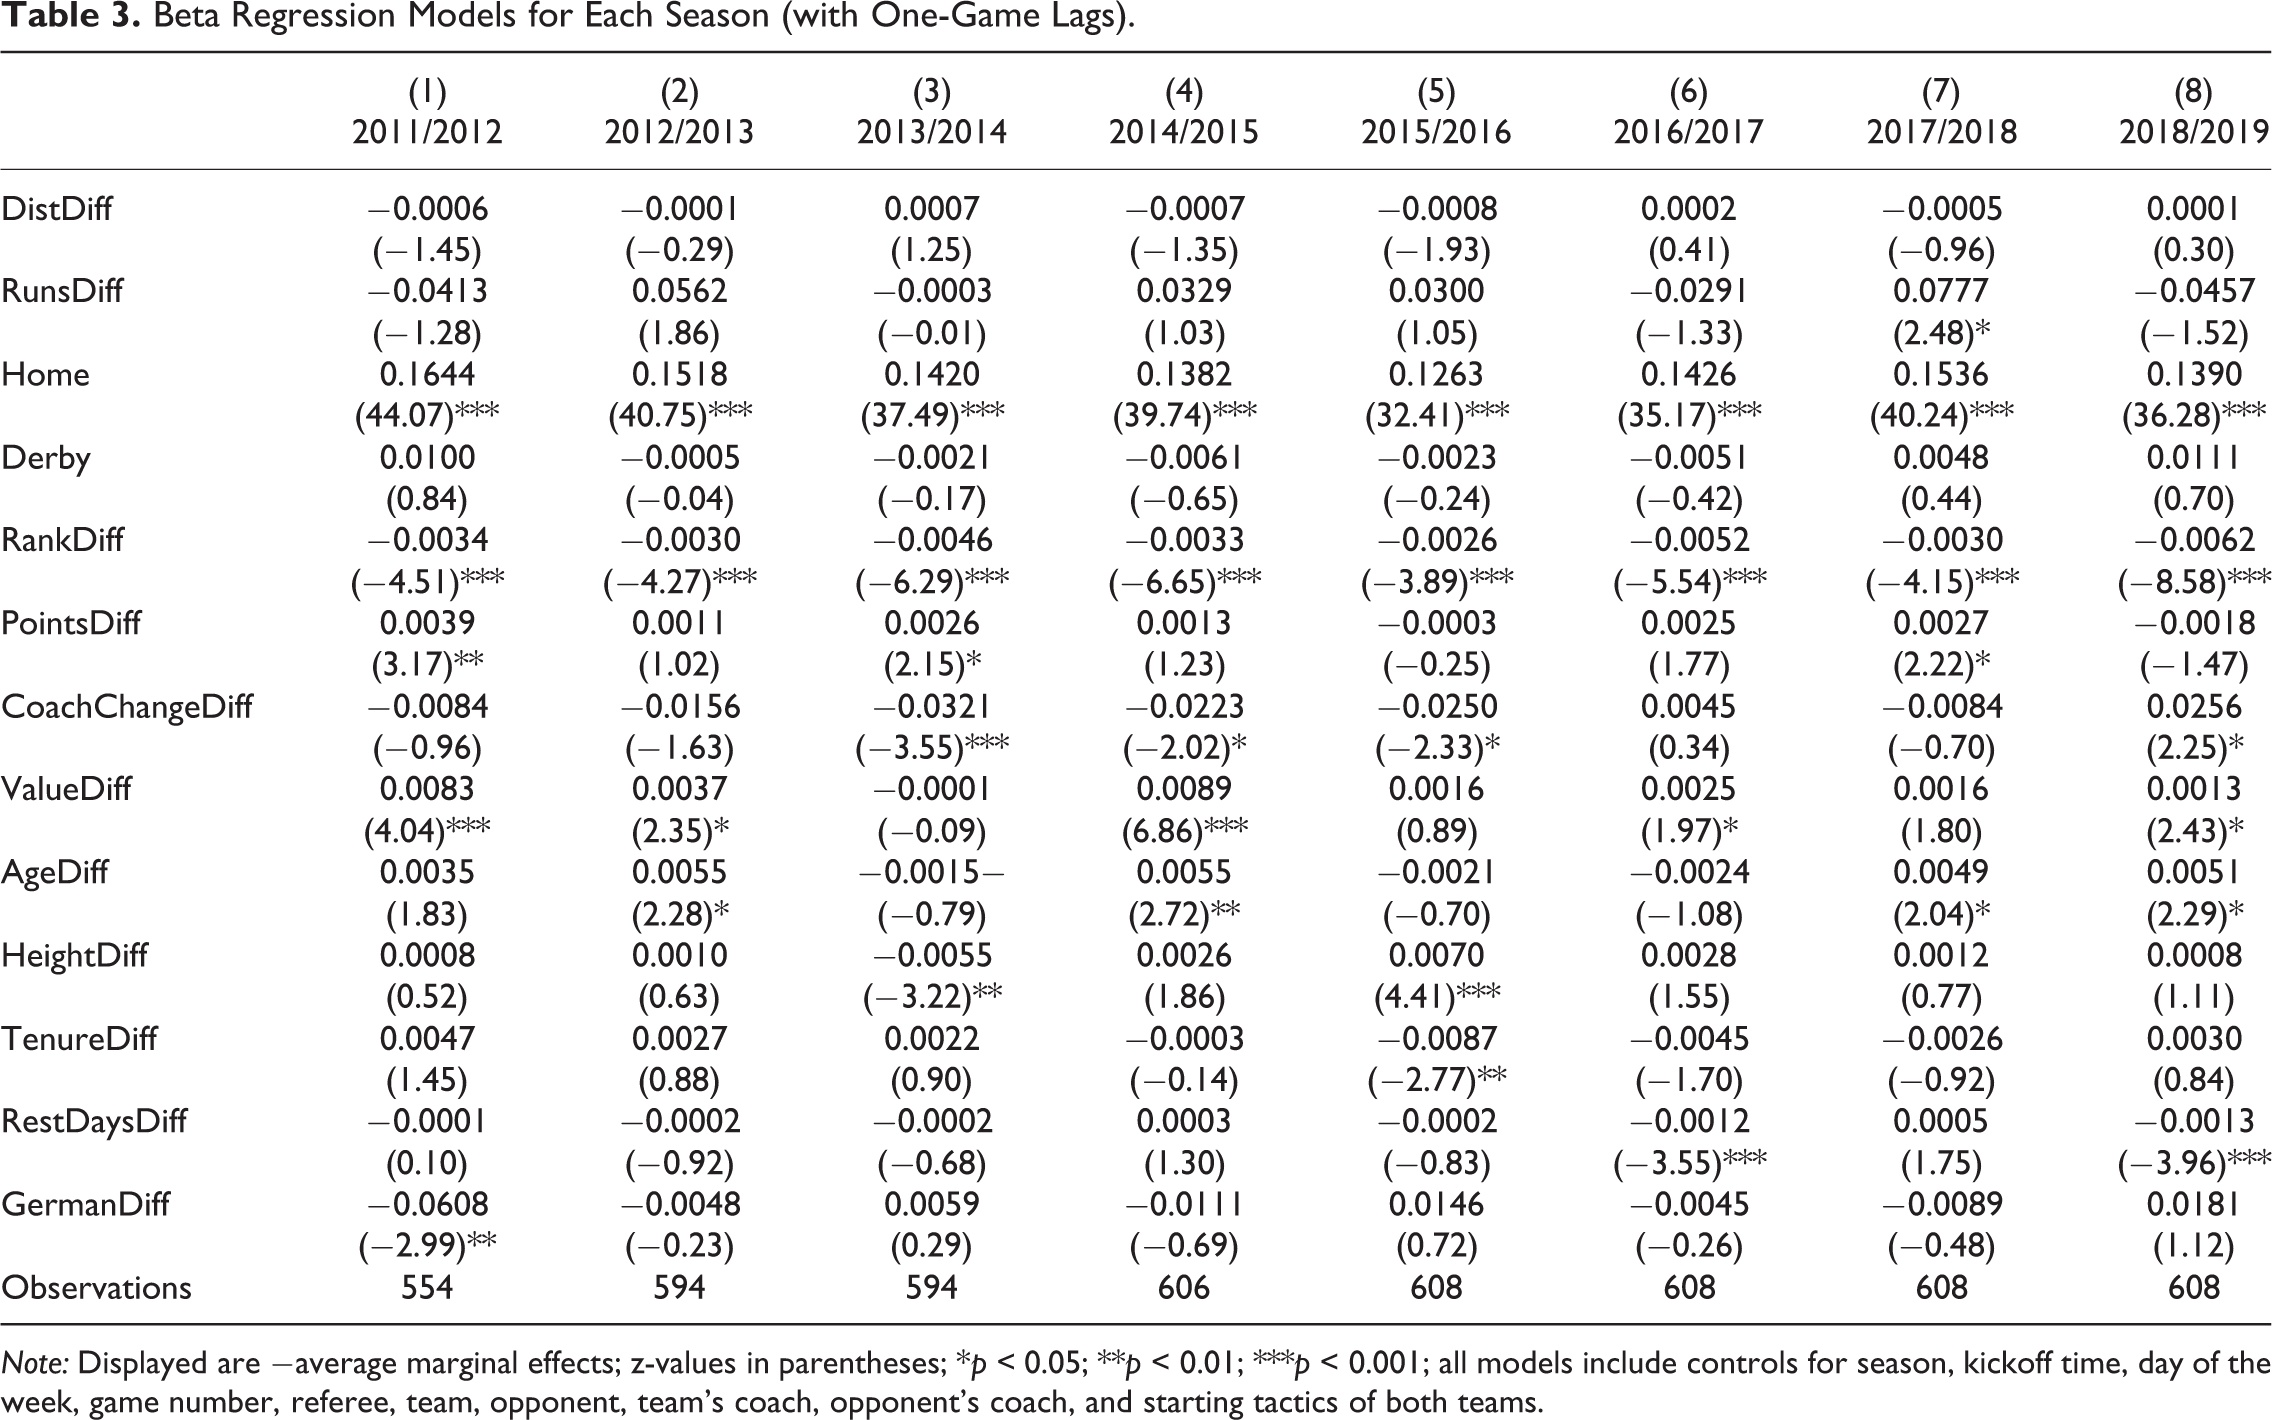
Note: Displayed are −average marginal effects; z-values in parentheses; *p < 0.05; **p < 0.01; ***p < 0.001; all models include controls for season, kickoff time, day of the week, game number, referee, team, opponent, team’s coach, opponent’s coach, and starting tactics of both teams.
Beta Regression Models for Each Season (with Five-Game Lags).
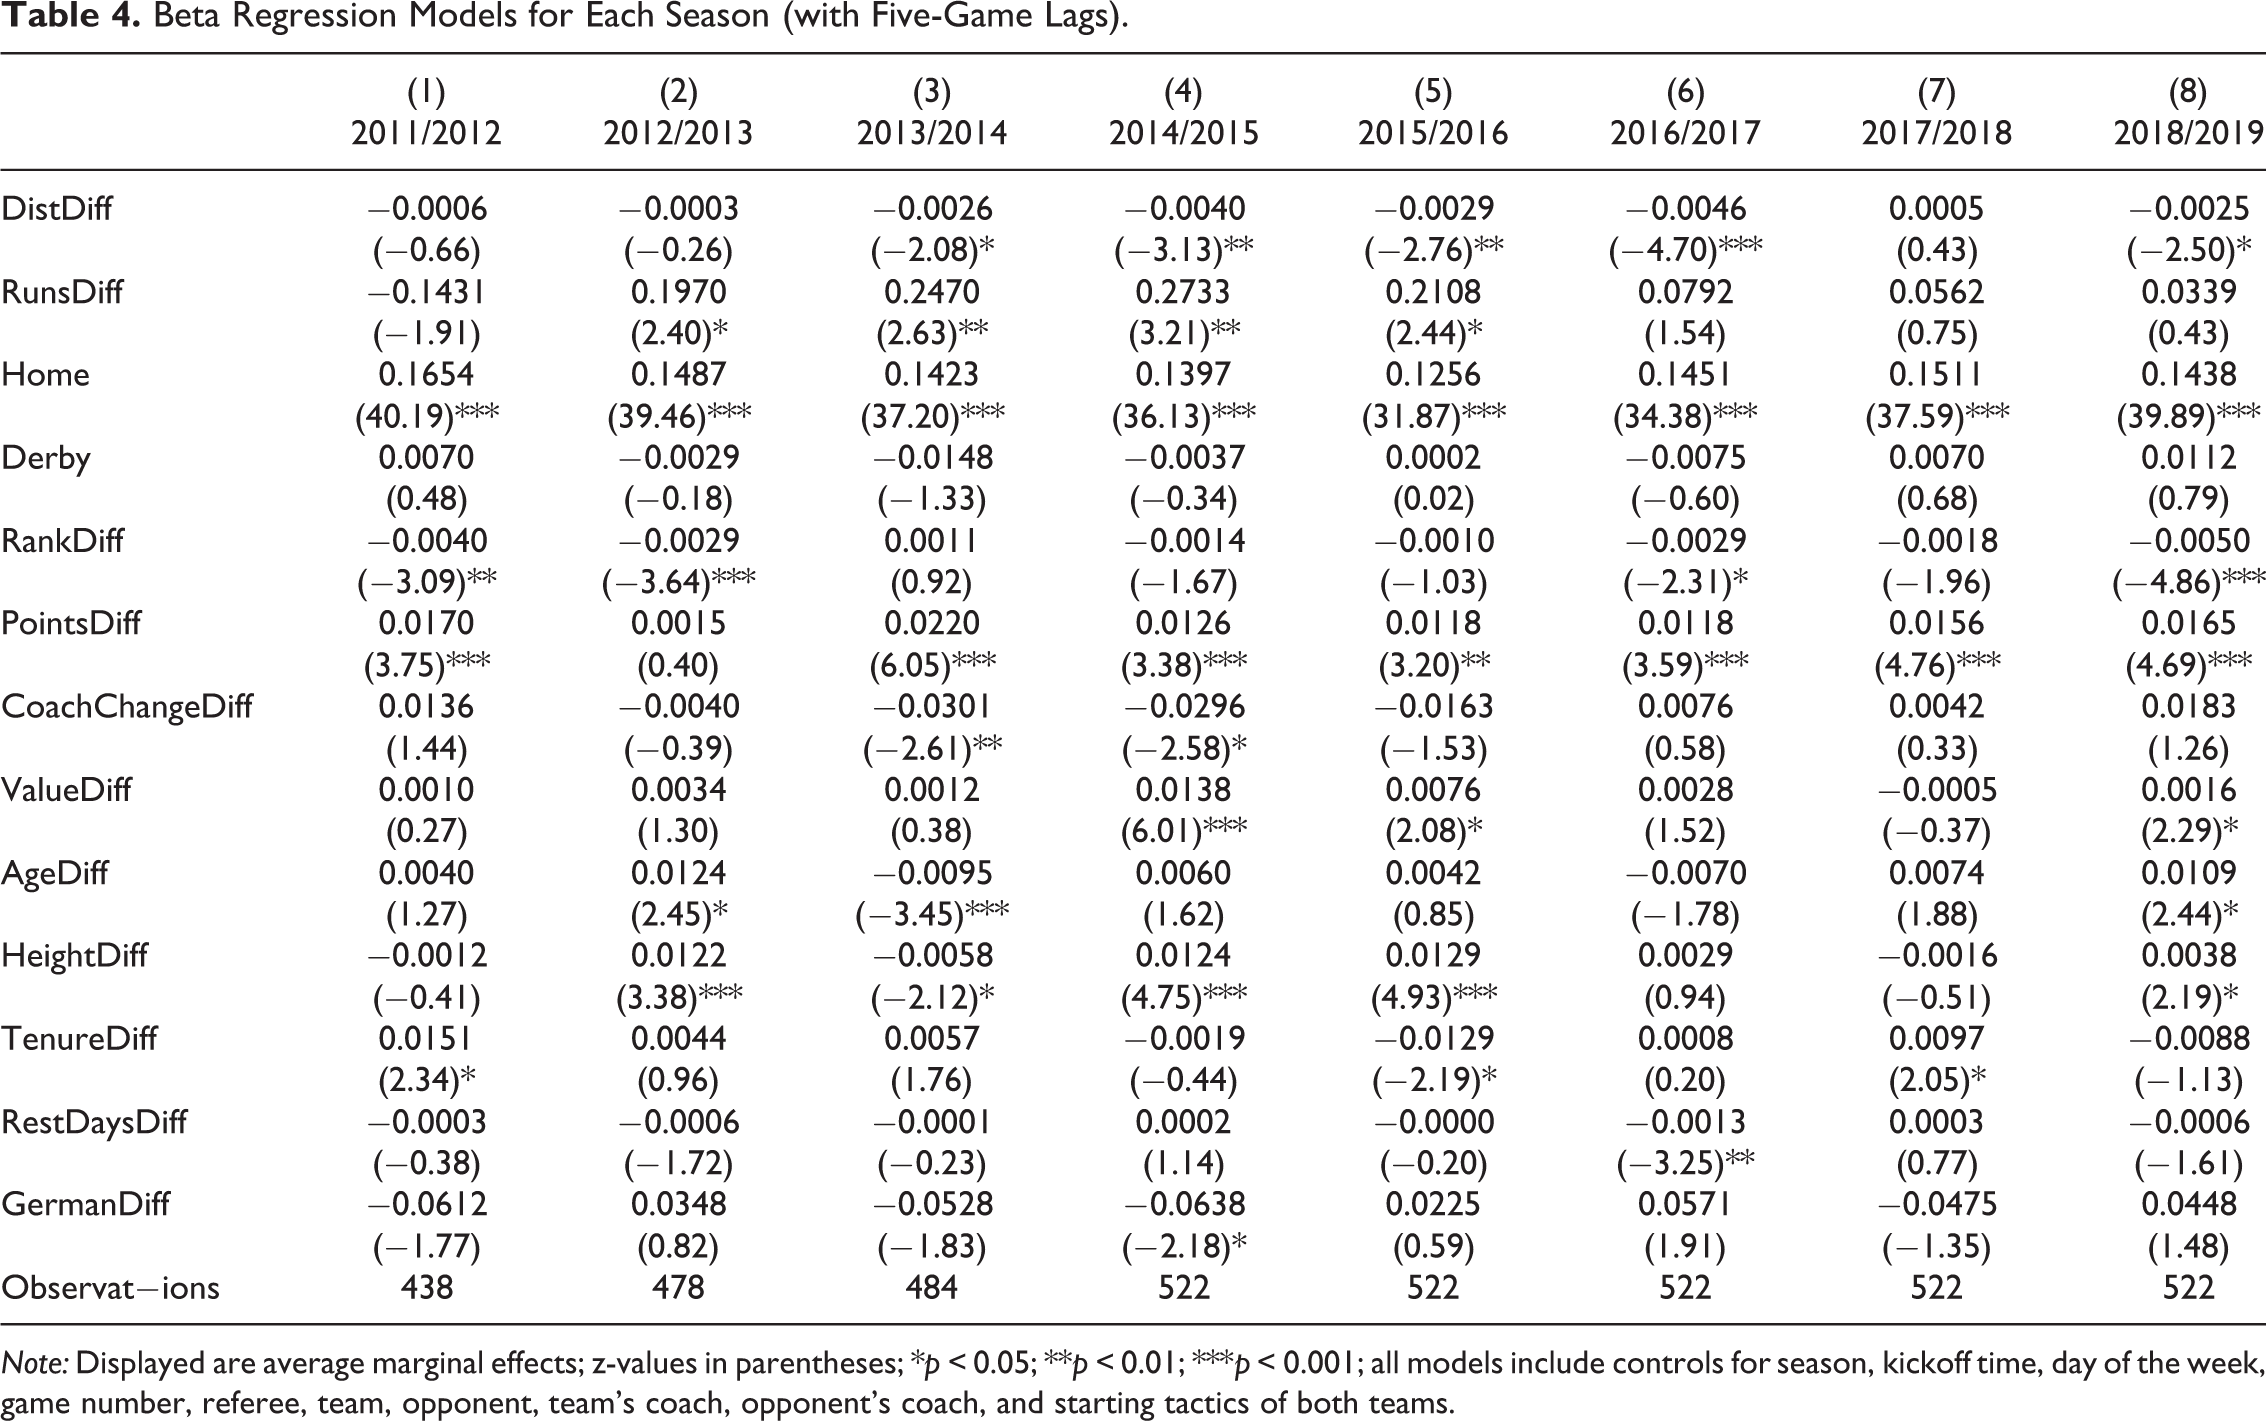
Note: Displayed are average marginal effects; z-values in parentheses; *p < 0.05; **p < 0.01; ***p < 0.001; all models include controls for season, kickoff time, day of the week, game number, referee, team, opponent, team’s coach, opponent’s coach, and starting tactics of both teams.
Market Efficiency
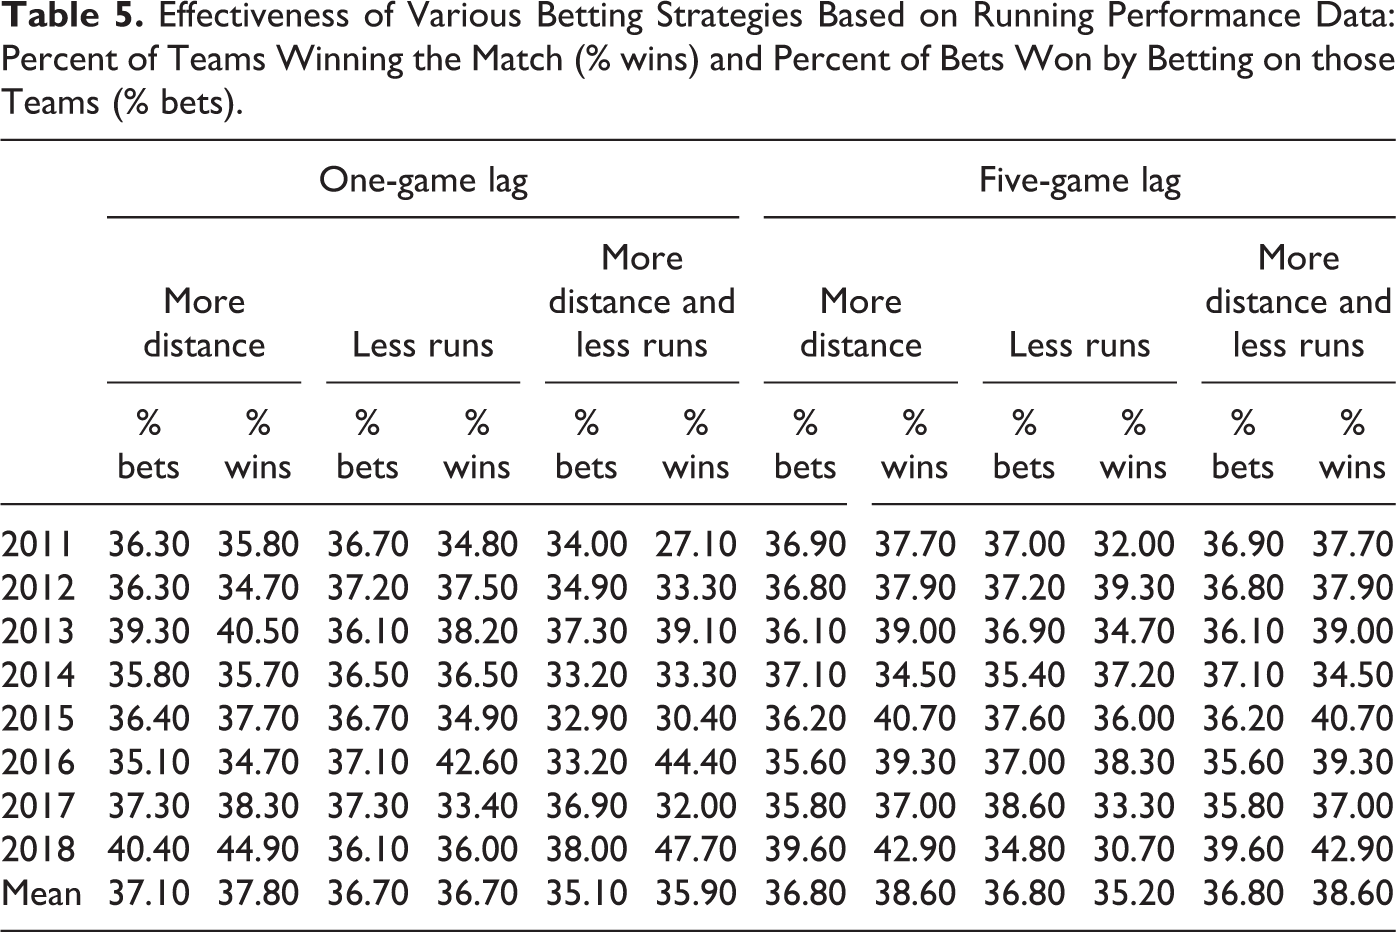
Based on the above findings, we constructed betting strategies and look at the winning percentage of those strategies throughout the sample period. The three strategies correspond to the team who ran more distance in the previous game (or last five games), the team with less intensive runs in the previous game (or last five games), and a combined strategy of more distance and less intensive runs in the last game (or five games). Table 5 presents these results for each individual season and the overall sample period. It is important to note that for each strategy, the bet is placed regardless of if the team is the home or away team. It is also a bet on that team to win the match. Hence, the table reports the share of matches won by teams covering more distance and/or performing fewer intensive runs and the share of bets won by betting on those teams.
Similar to Brown and Abraham (2002), the winning percentage of the betting strategy has to exceed the 54.5% threshold in order to make a profit. The results in Table 5 indicate that none of the strategies in any of the sample seasons exceeds this break-even threshold. As a result, our findings are an indication that the betting market is efficient as it relates to the introduction of the technology leading to the publicly available running data into the German Bundesliga betting market. Notably, the percentages are similar across seasons and betting strategies. Likewise, the shares of teams winning the match and bets won are similar.
Effectiveness of Various Betting Strategies Based on Running Performance Data: Percent of Teams Winning the Match (% wins) and Percent of Bets Won by Betting on those Teams (% bets).
Conclusion
The present study asked whether and how running performance of teams in previous matches impacts the expected probability of winning as expressed by betting lines. It also examined whether betting on teams based on previous running performance represents a profitable betting strategy and whether the betting market is efficient, respectively. From the literature, running can be considered a sign of team effort or fatigue. Looking at over 4,000 German Bundesliga team-game observations, the results do provide some support that bookmakers take into account running performance. As it relates to the total distance covered by the team in the last game and the last five games compared to the opponent, the bookmakers seem to interpret this as a sign of fatigue, leading to a decrease in expected win probability. When bookmakers look at the number of intensive runs over the last five games, this performance is taken as a sign of effort leading to an increase in expected win probability.
Both effects are contrary to existing research in sports science and sports economics, suggesting total distance covered indicates effort and positively affects the likelihood of winning a match, while high-intensity running such as performing intensive runs causes fatigue and reduces the probability of winning a match. Therefore, distance covered should have a positive effect on expected winning probabilities and the number of intensive runs a negative effect. On the surface, this different view from the academic literature could present betting market inefficiencies. However, our follow-up results examining these betting strategies show the betting market remains efficient. In other words, following a betting strategy of betting on the team with more distance, less intensive runs, or a combination of both of those factors does not provide a profitable betting strategy for bettors.
The present study adds to the recent and growing literature on incorporating technology and the data gathered from improved technology on team and player outcomes.
It is still not clear to which extent bookmakers rely on this publicly available information on running performance and how they process the available information. Gaining insights into the use and processing of these running data by bookmakers would be helpful. More broadly, the adaption of technology and the impact on betting markets is part of an ongoing discussion. For example, MLB uses technology to monitor the behavior of umpires calling balls and strikes (Mills & Salaga, 2018). Within that league, there has been talk of going completely to a computerized strike zone. If this does occur in MLB and other sports leagues throughout the world adopt more technology, then these adoptions provide interesting empirical examination settings as it relates to the betting markets.
As mentioned previously, betting market inefficiencies usually appear to be short-term and the betting market will adjust over time (Deutscher et al., 2018). This circumstance, in combination with the growing digitization and associated emergence of new data, presents an interesting avenue for future research. Scholars might find it worthwhile to more closely investigate how fast new technologies are adapted by stakeholders such as bookmakers. Or put differently, for how long newly emerging technologies and associated data might present opportunities for bettors to identify profitable betting strategies. The findings presented in this work provide a starting point for such a line of research.
Footnotes
Acknowledgments
The authors would like to thank attendees of the 2018 Football and Finance Conference as well as the 2019 Western Economics Association Conference for helpful comments on the project. All errors and omissions are the responsibility of the authors.
Declaration of Conflicting Interests
The author(s) declared no potential conflicts of interest with respect to the research, authorship, and/or publication of this article.
Funding
The author(s) received no financial support for the research, authorship, and/or publication of this article.