
Abstract
Using heterogeneous COVID-19 stadium attendance restrictions during the 2020 NFL season as an instrumental variable for stadium attendance and a novel panel data containing historical NFL game outcomes, attendance, weather, penalty assessment and visitor travel information between 2009 and 2022, I examine the effect of home stadium attendance on a variety of match outcomes, while controlling for a comprehensive set of covariates. I find that home stadium fans influence the outcomes of NFL games in favor of the home team, and that this result is insensitive to the inclusion of other factors previously suggested to explain home advantage in gridiron football. Neither the size of the home crowd nor the home crowd density has any measurable effect on referee home bias in the NFL, suggesting NFL home fans directly influence match outcomes by negatively affecting visiting team performance, possibly through a crowd noise distraction mechanism.
Introduction
The game of American football is a unique sport, combining elements of forward and backward passing, strength, foot speed, and jumping ability, conducted while clad in a suit of protective padding. The sport requires a specific degree of agility and power for every unique position on the field. Following the ratification of Walter Camp’s innovative rule changes in 1880, the game of gridiron football has been contested between two teams of eleven players each, and this is where the idea of the “12th Man” originates. 1 The contemporary concept of the 12th Man refers to the home stadium fans’ collective belief that their presence helps their team achieve greater success than would otherwise be possible, and this study aims to investigate whether this belief is accurate, or simply collective wishful thinking.
The original 12th Man was a real person, however. The origin story contends that during the 1922 Dixie Classic, a precursor to the New Year’s Day college football bowl games, the Texas A&M side was running low on players and, at that time, failing to field a full 11-player team resulted in immediate forfeiture. The Texas A&M coach recalled a Texas A&M basketball player named E. King Gill, who was watching the game from the pressbox, to serve as the team’s emergency “12th man”. Gill’s services on the field were ultimately not required that day, but despite Gill never playing in the Dixie Classic, the legend of the 12th Man was born. 2
Presently, at both the collegiate and professional levels, the role of the 12th Man is assumed by the home stadium crowd, who believe themselves, through their actions off the field, to be assisting their team on the field. When the home team plays competitively, the stadium crowd becomes increasingly engaged by the action on the field. As if to return the favor for the home team’s effort, the 12th Man exerts as much energy and creates as much noise as possible, predominantly before and during high-leverage offensive plays for the visiting side, all in an effort to hinder the visiting team’s performance. While conventional wisdom would suggest that the efforts of a dedicated home stadium crowd cannot possibly go unnoticed, the visiting players on the field are highly-paid professional athletes, who have undoubtedly experienced similar playing conditions in past contests. For this reason, there is a persistent skepticism that those in attendance can affect on-field performance, despite the unwavering belief among the dedicated home fans that they are indeed making a difference.
While the size and engagement of home stadium crowd is presumed to affect home team success, accurately measuring the attendance effect on game outcomes presents a lingering problem– better home team performance will positively affect demand for stadium attendance, but greater stadium attendance may positively affect home team success at the same time; the two quantities are likely simultaneously determined (Smith & Groetzinger, 2010). The unanticipated public health mandates during the COVID-19 pandemic provide a unique opportunity to overcome this limitation.
The advent of the COVID-19 pandemic spurred government officials to implement broad public health measures to combat the spread of the disease, but restrictions on social gatherings in the United States varied greatly between and within individual US states. While attendance at NFL stadiums in these states was similarly restricted, the number of fans in attendance varied greatly: in some areas, local governance allowed zero fan attendance, while other jurisdictions allowed up to 31700 fans to attend games during the 2020 NFL season. 3 Improving and expanding upon the results of Ehrlich et al. (2024), this study uses a comprehensive, novel NFL panel data spanning 2009 to 2022 and the heterogeneously-applied 2020 NFL stadium attendance restrictions as an instrumental variable (IV) to examine the effects of home stadium attendance on NFL match outcomes to first determine if fan attendance effects exist, and if so, to find evidence for a mechanism by which they arise.
Home Advantage and Mechanisms
Following the pioneering work of Schwartz and Barsky (1977), the existence of a home advantage in sport has been consistently observed in many different countries for a variety of sports, both amateur and professional.
In European football, Cross and Uhrig (2023), Fischer and Haucap (2021) and Scoppa (2021) find that lack of attendance affects both home winning percentage and home scoring advantage across a variety of European football leagues using COVID-19 stadium attendance restrictions as a natural experiment.
Examining sports outside Euro football, Koning (2011) finds male tennis players enjoy a significant home advantage, while women are apparently unaffected by playing on unfamiliar tennis courts. Again using COVID-19 attendance restrictions as a natural experiment, Ehrlich and Potter (2023), Gong (2022) and Ganz and Allsop (2024); Price and Yan (2022) find that home fans affect home NBA team performance: playing in an empty arena eliminated home advantage, but the home court advantage remained with even a small group of socially-distanced home fans present, and the presence (or lack) of fans had no effect on referee foul assignment. Extending these results to hockey, Guérette, Blais, and Fiset (2021) and Thrane (2024) finds that the home ice and penalty advantages persistently afforded the home team disappears during games played in empty rinks in the National, Canadian and Norwegian Hockey Leagues.
Among the studies to analyze home advantage in professional American football, Moskowitz and Wertheim (2011) note that, upon the introduction of instant replay to the NFL, there was a subsequent drop in fumble recovery rates by the home team, shrinking the home team possession and scoring advantages. Vergin and Sosik (1999) find a significant home scoring advantage during Monday night matches (Monday Night Football, or MNF), which they attributed to greater attention and crowd noise during games televised during this prime evening TV window. Albert and Koning (2007) find supporting evidence for a home advantage throughout American football using data from NFL, NCAA and Australian professional football leagues. For further background, Benz et al. (2024) provide a comprehensive survey of the evidence for home field advantage in the NFL.
Despite the persistent home field advantage observed in NFL games, due to historical NFL data limitations, relatively few studies investigate the mechanisms for why it exists. Various mechanisms have been proposed to explain the persistent advantage enjoyed by the home team: direct crowd effects, home crowd influence upon referee decisions, travel hardships for the visiting athletes, unexpected temperature, wind and precipitation shocks may all explain portions of the persistent difference in success between home and visiting competitors.
Direct crowd influence is one hypothesis of NFL home advantage recently explored in the sport literature. Exploiting the COVID-affected 2020 NFL season as a natural experiment in home stadium attendance, Ehrlich et al. (2024) find that it is the presence of the home stadium crowd itself, but not the crowd density, that is responsible for the entirety of the observed home field advantage in NFL football. These results are robust to stadium familiarity and visiting team travel distance, but overlook the potentially-confounding effects of referee home bias, variable weather conditions and time zone crossing during travel.
Referee home bias is often thought to explain a large fraction of the persistent scoring and match outcome advantage enjoyed by home teams and players. Boyko, Boyko, and Boyko (2007) finds evidence for significant referee bias in English Premier League football. In other European leagues, Reade, Schreyer, and Singleton (2022), Bryson, Dolton, Reade, Schreyer and Singleton (2021) and Wolaver and Magee (2022) also find that, during professional football matches played behind closed doors during the COVID-19 pandemic, referees called the visiting team for significantly fewer infractions. Rickman and Witt (2008) find that more highly-paid referees exhibit less penalty home bias in English football, suggesting that outside monetary influence could be a factor in referee decision-making. Brymer, Rodenberg, Zheng, and Holcomb (2021) finds that these results extend to American college football, where referees exhibit significant biases against underdog teams during in-conference games. For further background on how referee decisions are affected by circumstances in sport, Dohmen and Sauermann (2016) provide a comprehensive review of the referee bias literature.
Home referee bias is among the most common mechanisms suggested to explain the well-documented NFL home field advantage. NFL penalty assessment can be highly subjective, largely at the discretion of the head referee in charge of policing the game. Many penalties are not clear-cut infractions, but instead are relegated to “judgement calls” by the referee and his umpiring crew. Penalties such as offensive and defensive holding, offensive and defensive pass interference, player alignment infractions and many unsportsmanlike conduct penalties fall under this guise. For this reason, it is quite possible that a raucous home stadium crowd could influence the referee’s judgement when assigning penalties to the home and visiting sides.
Extending the Euro football referee home bias literature to the NFL, Snyder and Lopez (2015) examine referee penalty assessment for the most frequent NFL infractions, and find that defensive pass interference (DPI) is 18% more likely when the home team is on offense. Among studies using the COVID-19 stadium attendance restrictions as an IV, Farnell (2023) finds that the probability of a “false start” penalty on a visiting offense falls as stadium attendance falls, suggesting that increasing the size of the home stadium crowd has a deleterious effect on visiting team discipline, particularly in pressure situations.
Visiting team travel burden has also been conjectured to positively influence home team success in American football. Examining NFL football games, Nichols (2014) finds that more miles traveled and more hours lost while traveling (i.e. crossing time zones from west to east) both negatively affect visiting team match performance. Extending these results to NCAA college football games, Fullagar, Delaney, Duffield, and Murray (2019) finds a relationship between larger home crowd size and greater home field advantage, but also greater distanced traveled and worse visiting team performance. However, in a small sample of matches played between teams which share a stadium, Boudreaux, Sanders, and Walia (2017) finds a strong home advantage remains for the designated “home team” even in the absence of any visiting team travel effects.
Game time weather can vary wildly at outdoor NFL stadiums and extreme temperature conditions are well-known to affect athletic performance (Borghesi, 2007). Strong, or unpredictably gusty winds can negatively affect quarterback passing efficiency, field goal attempts and point after try (PAT) kicks. Precipitation can make the ball slippery or interfere with player vision and grip, resulting in more fumbles, dropped passes and failed kick attempts.
In an attempt to control for potential confounders, this study uses a broad panel dataset of NFL variables spanning the 2009 to 2022 NFL seasons which captures many of the aforementioned factors presumed to affect home team success in the NFL.
Data and Descriptive Statistics
I assemble the panel dataset used in the empirical analysis from a diverse collection of publicly-available NFL statistical databases and websites spanning the 2009 to 2022 NFL seasons. These data sets are then combined to form a single comprehensive panel, merged with respect to home team stadium and match date. After excluding games conducted at neutral sites, the panel data contains 3715 total observations, and includes information on match outcomes, stadium gate attendance, visiting team travel information, local game day weather conditions, and referee penalty assessment data.
Game Outcomes and Stadium Attendance Data
The primary constituent of the panel data, historical NFL game outcomes spanning 2009 through 2022, is collected from pro-football-reference.com. These data include home and visiting team identifiers, home and visitor final scores, stadium identifiers, match dates, day of the week, scheduled game start times, and gate attendance figures. Several dependent variables of interest are constructed using this game outcome information: a binary home win identifier variable to measure average home team winning percentage, a home team margin of victory (or loss) variable to capture the average home field points advantage, and a total points scored variable, the sum of the points scored by both teams.
To proxy for the relative team strength of the home and visitor teams in a given NFL match, a running Elo rating variable is constructed from historical win/loss information. The Elo system was originally designed for the purpose of ranking chess players, but the Elo system has been subsequently implemented to predict outcomes of other zero-sum competitions involving 2 competitors or teams, including American football. 4 Team Elo ratings are based upon prior team success and serve as an ordinal ranking system which describes relative team strength at a given point in the season. Differences in Elo ratings are predictive of head-to-head performance and I include home and visiting team pre-match Elo ratings as covariates for this purpose (Dabadghao & Vaziri, 2022).
Geographical Data
Distances between cities with NFL franchises, past and present, is collected from the NBER City Distance Database, which is derived from US Census data sources. Distances between cities are calculated using great-circle distances and the Haversine formula, based on central points in the local geographic area. From these data, I construct two new visiting team travel variables: “distance traveled by visiting teams” and “number of time zones crossed by the visiting team”. These travel variables are included as covariates in the empirical model.
Weather Data
Weather is an important exogenous variation in outdoor games, and consequently the panel data includes a comprehensive set of game day weather variables, gathered from NFLweather.com. Weather variables include local game time temperatures in Fahrenheit, game time wind speeds in miles per hour, and precipitation fixed effects which include categorical variables denoting when a game was played indoors, or if played outdoors, under clear weather, rainy, snowy or foggy weather conditions. These random weather condition variables are included as exogenous covariates in the analysis.
Penalty Assessment Data
Penalty assessment information is used to estimate potential referee home bias in the analysis. This component data set is collected from NFLpenalties.com, which details the head referee overseeing the game referee crew, the total number of penalties called on each team, the total number of accepted penalties enforced upon each team, the total number of declined and offsetting penalties called, along with the total penalty yardage enforced on both teams.
NFL penalty enforcement is unusual in sport: when a team is deemed by the referees to have broken a rule, the other team is given the option of enforcing (accepting) the penalty against the rule-breaking team, or to forgo (decline) the penalty. This is because game play does not stop when a penalty occurs, but instead continues until the referee’s whistle sounds. As a result, there are often in-game scenarios where an offensive play will accumulate greater gains than the defensive penalty would have awarded, and in turn, the team on the offensive chooses to forgo that penalty in favor of the offensive gains made during normal game play.
This creates two different measures of penalty assessment: total penalties, including those which offset or were declined by the team offended against, and accepted penalties, which are then enforced upon the offending team. These penalty measures are used as dependent variables in the referee penalty assessment portion of the analysis.
Summary Statistics
The summary statistics for the full NFL panel data are presented in Table 1.
Summary Statistics.
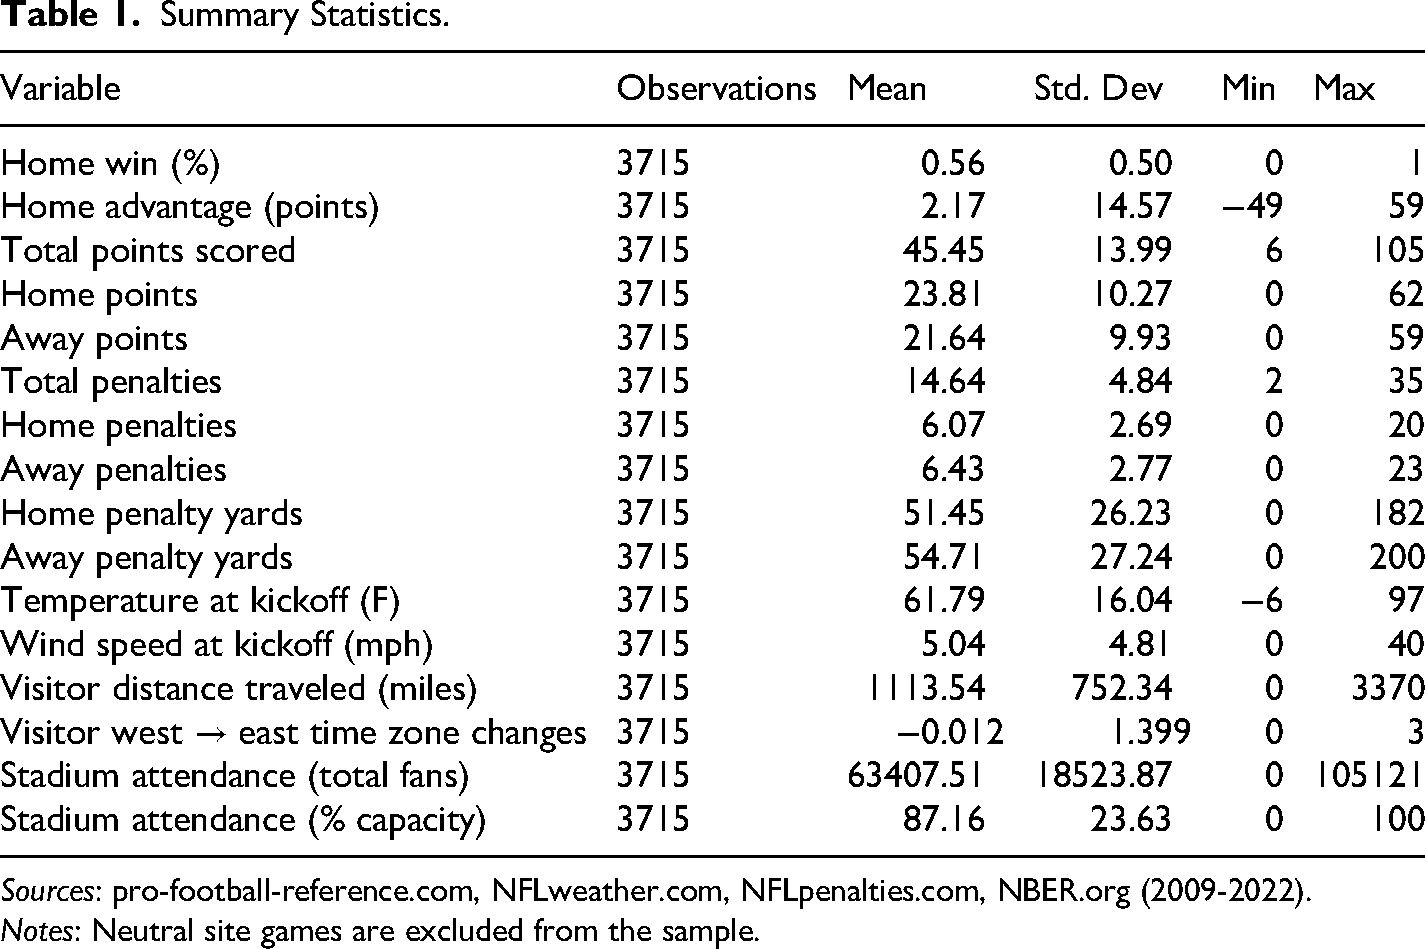
Sources: pro-football-reference.com, NFLweather.com, NFLpenalties.com, NBER.org (2009-2022).
Notes: Neutral site games are excluded from the sample.
It is important to note: the dependent game outcome and penalty assessment variables all exhibit a normally-distributed empirical density functional form, and after examining the sample means and standard deviations, there is little or no evidence to suggest left censoring of any dependent variables.
Empirical Methodology
Naive OLS Relationships
The regression model of interest, described by equation (1), aims to estimate the basic relationship between stadium attendance, 
The term
The naive OLS estimates generated by equation (1) should not be interpreted as causal, however, due to the simultaneous determination of stadium attendance and the dependent variables under investigation. The effect of this simultaneity is contained in the error term, and will bias the estimate of the effect of stadium attendance on the dependent variables. For this reason, it is necessary to implement a two-stage instrumental variables (IV) estimation in an effort to control for factors which may be correlated with both stadium attendance and the dependent variables of interest.
Identification Strategy: Instrumental Variables Estimation
The validity of a two-stage IV estimation depends upon satisfying two criteria: the instrumental relevance criterion and the instrumental exclusion restriction. Instrumental relevance requires that the IV have a “strong enough” effect on the endogenous independent variable in the first stage of the IV estimation to generate a measurable effect in the eventual second-stage estimation. The relevance criteria is supported by the magnitude of the F-statistic associated with the first stage of the two-stage IV model, described by equation (2).
As in equation (1),
If the first stage F-statistic is deemed “large enough”, the instrumental variable is considered “strong enough” to detect a measurable second-stage causal effect. Stock and Yogo (2002) and Staiger and Stock (1997) developed the original guidelines for the testing of weak instruments, which were later improved by Kleibergen and Paap (2006). This study tests the relevance criterion using a subsequent method developed by Olea and Pflueger (2013). Improving upon earlier methods which required homoskedastic, serially uncorrelated errors, the Montiel-Olea Pfleuger (MOP) “effective” F-statistic is robust to heteroskedasticity, autocorrelation, and clustering. Provided the MOP F-statistic exceeds the MOP critical value (or is greater than 10, by conventional econometric wisdom), the instrument is deemed to satisfy the relevance criterion. 5 For a broader survey of the literature on inference in the presence of weak instruments, see Stock, Wright, and Yogo (2002).
The second criteria for valid IV estimation is instrumental exclusion, or the “exclusion restriction”. This criterion requires that the IV be correlated (hopefully strongly) with the endogenous regressor,
Provided the first stage estimation satisfies the relevance criterion, the fitted values of the first stage estimation may be used in place of the endogenous variable, 
The definitions of the variables in equation (3) mirror those defined for equation (1), and provided the exclusion restriction holds, the term
Robustness and Corroborating Evidence
To expand the scope of the main IV results, additional evidence is presented in sections 5.3 and 5.4. In section 5.3, I stratify by stadium type, separating indoor from outdoor stadiums to test for differences between closed and open stadium design. The stratification process results in two disjoint samples: one sample of outdoor games containing 2853 observations, and one indoor-match sample of 861 observations. The IV analysis is repeated using the stratified subsamples to compare the home stadium attendance effects both with and without potentially confounding outdoor weather conditions.
NFL stadiums vary greatly in capacity and architecture, and as a result, total stadium attendance is only one method to measure the effect of attendance on game outcomes. Small stadiums filled to capacity may contain a smaller total crowd population, but at a greater crowd density, resulting in different crowd effects when compared to a comparable total crowd population housed in a more spacious stadium but at lower density. For this reason, and in an effort to replicate the IV estimation conducted in section 5.2, I swap the stadium attendance count variable with a “percentage of full stadium capacity” variable to test for any measurable differences between the crowd effects generated using total stadium attendance versus stadium crowd density.
I then re-estimate equations (2) and (3) using the percentage variable (

The estimates for “percent stadium capacity” crowd effects are presented in section 5.4.
Results and Discussion
Naive OLS Estimates: Game Outcomes and Penalty Assessment
Naive OLS estimates are a method of establishing basic relationships between attendance and outcomes within the data. To support the identification strategy used in this study, I parse stadium attendance counts into bins and inspect the nonparametric relationships between attendance and related game outcome variables. The relationships between attendance and home winning percentage, home field advantage in points, total points scored and home and away team scoring are depicted in Figure 1.
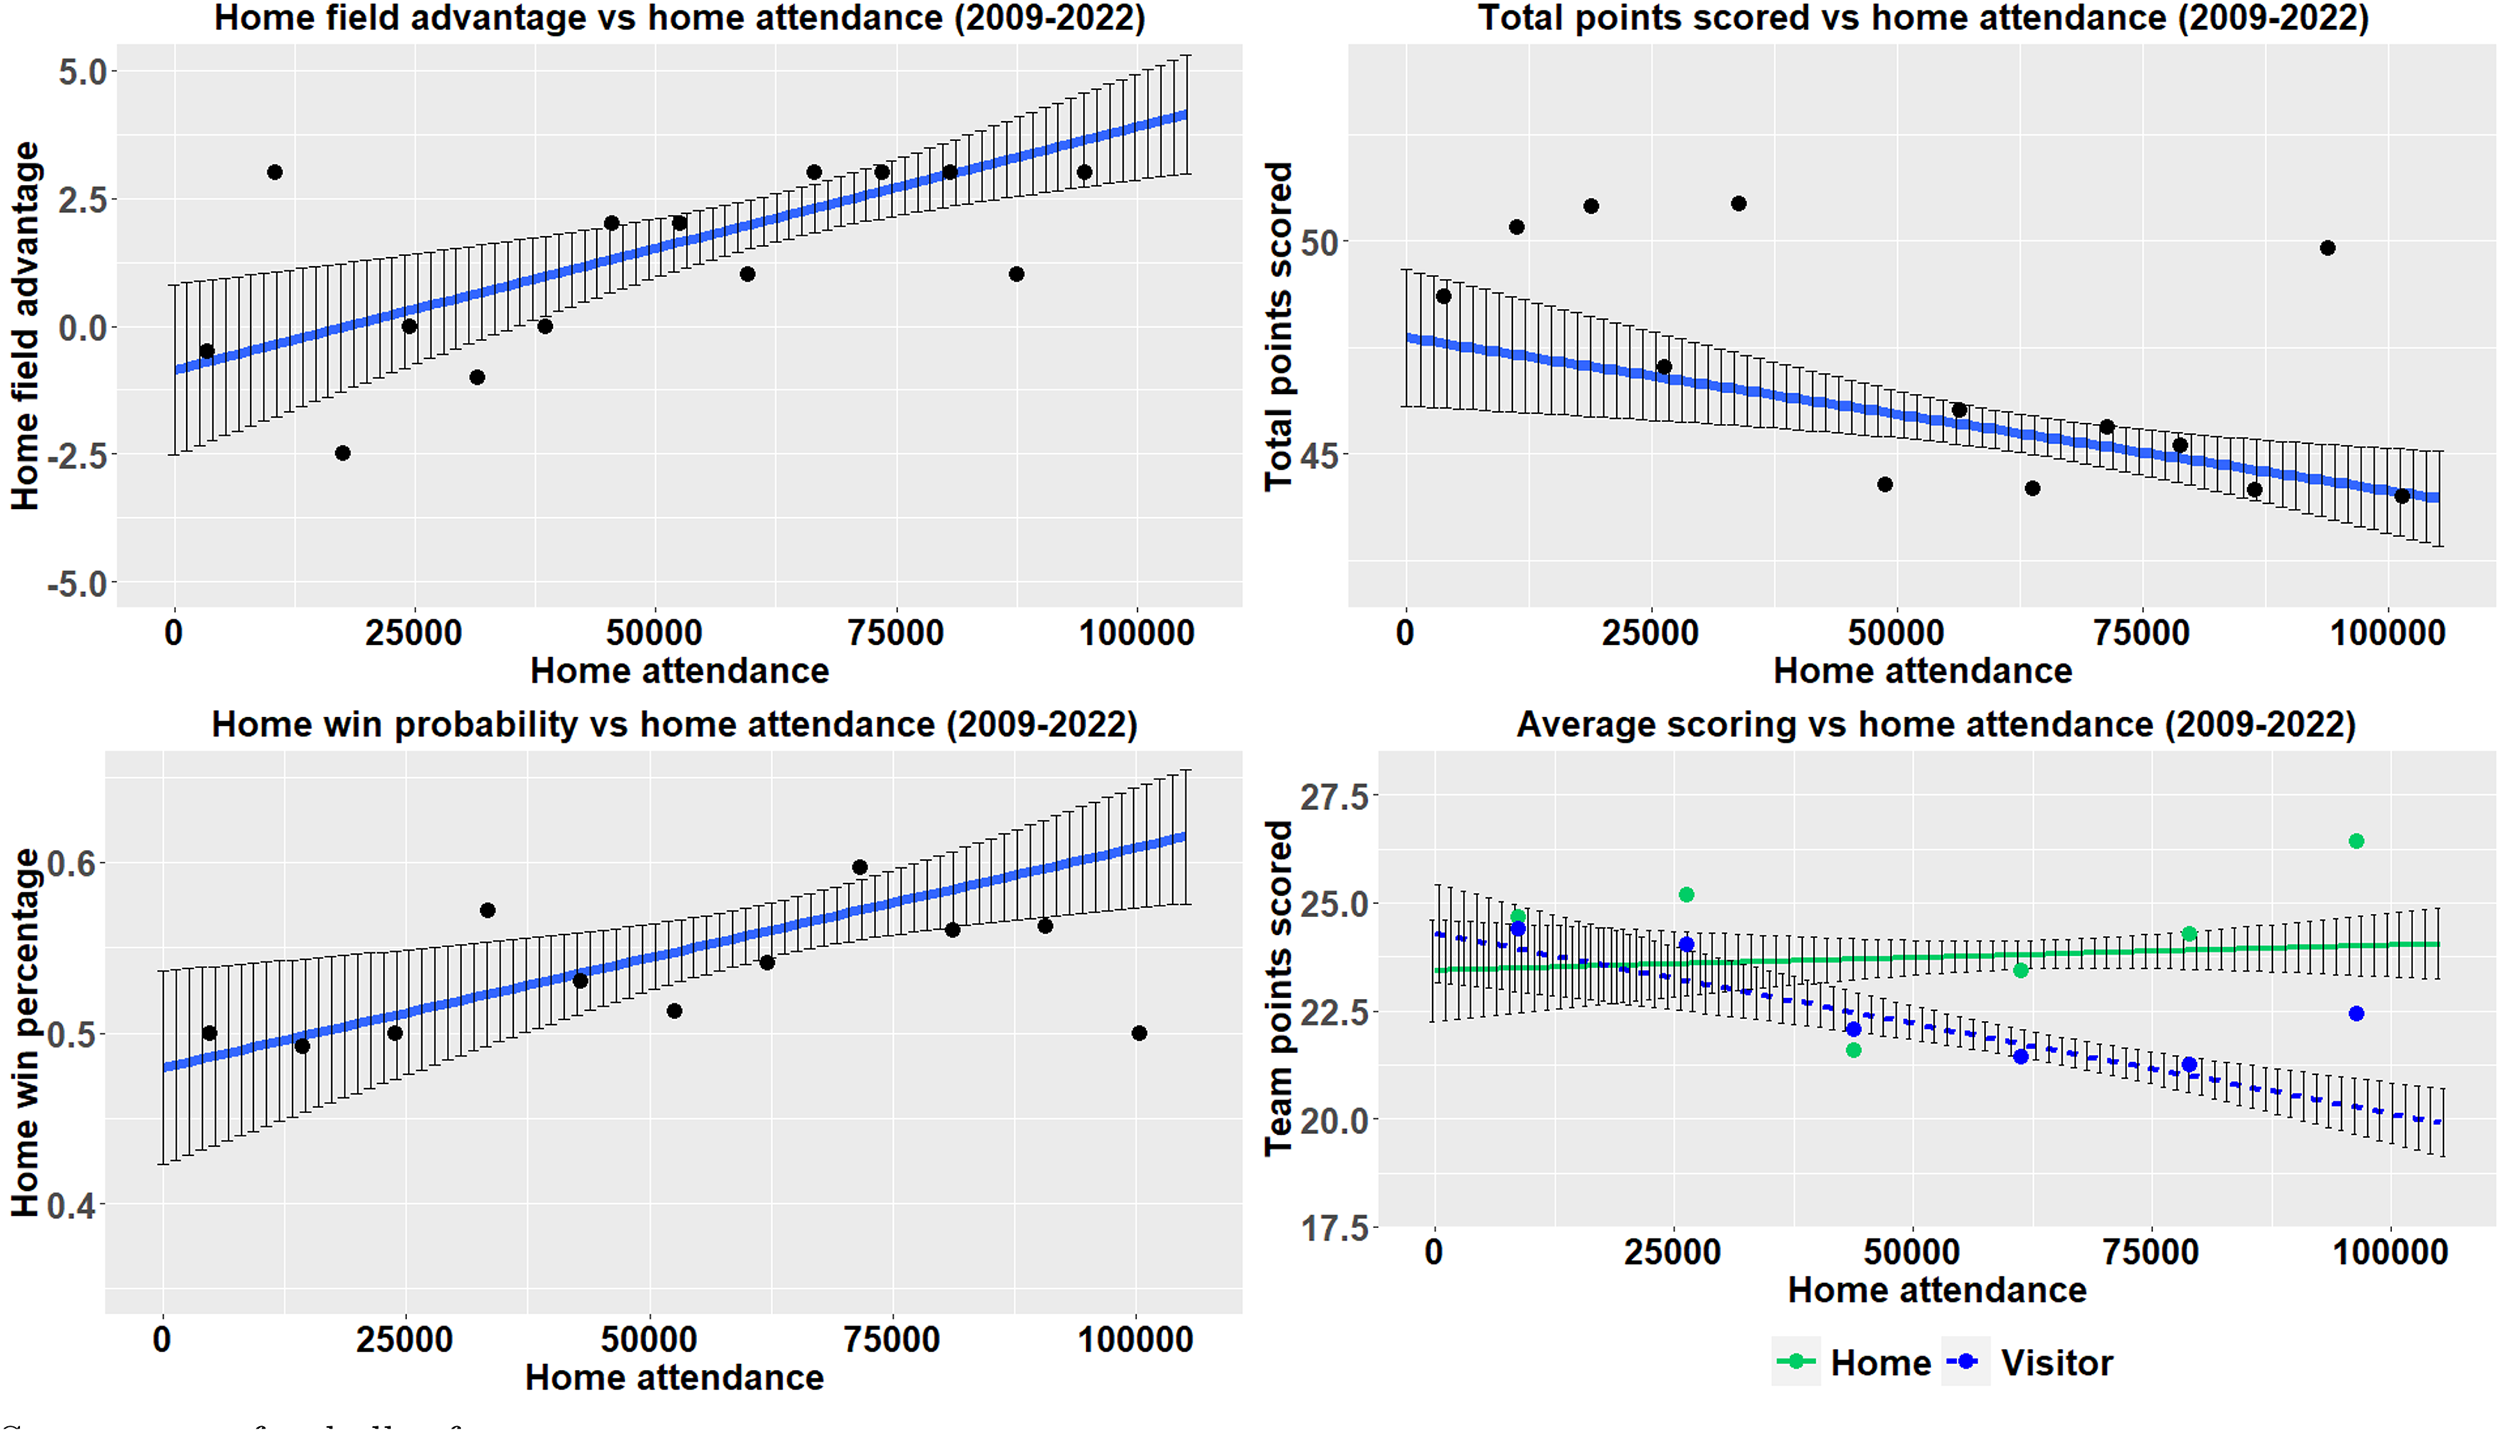
Nonparametric Relationships: Attendance and Game Outcomes (2009–2022). Sources: pro-football-reference.com. Notes: Neutral site games are excluded from the sample. Upper left panel – Home field advantage vs. Home stadium attendance. Upper right panel – Total points scored vs. Home stadium attendance. Lower left panel – Home win percentage vs. Home stadium attendance. Lower right panel – Home and away team scoring vs. Home stadium attendance.
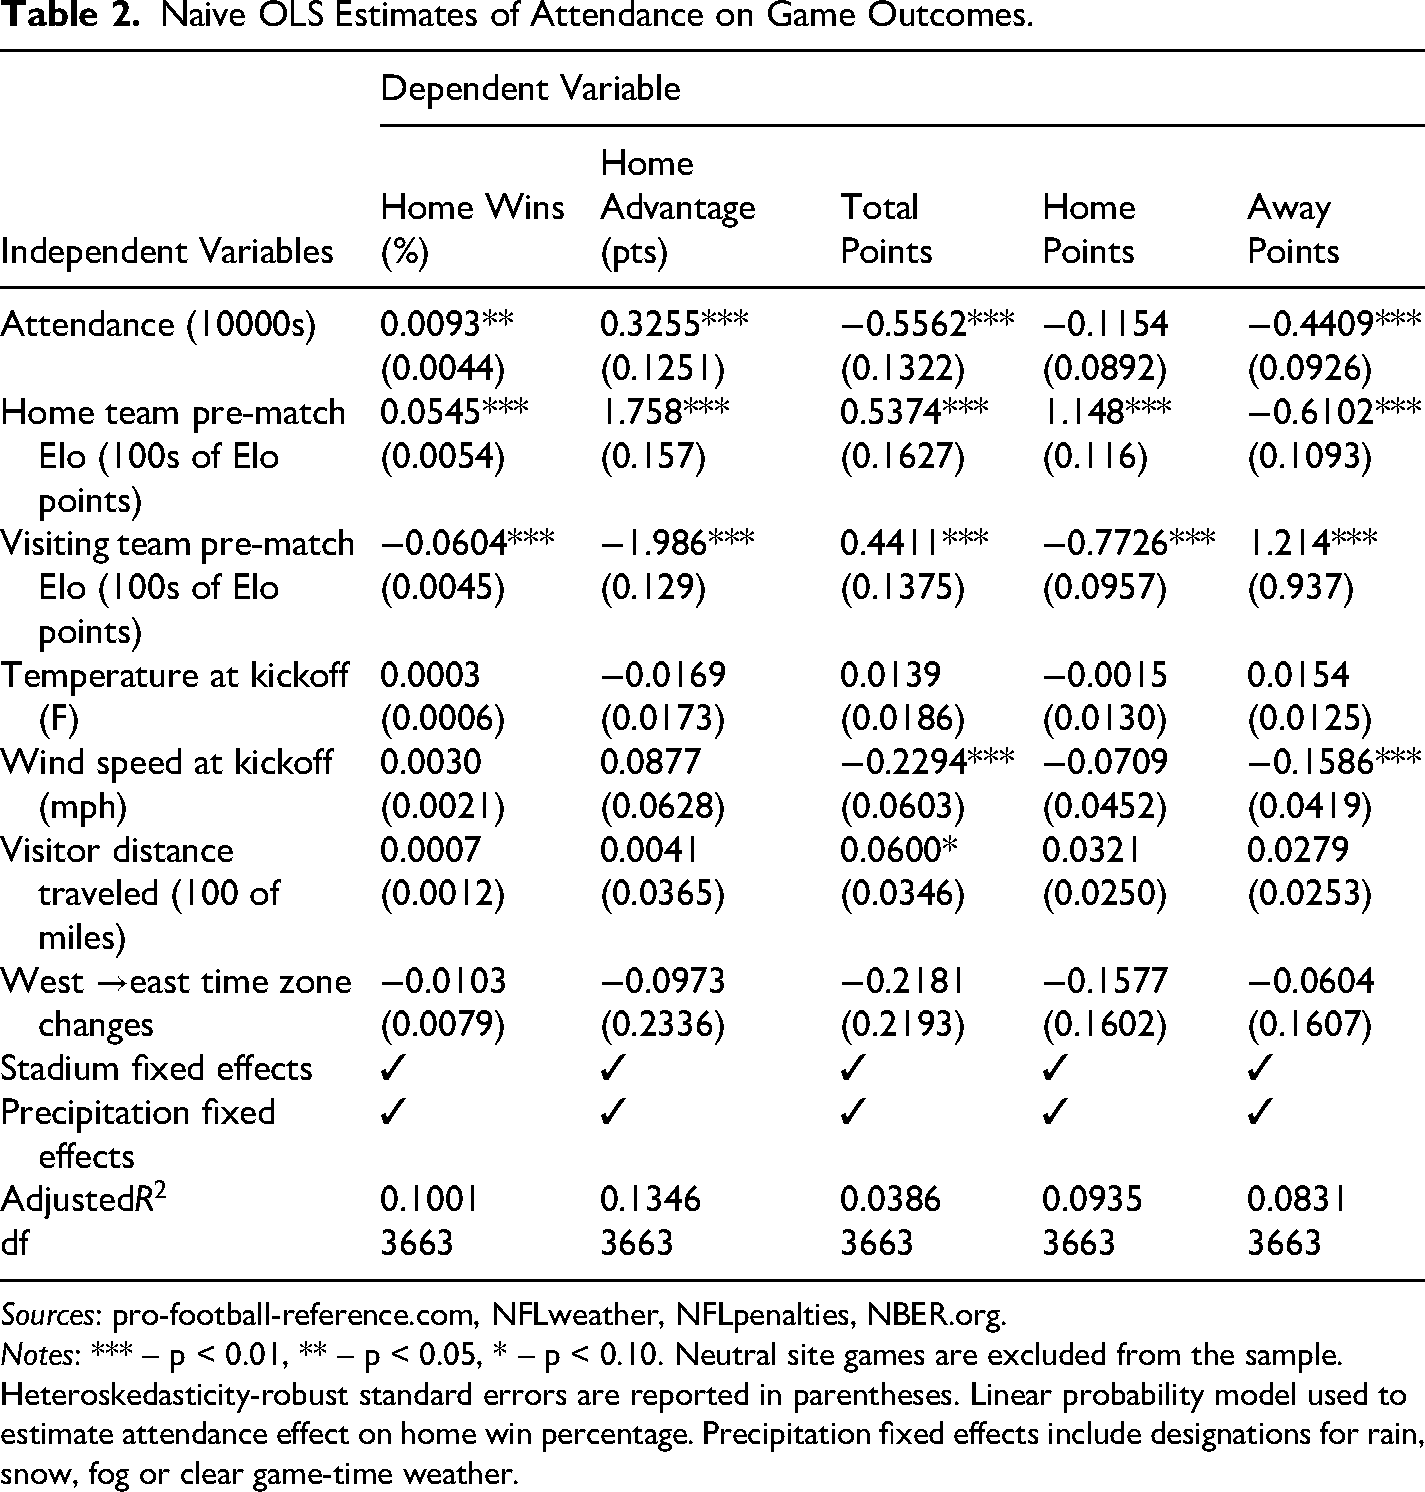
Table 2 contains the estimates from the naive OLS model described in equation (1) which incorporates the various game outcome dependent variables, the exogenous covariates, precipitation and stadium fixed effects, and the independent variable of interest, stadium attendance in 10000s.
Naive OLS Estimates of Attendance on Game Outcomes.
Sources: pro-football-reference.com, NFLweather, NFLpenalties, NBER.org.
Notes: *** – p < 0.01, ** – p < 0.05, * – p < 0.10. Neutral site games are excluded from the sample. Heteroskedasticity-robust standard errors are reported in parentheses. Linear probability model used to estimate attendance effect on home win percentage. Precipitation fixed effects include designations for rain, snow, fog or clear game-time weather.
It is important to reiterate: these results should not be interpreted as causal effects, since demand for stadium attendance and team success are simultaneously determined, which results in simultaneity bias of unknown magnitude and sign.
The results in Table 2 indicate a significant, negative relationship between stadium attendance and total points scored, accounted for by a significant drop in visiting team scoring, while home team scoring remains unaffected. This coincides with a significant association between increasing home stadium attendance, increasing home field advantage, and a rising probability of a home team victory. Pre-match home and visitor Elo ratings affect outcomes in expected ways: more highly-rated home teams are more likely to win, increase the home advantage and total and home points scored while reducing visitor points scored. Analogous results are observed for higher rated visiting teams.
Game outcomes are apparently unaffected by the distance traveled by the visiting team and the number of west to east time zone changes that occur in the travel process, aside from a weakly significant positive effect of visitor travel distance on total points scored.
Neither temperature nor wind speed at kickoff plays any measurable direct role in the likelihood of the home team winning or the magnitude of the home advantage, but higher game-time wind velocity is associated with fewer total points and fewer away team points scored. Curiously, wind has no apparent effect on home team scoring. Among the significant precipitation fixed effects, rain is the most disruptive: rain on game day increases home field advantage by 1.981 points but diminishes total offensive scoring by 2.845 points, with diminished visiting team scoring accounting for 2.413 points of the rain effect. Rain has no measurable effect on home team scoring output. The presence of snow on game day has no effect on scoring, nor home field advantage or home win probability but diminishes total penalties called by 1.967 penalties per snowy game – possibly due to the (understandable) desire by the referee crew to avoid stopping the game clock in the effort end the game in a shorter time frame.
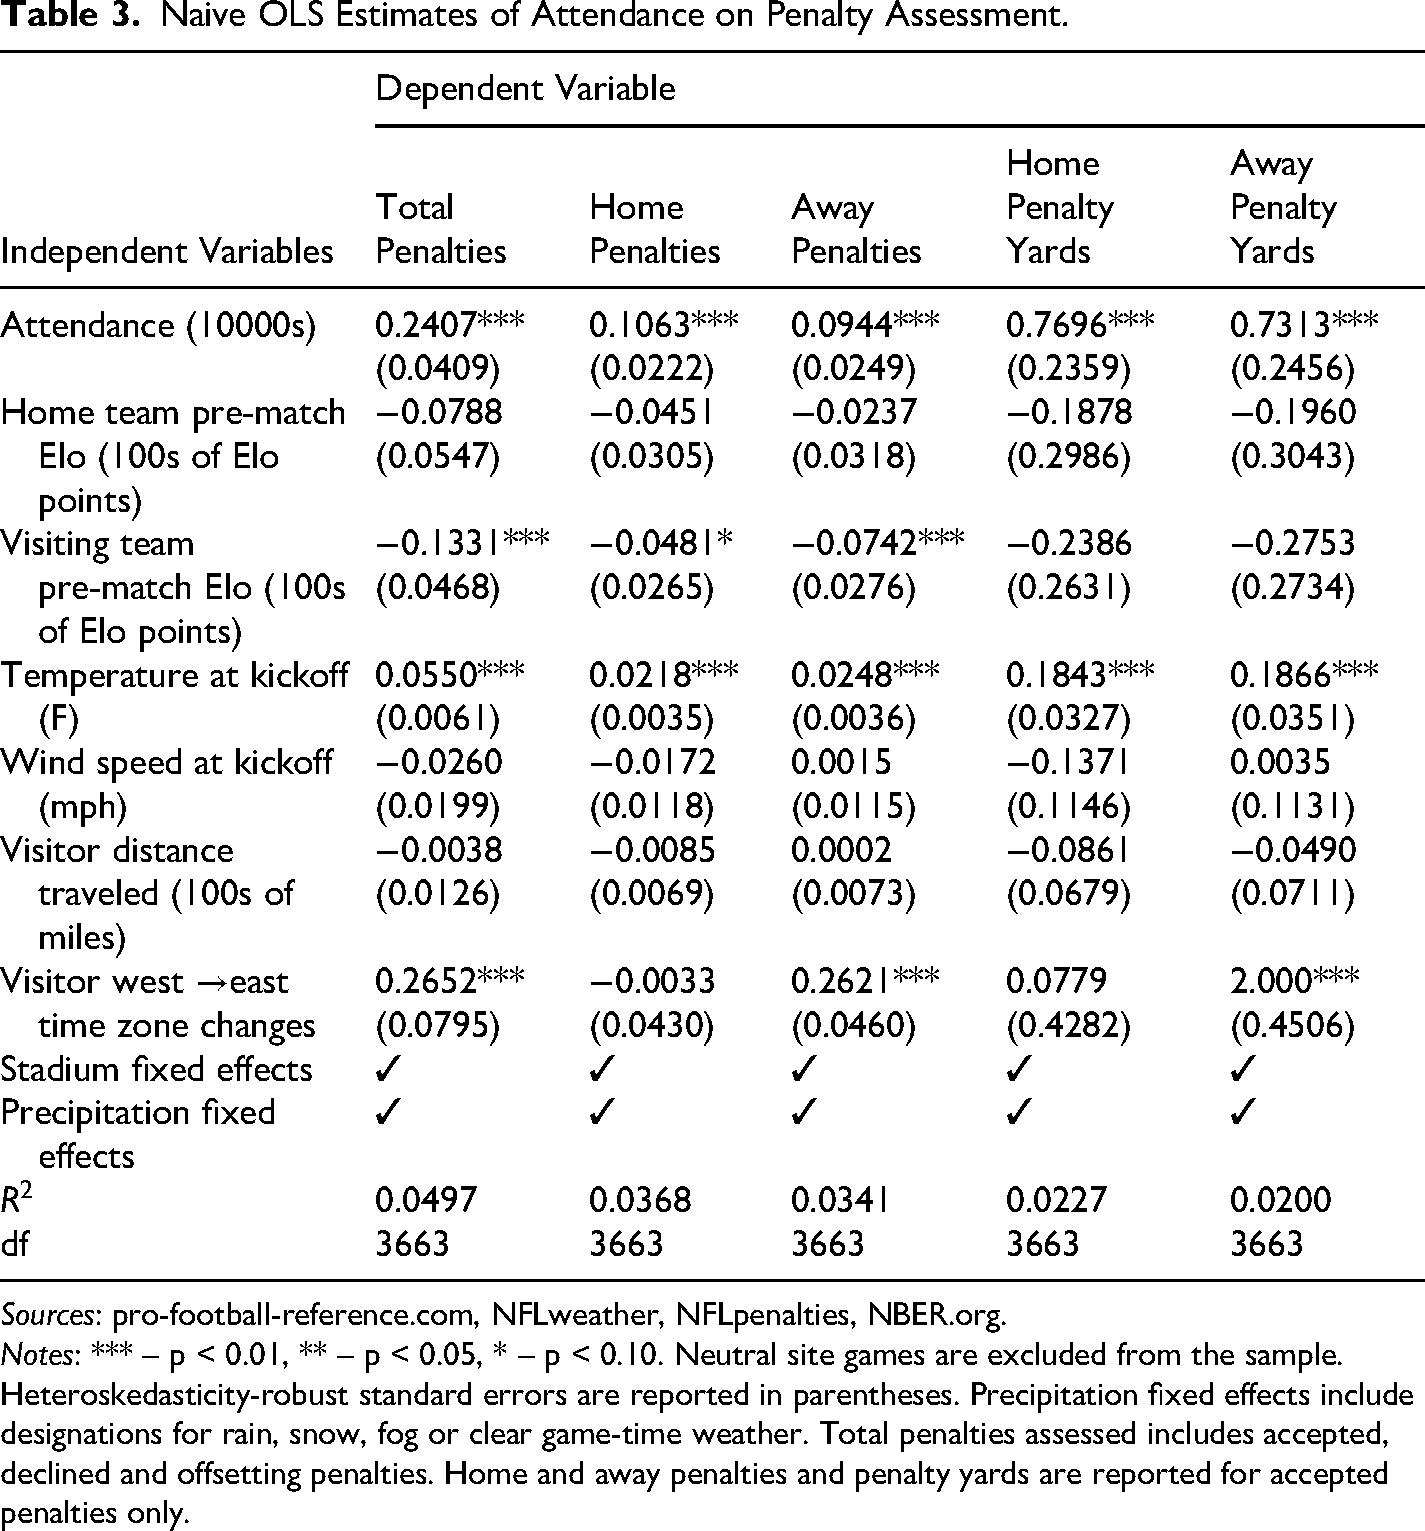
Home crowd influence on referee behavior is a prominent mechanism hypothesized to affect home advantage. To determine if fan attendance is related to NFL referee penalty assessment behavior, the previous naive OLS estimation is repeated, using penalty assessment measures as the dependent variables of interest in Table 3.
Naive OLS Estimates of Attendance on Penalty Assessment.
Sources: pro-football-reference.com, NFLweather, NFLpenalties, NBER.org.
Notes: *** – p < 0.01, ** – p < 0.05, * – p < 0.10. Neutral site games are excluded from the sample. Heteroskedasticity-robust standard errors are reported in parentheses. Precipitation fixed effects include designations for rain, snow, fog or clear game-time weather. Total penalties assessed includes accepted, declined and offsetting penalties. Home and away penalties and penalty yards are reported for accepted penalties only.
The penalty assessment estimates indicate that stadium attendance is positively related to all measures of penalty assessment. The number of time zones crossed by the visitor during travel is also positively related to total penalties, and specifically infractions committed by the visiting team. Home team Elo rating has no effect on penalties, but higher visiting team Elo rating is associated with fewer total penalties assessed, but also fewer home and away team penalties accepted.
Interestingly, game time temperature is strongly positively related to penalty assessment. If penalty infractions may be thought of as a form of rule-breaking behavior, this result corroborates the findings of the temperature and crime literature, which persistently reports a positive relationship between ambient temperature and crime rates (Cohen & Gonzalez, 2024; Heilmann, Kahn, & Tang, 2021).
Despite unavoidable endogeneity bias, the naive OLS results suggest there may be a relationship between stadium attendance, game outcomes and referee penalty infractions. To consistently estimate the causal effects of this relationship, however, requires a more detailed IV analysis.
Instrumental Variables Estimates: Game Outcomes and Penalty Assessment
Using the heterogeneously-applied COVID-19 attendance restrictions during the 2020 NFL season as an instrumental variable, it is possible to estimate the causal effect of stadium attendance on game outcomes and referee behavior. I implement a two-stage IV model with a first stage defined as in equation (2) and a second stage regression model as in equation (3). Should the relevance and exclusion restrictions hold for the excluded COVID instrument, the parameter estimate
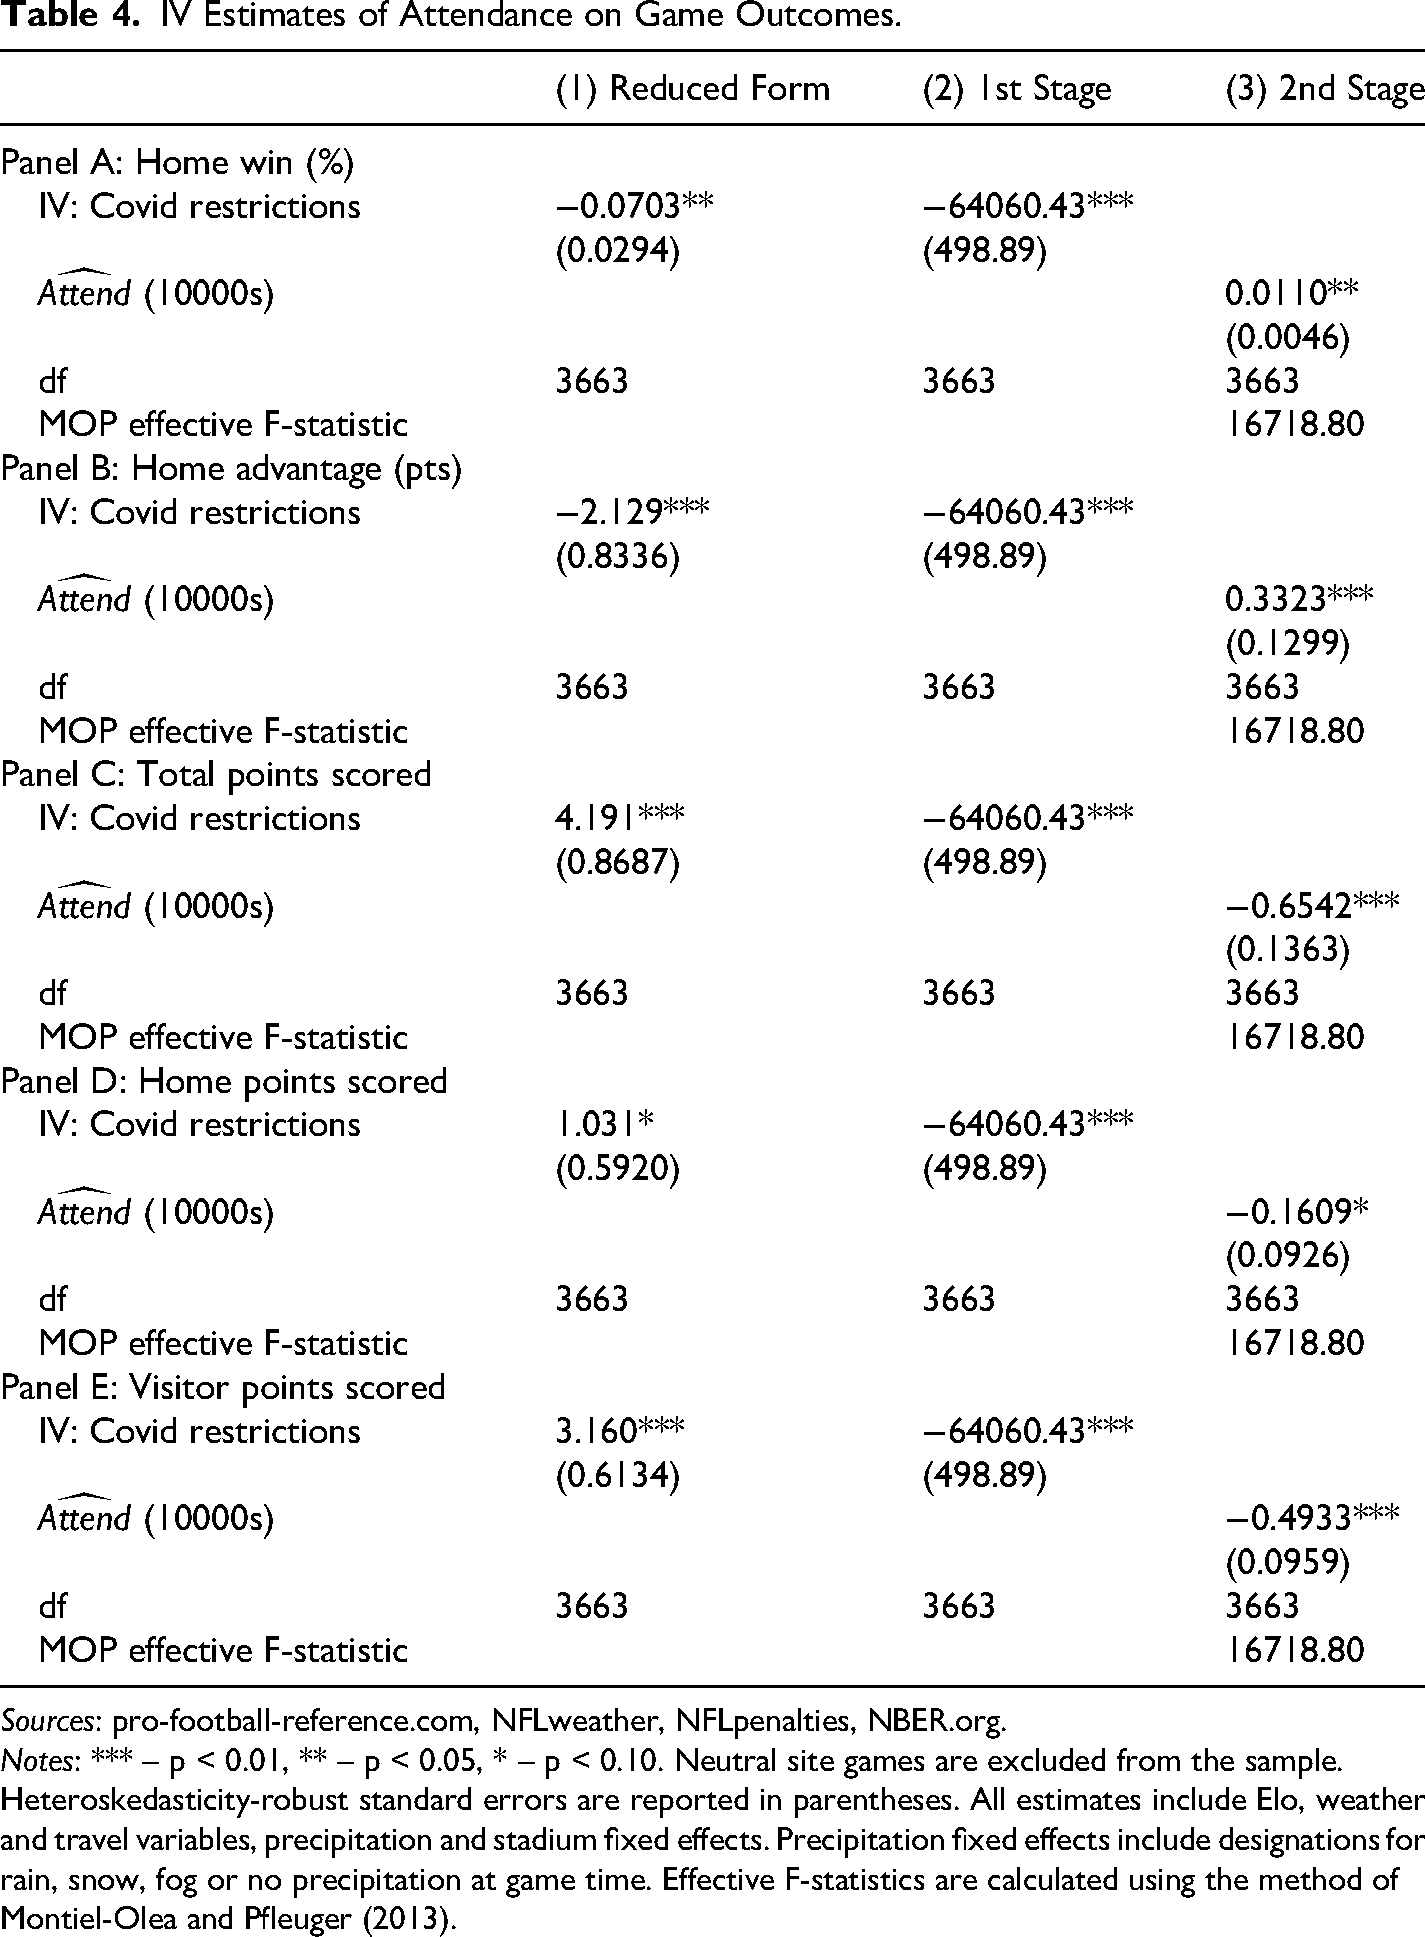
In the two stage IV estimation framework, the reduced form results represent a important corroborating piece of evidence. The reduced form estimates are unbiased OLS estimates, proportional in magnitude to the second-stage IV estimates and should achieve comparable significance levels as the two-stage results, contingent upon how strongly the IV satisfies the relevance criterion (Angrist & Krueger, 2001). The reduced form estimates of the effects of the excluded instrument on the dependent variables are reported in column (1) of Table 4. Both the first and second stage estimations include pre-game Elo ratings, visiting team travel, wind speed and temperature variables, along with stadium and precipation fixed effects as exogenous covariates. In Table 4, Column (2) reports the first stage estimate of the excluded instrument on attendance, and column (3) reports the second stage estimates of the effect of stadium attendance on game outcomes. The table is separated into 5 panels, labeled “A” through “E”, with one panel for each dependent variable of interest. The dependent variables examined in each panel are home winning percentage, home advantage in points, total points scored, home team points scored and visiting team points scored, respectively. Olea and Pflueger (2013) “effective” first stage F-statistics are reported beneath the second stage regressions in column (3).
IV Estimates of Attendance on Game Outcomes.
Sources: pro-football-reference.com, NFLweather, NFLpenalties, NBER.org.
Notes: *** – p < 0.01, ** – p < 0.05, * – p < 0.10. Neutral site games are excluded from the sample. Heteroskedasticity-robust standard errors are reported in parentheses. All estimates include Elo, weather and travel variables, precipitation and stadium fixed effects. Precipitation fixed effects include designations for rain, snow, fog or no precipitation at game time. Effective F-statistics are calculated using the method of Montiel-Olea and Pfleuger (2013).
The MOP first stage F-statistics for the IV estimates in Table 4 indicate the “COVID attendance restriction” instrument strongly satisfies the instrumental relevance criterion required for a valid IV estimation, and the relationships observed in the naive OLS results remain significant in the IV analysis. The IV estimates maintain the same signs but are all of larger magnitude than their corresponding naive OLS estimates. The stadium attendance effect on home winning percentage, home field advantage, total points scored and visiting team points scored are significant at the 5% level. 6
The implications of the IV estimates are pertinent for any NFL franchise seeking to improve their chances of victory: for every 10000 fans who attend an NFL game, the probability of a home team victory rises by 1.10% and the home field advantage grows by 0.3323 points. When evaluated at the average NFL stadium attendance, 63407 fans, home attendance accounts for 2.11 points (or 97%) of the mean 2.17 point home field advantage observed in the full sample.
The total number of points scored falls by 0.6542 per 10000 fans, but the reduction in aggregate scoring is not shared between home and away teams– instead it is the visiting team who suffers more, scoring 0.4933 fewer points per 10000 fans. The effect on the home team is smaller, by comparison, shrinking home team scoring by 0.1609 points per every additional 10000 fans. 7
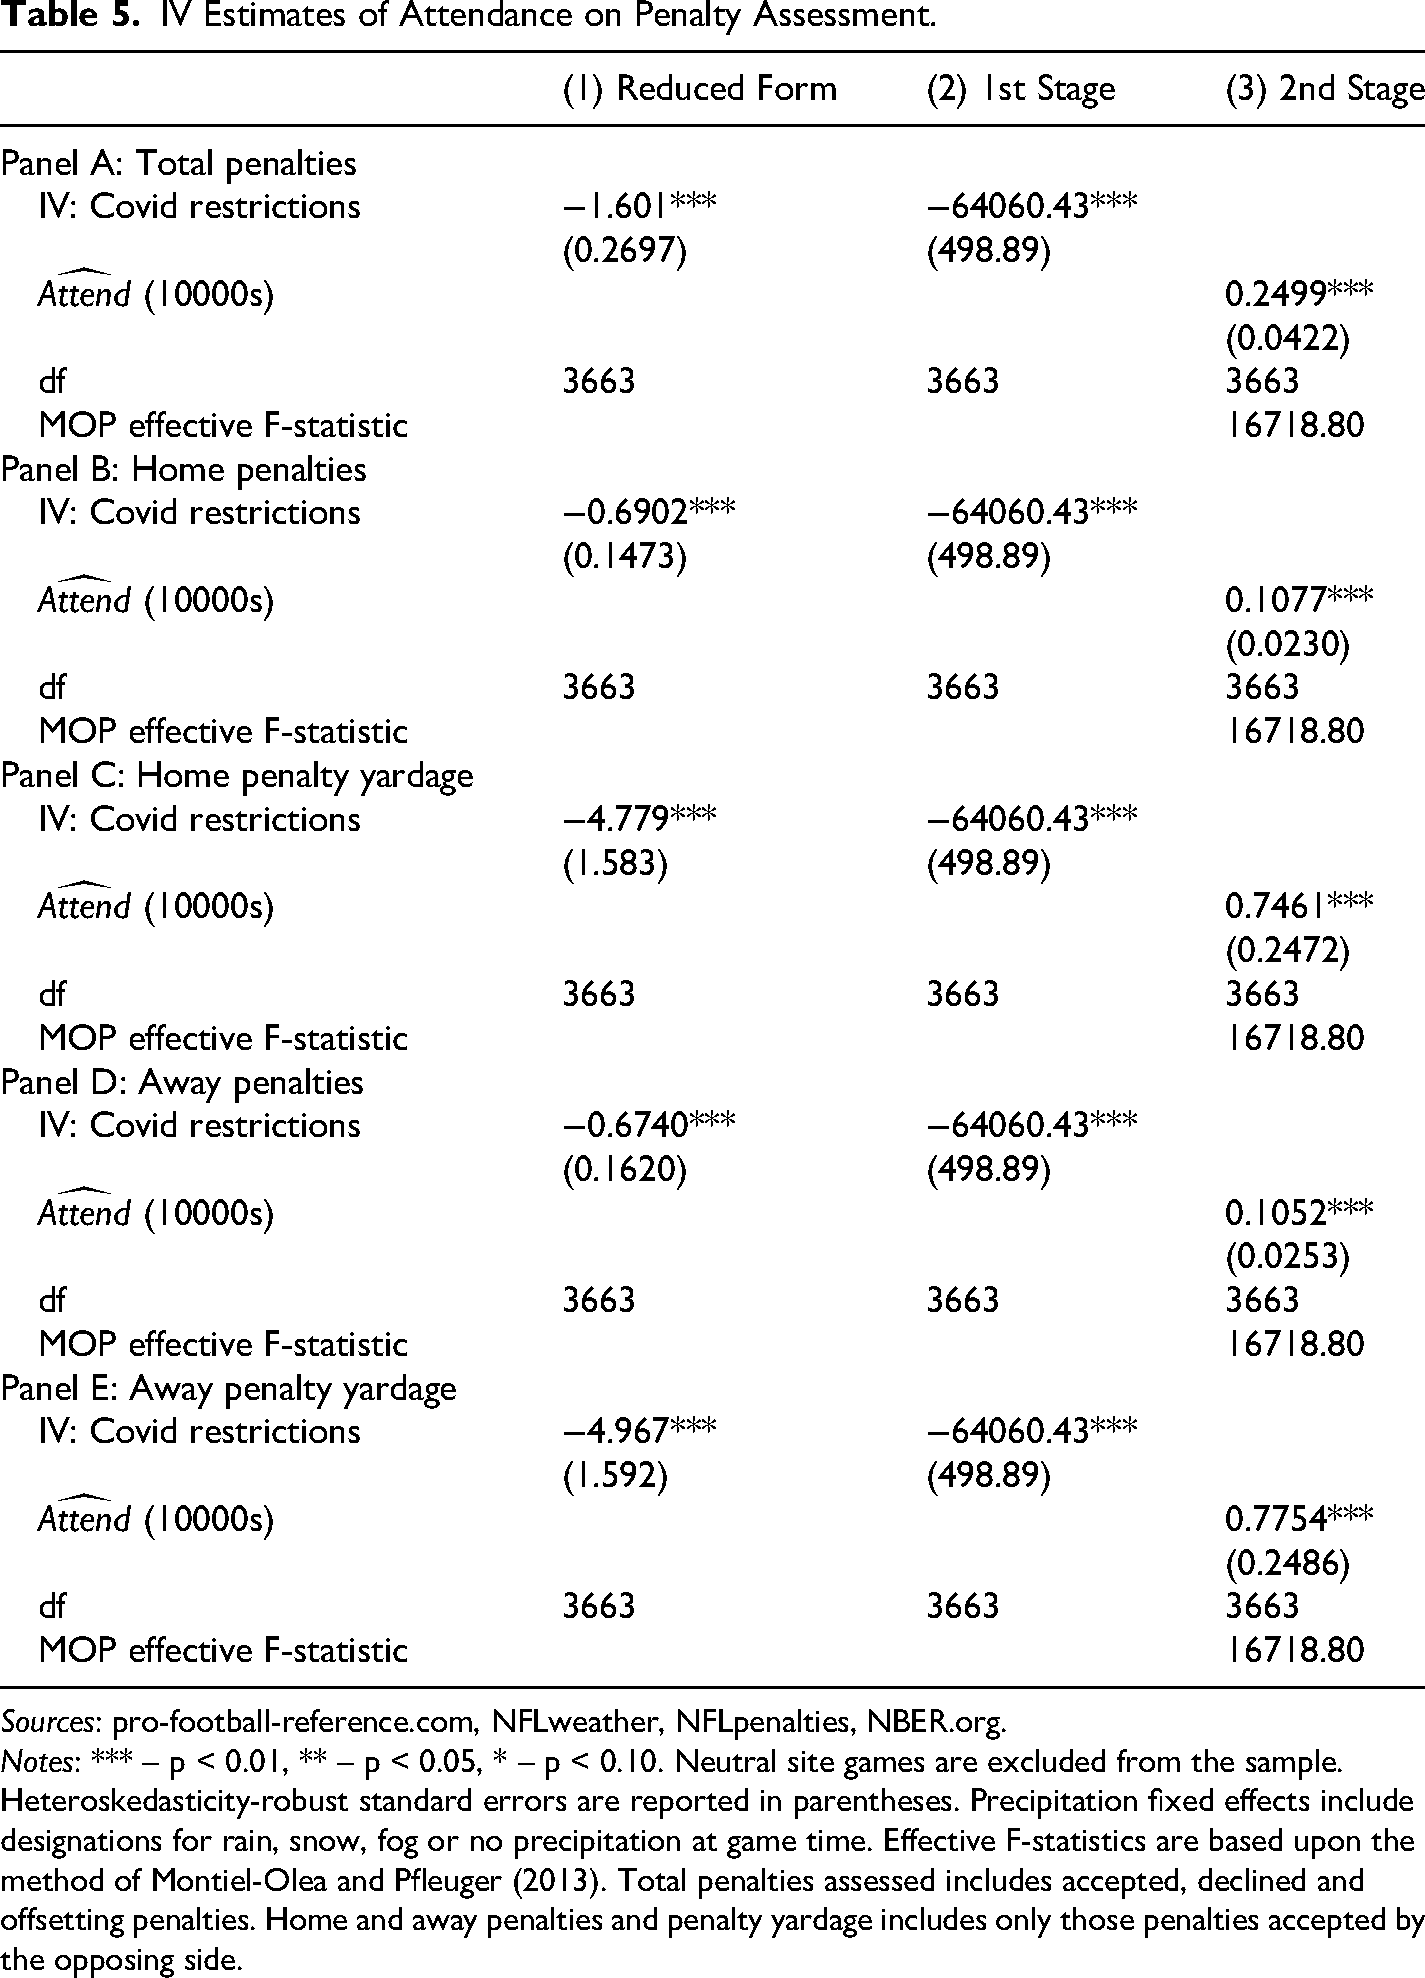
Table 5 reports the results of the IV estimation on referee penalty assessment behavior, arranged as in Table 4. The dependent variables examined in Panels A-E are now total penalties called, home team penalties accepted (by the visiting team), total home team penalty yardage, away team penalties accepted (by the home team) and away team penalty yardage, respectively.
IV Estimates of Attendance on Penalty Assessment.
Sources: pro-football-reference.com, NFLweather, NFLpenalties, NBER.org.
Notes: *** – p < 0.01, ** – p < 0.05, * – p < 0.10. Neutral site games are excluded from the sample. Heteroskedasticity-robust standard errors are reported in parentheses. Precipitation fixed effects include designations for rain, snow, fog or no precipitation at game time. Effective F-statistics are based upon the method of Montiel-Olea and Pfleuger (2013). Total penalties assessed includes accepted, declined and offsetting penalties. Home and away penalties and penalty yardage includes only those penalties accepted by the opposing side.
For every additional 10000 fans in attendance, the total number of penalties rises by 0.2499 total penalties per game. This increase in total penalties is shared equally between the home and visiting teams, however, with home teams receiving 0.1077 extra accepted penalties and visitors an extra 0.1052 extra accepted penalties per 10000 fans in attendance. The effect of attendance on penalty yardage is also comparable, with home teams receiving 0.7461 extra penalty yards and visitors receiving 0.7754 extra yards per 10000 fans in attendance.
The results of the IV estimation on penalty assessment behavior provides some insight into the origin of the NFL home field advantage. As stadium attendance increases, both home and visiting teams are assessed increasingly more penalties and penalty yards, but these increases are shared virtually equally, suggesting NFL referees are, on the average, remarkably unbiased in their approach to officiating. As noted in the summary statistics, NFL home advantage does indeed exist, however – home teams enjoyed a 2.17 point mean home field advantage over the 2009-2022 time period. If referee bias is not the origin of this persistent advantage, there should exist evidence of other responsible mechanisms.
While game-time wind speed diminishes visitor scoring and remains one viable explanation of the home field advantage, the effects of wind speed can be eliminated by examining the stadium attendance effect in subsamples. To examine the effect of stadium attendance on NFL home field advantage in the absence of wind, I repeat the previous IV analysis after stratifying by stadium type: outdoor games played in the elements, and indoor games conducted under ideal weather conditions.
IV Results, Stratifying by Stadium Type
National Football League games are played in a wide variety of playing conditions, dictated by local weather patterns, the time of the year and the type of stadium in which the match is conducted. In this section, I re-estimate the IV results presented in Section 5.2, after stratifying by stadium type.
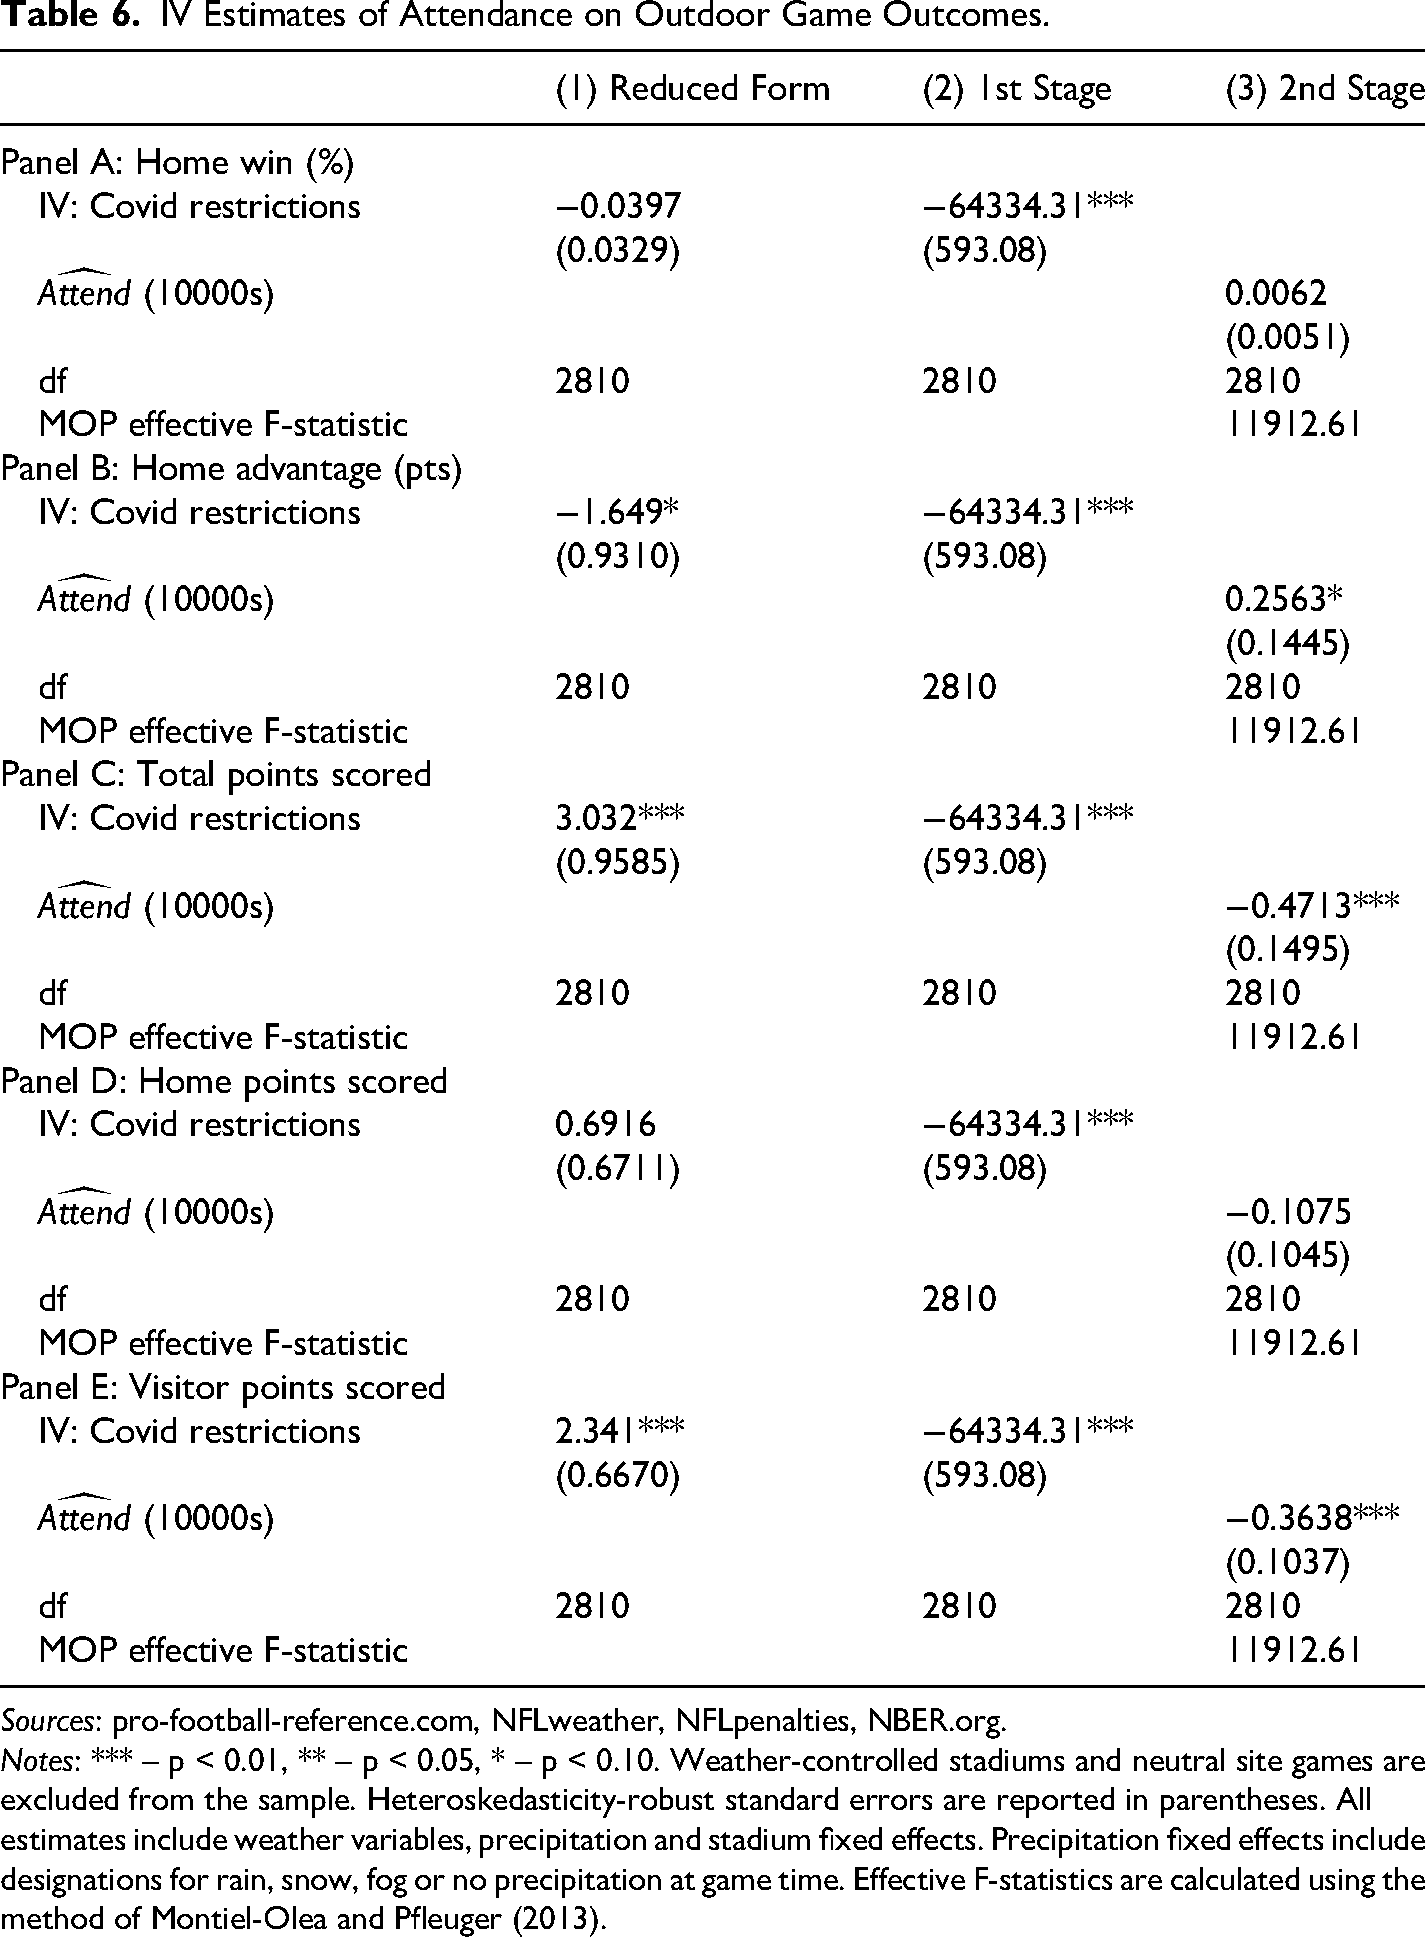
While match environment data are separated into indoor and outdoor categories, there are actually 3 types of NFL stadiums: outdoor stadiums, which are subject to variable weather conditions, dedicated indoor stadiums, which are protected from the weather and maintain a constant 72 degrees Fahrenheit with zero wind, and “retractable dome stadiums”, stadiums in which the roof can be opened to the elements or closed (and weather-controlled) at the home team’s volition. For the purposes of this analysis, “outdoor” games are those played in dedicated outdoor stadiums and games played in stadiums with open retractable roofs. These “outdoor” observations are combined to form a subsample of games played under ambient weather conditions. Games played in fixed-roof “domed” stadiums and closed retractable roof stadiums form an “indoor” subsample of games played under ideal weather conditions. Between 2009 and 2022, 2720 NFL games were played outdoors, 485 games took place in fixed roof “domed” stadiums and 509 took place in a stadium with a retractable roof. Of the 509 games played in retractable roof stadiums over this time period, 133 took place with the roof open to the weather. 8 Table 6 reports the IV effects of home attendance on outdoor game outcomes.
IV Estimates of Attendance on Outdoor Game Outcomes.
Sources: pro-football-reference.com, NFLweather, NFLpenalties, NBER.org.
Notes: *** – p < 0.01, ** – p < 0.05, * – p < 0.10. Weather-controlled stadiums and neutral site games are excluded from the sample. Heteroskedasticity-robust standard errors are reported in parentheses. All estimates include weather variables, precipitation and stadium fixed effects. Precipitation fixed effects include designations for rain, snow, fog or no precipitation at game time. Effective F-statistics are calculated using the method of Montiel-Olea and Pfleuger (2013).
The effect of attendance on game outcomes changes drastically under stratification. When compared to the full sample results, rising attendance in outdoor games no longer has any measurable effect on the probability of the home team winning, nor on home team points scored and the effects on home field point advantage, total points scored and visiting team points scored are all diminished compared to the full sample estimates. For every additional 10000 fans in attendance, home field advantage rises but only by 0.2563 points (versus 0.3323 in the full sample), total points falls by 0.4713 points (versus 0.6542) and away team scoring is suppressed by 0.3638 points (versus 0.4933). In outdoor games, where average attendance is 63026, home stadium attendance accounts for 1.62 points of the 2.17 points (or 75%) of average home field advantage in the full sample– a much smaller effect.
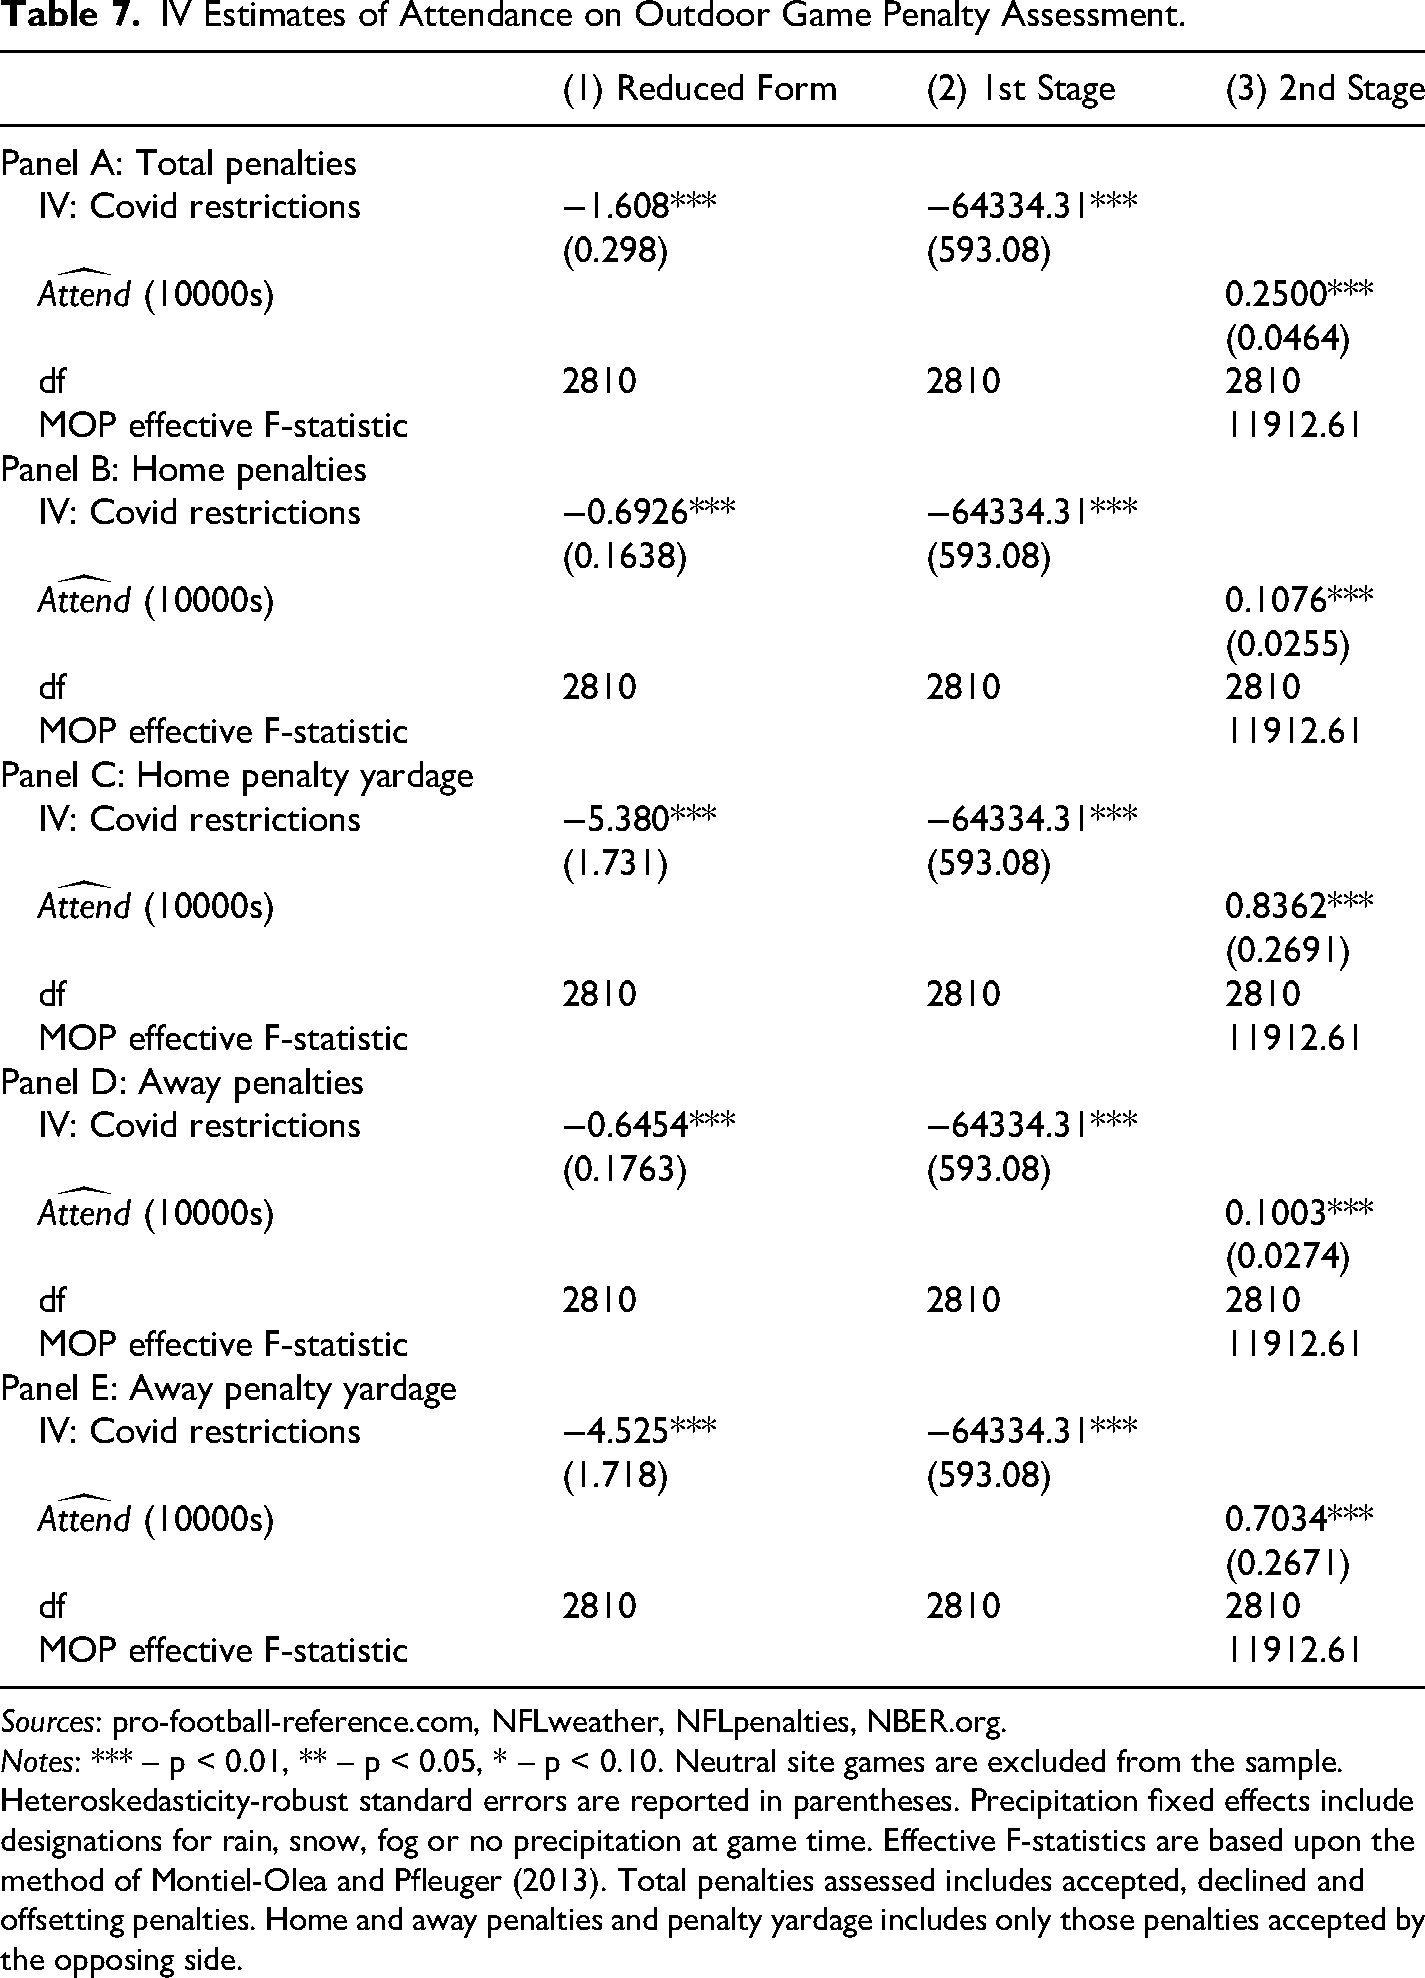
Penalty assessment results are presented in Table 7.
IV Estimates of Attendance on Outdoor Game Penalty Assessment.
Sources: pro-football-reference.com, NFLweather, NFLpenalties, NBER.org.
Notes: *** – p < 0.01, ** – p < 0.05, * – p < 0.10. Neutral site games are excluded from the sample. Heteroskedasticity-robust standard errors are reported in parentheses. Precipitation fixed effects include designations for rain, snow, fog or no precipitation at game time. Effective F-statistics are based upon the method of Montiel-Olea and Pfleuger (2013). Total penalties assessed includes accepted, declined and offsetting penalties. Home and away penalties and penalty yardage includes only those penalties accepted by the opposing side.
Referee penalty assessment in outdoor games is similar to that for the full sample: When stadium attendance rises by 10000 fans, referees call on average 0.25 more total penalties (versus 0.2499), and once again the accepted penalties are shared approximately equally between the home and the visitor sides. The estimated effects of attendance on penalty yardage assessed changes slightly, with home teams receiving 0.8362 extra penalty yards and visitors receiving 0.7034 extra yards per 10000 fans.
The IV estimates for matches contested in ideal weather conditions (indoors, at a temperature of 72F and zero wind) are presented in Table 8.
IV Estimates of Attendance on Indoor Game Outcomes.
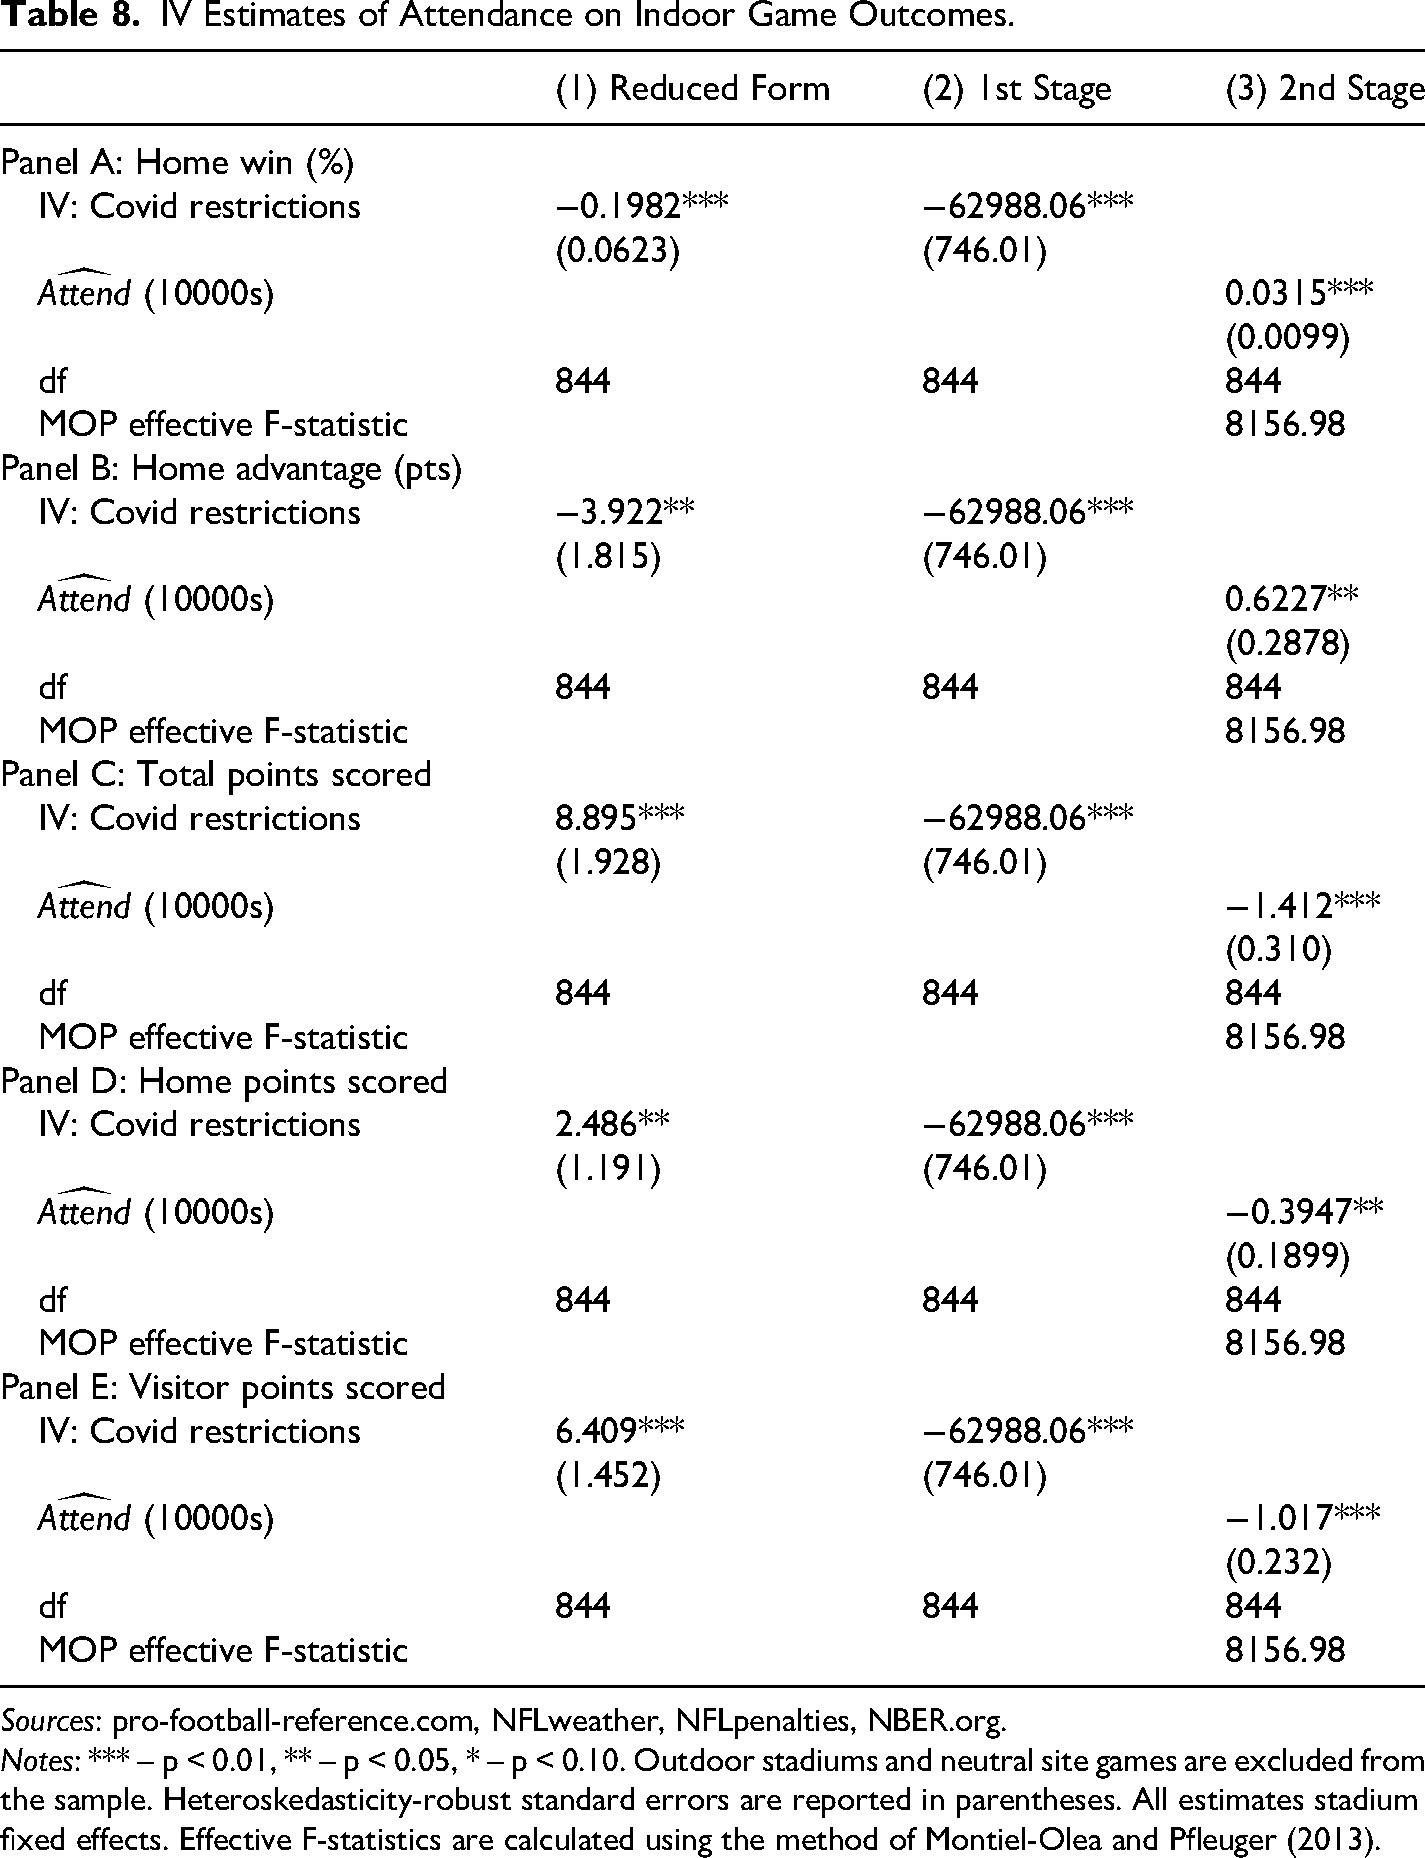
Sources: pro-football-reference.com, NFLweather, NFLpenalties, NBER.org.
Notes: *** – p < 0.01, ** – p < 0.05, * – p < 0.10. Outdoor stadiums and neutral site games are excluded from the sample. Heteroskedasticity-robust standard errors are reported in parentheses. All estimates stadium fixed effects. Effective F-statistics are calculated using the method of Montiel-Olea and Pfleuger (2013).
Upon excluding those games contested in ambient weather conditions, a very different set of results arises. Consistent with Schwartz and Barsky (1977), playing indoors is associated with a larger home field advantage– a much larger advantage. For every 10000 fans in attendance at an indoor game, the probability of a home team win rises by 3.15% and home advantage rises by 0.6227 points– almost double the effect found using the full sample and 243% larger than the attendance effect on home advantage at outdoor games. Evaluated at the mean indoor attendance, 64678 fans, the average home field advantage rises to 4.03 points, or 186% of the average home field advantage observed in the full data sample.
Total points scored falls by 1.412 points, and this decrease is accounted for by a 0.3947 point decrease in home team scoring, but a 1.017 point decrease in away team scoring per 10000 in attendance, suggesting that greater indoor crowd size negatively affects both teams’ scoring output compared to the full sample and outdoor sample results, but affects the visiting side to a much greater degree.
Indoor game penalty assessment results are presented in Table 9.
IV Estimates of Attendance on Indoor Game Penalty Assessment.
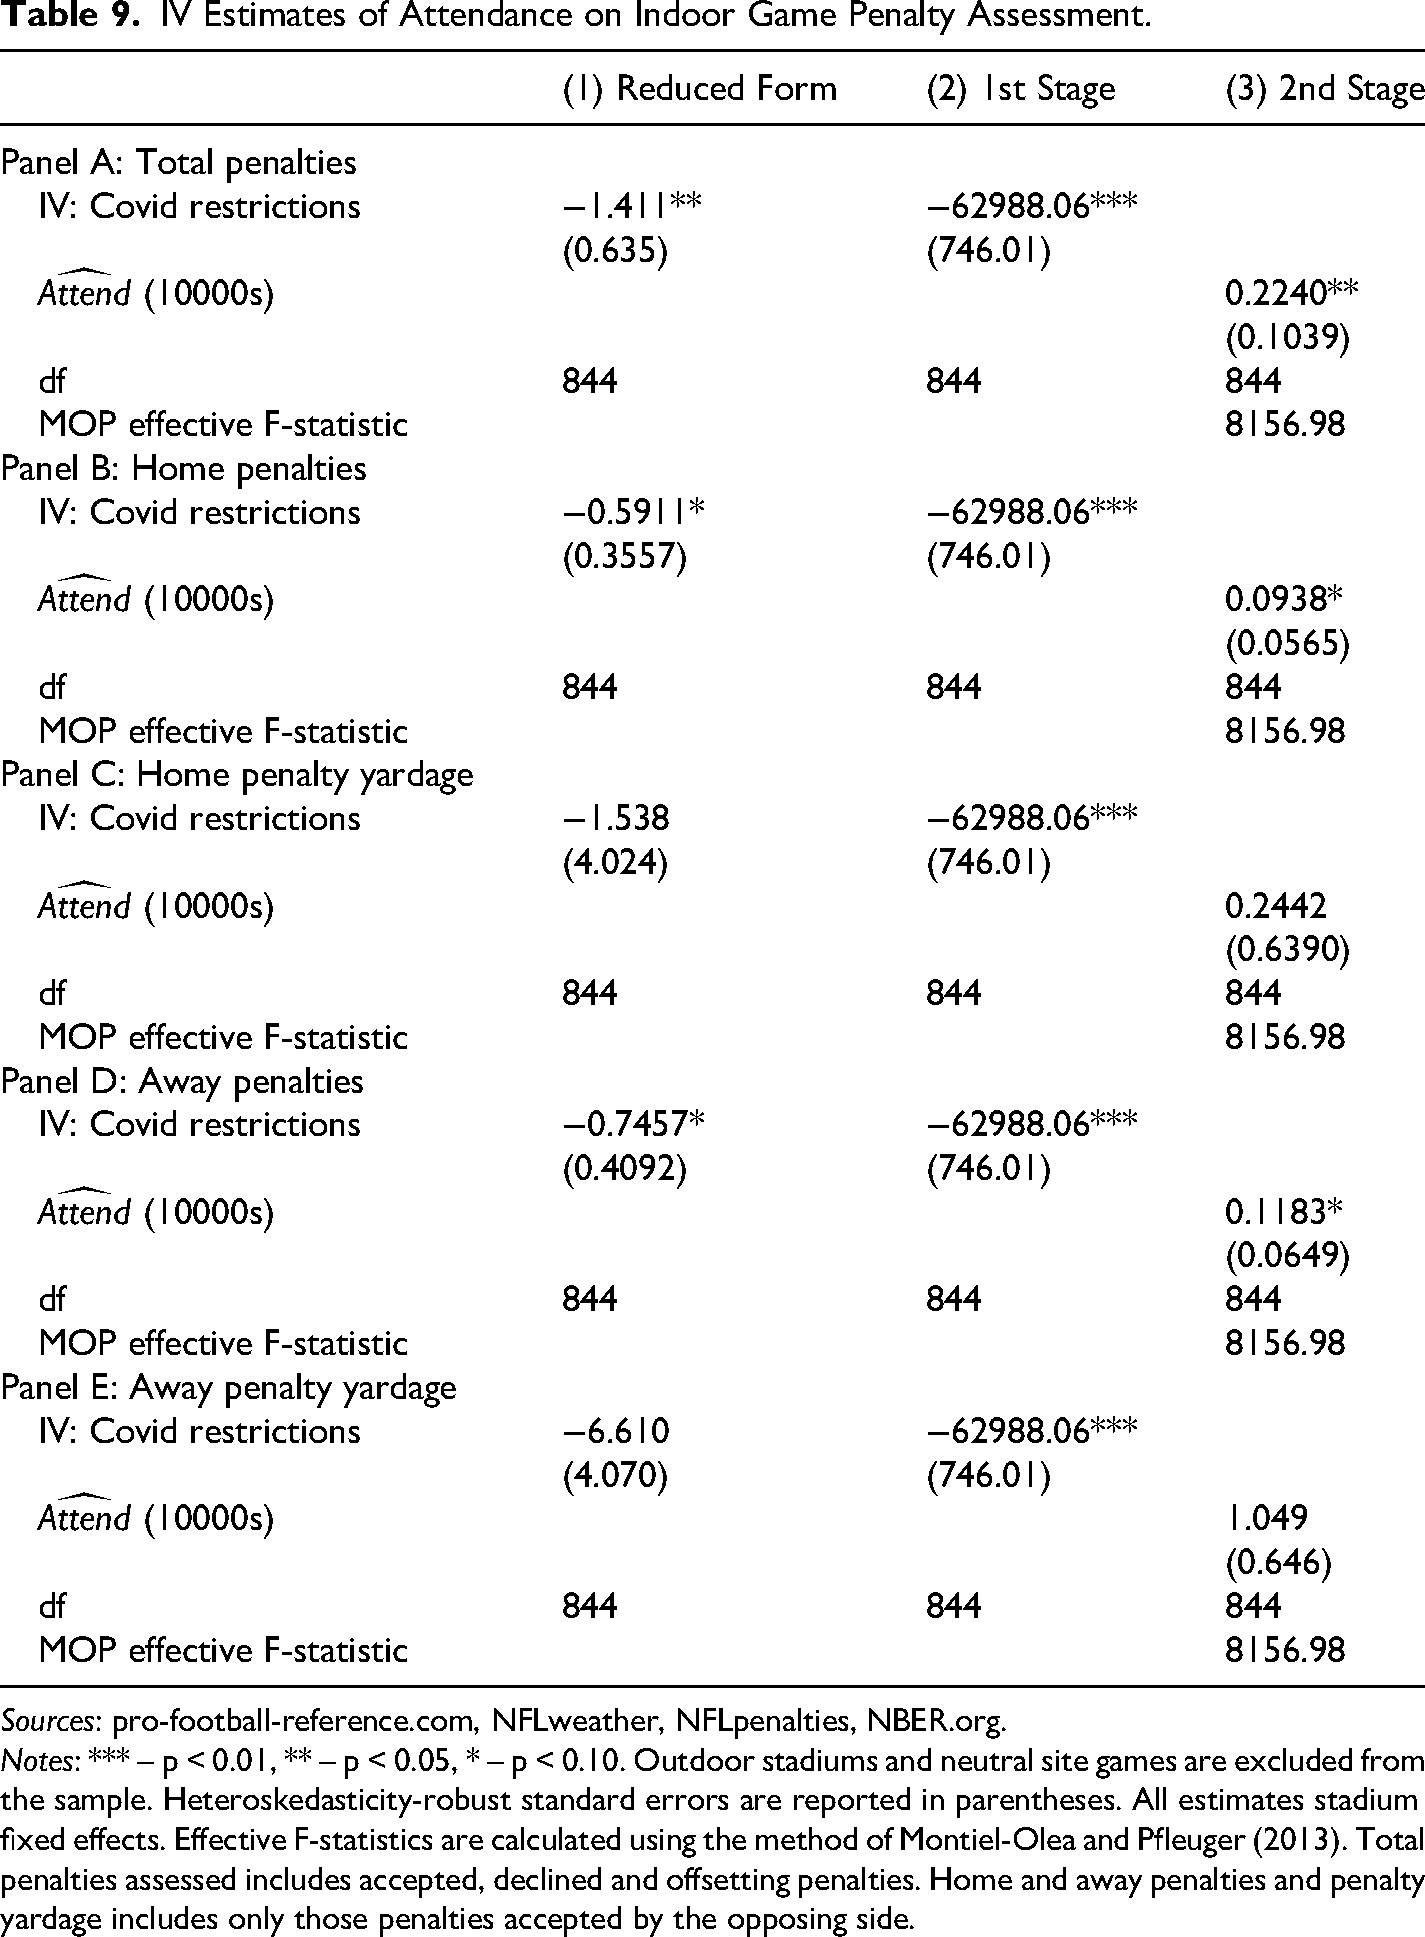
Sources: pro-football-reference.com, NFLweather, NFLpenalties, NBER.org.
Notes: *** – p < 0.01, ** – p < 0.05, * – p < 0.10. Outdoor stadiums and neutral site games are excluded from the sample. Heteroskedasticity-robust standard errors are reported in parentheses. All estimates stadium fixed effects. Effective F-statistics are calculated using the method of Montiel-Olea and Pfleuger (2013). Total penalties assessed includes accepted, declined and offsetting penalties. Home and away penalties and penalty yardage includes only those penalties accepted by the opposing side.
The effect of crowd size on penalty assessment by NFL referees is similar between games played under indoor and outdoor playing conditions, and is also comparable to those found using the full data sample. Under indoor conditions, NFL referees call 0.2240 extra penalties per 10000 fans, and these penalties are again shared roughly equally between the home (0.0938 extra accepted penalties) and visiting sides (0.1183 extra accepted penalties). There is no observable effect of crowd size on home and away penalty yardage, however, but the insignificance of these results may simply be a consequence of reduced sample size in the indoor stratified analysis.
Upon controlling for stadium type, and thus eliminating game-time wind conditions, a large disparity arises in the effects of home stadium attendance on the home field advantage in indoor versus outdoor games. Compared to the full sample estimates, greater stadium attendance increases home field advantage at indoor matches more so than for those conducted outdoors. In the absence of any detectable NFL referee bias, these results suggest that it is the NFL home stadium crowd itself that is directly affecting the on-field performance of the home and visiting athletes. Despite a lack of data tracking in-match noise intensity, given the acoustic differences between indoor and outdoor stadiums, this effect is likely related to crowd noise levels. While not explicitly testable using the data currently available, the crowd noise hypothesis can be further supported by examining the effects of stadium attendance density, instead of total crowd size, on the outcomes of interest.
Robustness – Replication Using Stadium Capacity Percentage
Since NFL stadium crowd density may differ in effect from the total crowd size due to differences in stadium architecture and capacity, the IV estimation is repeated using “percent of stadium capacity” as the endogenous stadium attendance regressor as described in equation (5). The IV estimates for the effects of stadium crowd density on game outcomes are presented in Table 10.
IV Estimates of Stadium Capacity Percentage on Game Outcomes.
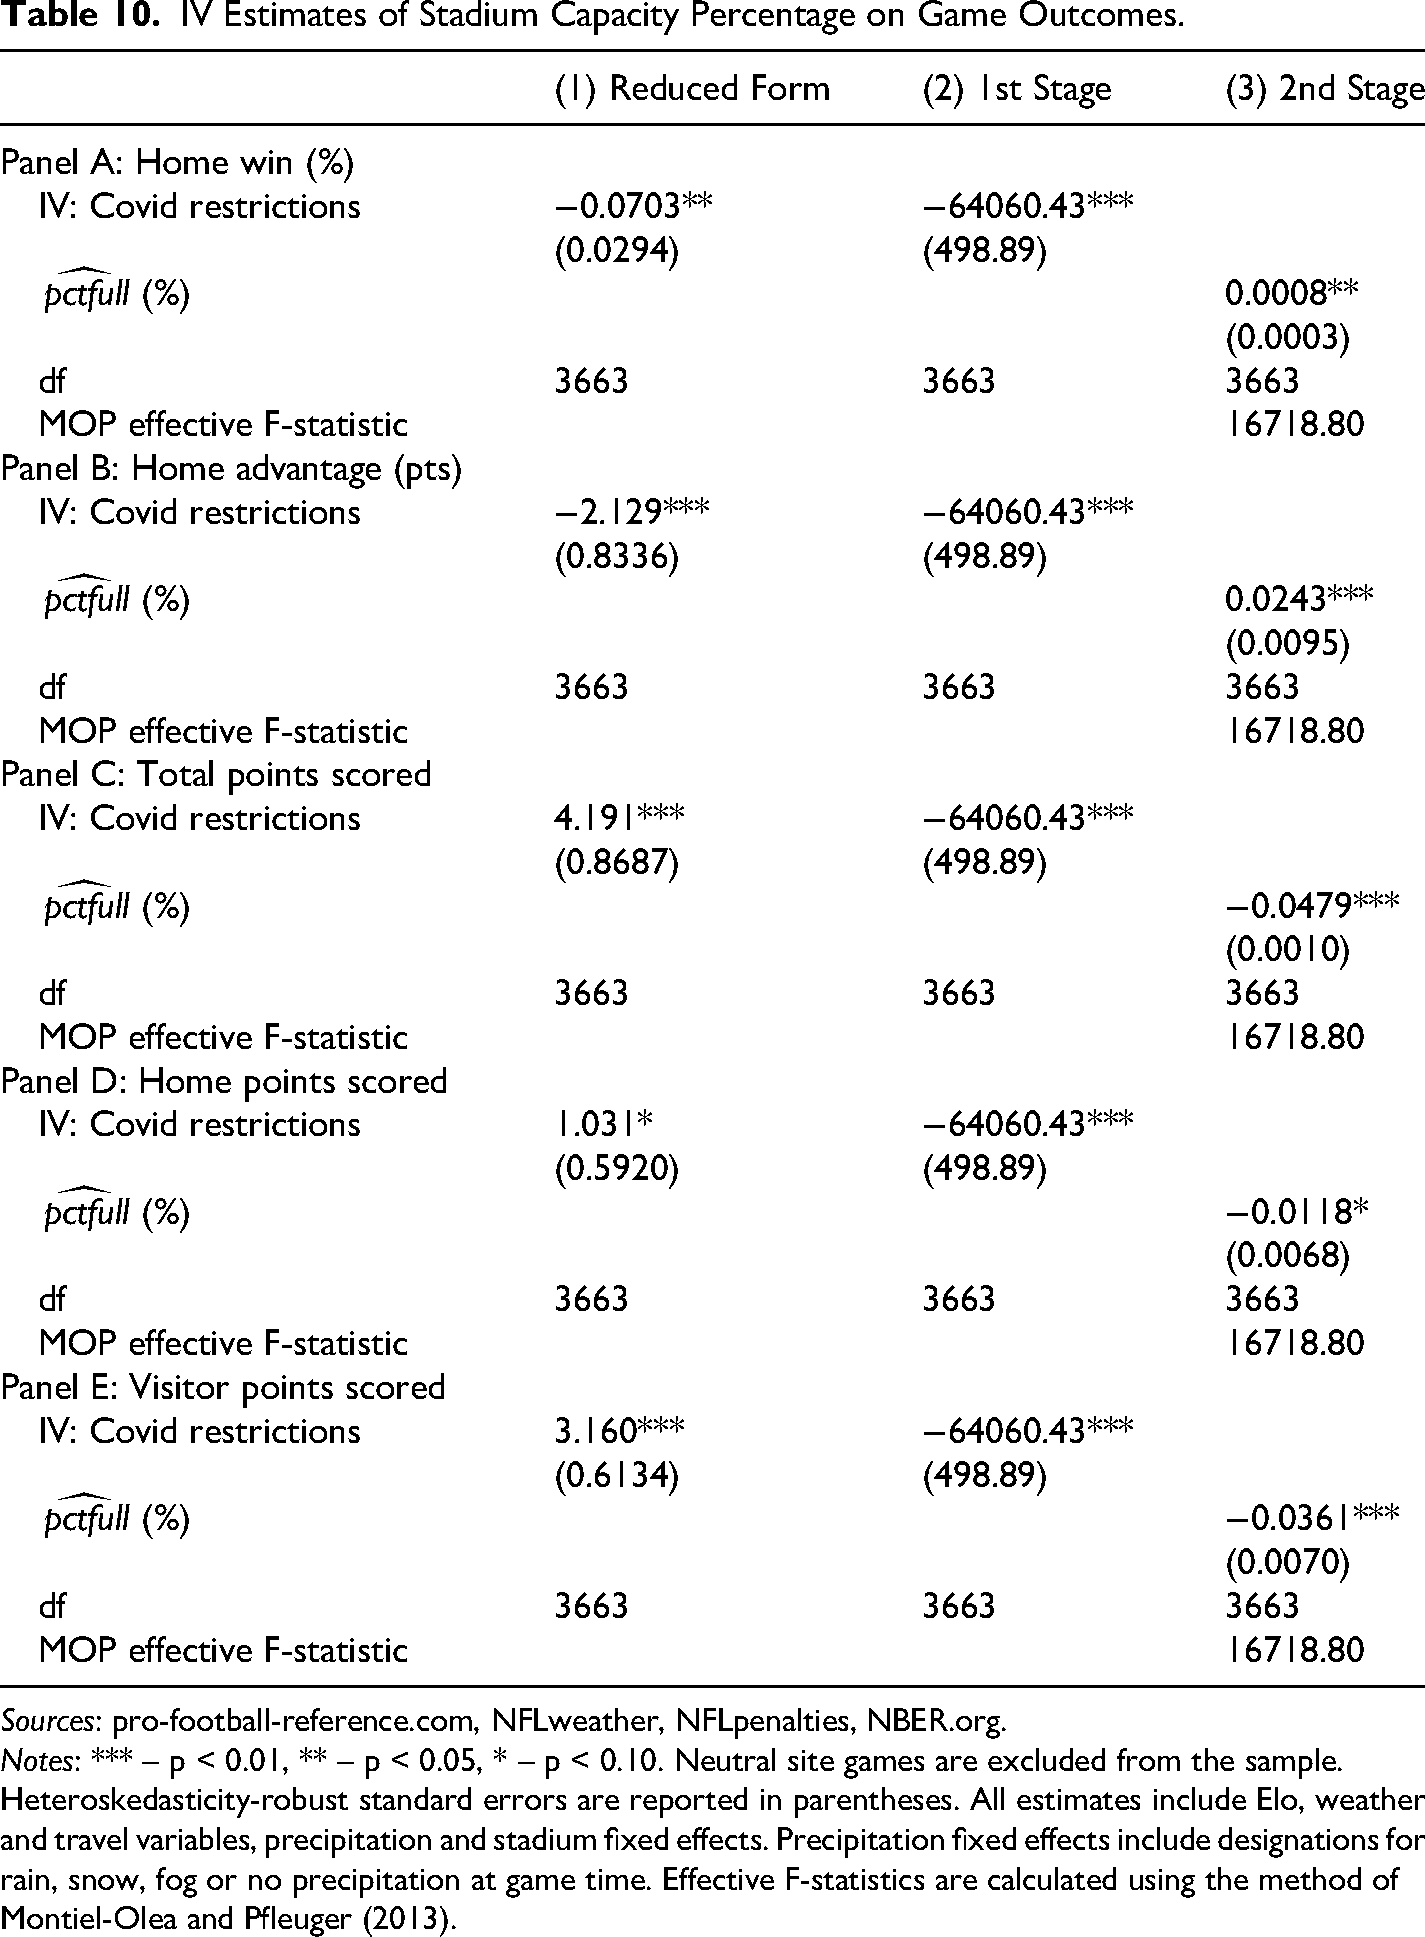
Sources: pro-football-reference.com, NFLweather, NFLpenalties, NBER.org.
Notes: *** – p < 0.01, ** – p < 0.05, * – p < 0.10. Neutral site games are excluded from the sample. Heteroskedasticity-robust standard errors are reported in parentheses. All estimates include Elo, weather and travel variables, precipitation and stadium fixed effects. Precipitation fixed effects include designations for rain, snow, fog or no precipitation at game time. Effective F-statistics are calculated using the method of Montiel-Olea and Pfleuger (2013).
The IV estimates of the effects of “percent stadium capacity filled” on game outcome variables closely corroborate (cf. Ehrlich et al., 2024) those using total stadium attendance. For every 10% rise in stadium attendance density, the probability of the home team winning rises by 0.8% and home field advantage rises by 0.243 points. When evaluated at the mean NFL stadium attendance as a percent of stadium capacity, or 87% full, stadium crowd density again accounts for 2.11 of the 2.17 points (97%) of mean home field advantage observed in the full sample, mirroring estimates using total stadium attendance as the endogenous regressor. Total points scored falls by 0.479 points and this reduction in total scoring is accounted for by a 0.118 point drop in home team scoring and a 0.361 point drop in visitor scoring per 10% capacity filled.
The estimation is repeated for penalty assessment in Table 11.
IV Estimates of Stadium Capacity Percentage on Penalty Assessment.
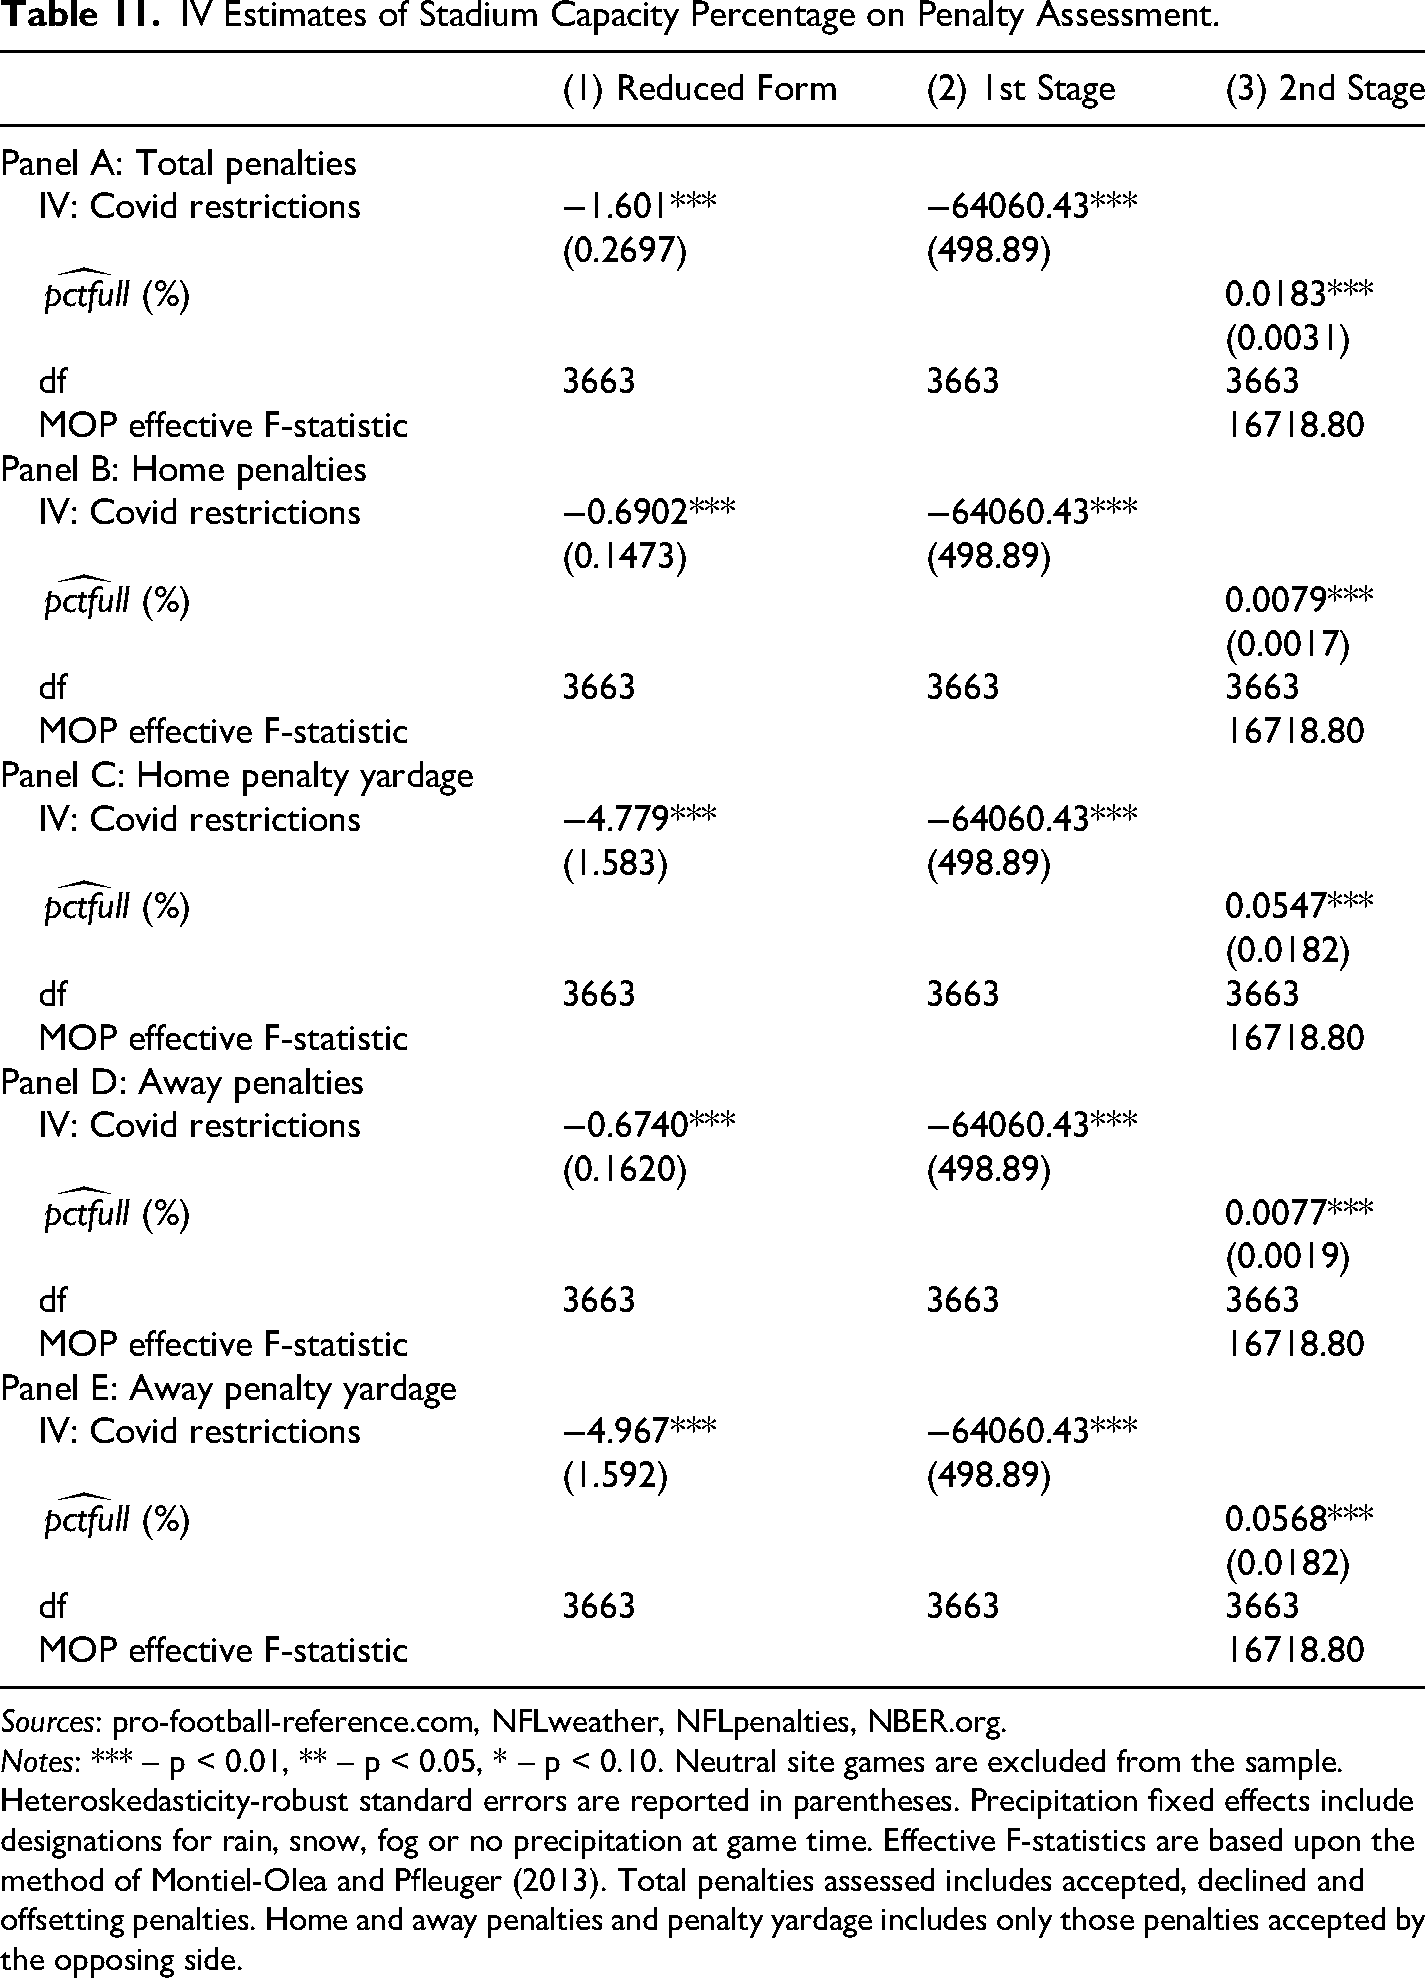
Sources: pro-football-reference.com, NFLweather, NFLpenalties, NBER.org.
Notes: *** – p < 0.01, ** – p < 0.05, * – p < 0.10. Neutral site games are excluded from the sample. Heteroskedasticity-robust standard errors are reported in parentheses. Precipitation fixed effects include designations for rain, snow, fog or no precipitation at game time. Effective F-statistics are based upon the method of Montiel-Olea and Pfleuger (2013). Total penalties assessed includes accepted, declined and offsetting penalties. Home and away penalties and penalty yardage includes only those penalties accepted by the opposing side.
The results using percent stadium capacity filled closely corroborate the results from Section 5.2. There is no indication of referee home bias among NFL officials, with total penalties increasing by 0.183 penalties for every 10% filled the stadium. This increase in total penalties is again shared equally between the home and visitor sides, with the home team receiving 0.079 extra penalties and 0.547 extra accepted penalty yards and the visitor receiving 0.077 extra penalties and 0.568 extra accepted penalty yards for every 10% increase in stadium attendance density.
Regardless the method used to measure stadium attendance, and in the apparent absence of NFL referee home bias or comparably impactful effects from covariates thought to affect home field advantage, the results presented in this study support the claim that is it the increasing size and density of the home stadium crowd itself which is tilting the match outcomes in favor of the home team.
Conclusion
Using a novel comprehensive panel data of NFL variables and COVID-era stadium attendance restrictions the during 2020 NFL season as an instrumental variable for stadium attendance, this study improves upon earlier research to provide several new causal estimates of the effects of home stadium attendance on NFL game outcomes and offers compelling evidence for the underlying mechanisms by which these effects arise.
Both the total size and density of home stadium crowds have comparable significant effects on game outcomes. Increasing home stadium attendance and stadium attendance density increases the home team’s chances of winning the game and the margin of victory in those wins. Greater stadium attendance and crowd density negatively affects total points scored, and this reduction in total scoring is due to significant decreases in both home and visiting team points scored, with the negative effect on visitor scoring being approximately 3 times larger than the decrease in home team scoring. When evaluated at the mean, home stadium attendance accounts for 97% of the observed home field advantage at NFL games between 2009-2022.
Ambient weather conditions in outdoor matches, hypothesized to play a role in home field advantage in earlier studies, have minimal effects on home advantage in the sample of NFL games analyzed. While wind speed at game-time does have significant negative effects on total and visitor points scored, it has no measurable effect on home field advantage and the wind effect on visitor scoring (per mile per hour of wind velocity) is approximately a third the magnitude of the observed home attendance effect (per 10000 fans). Precipitation on game day is relatively rare in the sample (4.6% of matches) but, when it happens, it serves to increase home field advantage by almost 2 full points. Disruptively high winds and heavy rain are relatively rare game conditions, however, and these effects, while significant determinants of outdoor home field advantage, have ultimately little influence on the mean NFL home field advantage observed during the 2009–2022 time period.
In order to exclude ambient weather effects from the IV estimation, I stratify the analysis to focus upon differences between outdoor and indoor matches. Upon constraining the analysis to weather-invariant indoor game conditions (72 degrees Fahrenheit and zero wind), the estimates of the home stadium attendance effect on home team success grow substantially in magnitude: when evaluated at the mean indoor stadium attendance, home field advantage rises to an average of 4.03 points per indoor game; almost two points greater than that observed in the full data sample and 2.41 points greater than the effect observed in outdoor games. The stratified results indicate that, in the absence of weather fluctuations, the advantage gained by rising indoor home stadium attendance is greater than that observed outdoors. The disparate magnitude of the home attendance effect in indoor and outdoor matches may be related to the enclosed architecture of indoor stadiums acting as an echo chamber, whereas outdoor stadiums allow sound to escape upwards and outwards.
Referee home bias, also hypothesized to explain home advantage in other sports, apparently has no measurable basis in the NFL. While the results of the stadium attendance and stadium attendance density analyses indicate that rising home stadium attendance and crowd density does indeed increase total penalties assessed by referees, the increase in accepted penalties and the severity of these penalties is shared equally between the home and visiting sides, suggesting that NFL referees are notably unbiased in their officiating of NFL games, even in the presence of potentially distracting home crowd influences.
Given the lack of evidence for preferential referee treatment but a strong, persistent home field advantage present in both the full and weather-controlled data samples suggests two possible conclusions: There is some confounding factor responsible for these profound effects, or the 12th Man does, metaphorically, “play defense” for the home team. Barring such a strong, as yet unknown cause of the observed effects, the 12th Man, embodied by an engaged home stadium crowd, can be considered an added defensive element for the home team predominantly due to their ability to reduce visiting team scoring, thus increasing the home field point advantage.
These results suggest that home stadium attendance may play a large role in determining the outcomes of NFL matches, and despite the existing data being insufficient to directly estimate the instantaneous effects of crowd noise levels, future research should focus upon in-game stadium noise intensity and its effect on high-leverage, potentially game-changing plays. Greater home stadium attendance serves to improve home team win probability and home field advantage, and given the overwhelming demand for immediate success among NFL owners, front offices, coaching staffs and players, the results presented in this study indicate the potential to increase home team success using indirect, off-the-field methods to increase home attendance and enhance fan engagement during the match.
Footnotes
Funding
The author(s) received no financial support for the research, authorship and/or publication of this article.
Declaration of Conflicting Interests
The author(s) declared no potential conflicts of interest with respect to the research, authorship, and/or publication of this article.