
Abstract
This study examines inefficiencies in football betting markets by analyzing the gap between bookmaker odds and empirically estimated probabilities. Using English Premier League data and a combination of Markov processes and ordered logit model, the paper constructs a betting strategy that does not rely on superior predictive power but exploits market mispricing. The strategy consistently yields abnormal returns, particularly for draws and away teams, challenging the Efficient Market Hypothesis (EMH). The analysis reveals potential behavioral biases, like emotions, and reliance on heuristics, which distort market prices. Robustness checks with data from other major European leagues support these findings. The results have broader implications for financial markets, as they highlight how behavioral patterns can create exploitable inefficiencies. We conclude that sports betting thus serves as a simplified, data-rich setting to test theories of market behavior, offering insights into how information, psychology, and pricing may interact in both betting and financial domains.
Introduction
For most people, sporting events are seen primarily as an amusement and are an important part of the culture of the countries. In the case of South America and Europe, football is the sport that takes the lead in terms of popularity. However, the importance of football is not limited to entertainment as such, since this sport is the source of a large betting market, in which individuals try to test both their skill and their luck in order to obtain profits. In this scheme, where objectivity should prevail, there may be both informational and behavioral elements that affect preferences and distort the profits that could be obtained in betting. This research aims to show that it is possible to beat sport betting markets by only following a betting strategy based on rational principles, without the necessity to make better predictions than the market.
Within these markets there are a large number of assets (bets) whose values depend on different scenarios of nature and reflect relevant information that is publicly available. This means that, in essence, the football betting market, like any other sport betting market, might be considered a financial market. However, the sport betting markets, and specifically football markets, have the property that they receive information more frequently about the performance of the teams, making these markets, in theory, more efficient, eliminating any option of generating abnormal returns, thus fulfilling the Efficient Market Hypothesis (EMH) proposed by Fama (1970), at least in its semi-strong form.
In traditional financial markets, assets are valued on the basis of future expectations, which materialize in prices whose values are the result of the interaction between agents, although there is no total certainty as to whether these values are a reliable reflection of the intrinsic value of the assets. In contrast, sports betting markets have the additional property that each bet (asset) has a defined moment in time in which its intrinsic value becomes known by the market, that is, once the match has finished, bettors know with total certainty what the true value of their bet is based on the result. This would make these markets attractive to study, because the values of the real results can be compared with the expectations of the bettors (Ottaviani & Sørenson, 2009; Thaler & Ziemba, 1988; Williams, 1999).
Given the above, punters are faced with betting (investment) options, whose decisions, under the assumption individuals are rational, theoretically should be based on the information they receive periodically about the team's performance. If this were the case, this would mean that, as in the case of financial markets, it would not be possible to obtain abnormal returns consistently over time (Jensen, 1978). Despite the above, it must be clear that in sports betting markets not only do agents participate whose main purpose is to obtain profits from their investments, but there is also an important “consumption” component (Allais, 1953; Conlisk, 1993; Humphreys et al., 2013), which is why people are not always indifferent between betting on one team or another, even under similar return expectations. Thus, sport betting markets also have a component that is inherent to punters, which is related either to their personal preferences, beliefs or judgment (Tversky & Kahneman, 1973, 1974). Therefore, individuals do not necessarily incorporate information adequately, even if it is available, implying that punters may create suboptimal strategies when they try to beat the market. This would lead individuals to underestimate/overestimate certain scenarios for specific games across the season, opening opportunities for getting significant returns.
Most of the studies related to football (soccer) betting have emphasized the predictive character of the models, in terms of directly predicting the final outcome of the matches, in order to try to obtain positive returns in the sports betting market (Boshnakov et al., 2017; Cain et al., 2000; Constantinou et al., 2017; Deschamps & Gergaud, 2007; Dixon & Coles, 1997; Dixon & Pope, 2004; Goddard & Asimakopoulos, 2004; Hausch et al., 1981; Kuypers, 2000; Maher, 1982; Pope & Peel, 1989). Meanwhile, other studies have paid attention to empirically testing the existence of the so-called Longshot Bias (or Improbable Favorability Bias), which corresponds to the tendency of individuals to prefer more improbable outcomes, which can alter the expected return of bets (Cain et al., 2000; Henery, 1985; Williams & Paton, 1997; Woodland & Woodland, 1994).
Considering that returns from betting are linked to the probability that one of the possible states occurs in a match, home wins (Home), home loses (Away) or draw (from now onwards, HAD), we used public information for all market agents (punters), to initially establish a Markov model for a discrete stochastic process and, subsequently, an ordered multiple choice model, from which the probabilities of occurrence of each match were estimated. With this, a betting strategy was created that seeks to simulate the behavior of a rational bettor, using as input the estimated probabilities and comparing them with those of the market, thus generating a set of bets that allows discriminating between bets with a high or low expected return, giving room for abnormal profits. The results show that indeed the proposed betting strategy allows us to obtain positive abnormal returns. This suggests that, on the one hand, the EMH would not be fulfilled in the case of sports betting markets, and, on the other hand, there are biases, which would mean that market agents are not cognitively incorporating the available information correctly in their betting strategies.
In summary, this study finds that market odds consistently deviate from estimated probabilities derived from available information, particularly in the case of draws and away teams. The proposed strategy, which does not require superior prediction, yields statistically significant abnormal returns, challenging the assumption of efficiency in betting markets. These findings align with behavioral research insights and suggest that financial markets, like football betting markets may be influenced by cognitive biases and information-processing limitations. This analogy reinforces the idea that understanding investor behavior and mispricing mechanisms in financial contexts can benefit from empirical evidence observed in controlled, data-rich settings like sports betting.
Literature Review
Financial Perspective on Sport Betting Markets
Market efficiency has been a widely discussed topic in financial literature over the years. One of the first related works, Fama (1970) attempts to explain the concept through models such as the “Fair Game”, “Submartingale” and “Random Walk”. In this research, Fama coined the concept of EMH, according to which markets become efficient to the extent that prices incorporate available information. Thus, it is stated that no market agent could obtain abnormal returns consistently in the long term, given the condition of randomness of returns, which is subject to the incorporation of information that comes in an unpredictable way for those who participate in the market.
While most of the subsequent empirical evidence showed that the EMH is indeed fulfilled (Jensen, 1978), Ball (1978) and Watts (1978) provide evidence that is inconsistent with this theory, observing the existence of abnormal returns. However, according to Ball (1978) those abnormal returns are not evidence of market inefficiencies but instead are due to deficiencies in the capital asset-pricing model. Furthermore, another line of research argues that the abnormalities might be explained because of judgment biases of investors, which makes them either overreact or underreact under certain circumstances (Barberis et al., 1998). This idea lies on the evidence stemming from cognitive psychology showed by Tversky and Kahneman (1973, 1974), suggesting that individuals give excessive importance to recent patterns in the data and not enough to the properties of the population that generates the data, and on the idea of conservatism posited by Edwards (1968), that the incorporation of information in cognitive models is slow when there is new evidence. Nonetheless, Fama (1998) argues that although there is evidence showing significant abnormal returns that might apparently be explained by behavioral patterns (over/underreaction), these are rather fragile and tend to disappear with reasonable changes in the way returns are measured, suggesting that EMH would indeed be fulfilled in financial markets.
In this respect, in traditional financial markets, agents try to use available information to value assets. Therefore, to the extent that agents incorporate information, which is assumed to be predominantly rational, it should be reflected in the value of those assets. Thus, sports betting markets might be considered a financial market, which has a large number of investors (punters), great access to relevant information, assets (bets) whose values depend on the performance of the companies (teams), but also has the additional property that each asset (bet) has a defined point in time in which its fundamental value is realized and known by the entire market once the game is over (Ottaviani & Sørenson, 2009; Thaler & Ziemba, 1988; Williams, 1999). This represents an advantage over the study of traditional financial markets, where the fundamental or intrinsic value of assets is never known with certainty, so that any analysis is based only on estimates and expectations of such a value (Thaler & Ziemba, 1988).
Behavioral Nature of Betting Markets
Evidently, just like in traditional financial markets, sport betting markets may be influenced by behavioral patterns. In fact, there are reasons to think that those behavioral patterns should be stronger in sport betting markets, even to the point their effect can outperform the effect of a greater availability of information in these markets in certain situations. Tversky and Kahneman (1974) explain that the way in which individuals determine probabilities in the face of uncertain events underlies a limited number of heuristic principles. This subjective probability assessment is based on cues or indicators that can often lead to biased results.
In this respect, a well-documented behavioral phenomenon in sport betting markets is the so-called Longshot Bias, or Favorite-Longshot Bias (Cain et al., 2000; Henery, 1985; Williams & Paton, 1997; Woodland & Woodland, 1994). This bias occurs because punters prefer to risk betting options that, although they have a low probability of occurrence, give a higher return to the punter in case of choosing the correct outcome. Thus, the bookmaker assigns a higher proportion of the margin 1 to the less probable scenarios, therefore, the less probable scenarios give a lower payout in terms of their probability of occurrence, so that their expected return will be lower than that of the more probable scenarios.
In the particular case of the soccer betting market, other biases in the assignment of probabilities can potentially be given by the history of the teams or the players that the team possesses, which can be heuristic and misleading the judgement of actual team performance, being in accordance also with the idea of conservatism (Edwards, 1968) and the Halo Effect proposed by Thorndike (1920), who found empirical evidence demonstrating that the initial the impression (positive or negative) about the characteristic of a person, situation or entity may influence the a posteriori assessment of the real characteristics or even other characteristics not related at all to the person/situation/entity. For instance, this bias has been found to be significant in the case of financial markets when investors are faced with similar investment but from firms with higher or lower reputation (Jang et al., 2016). Therefore, in line with these biases, it might be the case that punters are prone to overweight the likelihood for teams that have a big history or more renowned players, regardless of their real performance.
Another aspect to consider is the so-called Home Advantage, according to which teams playing at home would have a higher probability of winning, which would be given by factors such as field conditions, fatigue due to travel (from the away team point of view), and fan support for the home team, among other factors. Although the home advantage concept emerged as an empirical truth, it has subsequently been tested in literature (Carron et al., 2005; Clarke & Norman, 1995; Fischer & Haucap, 2021; Pollard, 1986; Waters & Lovell, 2002; Winkelmann et al., 2021). This conception of home teams being favored by external conditions can also work as heuristic for punters at the time they create their expectations about the odds. For instance, Winkelmann et al. (2021) found that the prohibition of public gatherings in stadiums during the COVID-19 pandemic eliminated the home advantage in the Germain Bundesliga. The authors found that bookmakers had problems adjusting the betting odds in accordance with the disappeared home advantage. These results are consistent with the ones obtained by Fischer and Haucap (2021), who analyzed the same tournament during the COVID-19 pandemic.
Moreover, a punter's evaluation about teams’ performance may be based on information that is more accessible in their memory rather than based on all available information. For instance, Tversky and Kahneman (1973) posit that people make some decisions based on assessments that stem from more recent available information, they called this bias as the availability heuristic. In the case of football teams, it is unlikely that punters are able to identify all the information for all teams when they set their bets, instead, many times, punters could rely on mental shortcuts to estimate the likelihood of events, which in turn will be based on how easily they can recall the frequency of those events. Thus, more infrequent events, like draws or away team victory in football (provided the home advantage), may be systematically underestimated by punters and bookmakers, which is consistent with the betting strategy proposed by Archontakis and Osborne (2007), where punters can obtain better returns by betting to draws in the World Cup, and also the results from Snowberg and Wolfers (2010), who show lower losses for backing draws than other outcomes in English Football. These mistaken heuristics can influence the assessment of punters about the probabilities.
For his part, Allais (1953), in his famous critique of the axioms of the Expected Utility Theory, argues that among some aspects to take into account when it is about betting is the pleasure (utility) that gambling itself implies for the gambler. In fact, more recent studies about sport betting markets have confirmed the importance of the consumption perspective on the decisions of individuals (Humphreys et al., 2013; Mao et al., 2015; Stetzka & Winter, 2023). Stetzka and Winter (2023) argue that even though monetary consequences are not irrelevant for gamblers as they take into consideration monetary outcomes, consumers of gambling services also see it as a commodity that offers entertainment and excitement, implying that football betting markets are not purely rational nor fully irrational.
Indeed, Humphreys et al. (2013) found empirical evidence in the context of NCAA basketball games, whereby the authors identify that the behavior of bettors resembles more to that of sport fans rather than wealth-maximizing investors, meaning that overall punters do prefer one team in the detriment of draws. It is in accordance with the results from Franck et al. (2011), who argue that sentiments have a strong influence in these markets, finding evidence confirming that more favorable odds are extended to bets on more popular clubs, since bookmakers offer lower prices for bets with comparatively stronger demand. In fact, plenty of research has found that people do prefer sports with higher scoring rates (Jane, 2014; Paul & Weinbach, 2007; Salaga & Tainsky, 2015). In this respect, Vlastakis et al. (2009) found that on average draws presented the lowest total scoring rate across European football competitions, meaning that eventually draws can be seen as less appealing for punters from the consumer point of view.
In the line of sentiments and emotions, some research suggests that feelings like anxiety and fear play an important role in the way individuals assess risk and uncertainty. For instance, Hsee et al. (2001) argue that the assessment of the risk associated with outcomes is not purely a cognitive evaluation but rather is heavily influenced by feelings that may even stem from that same evaluation. The authors propose that the evaluation of subjective probabilities is a conjoint process that involves cognition of the likelihood and emotions about the outcome itself. Thus, emotions like fear or anxiety generated by the potential outcomes would make people more risk averse, beyond what the purely cognitive evaluation would suggest. In the case of the football betting market, the fact that individuals are able to assess the probability of the outcomes in real time while the matches are happening adds another dimension to the model proposed by Hsee et al. (2001), because in this case not only the outcome can generate fear or anxiety, but the match itself. Let's think in a punter whose money is on team A, there are very many cases in which the punter will be sure with high certainty that his bet will be realized, for example, if team A is winning by many goals (difference of 2, 3, 4… etc.), even if team A makes a big mistake. However, in the case of a draw, it is not the same, because draws are subject to change under any little mistake, so, punter that bet on draws are very unlikely to be free from anxiety or fear about their bets even to the very last minute of the match. Therefore, when punters bet on draws, they have the cognitive evaluation that there is no possible scenario in which they can watch the game with confidence that their bet will become true, which makes them more reluctant to draws than they cognitively should.
So, there are at least four effects other than longshot bias that can distort the real odds that bookmakers should offer, the Halo Effect, the Availability Heuristic, the Consumption Effect and the emotions/affect effect, whose expected influence on the odds expectation is summarized in Table 1. It is noteworthy that these four effects are not necessarily exclusive, meaning that they can be present all at the same time. All these patterns can give rise to inefficiencies that eventually can be exploited by more rational decision makers.
Possible Behavioral Biases in Sport Betting Markets.
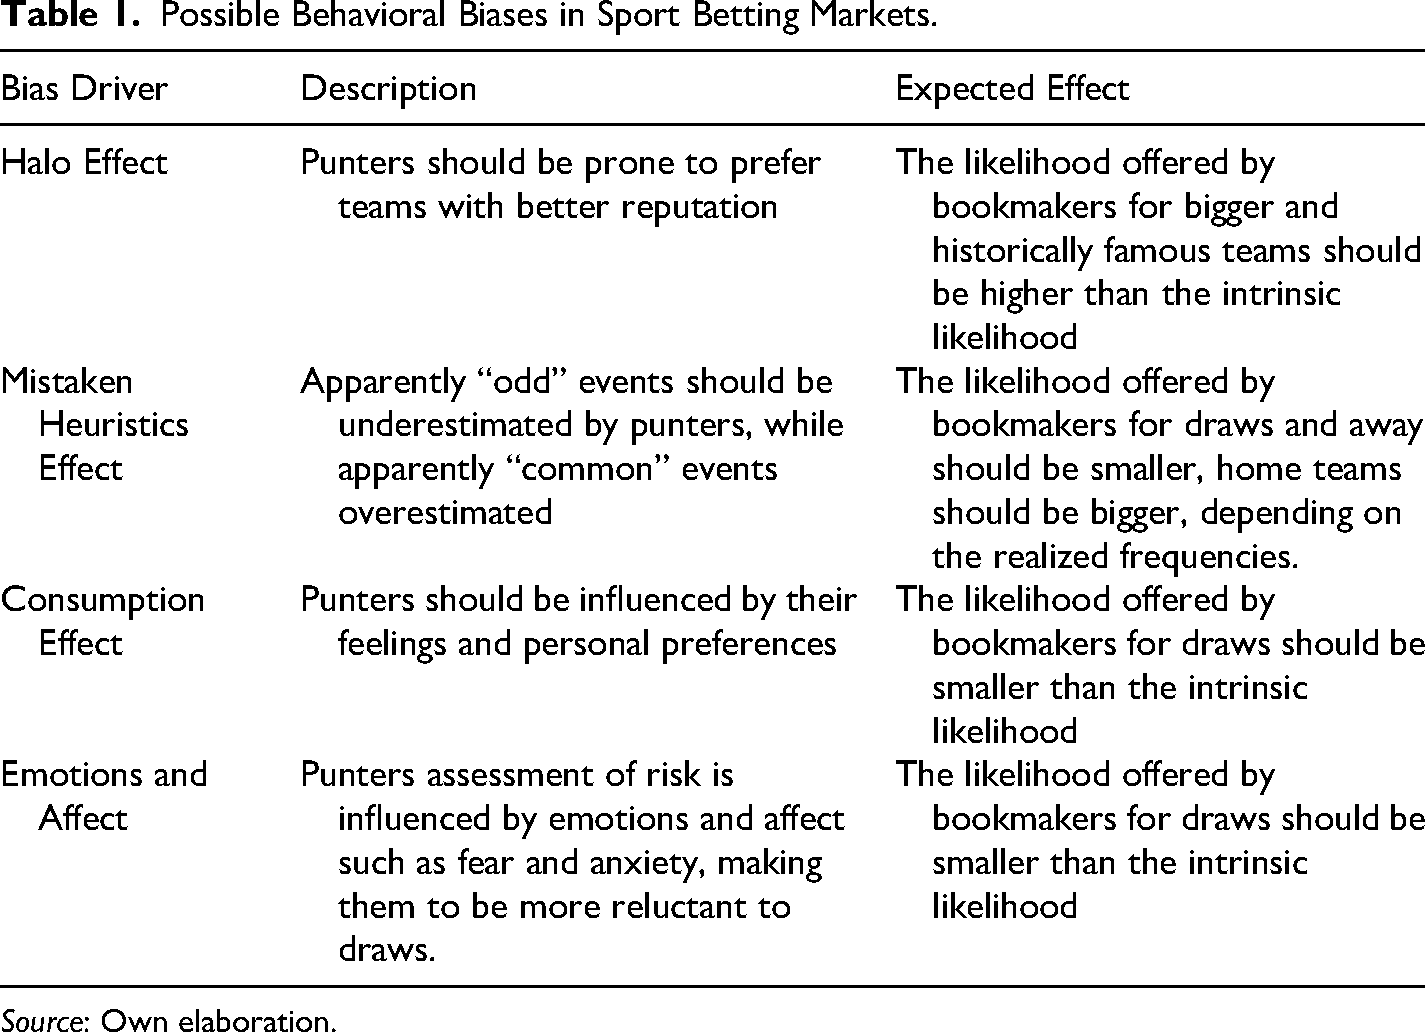
Source: Own elaboration.
Prior Testing of Sport Betting Markets
Since the seminal works of Hausch et al. (1981) and Maher (1982), several authors have in fact attempted to show that there are inefficiencies in the sports betting market by using stochastic and probabilistic models. Dixon and Coles (1997) made an estimate based on a discrete choice model with a Poisson distribution, finding inefficiencies that can be exploited in the betting market, taking as a sample data from the First Division of the English Football League in the 1995–1996 season. Later, Dixon and Pope (2004) carried out the same methodology, but incorporating information available before each match, obtaining similar results. Likewise, through an Ordered Logit estimation method, Hvattum (2013) attempts to prove the informational efficiency of football betting markets, where, using data from the five most important leagues in Europe, he concludes that there would indeed be informational inefficiencies that allow obtaining better returns than by making a blind bet. For their part, Boshnakov et al. (2017), propose an alternative approach based on a Weilbull counting model to determine the goals scored in a match, obtaining a better fit and confirming the existence of inefficiencies. On the other hand, Constantinou et al. (2017) use a Bayesian network model, based on three main factors, team strength, form and fatigue with motivation. With this the authors incorporate both information available in the market and personal judgment to estimate the probability of HAD (Home, Away, Draw), finding results that confirm the possibility of obtaining abnormal returns. Other works that also suggest that there may be inefficiencies in sports betting markets are Pope and Peel (1989), Forrest and Simmons (2000a, 2000b), Kuypers (2000), Cain et al. (2000), Goddard and Asimakopoulos (2004), and Deschamps and Gergaud (2007).
Within the framework of this quest to generate models that can explain or predict the results of matches, several variables have been considered. Naturally, the outcome of a match is expected to depend, to a large extent, on the performance or strength of the teams facing each other. Maher (1982), Dixon and Coles (1997), and Rue and Salvesen (2000) have translated this into two aspects, called Attacking Ability and Defensive Ability. In this sense, a team with better performance (measured in terms of offense and defense) should have a better chance of winning.
In line with the above, Dixon and Coles (1997) considered that a good way to represent attacking ability is by the goals scored by the team, while a good way to represent defending ability is by the goals conceded. Likewise, Dixon and Coles (1997) also posit that the most recent results should be a better measure of its future performance. Meanwhile, Chumacero (2009) considered that previously accumulated points would be a possible predictor of the outcome of a match. Along with the same idea, Lasek et al. (2013) and Kausel et al. (2019) consider that the difference in the leaderboard between teams would be a measure of skill, which is based on the previous performance of the teams.
All these studies have focused mostly on getting abnormal returns by predicting the outcomes of each game better than the market on average. Nevertheless, this prior research has ignored that, under the influence of behavioral patterns in the market (if there are), those biases should affect primarily the probabilities that market offers (which are represented by the odds), and not necessarily the expected outcome (HAD). The above means that, by trying to get abnormal returns predicting the outcomes more accurately than the market, researchers are not fully capturing the whole size of the bias, implying that there are options to obtain even higher expected abnormal returns, even without the need to be more accurate than the market on average in predicting HAD.
The Football Betting Market
The Sportradar AG provides services to bookmakers and monitors potential fraud, reporting that the sports betting market moves around 1.5 billion euros a year worldwide. According to Sportradar AG, within Europe, the United Kingdom is the country with the largest legal sports betting market. The football betting market, in its most traditional format, consists of betting a certain amount of money on one of three possible states of nature; the home team wins, the home team loses or the match ends in a draw (HAD). The market assigns each state of nature a number that represents how much the payout (odd) is granted in case of winning. Naturally, if the bet is incorrect, the money wagered remains with the bookmaker. These assigned odds are inversely proportional to the probability of occurrence of each state, so a state with a low probability of occurrence will have to grant a greater reward, given the greater risk it implies for punters.
There are several formats to represent the odds in betting markets, two of the most popular being the Fractional odds (American) and Decimal odds (European). Under the decimal odds format, the probability of each state of nature HAD is the result of dividing 1 by the odds offered by the bookmaker (equation (1)). For example, if the odds offered by the bookmaker for the victory of a particular team is 1.1, then the probability that the market associates with that state is 1 over 1.1, which is equal to 90.9%. Bookmakers want to ensure a return for themselves, which corresponds precisely to the additional premium that the odds have, known as the margin (Margin = Prob. H + Prob. A + Prob. D − 1), whereby the sum of the odds gives a value greater than 1, making it necessary to adjust these odds to prevent the calculations based on this information from generating bias.
The existence of the margin represents an issue, particularly because the way in which bookmakers distribute the margin in the three states of nature HAD is private information and, therefore, is not directly identifiable. However, Sauer (2005) proposes a method to deal with this problem, arguing that a solution is to distribute the margin proportionally to the probability of each state. Therefore, the probability estimated for each state of nature corresponds to the one described in equation (2).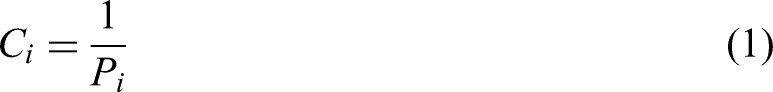
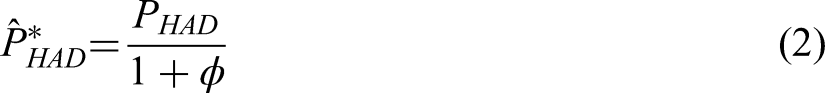
Where
Data
In order to evaluate the efficiency of the football betting market, I will work with historical data of the English Premier League (EPL) for the all seven seasons between 2017 and 2024. The choice of the English Premier League is due to the fact that it is the most popular football league in the world when measured in terms of total revenue generated. The EPL generated an aggregate revenue of €5,297 million during the 2016–2017 season, the highest revenue followed by the Spanish league (LaLiga). Given its high level of popularity, the market is expected to possess a higher level of information and knowledge regarding the teams. On the other hand, it was decided to work with each season independently, since teams usually sign players and coaches at the beginning of the season in the summer market, making it difficult to compare the performance of a team from one season to another, since it is very likely that the players are not the same, or even if they are, the performance may change significantly from one year to another.
The historical data of the odds associated with each of the 380 matches for each season between 2017 and 2024 were obtained from the website of the betting odds comparison service company, OddsPortal 2 . Meanwhile, data were also extracted from the official website of the EPL 3 related to goals scored, points, among others. Although initially we had observations from 380 matches (full season), after the third matchweek all teams had already played at least once both as home and away, so we extracted the first two dates (20 matches). Additionally, it is assumed that in the first matches the teams test players and strategies, so they are not necessarily going to be a very accurate representation of their long-term play. In the second stage, the sample was separated into two sets. One of them corresponds to the training data, with 250 observations, corresponding to the interval from matchweek 3 to 27, which will be used to train the model and obtain its parameters. On the other hand, the remaining sample, corresponding to the last 11 matchweeks of the tournament, will be used to test the model and evaluate its predictive performance, but mainly its performance in terms of the returns obtained from the “rational” betting strategy.
With respect to the distribution of the states of nature (HAD), Tables 2 and 3 offer an illustrative description of the odds for season 2017–2018. It can be observed that the average odds given for the case of the away team win is higher than the case of the home team win and draw, which would be explained by the home advantage. This shows us that there are substantial differences between the odds awarded for each of the three possible states. If we analyze the volatility of the odds paid in each state of nature, we can see that the standard deviation for the case of draws is considerably lower compared to the other two cases. On the other hand, if we look at the risk-return relationship, we see that the Sharpe Ratio (Sharpe, 1966) of the odds is higher in the case of the draws.
Descriptive Statistics of Betting Market Odds.
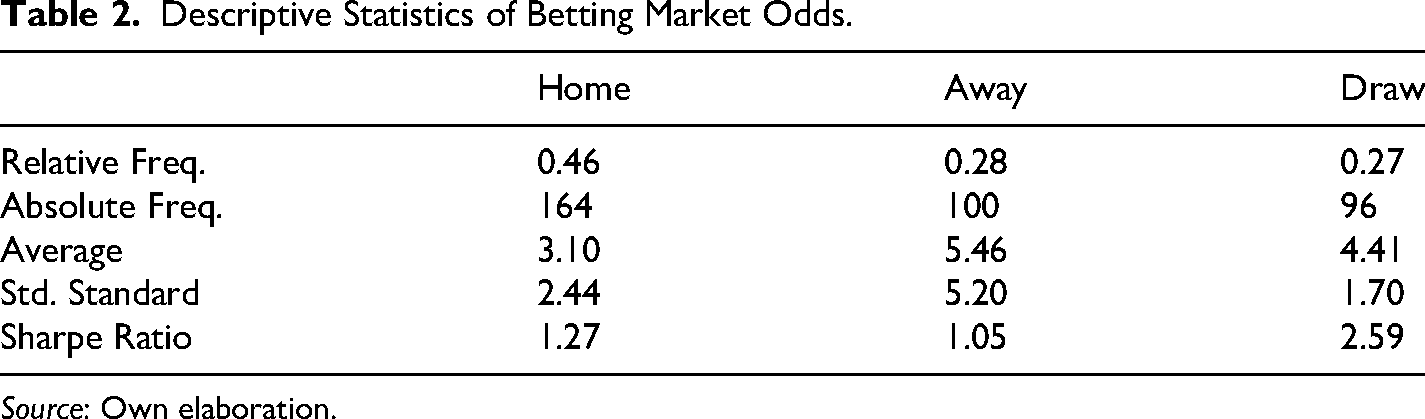
Source: Own elaboration.
Descriptive Statistics Conditional Coefficients.
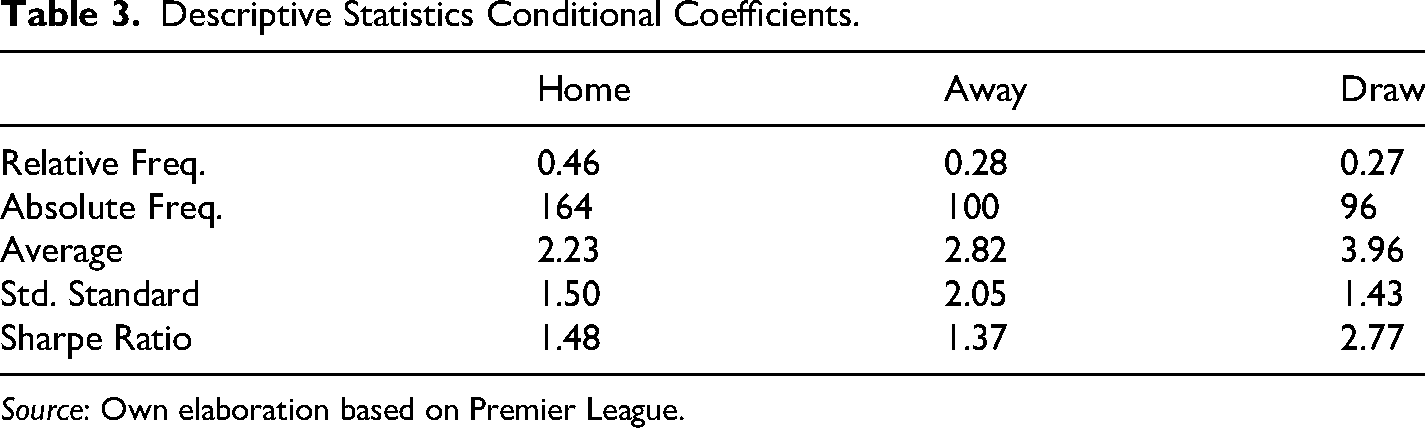
Source: Own elaboration based on Premier League.
Moreover, when taking the odds that were actually paid given the realized occurrence of the HAD event, which we will define as conditional odds, we can observe that the distribution of these odds (see Table 3) is like that presented in the non-conditional ones. However, if we analyze the variation of the average odds between Tables 2 and 3, we can see that, in the case of draws, the odds paid decrease proportionally less than in the case of home and away wins. This suggests that for the case of draws, there is a smaller number of high odds that fail to be paid, which means that there is a high number of high odds events that actually occurred. In other words, it means that there are a high number of events with a low probability of occurrence (according to the market) that finally do occur.
Regarding the 250 training matches that go from the third to the twenty-seventh matchweek, we describe a summary of the variables used in the model for each season in Table 4. On the other hand, for those considered as test matchweeks, referring to the last 11 rounds of the tournament (from the 28th to the 38th matchweek), their summary is described in Table 5.
Descriptive Statistics for the Training Sample Across Seasons.
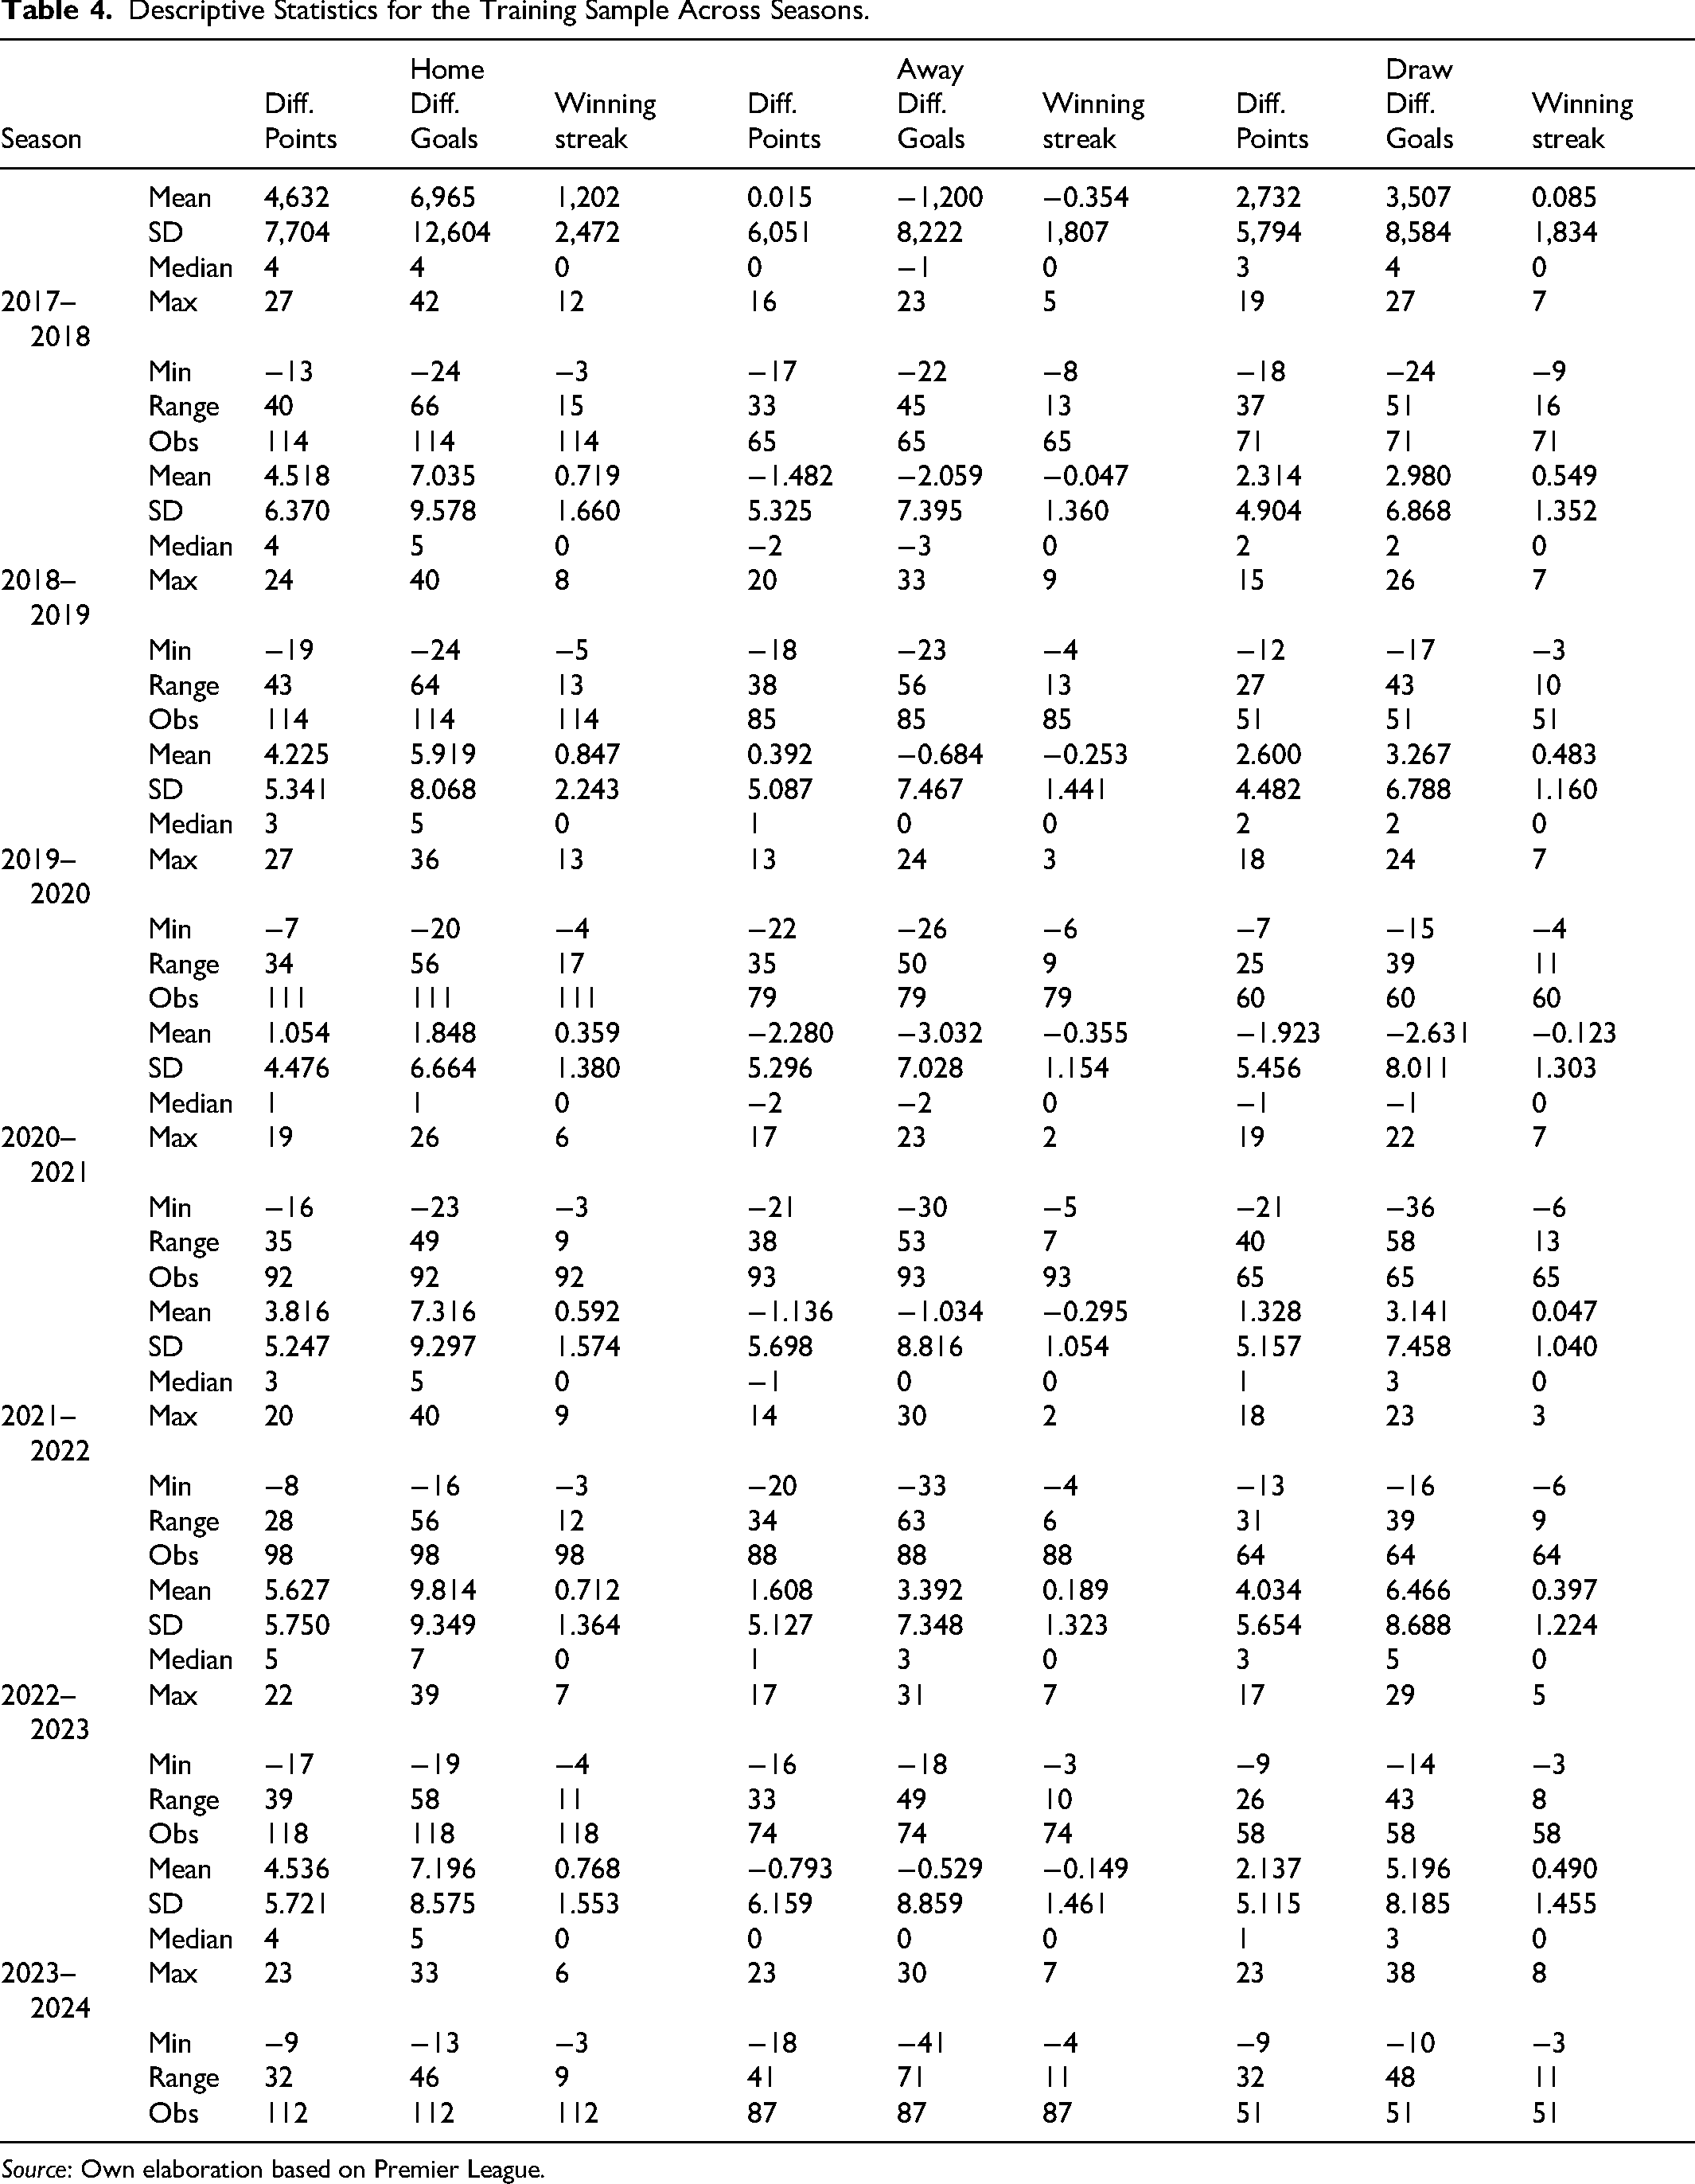
Source: Own elaboration based on Premier League.
Descriptive Statistics for the Test Sample Across Seasons.
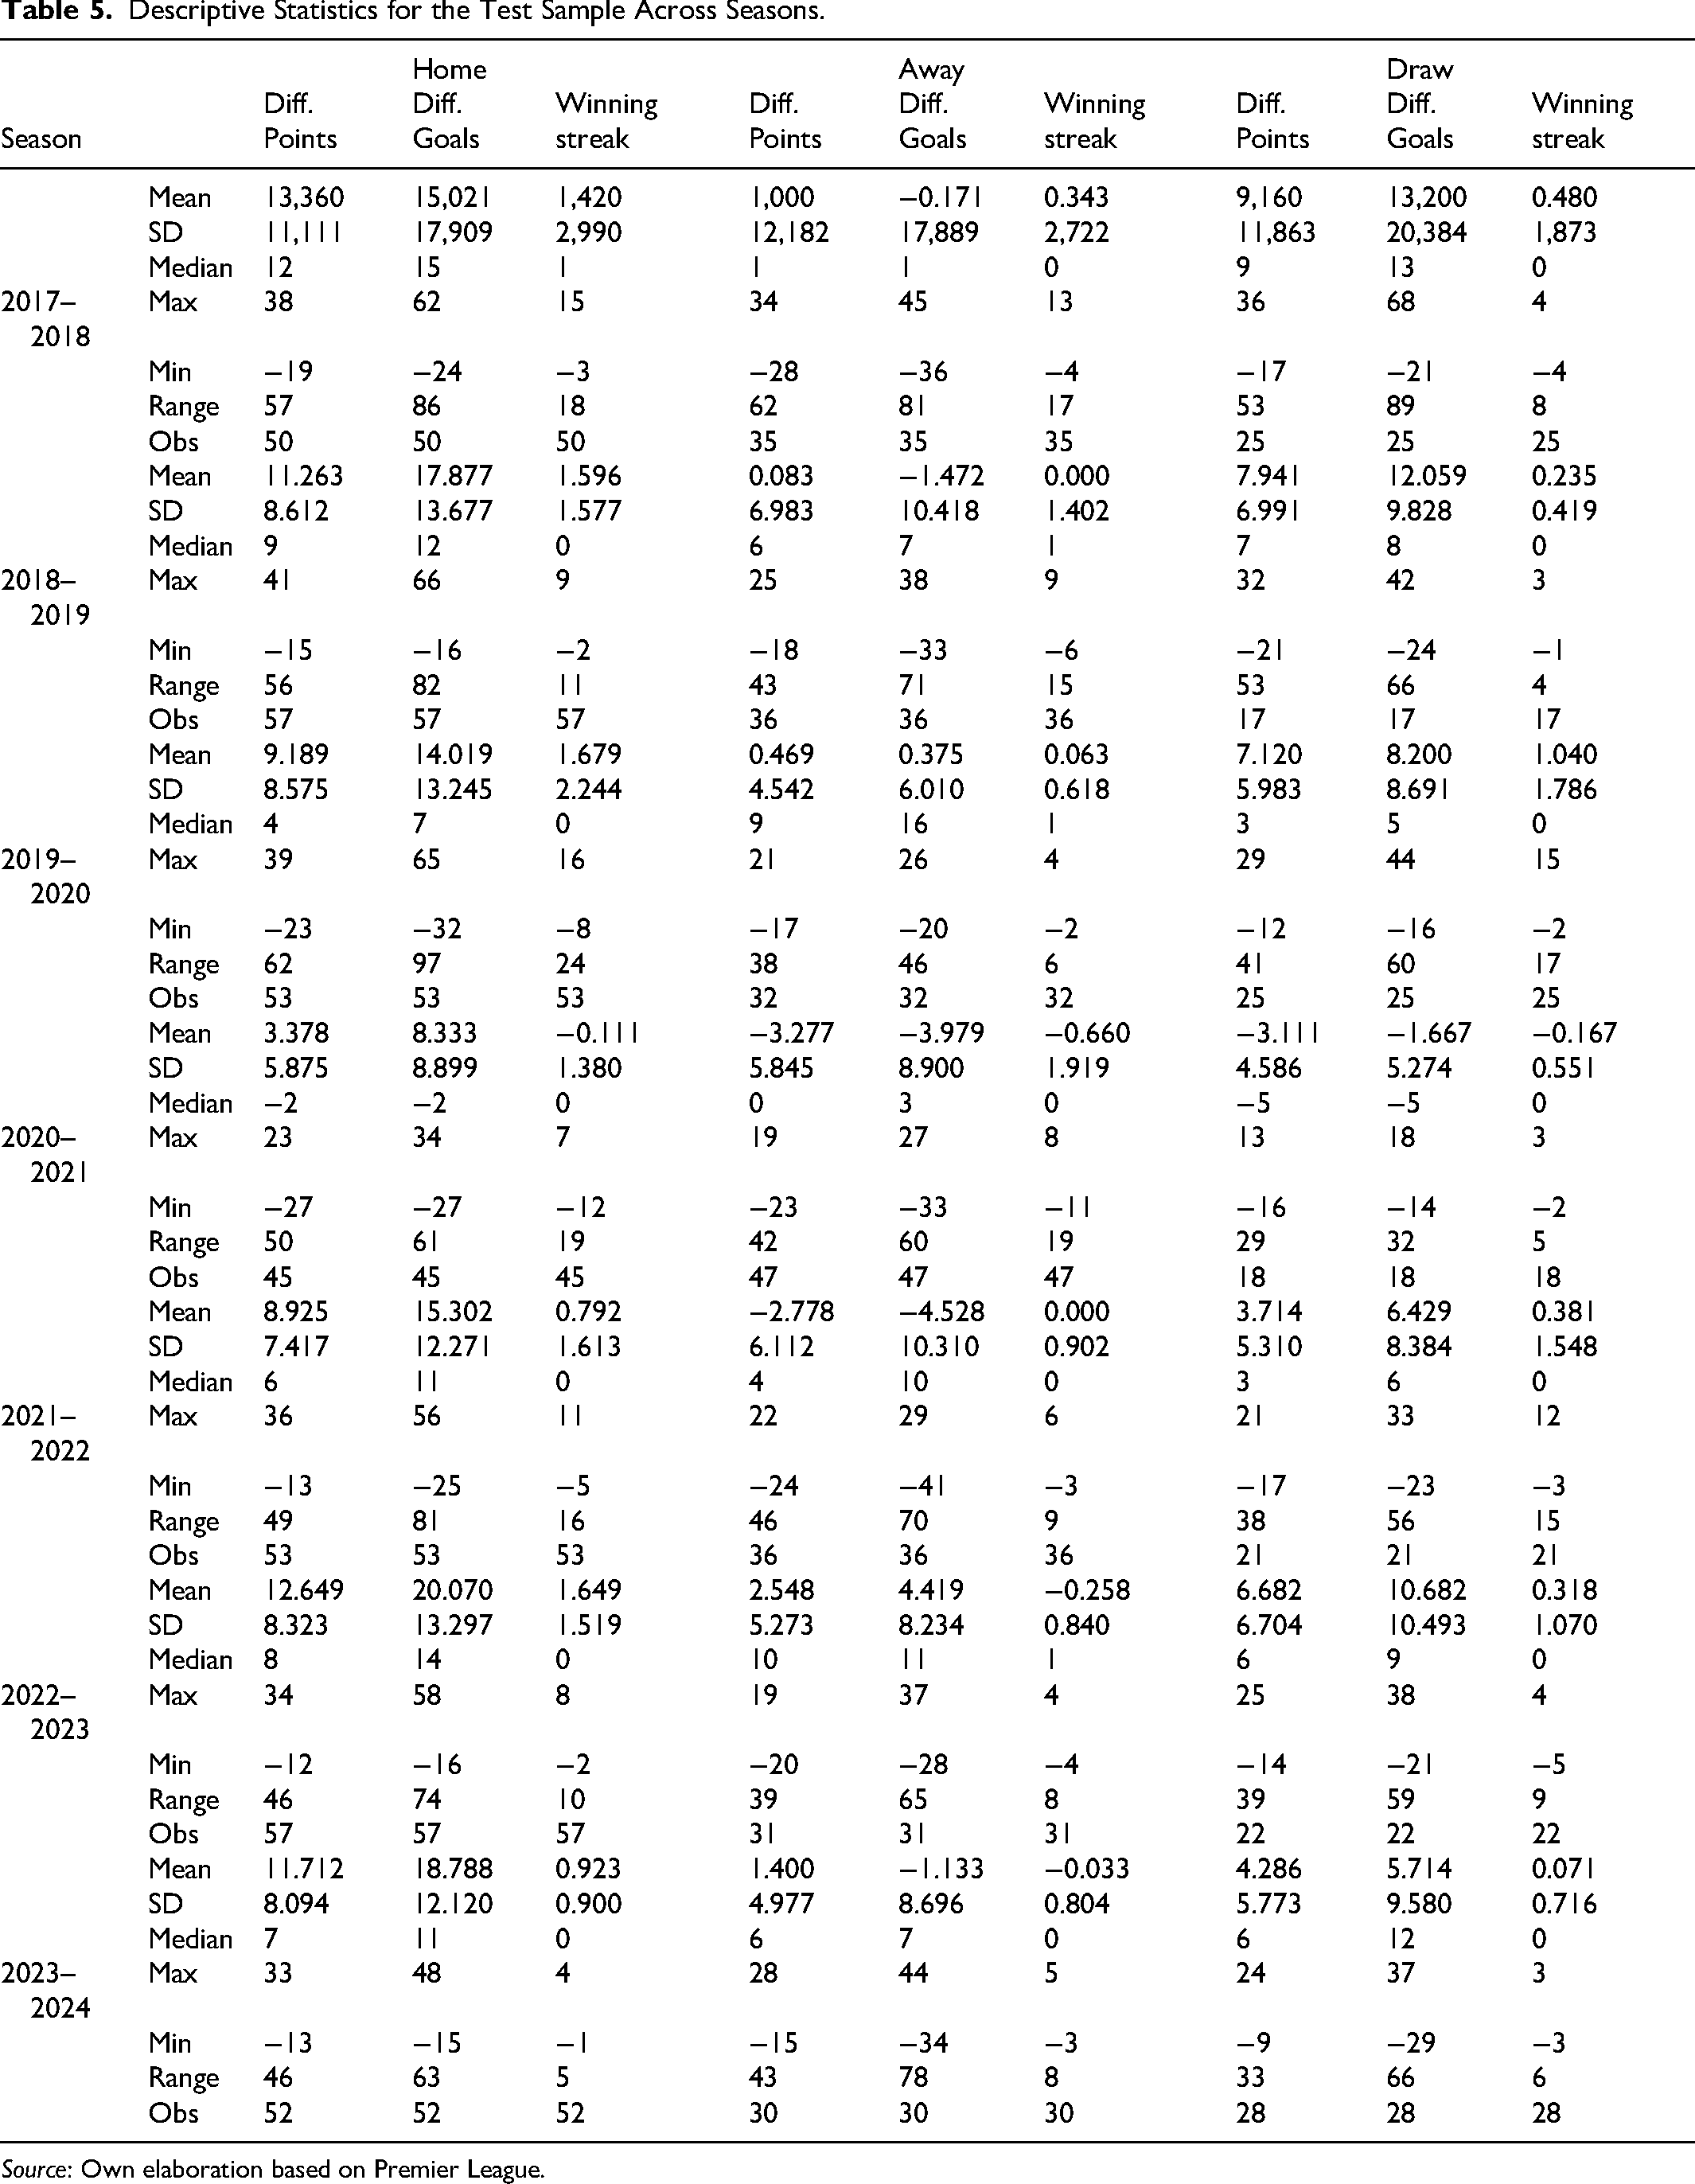
Source: Own elaboration based on Premier League.
It can be seen that there is a large difference in the mean of the variables if we consider the time window used in Table 4 and the one used in Table 5. This difference lies in the fact that, as the variables are measured with the absolute differences between teams, as more rounds go by, the best teams win and accumulate more points and the worst teams remain at the bottom of the results, making the differences become increasingly larger as the championship progresses. On the other hand, the differences could also be explained by the fact that teams can change their performance throughout the championship.
If we consider that in the middle of the season there is a recess period where teams stop playing, it is natural that teams modify or improve their game strategies, which may be different between teams, causing differences in the composition of the data, to the point that the estimates will not be able to adequately incorporate these effects. For example, in the case of a team's winning streak, which is a variable that by its nature should not suffer from the accumulation problem that the Points difference variable has (column Diff. Points), however, there is evidence that the behavior of the teams effectively changes as the end of the season approaches.
Preliminary Analysis: Markov Process
The football betting market can evolve as much as the strategies of the teams evolve as the tournament progresses, which is not observable with descriptive data. Under these conditions, it is reasonable to think that the result of a given match is not explained as much by past results, but rather it will be conditioned by the current state of the teams. This situation can be modeled by as a Markov process on the probabilities, therefore, from a transition matrix, the steady state probability associated with each scenario was estimated, which, in this case, would be independent of the initial state of any particular match and consequently represents a long-term probability (Datta & McCormick, 1993; Kulperger & Prakasa Rao, 1989). Thus, as the season progresses, team performance should obey a long-term behavior that is independent of any initial HAD state that the team has had.
In order to determine whether there is a difference between the steady-state probabilities and the probabilities assigned by the market, the statistical resampling method known as Bootstrap (Efron, 1979) was used. The first step in making the estimate of the Markov process is to generate a transition matrix, which is obtained by calculating the probability of each possible scenario conditioned on the outcome of the immediately preceding match. To estimate the steady-state probabilities using Bootstrap, a total of 10 thousand estimates were considered, using randomly selected subsamples with a size of 70% of the total sample, which allowed creating a distribution for the probabilities of each scenario.
The mean of the observed probabilities, which basically represent the actual results that occurred for each state, is obtained by dividing the absolute frequency of each scenario by the total number of matches, as shown in the first column of Table 5. Likewise, the mean of the market probability corresponds to the simple average of the probability that the market (bookmaker) assigns to each scenario (see details in Annex II). The mean of the steady-state probabilities corresponds to the average obtained from the distributions generated using the Bootstrap method, as can be seen in the last column of Table 6 for which the confidence intervals were determined by the 5 and 99 percentiles (90% CI), 2.5 and 97.5 percentiles (95% CI) and 0.5 and 99.5 (99% CI).
Probability Comparison for the English Premier League by Season.
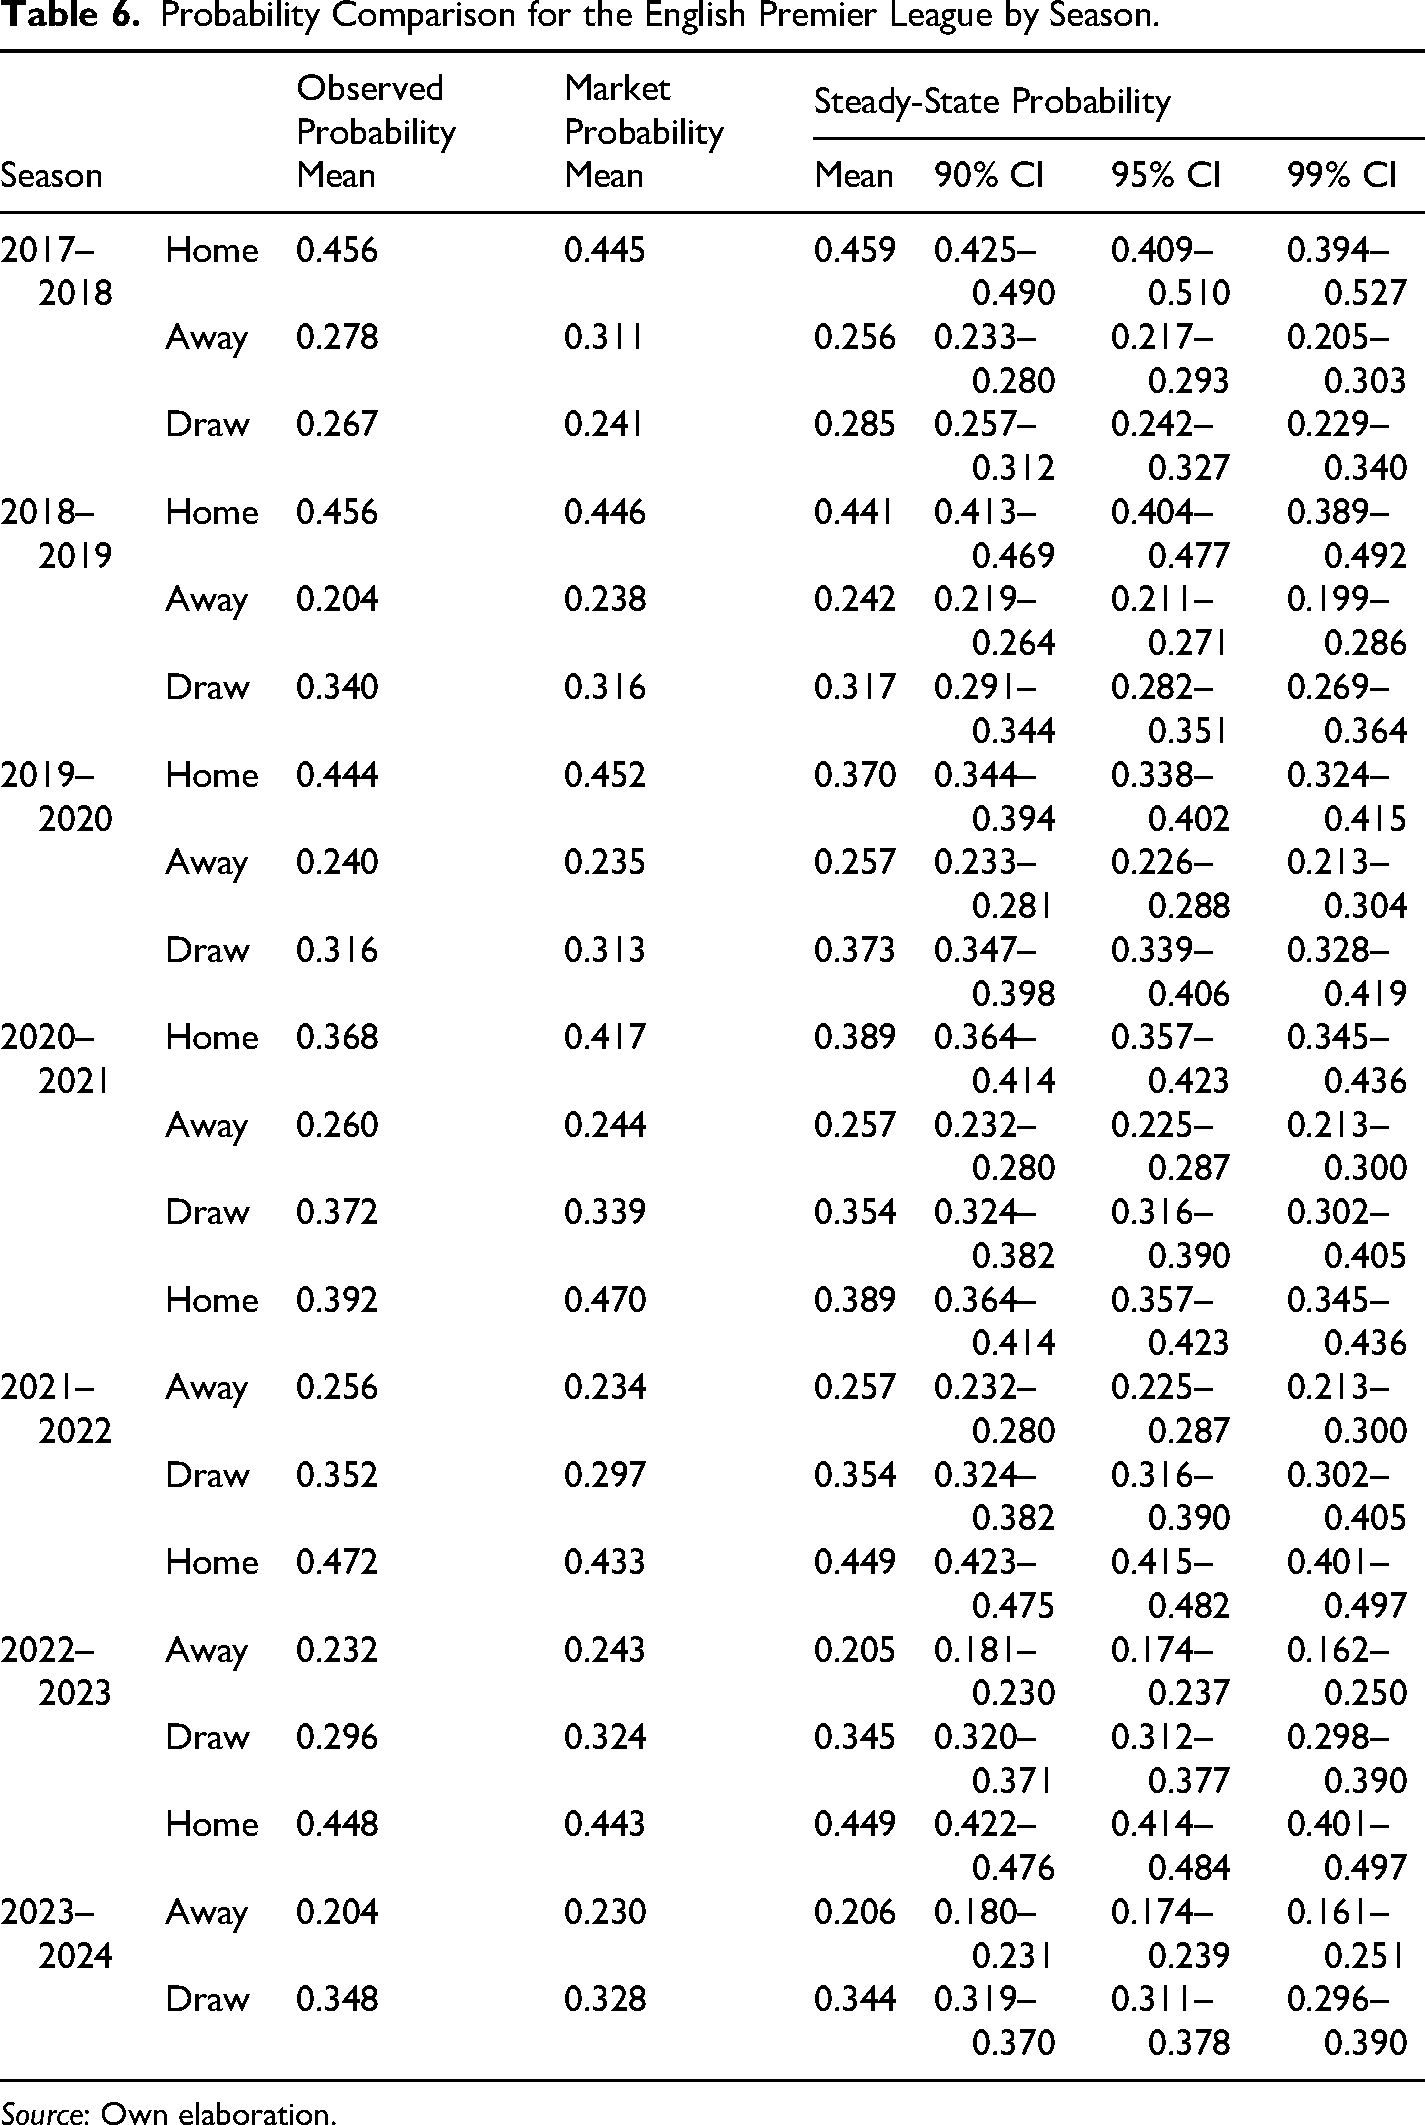
Source: Own elaboration.
In the case of the observed probabilities, most of the probabilities associated with any state HAD fall within the 90% confidence intervals to the very least (see Table 6), so it can be said that there is no significant difference between the observed probabilities and the steady-state probabilities. This implies that the steady state probabilities would be a good estimate of the observed probabilities. However, in the case of the market probabilities, it can be observed that the mean of the “Away” scenario is higher than the upper bound of the 90% confidence interval in some seasons (like 2017–2019, 2022–2023, 2023–2024) or very close to the upper/lower bound at least (like in 2021–2022, 2019–2020). Moreover, in the “Draw” scenario the probability is lower than the 90% confidence interval to the very least in several cases (like in 2017–2018, 2019–2020, 2021–2022) or very close to the upper/lower bound (like in 2022–2023, 2023–2024), so it is possible to infer that there is indeed a significant difference in the probabilities assigned by the market and the stationary probabilities, where the market effectively misvalues the probability of a draw and the probability of the Away team. Interestingly, there are three consecutive seasons from 2019–2020 to 2021–2022 where the market probability for the Home scenario is higher than the upper bound of the 90% confidence interval at least, which arguably can be related to the distortion that home advantage suffered because of the COVID-19 situation and the prohibition of public gatherings in stadiums that eliminated part of the advantage that home teams hold generally (Fischer & Haucap, 2021; Winkelmann et al., 2021).
Empirical Strategy
The probabilities of HAD are linked to hierarchical and exclusive events relative to the performance of both teams in a given match. This implies that the outcome of a match is, on average, determined by the performance differential between the two contenders. The greater the performance gap between the home and away teams, the higher the likelihood that the home team will win. Conversely, as this performance gap narrows and eventually disappears, the most probable outcome becomes a draw. If the gap reverses in favor of the away team, the most likely result shifts toward an away-team victory.
The above description represents the rationale of the proposed model, and why it is possible to use an ordered multiple choice model. Similar models have been used in the study of sports betting markets (Forrest & Simmons, 2000a, 2000b; Goddard & Asimakopoulos, 2004; Hvattum, 2013; Kuypers, 2000) to assess inefficiencies in information and returns. Unlike other previously conducted work, we focus on a betting format in which one wants to predict one of the three possible outcomes (HAD) and not the goals scored by each team (exact outcome). Given the above, to estimate the probabilities of each matchup, an Ordered Logit estimation method was used.
If the market turns out to be efficient, the odds of HAD are well determined for bookmakers. Consequently, there should be no possibility of obtaining a positive and statistically significant return consistently over time. This is because the odds associated with each match are precisely pre-established by bookmakers, so that the expected return for a bet on a specific event HAD for a given match in a given matchweek is of the form:
Where
Therefore, it should be possible to obtain positive and significant returns if a betting strategy can be created to identify undervalued states for certain matches. The above is true assuming that the market, and therefore bookmakers underestimate certain events in specific matches. Based on this logic, we will establish a betting strategy based on estimated probabilities, determined on the basis of information available to all punters on the date each match is played. With this strategy, we expect to obtain significant (positive) abnormal returns, such that:
Where
It is necessary to estimate the probabilities of occurrence of events, for which the following hierarchical multiple-choice model is given:
Where Y represents the occurrence of the event i (outcome of the match), so that it will take value 1 if the home team is defeated, value 2 if there is a draw and value 3 when the home team is victorious. Since in each match one must necessarily be the home team and the other the away team, we will take the differences of the explanatory variables on the performance of the teams (Chumacero, 2009; Konning, 2000). Thus
Once the probabilities
If
If the above condition is met and the bet is placed, then the strategy is governed by the following conditions.
If
If
If
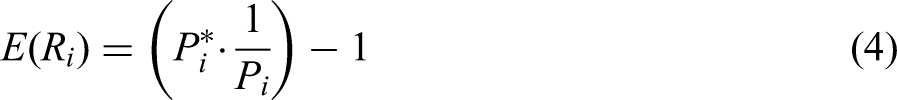
Conditions from 2 to 4 are placed to ensure that extremely risky bets are not made. Finally, condition 5 is to decide which event should be bet on. It is based on the conceptualization made in equation (4).
The strategy of the 
These conditions ensure to bet on the events whose estimated probabilities 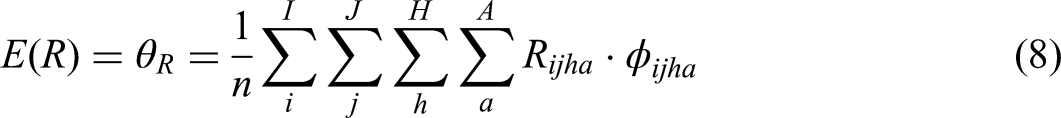
Equation (8) depicts the expected return of the rational betting strategy, whereby
Having defined the parameters (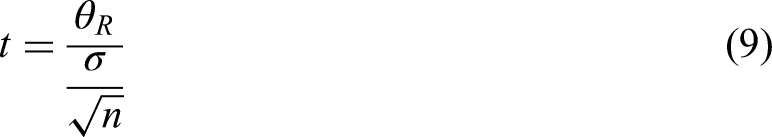
Where
Finally, the values for parameters
Estimated Parameters by Season.
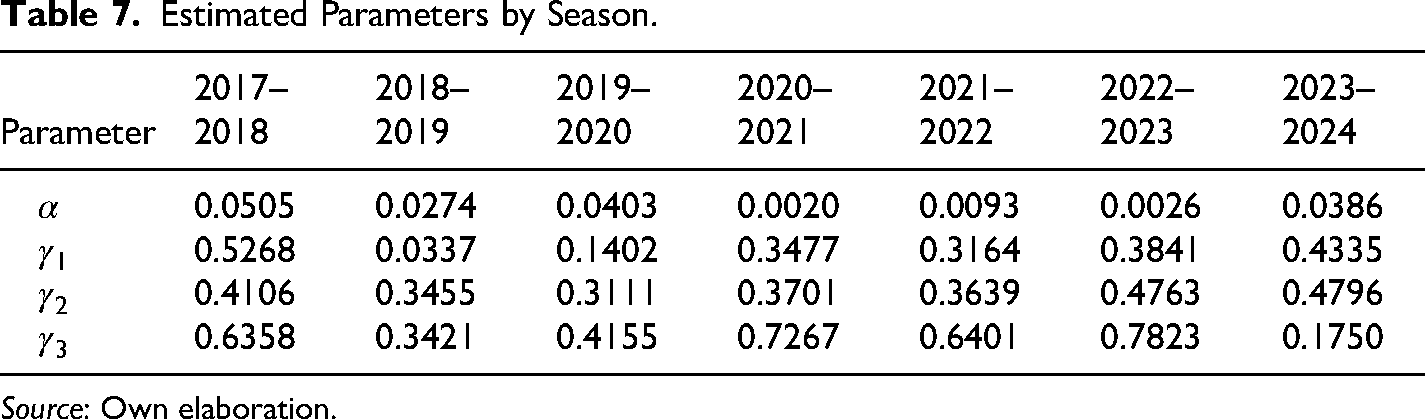
Source: Own elaboration.
Results
From the estimates of the Ordered Logit method on the model described in equation (6), I established the HAD probabilities that the player should select in accordance with the objective function, which we can contrast with the probabilities (bets) occurring in the market (the odds of the bookmaker). An illustration of these probabilities using season 2017–2018 as example can be seen in Figure 1, which shows that in the case of the probabilities associated with the victory of the home team, the market tends to assign more extreme probabilities (close to 10 and 90%) if we compare it with the estimates obtained by the model, where such probabilities tend to accumulate in an average close to 35%. On the side of home losses (or away wins), we see that the frequency of the probabilities assigned by the market presents a more extreme value if we compare it with the probabilities of the model. It can be observed that the probabilities of the market distribution tend to be more on the right side with respect to the model, i.e., the market assigns higher probabilities to home defeats than the model estimates. As for draws, the market assigns lower probabilities (lower than 30%) with a higher frequency if we compare it with the probability determined by the model, where the probabilities are more concentrated in the 30% to 40% range, with some even higher than 45%. This is in accordance with what was observed in the Markov process described initially.
Estimated prob vs market prob. Source: Own Elaboration.
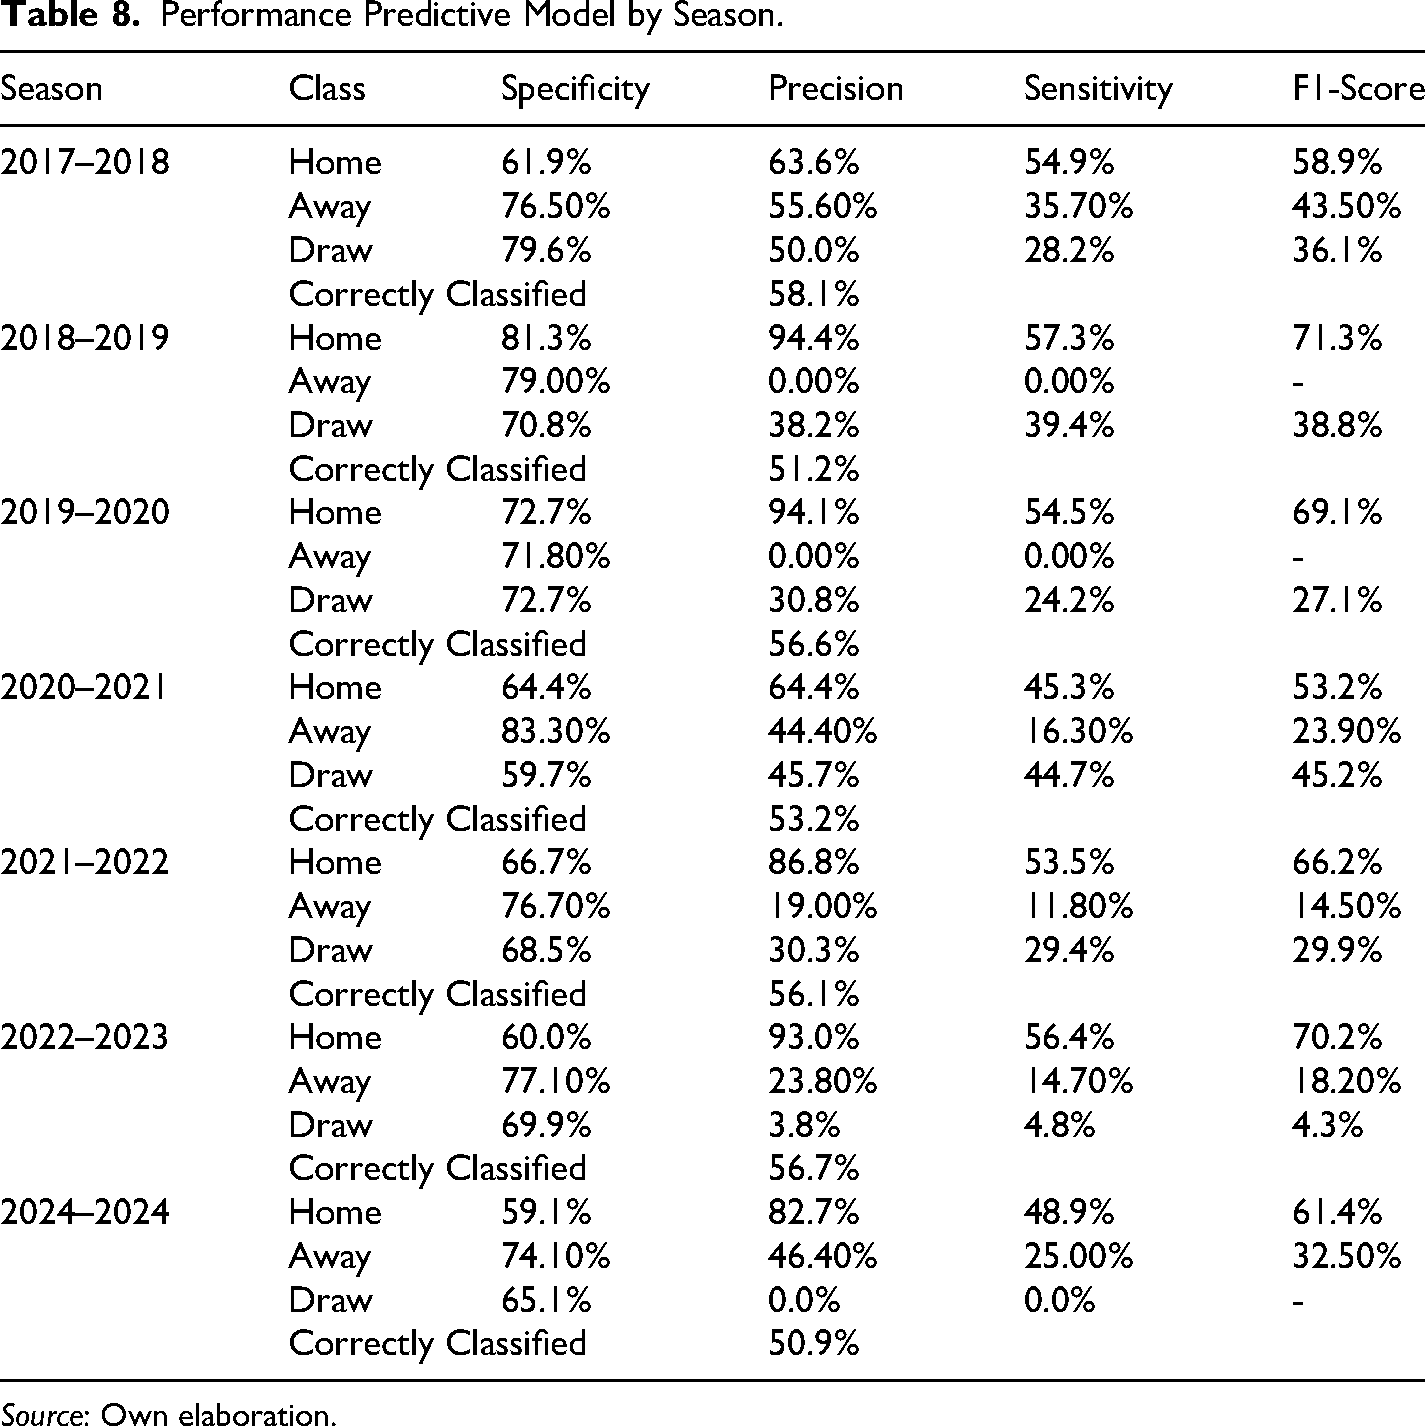
Regarding the betting strategy, I assigned the home win, away or draw condition according to the five conditions defined above, whose performance can be seen in Table 8. In the case of the model's predictions for season 2017–2018, there are 17 blank bets out of a total of 110 possible ones (last 11 matchweeks), which means that the model did not bet on those matches given the high risk they represented according to the five conditions. As for the performance itself, it is observed that the model has a capacity to correctly predict the home team's victories with a precision that ranges from 63.6% (season 2017–2018) to 94.4% (season 2018–2019). Likewise, for the losses of the home team (away), the model has a precision ranging from 0% to 55.6% (season 2017–2018). On the other hand, the lowest precision is present in the case of draws, where the precision ranges from 0% to 50%, equivalent to tossing a coin in a 50/50 game. The percentage correctly classified is far from impressive, which ranges from 50.9 to 58.1%.
Performance Predictive Model by Season.
Source: Own elaboration.
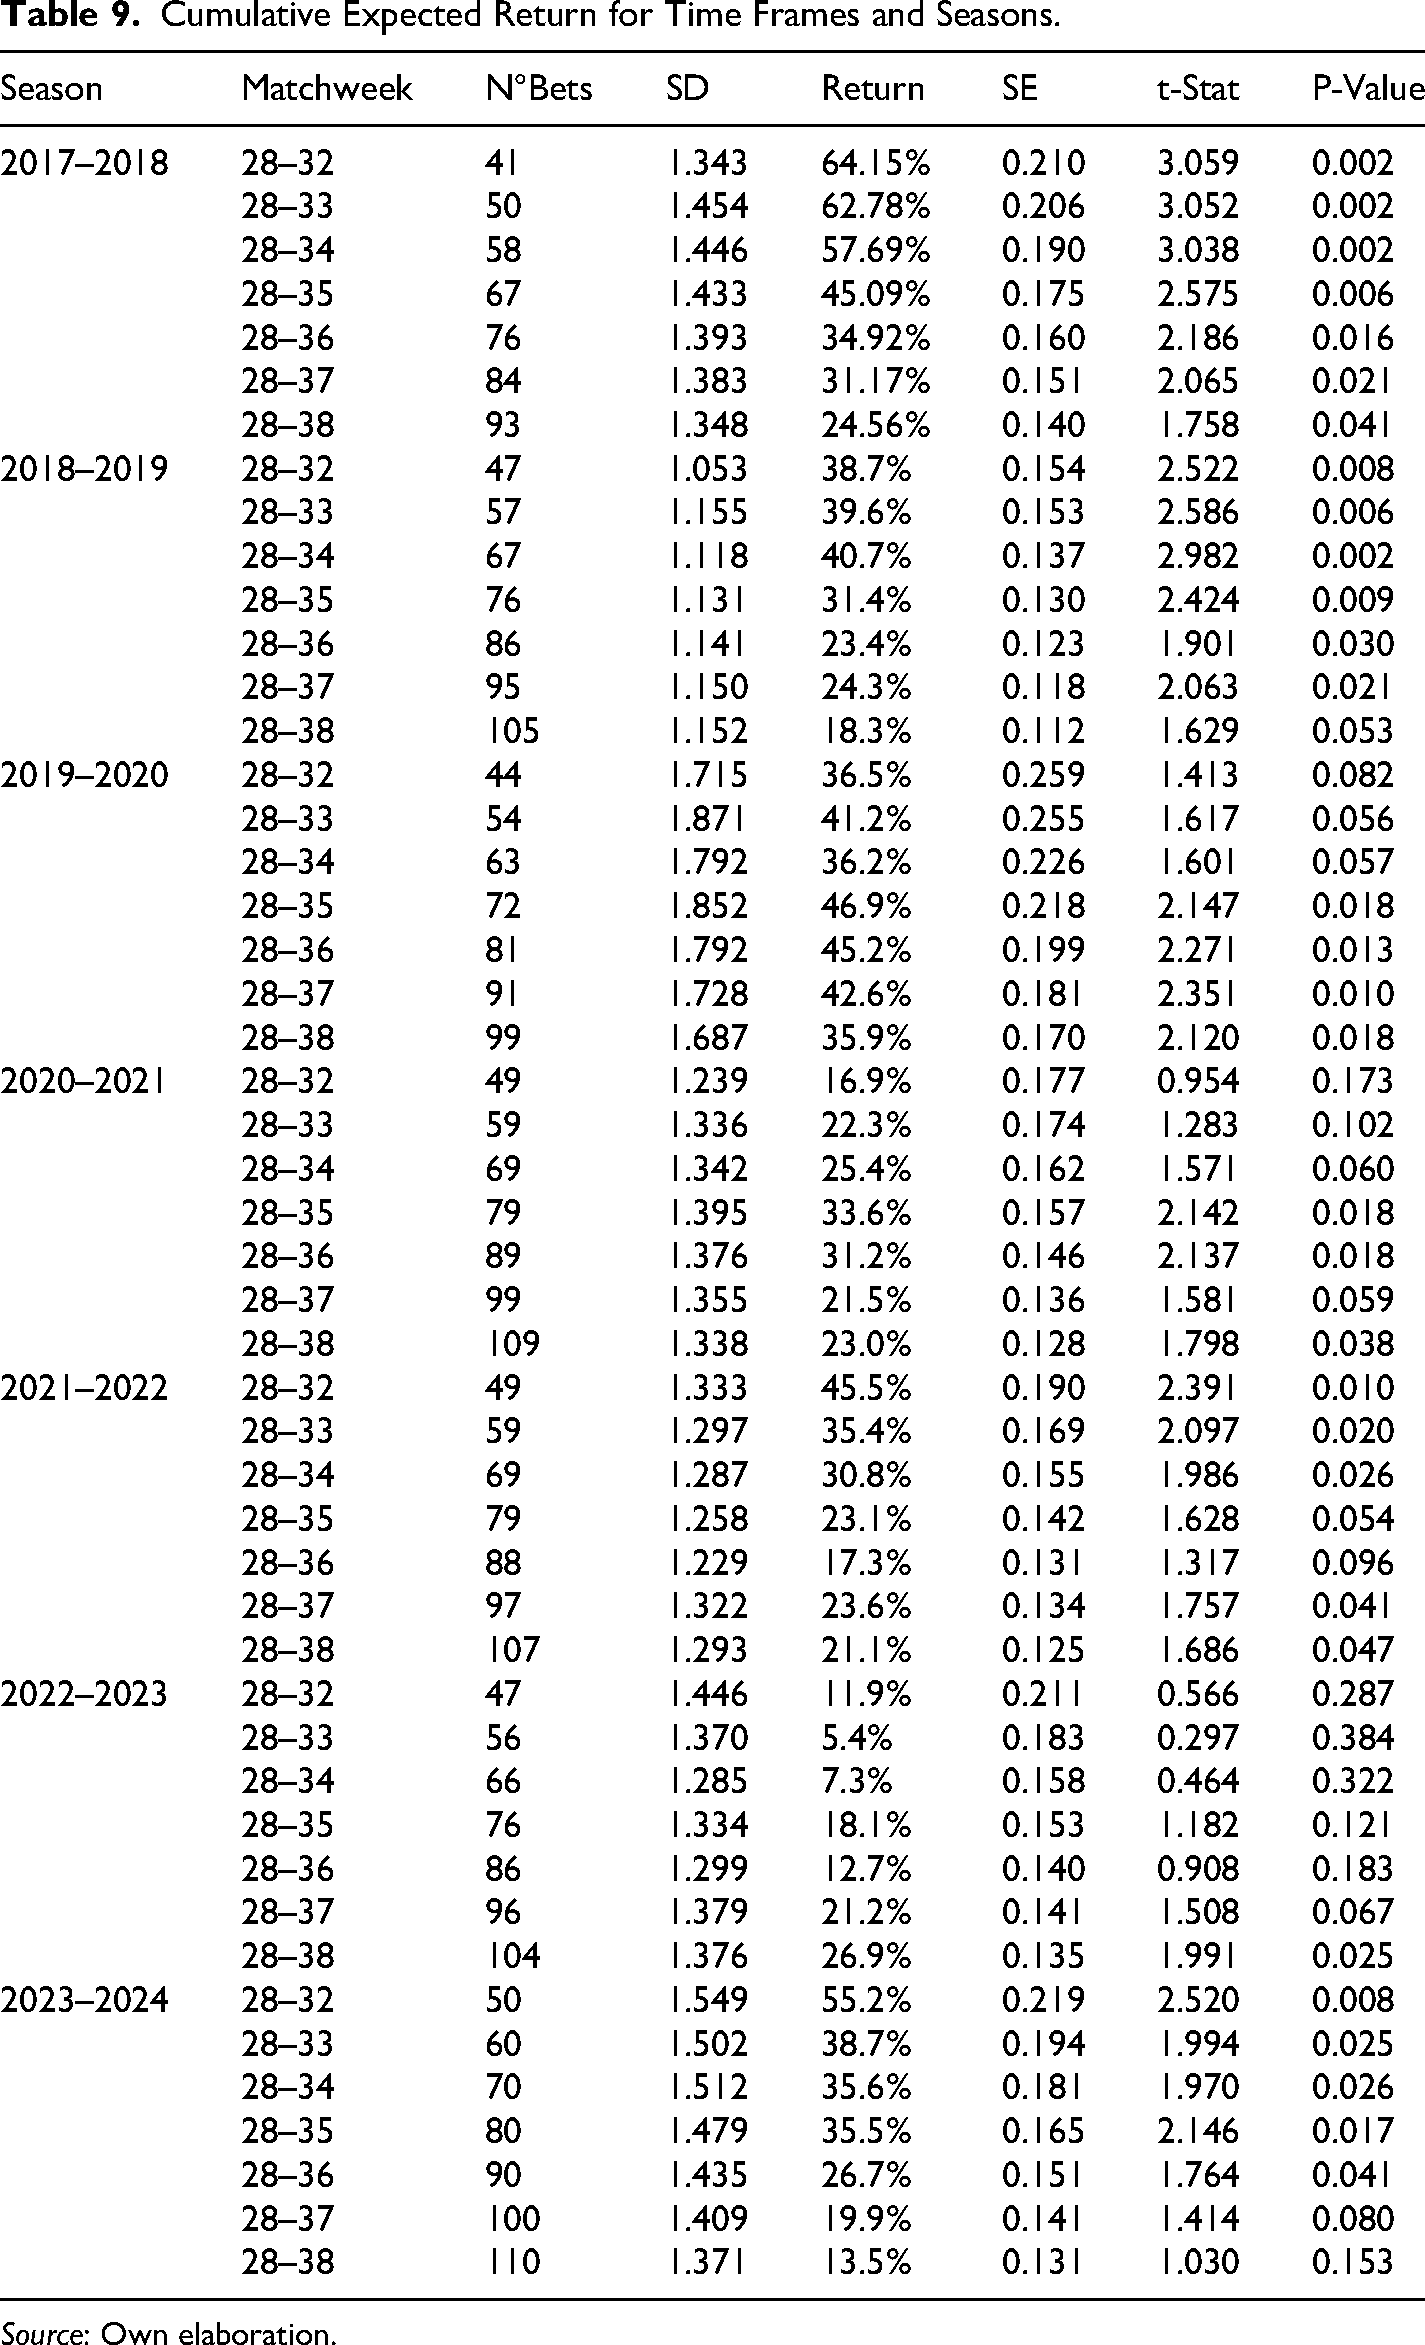
Based on these results we determine the returns obtained following the previously defined betting strategy. The results obtained are described in Table 9, which shows that the cumulative average returns are positive for all seasons and all time frames considered with 90% of confidence, except for the time frame between matchweek 28 and matchweek 38 during season 2023–2024. However, the significance tends to decrease as we approach the end of the season. These results demonstrate that, regardless of the relatively poor predictive power of the betting strategy, the major capacity to generate significant returns lies in the capacity to identify matches with odds that are poorly determined by the market, in accordance with the idea proposed in equation (4). In short, the significant returns do not stem from predicting correctly more matches, but instead from predicting smarter than the market.
Cumulative Expected Return for Time Frames and Seasons.
Source: Own elaboration.
The consistent decrease in the significance of the expected return may be because the model becomes less accurate as we approach the last days of the season. This can possibly be explained by variables or factors that are beyond the scope of the model and that manifest themselves in the last few rounds. For example, a mid-table team may be fighting to qualify for European competition or to avoid relegation when there are still several rounds left to play. However, as the end of the season approaches, there are fewer points in contention, so that some teams already have enough points to avoid relegation, but not enough points to qualify for European competition. Thus, these teams will not be motivated to play in the last few rounds. In contrast, the teams that are more on the extremes have greater incentives to play, since those at the bottom of the standings would seek not to be relegated to the second division, while those at the top would seek to access European competition positions (Champions League or UEFA Europa League) or even fight to be champions. We must also consider that the bettors (investors) have formed emotions (faith) for the teams, which would generate hunches that could go against the strategies of the teams, causing discrepancies with the facts. This may cause the model to misdetermine the probabilities of success, undervaluing the teams at the extremes of the standings and overvaluing those in the middle that do not really have strong incentives to play.
Our findings shed light that punters are not estimating match probabilities adequately. The abnormal returns obtained show that it is possible to beat the market using only public information (historical data), so we would be in the presence of a market in which the EMH is not fulfilled, even in its semi-strong form. This is even more surprising if we consider that the estimates and results presented correspond only to the English league, which is by far the deepest betting market (the most popular), so that its prices should theoretically be better allocated than in other betting markets.
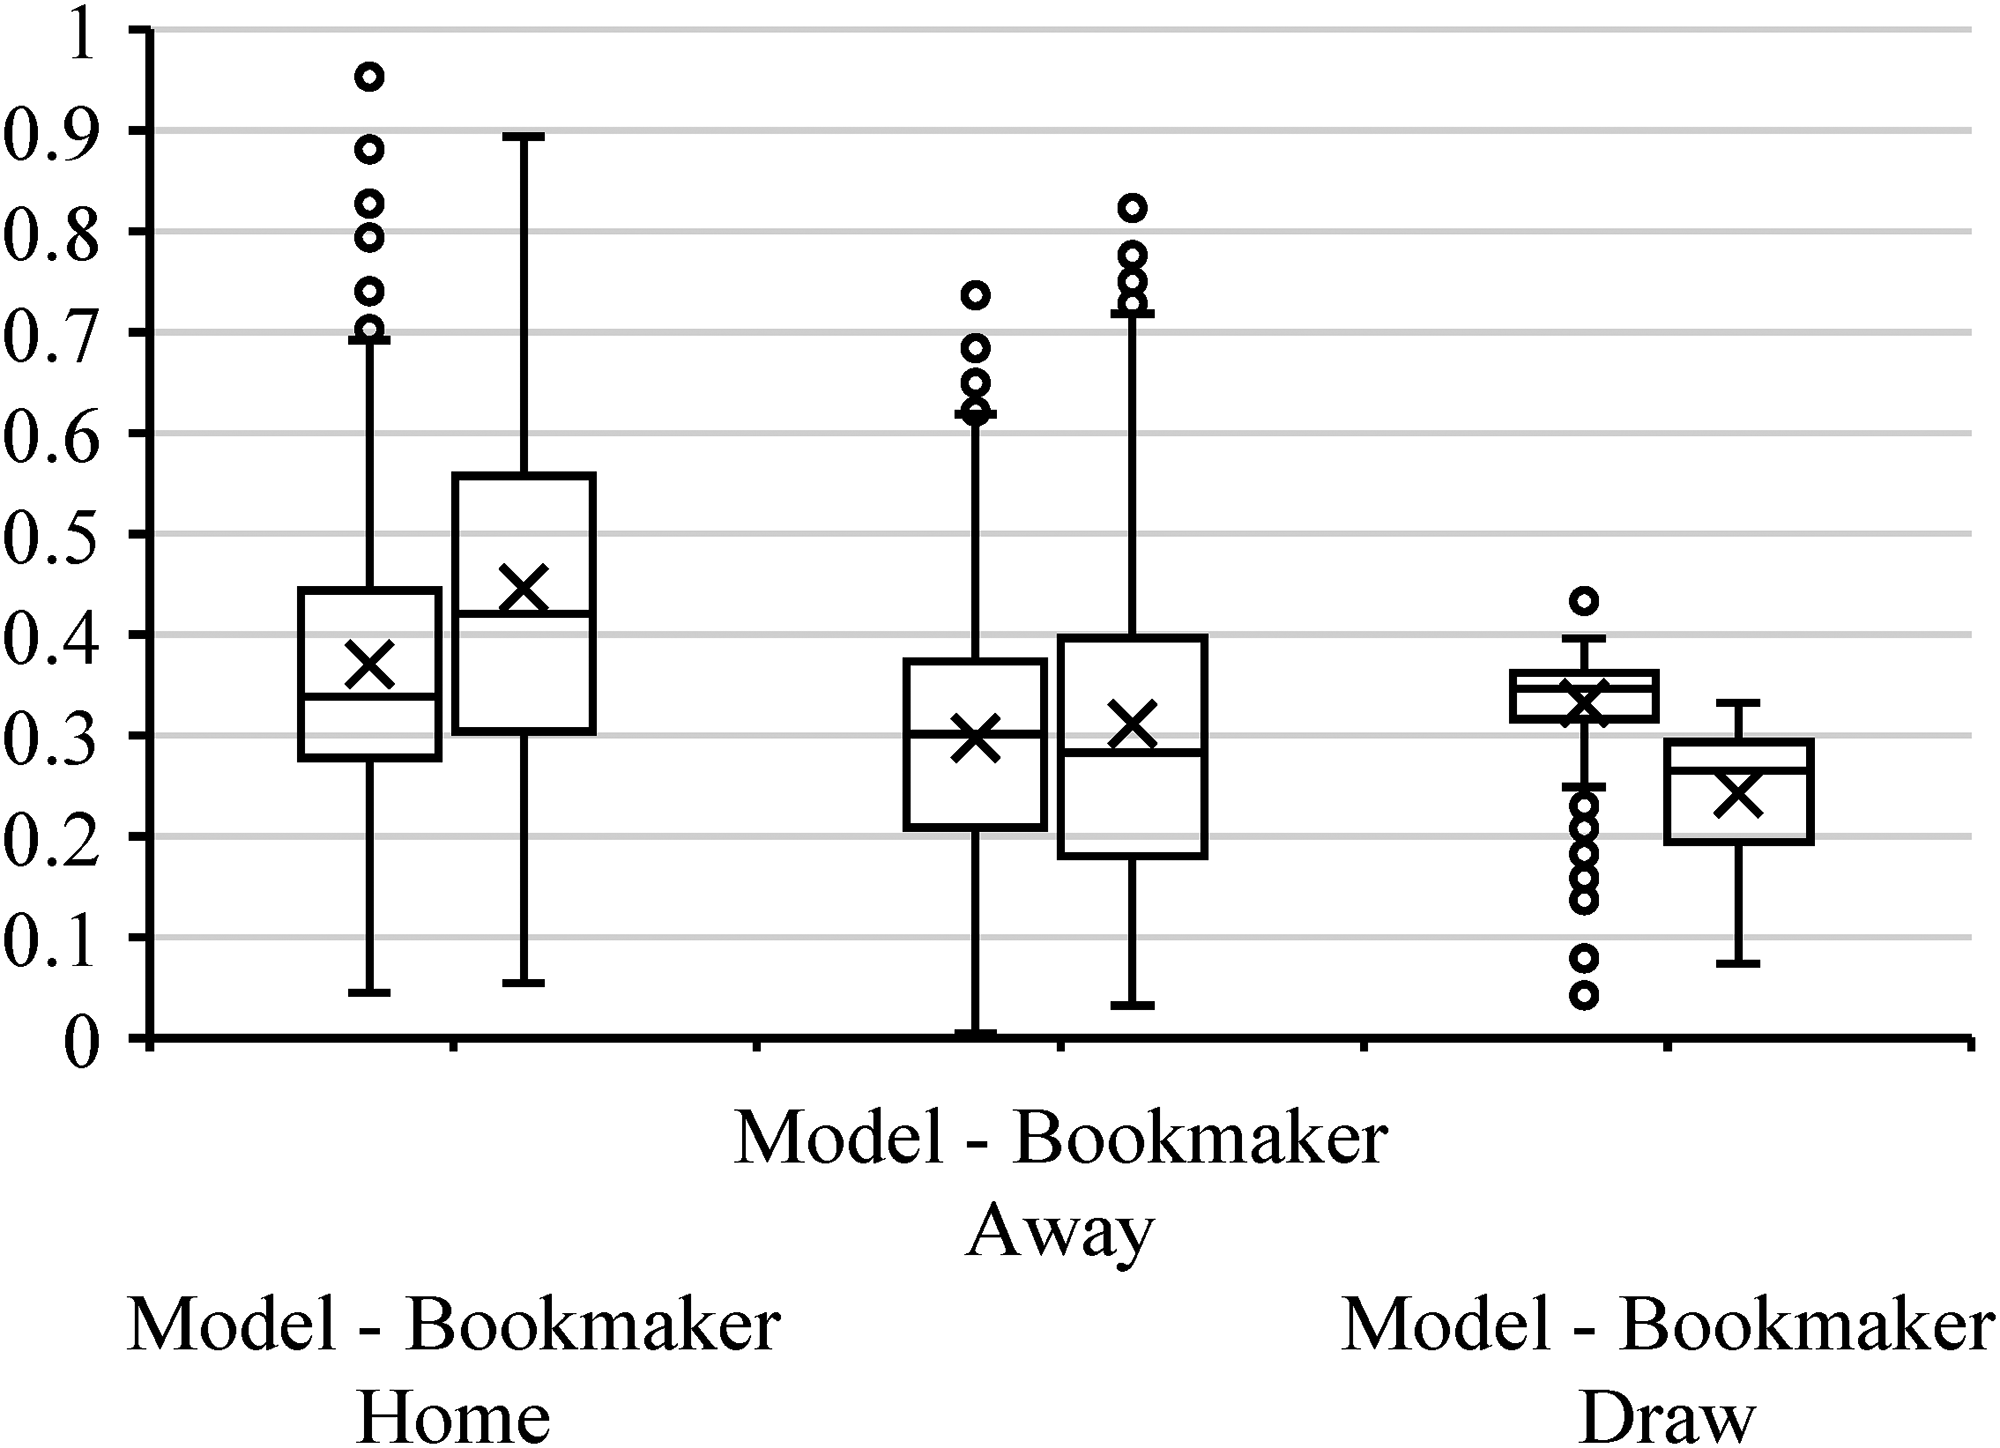
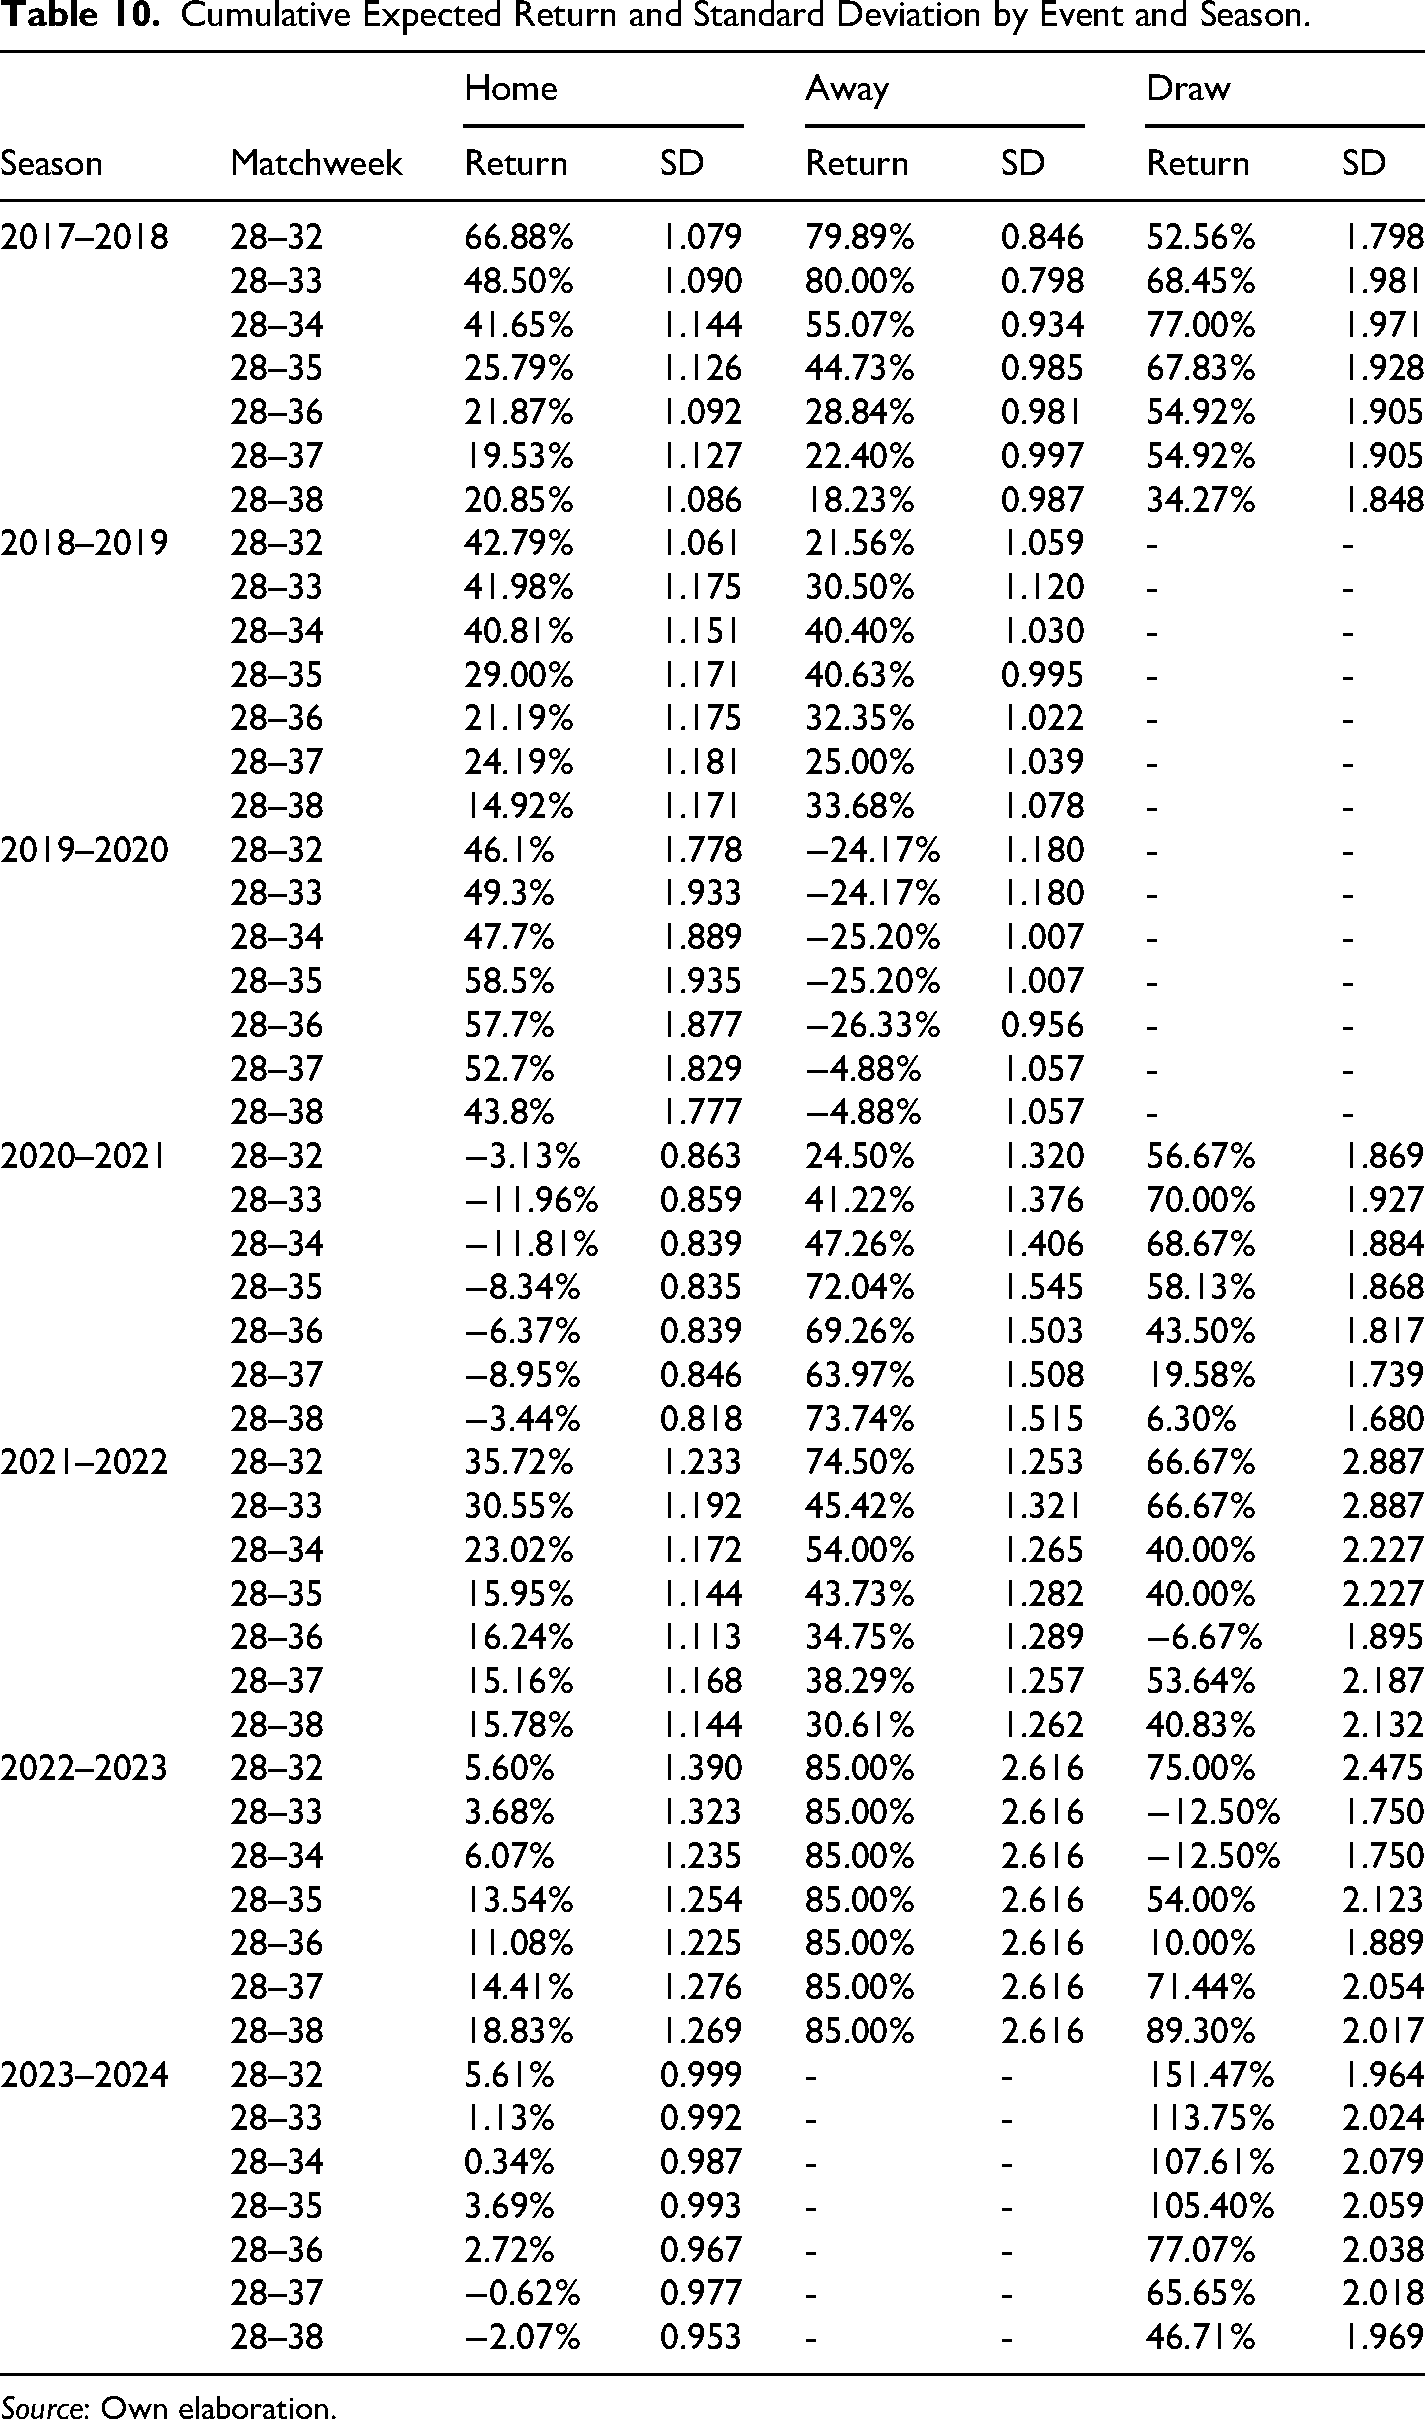
Another interesting finding that can be deduced from our evidence is that, although the model has a lower accuracy in predicting draws (see Table 10), nevertheless, within the set of bets provided by the strategy it is the one that delivers the highest expected returns in most cases and, in particular if we consider the total bets (matchweeks 28–38). This apparent draw bias is consistent with the results obtained by Pope and Peel (1989) and more recently by Deschamps and Gergaud (2007), who suggest that the market would indeed undervalue the probability of a draw. This is evidence that individuals might be engaging in irrational (hunch) biases, where draws would be considered “boring” and in general punters would prefer to bet on the victory of one of the two teams, even if this leads to suboptimal bets, fear of the draw, or that punters use mistaken heuristics to assess the odds. The same applies to the away condition, which also delivers positive and significant returns in several seasons. Not very surprisingly, there is only one season where betting to the home teams delivers the highest return, which is the season 2019–2020. This result is in line with previous findings that have found that the market has problem adjusting home team odds because of the distortion of the home advantage during the COVID-19 outbreak (Fischer & Haucap, 2021; Winkelmann et al., 2021).
Cumulative Expected Return and Standard Deviation by Event and Season.
Source: Own elaboration.
Robustness Check
In order to guarantee that the results obtained above are not just a one-tournament thing, a robustness check is necessary. To do so, data from the season 2024–2025 (last available season) was collected, not only for the EPL, but for the four major football leagues in the world (Hvattum, 2013), EPL, LaLiga (Spain), Serie A (Italy) and Bundesliga (Germany). The underlaying idea is to replicate the results obtained from using the EPL (2017–2018), whereby if findings are consistent through time and across leagues, then we can have more solid evidence of the existence of biases in football betting markets. Thus, the exact same procedure described above was conducted for these four mentioned leagues (season 2024–2025). First, the Bayesian analysis was re-run to identify deviations by comparing the odds from the markets (bookmakers) with the Steady-state Probability provided by the Markov process analysis.
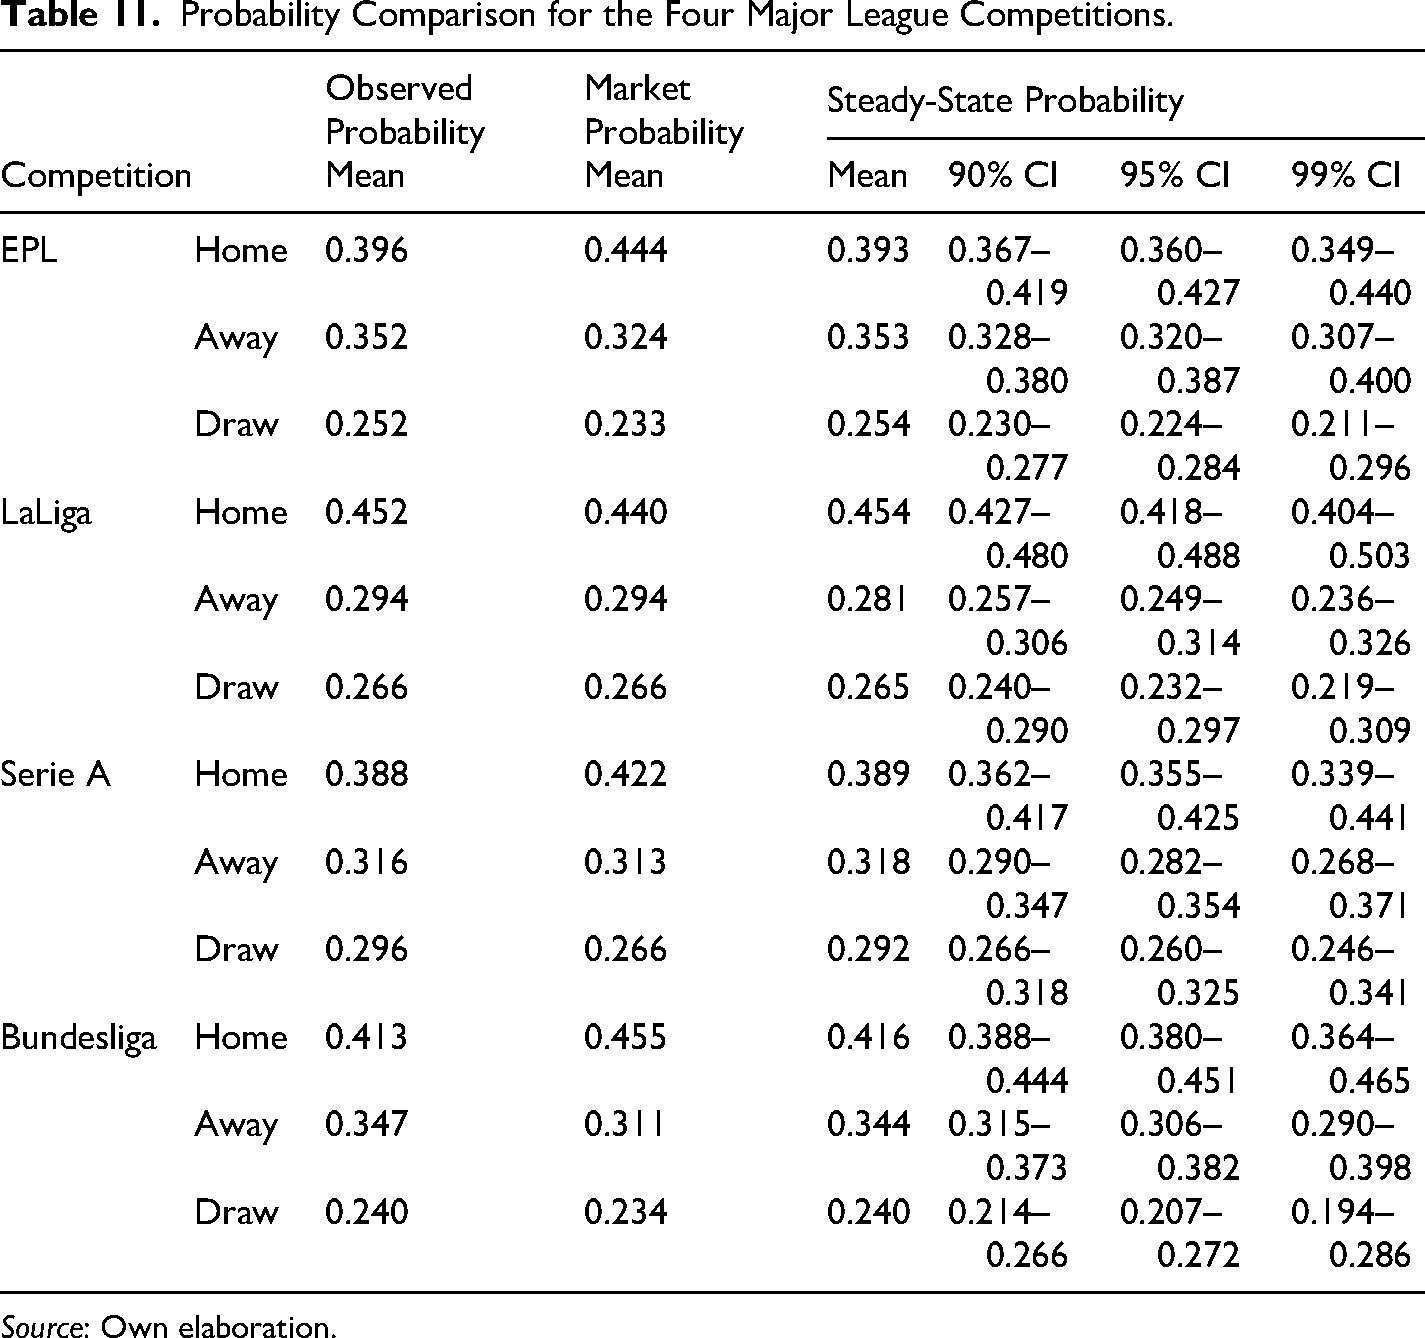
The results in Table 11 show again that, in the case of the observed probabilities (the realized odds), none of the probabilities associated with any state HAD were outside of the confidence intervals, so it can be said that there is no significant difference between the observed probabilities and the steady-state probabilities. This implies that the steady state probabilities would be a good estimate of the observed probabilities. However, in the case of the market probabilities (bookmakers), it can be observed that the mean for the “Home” scenario is consistently higher for 3 out of 4 competitions compared to the steady-state probabilities since the mean is higher than the upper bound of the confidence interval at least with a confidence of 10%. The only competition that does not comply with this is LaLiga. The above suggests that the market consistently overrates the likelihood of winning for home teams, and, since the probabilities are interdependent, it also implies that the market is either undervaluing the likelihood of draws, visitor teams (away) or both.
Probability Comparison for the Four Major League Competitions.
Source: Own elaboration.
In this respect, from Table 11, it can be observed that in the EPL, the mean of the market for the Away condition is significantly smaller compared to that for the steady-state probability since the mean is lower than the lower bound of the confidence interval at 90%. In the case of the Draw condition, it is similar, even though the mean of the market is slightly higher than the lower bound of the confidence interval at 90%. For the Serie A, the mean of the market for the Draw condition is significantly smaller compared to that for the steady-state probability since the mean is lower than the lower bound of the confidence interval at 90%, whereas for the Bundesliga, the situation is the same but for the Away condition. Regardless of the confidence interval, we also can confirm that the market underrates the likelihood of away teams and draws by noticing that the means of the market are consistently smaller for the three mentioned competitions for these conditions (except for LaLiga).
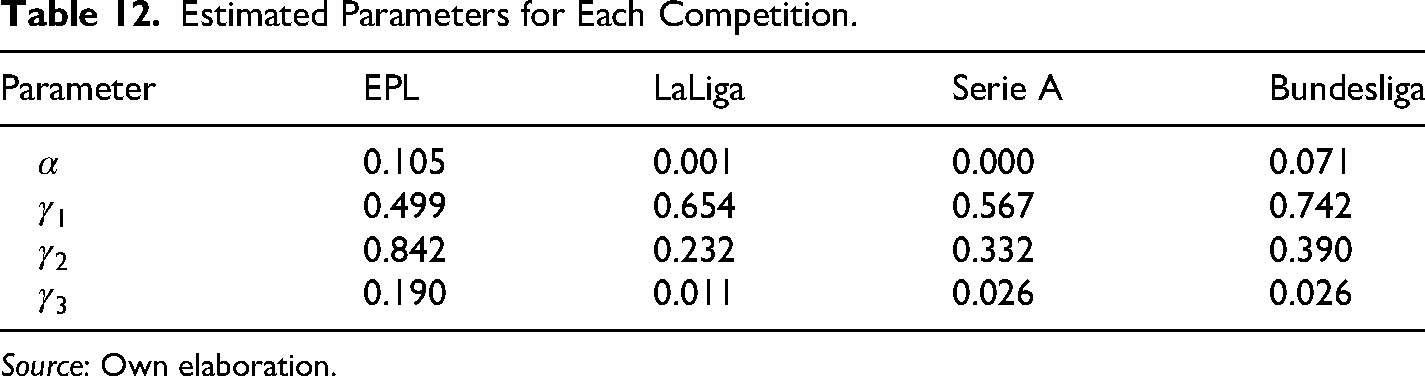
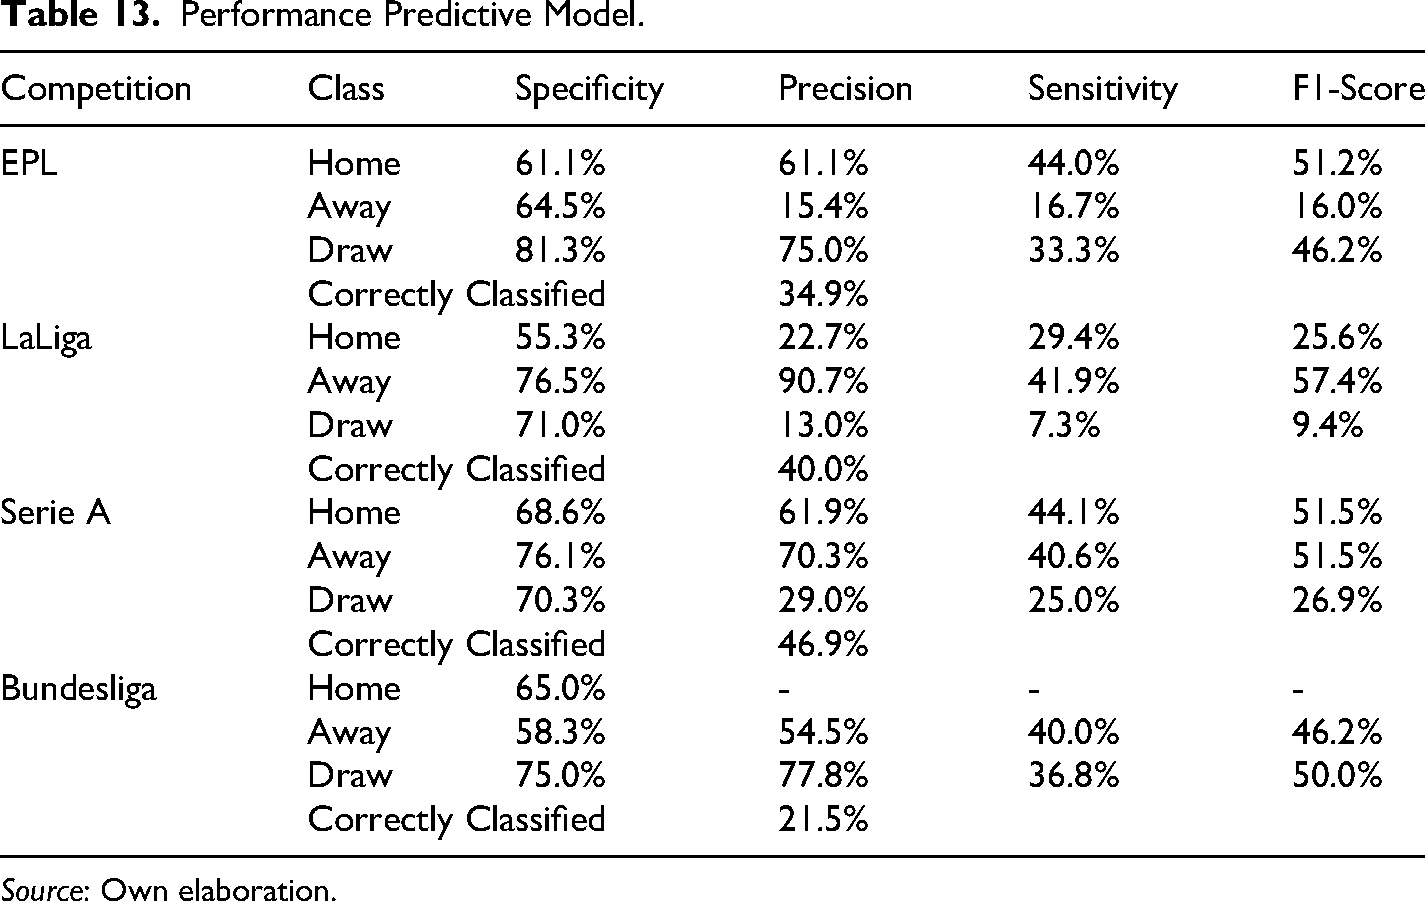
Afterwards, the estimation of the parameters for the betting model was conducted by repeating the optimization process described in Section 6. The parameters for each tournament (season 2024–2025) can be found in Table 12. Using these parameters, the prediction for the last matchweeks of each league was conducted, starting from matchweek 8, in the case of ELP, LaLiga and Serie A, it corresponds to ten weeks (from matchweek 28 to 38), whereas for Bundestliga, it corresponds only to 6 matchweeks because this tournament holds only 18 teams instead of 20. The predictive performance for each league can be seen in Table 13.
Estimated Parameters for Each Competition.
Source: Own elaboration.
Performance Predictive Model.
Source: Own elaboration.
Overall, results in Table 13 show that the percentage of correctly classified matches is far from impressive compared to the likelihood of tossing a coin, which in this case is 33.
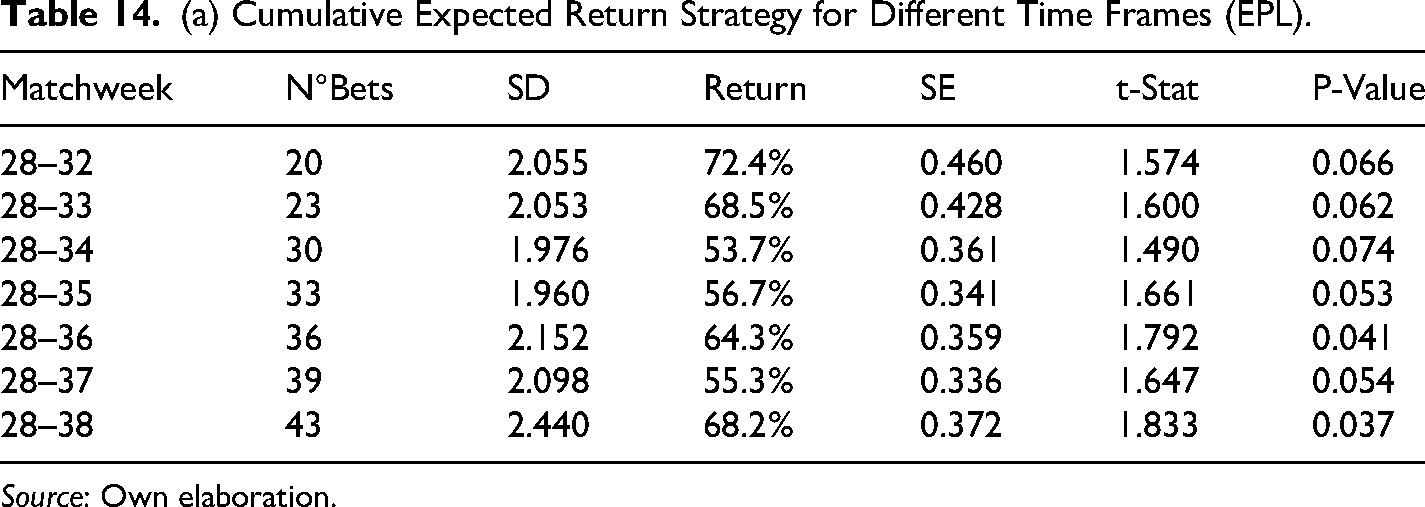
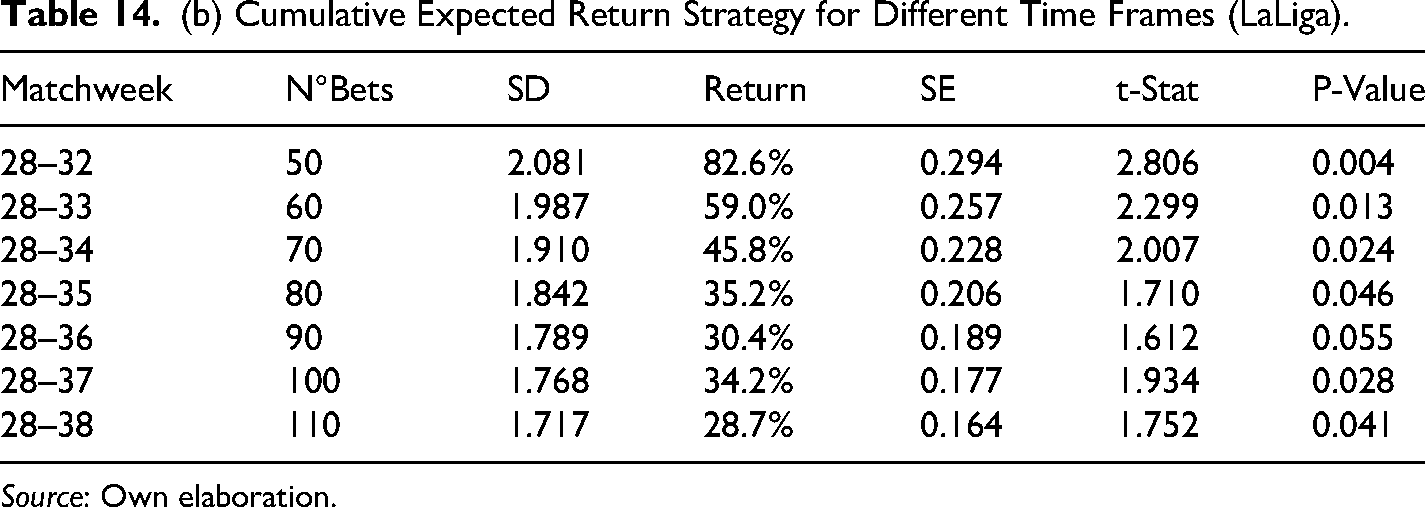
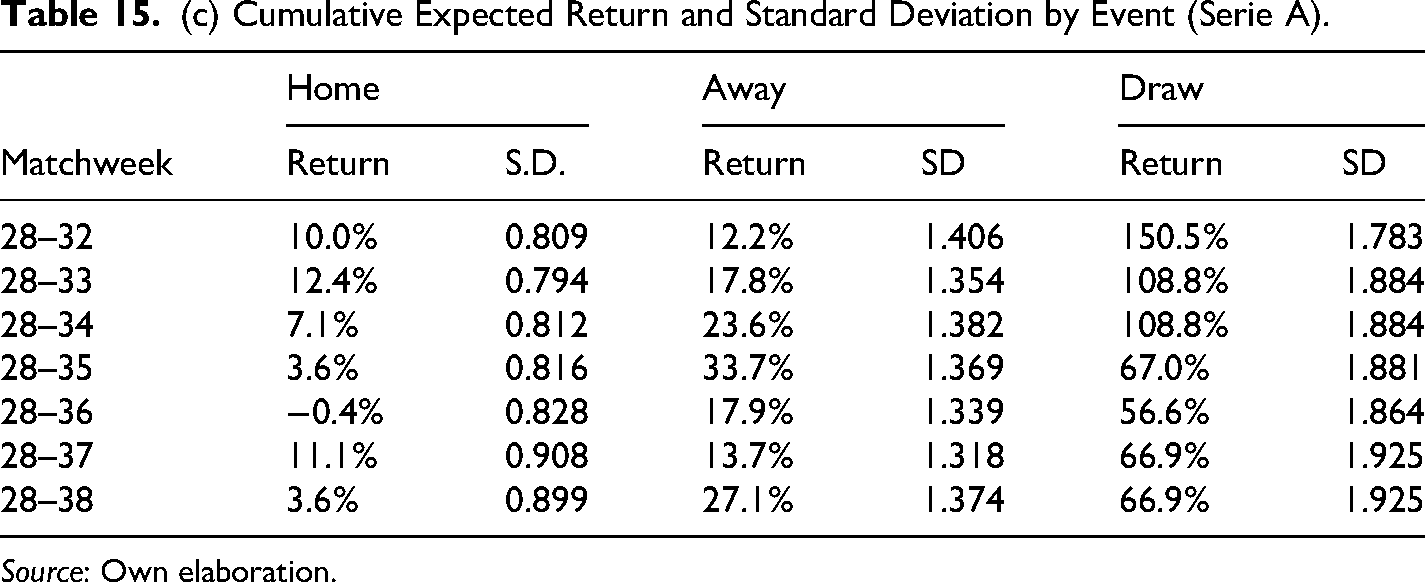
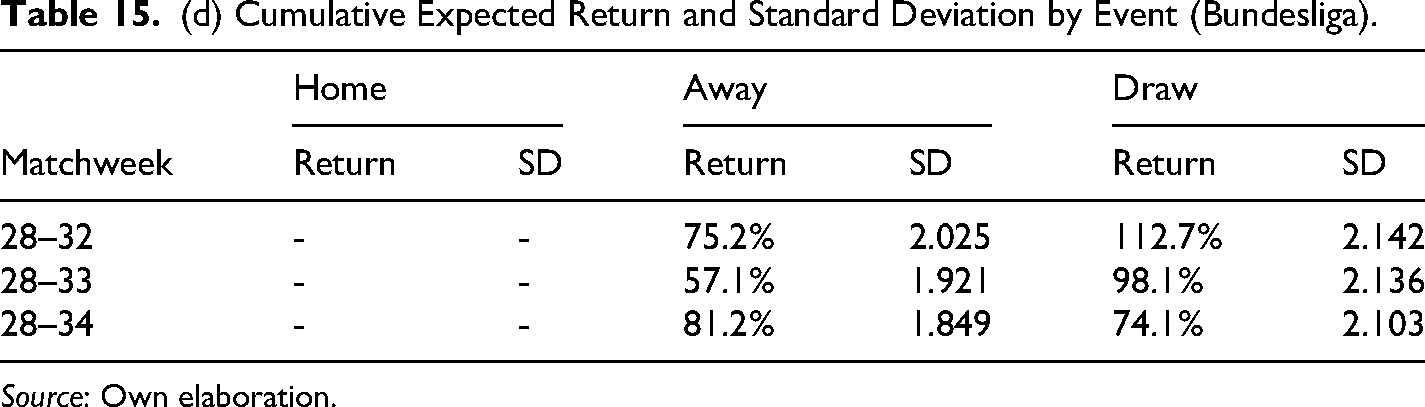
The results in Table 14 show that average cumulative returns from the betting strategy are positive for all time frames and competitions, the Bundesliga being the most profitable, or in other words, the most inefficient in financial terms with an accumulative return of 76.9% by the end of the season. Also, in all cases, the cumulative returns are statistically significant at 10% to the very least and even at 5% in most cases. These findings confirm the results found initially only in the EPL for season 2017–2018. Furthermore, results in Table 15 confirmed the existence of biases in the probability assigned to draws and away teams, where the average cumulative return for the away scenario is bigger in the EPL and slightly bigger in the Bundesliga, whereas the average cumulative return is bigger for draws in the case of Laliga and the Serie A.
(a) Cumulative Expected Return Strategy for Different Time Frames (EPL).
Source: Own elaboration.
(b) Cumulative Expected Return Strategy for Different Time Frames (LaLiga).
Source: Own elaboration.
(c) Cumulative Expected Return Strategy for Different Time Frames (Serie A).

Source: Own elaboration.
(d) Cumulative Expected Return Strategy for Different Time Frames (Bundesliga).
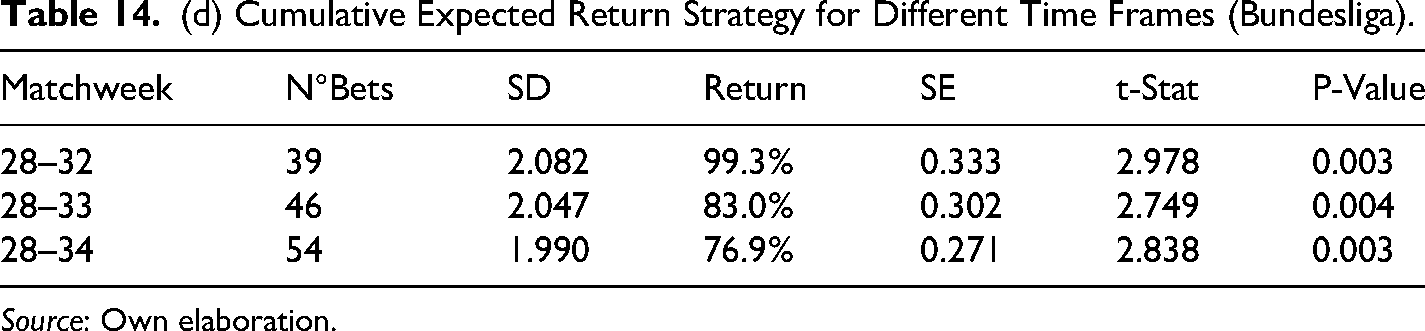
Source: Own elaboration.
(a) Cumulative Expected Return and Standard Deviation by Event (EPL).
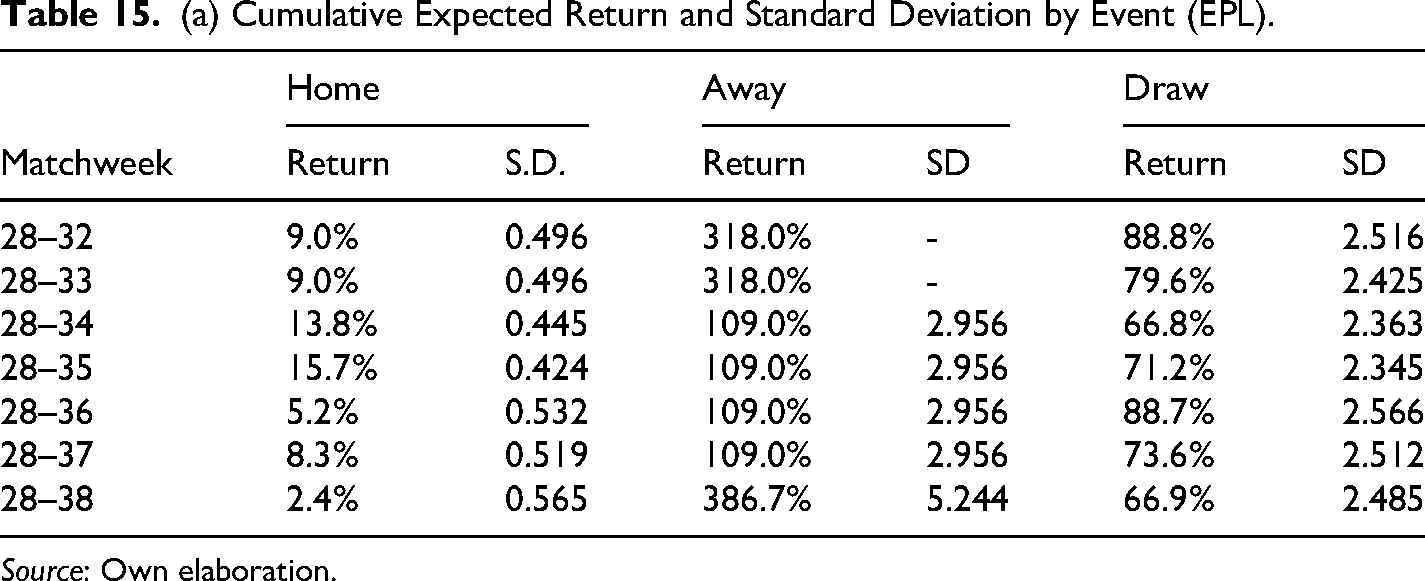
Source: Own elaboration.
(b) Cumulative Expected Return and Standard Deviation by Event (LaLiga).
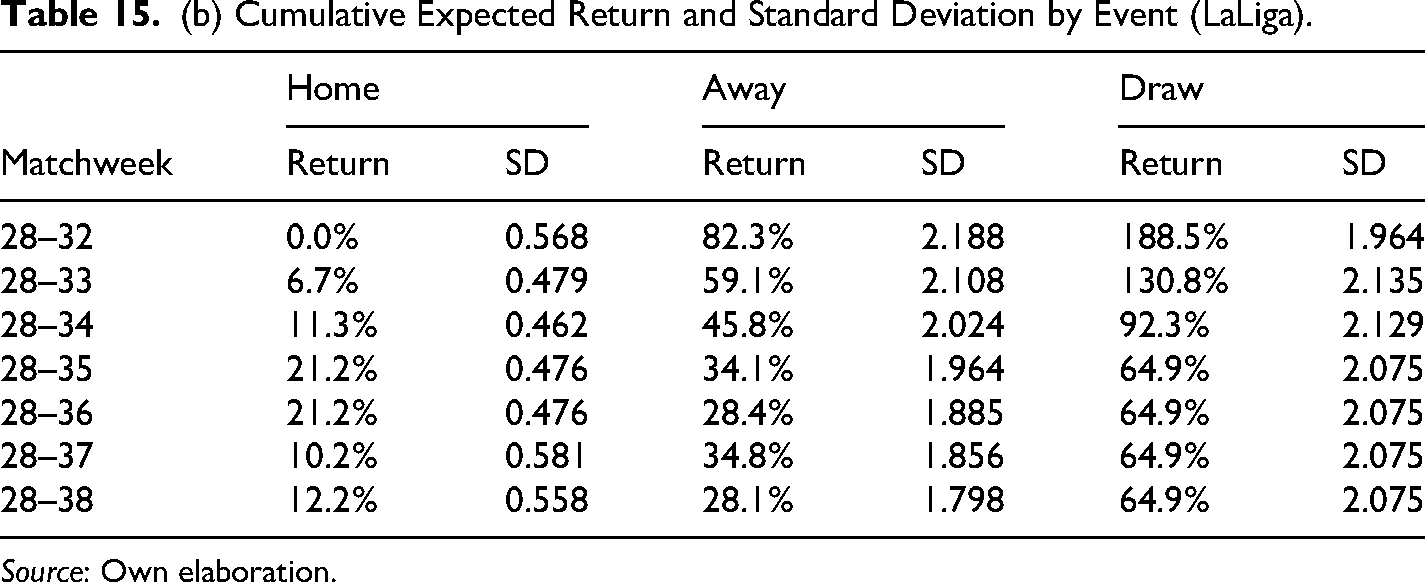
Source: Own elaboration.
(c) Cumulative Expected Return and Standard Deviation by Event (Serie A).
Source: Own elaboration.
(d) Cumulative Expected Return and Standard Deviation by Event (Bundesliga).
Source: Own elaboration.
Discussion
Overall, the results from the analysis of the EPL (from 2017–2018 to 2023–2024) and the replication for the four major European competitions in the season 2024–2025, confirm the existence of biases that lead to profit opportunities in these markets. In essence, betting markets should comply with many properties of financial markets, as they are based on information on the performance of teams (Ottaviani & Sørenson, 2009; Thaler & Ziemba, 1988; Williams, 1999) that is publicly available and there is a huge number of transactions that, in theory, should prevent individuals from any long-term profit opportunity.
The result of draws and away conditions being, on average more profitable for a punter is an indicator of the possible presence of the biases mentioned above. Specifically, the profitability of the away condition for the four leagues suggests that punters use the home condition as a mistaken heuristic (Tversky & Kahneman, 1973) when they set the probabilities, however, we can notice that in the case of the season 2017–2018 the away condition was the least profitable, meaning that in that case punters used the away condition as the mistaken heuristic. The reason behind this change of behavior can be explained by a change in the behavior of the competition itself. For instance, for the season 2017–2018 there were 100 away wins out of 360 games, whereas in the season 2024–2025 there were 124 away wins out of 360 games. The above suggests that in the first case, the away condition was overestimated by the market, this being the mistaken heuristic, while in the most recent season, given the change in the behavior of the tournament, the home condition worked as the mistaken heuristic (164 in 2017–2018 vs 146 in 2024–2025).
With respect to the draw condition, it has been proved to be consistently more profitable than the home condition and more profitable than the away condition in half of the cases. The above suggests that punters are reluctant to bet on draws because they consider it not appealing from a consumption point of view, being consistent with the idea of betting on markets as consumers who look for entertainment to certain extent (Humphreys et al., 2013; Mao et al., 2015; Stetzka & Winter, 2023). The above should be particularly true for individuals that are more casual bettors. On the other hand, punters that are interested in generating profit can be more reluctant to bet on draws because it generates more negative emotions (Hsee et al., 2001) on average through the game, because a draw is a result that can change at any instant during the development of the game. Also, the mistaken heuristics may make punters underestimate the probability of draws because it is the least common result across all competitions.
The results of the model indicate that it is feasible to systematically achieve positive returns within the football betting market. Nevertheless, beyond the behavioral biases that shape punters’ decisions, even those who attempt to wager according to ostensibly “rational” principles face inherent cognitive constraints that limit their ability to process all relevant information (bounded rationality) (Simon, 1955). Although certain “expert” punters may possess extensive knowledge regarding the performance of numerous teams, it remains improbable that they can sustain a sufficiently comprehensive understanding of enough teams each week to effectively diversify their bets and mitigate the stochastic nature of football outcomes. However, because individuals can account for a variety of unobservable factors, such as playing style, psychological dynamics, and team weaknesses, they may be better positioned to detect isolated mispriced matches with greater accuracy than algorithmic models. Accordingly, the optimal betting framework would integrate both computer-based predictions, which provide statistical regularity and diversification through the law of large numbers, and human expert judgment, which introduces contextual insight and nuanced interpretation of variables that are difficult to operationalize within computational models.
For financial markets, it is quite unlikely that biases such as the consumption effect are present, considering that financial markets do not offer entertainment and are purely thought of as investment. Nonetheless, it might be the case that some biases arise because of heuristics or the emotional influence. For instance, Chu et al. (2014) studied the influence of loss affect on investors and how the capacity of expert investors to cope with the negative emotions of losses allows them to achieve a better financial performance.
In this respect, these biases may have a role in the short run in financial markets and can explain, at least in part, some unexplained phenomena like over reactions of the market or the overpricing that has been widely documented to happen during IPOs (Allen & Faulhaber, 1989; Ibbotson, 1975). For instance, Lezana et al. (2024) found that unicorns tend to have higher underpricing compared to non-unicorn firms when they open to the stock market. In this scenario, the unicorn label may act in the same way as the fame and reputation of some teams in betting markets. On the other hand, unicorn firms, whose values rely heavily on intangible assets by their nature, are also riskier for investors, which can lead to emotions like fear. This behavioral explanation is consistent with the idea posed by recent research, arguing that some financial phenomena hold a psychological nature (Adams et al., 2008; Chen, 2021).
Conclusions
Although there is a large literature that seeks to study inefficiencies in sports markets, which in essence should comply with the same principles as financial markets, few studies have focused their attention on the possible biases that exist on the part of agents within the financial market when using the available information to make decisions with uncertainty. Such biases would be associated with hunches (favoritism), heuristics, or perceptions of the utility generated by the bet itself. Thus, it is considered that sports betting markets, unlike financial markets, could be significantly influenced by agents’ beliefs and emotions.
After analyzing the available information, we found evidence of the existence of bias on the part of punters (investors) in the football (soccer) betting market, which seems to be associated with their heuristic evaluations, and influenced by emotional grounds (not very rational) rather than on a logical analysis based on the available information. When we consider betting as a Markov process, conditional on the results obtained in the previous matchweeks, we obtain that punters should have better returns than those observed in practice, which seem to concentrate on the away or draw, causing inefficiency in this market. This may be also related to what Allais (1953) proposed, where betting on a draw would be a more “boring” outcome than betting on a loss, causing the aggregate market to undervalue the probability of a draw and overvalue the probability of the home team.
This research also shows that by using available information with some procedures such as gambling strategies and known estimation models, it is not only possible to achieve market efficiency, but also to obtain time-consistent positive abnormal returns (beating the bookmaker). These findings also suggest that in the aggregate, draws and away bets potentially yield the highest returns, but also exhibit the most volatility. This leads us to believe that our evidence may have important implications for the study of financial markets and behavioral finance, where, although it has been shown that EMH tends to be met in general, it is still not clear how, under certain abnormal conditions, investors would be able to meet EMH, investors could be putting into practice their hunches (emotions and irrationality), since in the financial market there is not an end of season, but a continuous process, which could attenuate these biases making them less visible in the estimates.
Beyond the realm of sports betting, the implications of this research extend to financial markets, where pricing anomalies and persistent inefficiencies continue to puzzle scholars and practitioners alike. The observed behavioral distortions, such as the longshot bias, emotional aversion, and the impact of salient outcomes, mirror known deviations from rationality in investor behavior. By showing that profitable strategies can be built without informational advantage, this study contributes to the broader discussion on how psychological and structural factors shape market outcomes. These parallels underscore the value of using betting markets as simplified laboratories to test theories of market behavior and to uncover universal principles that govern price formation and decision-making under uncertainty.
Finally, it is necessary to emphasize the limitations of the present work and the pre-established model. On the one hand, we present a static model in which the parameters remain constant over time. Also, these parameters are common for all the teams in the league. It should be noted that the model assumes the independence of the performance of the teams playing at home with respect to their performance playing away, which is an assumption used in works such as Maher (1982) and Dixon and Coles (1997). For its part, the methodology used is limited to controlling for the possible effect of information asymmetries by choosing a league that is as robust as possible in terms of the number of punters and depth, as well as by using only information available to all individuals before each matchweek. Nevertheless, it is expected that the results of this work show sufficiently accurate approximation to reality to reflect the biases that would exist in the market. Thus, it is left for future work to try to find more dynamic models that better adjust to the probabilities that the market should assign given the available information and incorporate additional variables that control for other possible biases.
Footnotes
Funding
The author received no financial support for the research, authorship, and/or publication of this article.
Declaration of Conflicting Interests
The author declared no potential conflicts of interest with respect to the research, authorship, and/or publication of this article.