
Abstract
Nurse Managed Health Centers (NMHCs) provide a critical safety net function in their communities, yet they often remain invisible and challenged in terms of financial sustainability. This paper presents a comparison of demographics and financial status of NMHCs and Federally Qualified Health Centers (FQHCs). The comparison is based on four years of annual NMHC national survey data that includes 42 NMHCs overall and the 2008 FQHC data in the Uniform Data System. Findings indicate that NMHCs and FQHCs serve very similar diverse populations yet funding and revenue differences were significant. NMHCs tend to rely more on grants and donations from the private sector as well as contracts while FQHCs have access to considerable federal support that is cost based when serving the underserved. In addition, NMHCs are challenged by the array of state, federal and third party insurers’ regulations that often disadvantage nurse practitioners as primary care providers.
Nurse-managed health centers (NMHCs) have historically provided primary care to diverse populations, including those in need of a safety net (King & Hansen-Turton, 2010; Mezey, Baisch, Kinsey, Torrisi, & Huether, 1999; Pohl, Vonderheid, Barkauskas, & Nagelkerk, 2004). In 2004, Pohl and colleagues presented clinical and financial data from six NMHCs, all associated with schools of nursing in public universities in Michigan, and compared their demographic, payer mix, and cost data with Federally Qualified Health Center (FQHC) data. FQHCs are the largest safety net providers and are funded by the Health Resources and Services Administration (HRSA) Bureau of Primary Health Care. FQHCs are largely Community Health Centers (CHCs), though they also include Health Care for the Homeless, Public Housing Residents, and Migrant Workers. At the time of the 2004 comparison, NMHCs had strong similarities with FQHCs in terms of the populations being served, diagnoses, and payer mix. Yet documentation of NMHCs financial support was reported as coming from nonfederal grants and contributions from the school/university level. That is, the public universities were often providing NMHCs with the additional funding needed for sustainability comparable to FQHCs’ federal grant funding (Pohl et al., 2004). Additional challenges face NMHCs related specifically to nurse practitioner and nurse midwife reimbursement policies by insurers, including Medicaid and Medicare (Hansen-Turton, Ritter, Rothman, & Valdez, 2006; Naylor & Kurtzman, 2010; Pohl, Hanson, & Newland, 2010; Pohl, Hanson, Newland, & Cronenwett, 2010)
With the passing of the Patient Protection and Affordable Care Act (PPACA) in March 2010, more than 30 million people will gain access to quality primary care by 2014. NMHCs are part of the solution to increased access to care (Naylor & Kurtzman, 2010). Although a promising safety net, NMHCs have provided limited information on their business practices and their financial sustainability in the current market place. The purpose of this article is to present an update on the comparison of demographics and financial status of NMHCs and FQHCs. This comparison is based on 4 years of annual NMHC national survey data that include 42 NMHCs overall(on average, 22 centers contributed data in a typical year to the NMHC survey) and the 2008 FQHC data in Uniform Data System in which 1,080 centers submitted data as required for their funding.
Nurse-Managed Health Centers (NMHCs)
NMHCs are service sites that provide comprehensive community-oriented primary care, often across all ages. The majority of care is provided by nurse practitioners in collaboration with other nursing and healthcare providers (e.g., physicians, dentists, social workers). NMHCs are often associated with academic institutions, providing educational settings for undergraduates and graduate students across disciplines (Pohl et al., 2004; Tanner, Pohl, Ward, & Dontje, 2003). In addition, there are some independent, free-standing nurse-led practices; however, little information and data are available on these independent practices compared to those associated with academic centers. In fact, there is no national directory on NMHCs that includes all of the various types of nurse-led primary care, making access to national data even more challenging. In 1995 the National League for Nursing (Lockhart, 1995) estimated there were 250 nurse-managed centers. In a more recent survey of academic NMHCs (Pohl et al., 2007) 168 were identified from 565 schools of nursing. In addition, there are numerous, but unknown numbers of independent nursing practices that would meet the criteria of the definition of a NMHC.
Historically, NMHCs have their roots in the communities they serve (Lundeen, 1999; Oros, Johantgen, Antol, Heller, & Ravella, 2001; Pohl, Barkauskas, Benkert, Breer, & Bostrom, 2007) and represent a model that is similar to FQHCs’ Community Health Centers (Pohl et al., 2004) increasing access to care for at risk populations. NMHCs are patient centered and typically embrace the qualities of the patient-centered medical home (PCMH) including a full spectrum of preventive, curative, longitudinal, and coordinated care (Keckley & Underwood, 2008; The Robert Graham Center, 2007). Care involves clearly defined provider–patient relationships, primary care standards of accessibility, continuity, comprehensiveness, and integrated care and is often interdisciplinary. The Commonwealth Fund Issue Brief (Coleman & Phillips, 2010) presented the challenge to safety net providers such as FQHCs and similar centers such as NMHCs in meeting all the criteria of the PCMH. Despite their effective community partnerships, after-hours care and culture of patient-centered and community-based care, these safety net providers are often challenged by transient patients, those with unstable insurance, and part-time and volunteer providers. They may also lack the needed financial support for care coordination (Coleman & Phillips, 2010). Without access to funding to support the needed components of a PCMH, NMHCs have historically funded their “health care homes” through an array of grants and donations (Pohl et al., 2004). Despite these challenges, health outcomes and quality of care in NMHCs, especially those with chronic disease patients, are reported to be high (Barkauskas, Pohl, Benkert, & Wells, 2005; Barkauskas, Pohl, Tanner, Onifade, & Pilon, 2010) and patient satisfaction tends to be exceptionally high (Benkert et al., 2002). The NMHCs are additionally challenged, however, by the array of reimbursement and regulation issues for nurse practitioners, making sustainability a major challenge (Pohl, Hanson, Newland, & Cronenwett, 2010).
Federally Qualified Health Center (FQHC)
The term “federally qualified health center” refers to three different types of clinics funded under Section 330 of the Public Health Service Act and includes community health centers, migrant health centers, and public housing primary care centers. Additional groups that are considered by HRSA as meeting the definition of a “health center” includes the FQHC-Look-Alikes (although they do not receive 330 grant funding) and outpatient facilities/programs operated by tribal organizations under the Indian Self-Determination Act or Indian Health Care Improvement Act (HRSA, 2006). For the purposes of this article, comparisons were made only to those health centers funded under Section 330 of the PHS Act and which report financial and quality data annually using the Uniform Data System. FQHCs are required to directly provide or arrange by referral the following services to underserved communities: primary health care services for all ages, basic lab services, emergency care, radiologic services, pharmacy, preventive health, preventive dental health, transportation, case management, dental screening for children, after hours care, and hospital/specialty care (HRSA, 2006).
The Safety Net: NMHCs and FQHCs
The Institute of Medicine’s (IOM, 2011) report on America’s Health Care Safety Net: Intact but Endangered (Lewin & Altman, 2000) stated that “in the absence of universal health insurance, a health care ‘safety net’ is the default system of care. . . .” (p. 1). The IOM report goes on to say that the safety net system has never been very robust financially, yet it survives. Although the IOM report did not list NMHCs as safety net providers, they often meet the definition as put forth by the IOM: “Offer care to patients regardless of their ability to pay for those services; and a substantial share of their patient mix are uninsured, Medicaid, and other vulnerable patients” (Lewin & Altman, 2000, p. 1).
In an earlier work documenting the clinical and financial status of six NMHCs in one state (Pohl et al., 2004), comparisons were examined between NMHCs and FQHCs for the first time. Findings indicated at that time that the six NMHCs reported a wide variation in uninsured patients (0%-60%) whereas FQHCs in the same year reported their uninsured at 40%. When funding sources were compared, similarities between NMHCs and FQHCs were striking. Revenue based on third-party reimbursement for the six NMHCs had a mean of 48% compared to 55% for FQHCs. Grants and university contributions as a source of revenue had a combined mean of 50% for the NMHCs compared to 39% for FQHCs. Other donations for the NMHCs amounted to only 2% of revenue whereas for FQHCs other donation/program revenue amounted to 6%. What was evident was the substantial level of grant funding and university donations to keep the NMHCs afloat (Pohl et al., 2004). This funding was comparable to what FQHCs required through the Bureau of Primary Health Care grants. No further studies have been published since the 2004 study that documents NMHCs’ funding and sustainability. Unless NMHCs are also FQHCs—and there are a few—clinical and financial data for NMHCs are not systematically reported, except for those who submit data to the Institute for Nursing Centers’ (INC) NMHC National Data Survey.
Funding Sources for NMHCs and FQHCs
NMHCs generally receive funding from local communities in which they serve: schools of nursing and/or their universities, foundation grants, and the HRSA Bureau of Health Professions, Nursing Education, Practice, Quality, and Retention grants. This latter funding is linked to schools of nursing funding but has not produced standard productivity data to date. In the 2010 PPACA, US$50 million was allocated for funding NMHCs similar to the FQHCs funding described below. Unfortunately, the US$50 million from PPACA was not appropriated; US$20 million was in the budget for 2011 but is also unlikely to be appropriated. In addition, the ability to renew funding (if appropriated) has not been established for this NMHC program. At this time, HRSA designated US$15 million for 3 years of funding for 10 NMHCs (US$500,000/year) in 2010.Although FQHC funding is significantly higher than funding for NMHCs, recent legislation (H.R. 1473) attempted to reduce discretionary funding for health centers by US$600 million.
Financial support for FQHCs is derived from two main sources: HRSA Bureau of Primary Health Care grants to supplement care for the uninsured (Health Centers Consolidation Act of 1996) and Medicaid/Medicare Prospective Payment funding, commonly known as “wrap-around payments” (Medicare, Medicaid, and SCHIP Benefits Improvement and Protection Act of 2000; Medicare Prescription Drug Improvement, and Modernization Act of 2003). FQHCs receive annual grant funding from the Bureau of Primary Health Care in varying amounts; the smallest base grant award is currently US$650,000 per year (Primary Care Community Health Centers/ FQHCs receive this base award; special population grantees—Public Housing, Migrant and Homeless—receive a lesser amount). The FQHC must use this money to offset operating expenses in the care of uninsured patients. UDS data are collected and a Medicare Cost Report is filed along with an independent audit to document the use of these funds annually. Long established FQHCs and those that have taken advantage of HRSA’s service expansion grants in years past can receive substantially more base grant funding. For example, if a FQHC expanded its medical capacity by offering additional hours, sites, or new services when HRSA opened up funding for such expansion, the base grant award would be adjusted to reflect this expanded capacity, resulting in a higher grant amount each year forward. In the past decade HRSA funded “New Starts,” which allowed both new FQHC applicants and current FQHCs to apply for funding to expand to new sites. Existing FQHCs were often very successful in such applications, which resulted in significant increases in their annual grant awards for operating expenses.
The second source of FQHC funding that clearly differentiates NMHCs from FQHCs is the Medicaid and Medicare Prospective Payment System. Although this funding mechanism is called “prospective payment,” the payments are not made until after clinical services are delivered to patients. Medicaid prospective payment was authorized by the Medicaid, Medicare, and SCHIP Benefits Improvement and Protection Act of 2000 (Section 702); Medicare prospective payment for FQHCs was authorized by the Medicare Prescription Improvement and Modernization Act of 2003 (Section 237).State Medicaid programs are required by federal law to determine the cost per visit to every FQHC and FQHC–Look Alike within the state. States can use two methods to determine these costs: the Medicare Cost Report or comparison to similar centers where the cost is known. Once the cost is determined, the state must reimburse the FQHC or Look-Alike the difference between what was paid by the Medicaid Managed Care Organization (MCO) and its actual cost per visit. For example, if the MCO paid the FQHC US$35 for an office visit (Evaluation & Management [E&M] code 99213) but the FQHC’s actual cost per visit was documented to be US$158, the state must pay the FQHC an additional US$123 for that visit. States vary in the process by which the FQHC submits its request for reimbursement, but eventually the FQHC is “made whole” by this process. For Medicare, the fiscal intermediary (Medicare Government Services may be directly billed in some states) must pay the FQHC its cost as well; however, Medicare has a ceiling that is currently just more than US$125.72, which means that a similar visit coded as a 99213 would be paid 80% of US$125.72 or US$100.58 (Centers for Medicare and Medicaid Services [CMS], 2009). FQHCs are required to bill the secondary payer, including Medicaid if the patient is dually eligible, or bill the patient if he or she does not qualify for any sliding scale discount. It should be noted that each visit for a Medicaid or Medicare patient—other than E&M Level 1 (e.g., 99211) or nurse visits—is paid at the same rate. There is no differentiation based on the level of severity designated by the billing code. Hence, a Level 2 visit is paid at the same rate as a much more complex Level 5 visit, which is very different from the typical reimbursement hierarchy found in most NMHCs. Note also, that when the provider is a nurse practitioner the payment made by Medicare is further reduced to 85% of the 80% (US$100.58 x 85% = US$85.49) due to the restrictions enacted by the Balanced Budget Act of 1997. This restriction applies to both FQHCs and NMHCs.
FQHCs have access to other funding sources as well on an episodic basis. For example, passage of the American Recovery and Reinvestment Act (ARRA) in early 2009 resulted in FQHCs being granted one time funding for operations related to increased demand for services from uninsured patients. These grants were formula funded; the amounts awarded per FQHC were determined by the number of unique uninsured patients served in the prior calendar year (2008) as documented in the UDS report. Similarly, the ARRA has also resulted in FQHCs being allocated funding for capital improvement on a formula basis. These funds have supported clinic renovations and purchase of health information technology hardware and software. Additional funding for large facility expansions—on a competitive basis among FQHCs—has also been awarded. NMHCs that don’t have FQHC status have not had access to such funding pools.
ARRA 2009 also provides for funding that helps support the implementation of electronic health record systems (EHRS) through Medicaid payments or enhanced reimbursement from Medicare. Nurse practitioners may qualify for the higher Medicaid incentives; however, nurse practitioners are not included in the Medicare EHRS incentives. To participate in the Medicaid incentive program a provider needs to serve a minimum of 30% Medicaid-covered patient encounters (20% in the case of a pediatrician). However, if a practice is an FQHC or Rural Health Clinic, its providers may include encounters with additional “needy” patients in their 30% minimum, whereas providers at other types of safety net settings cannot. Needy patients include patients whose care is paid for by Medicaid, the Children’s Health Insurance Program, or whose care is uncompensated or paid for on a sliding fee-scale basis. Based on the data from 2004 (Pohl et al., 2004), NMHCs were serving a median of 40% uninsured patients (most of whom would likely fall within a definition of needy), and the highest Medicaid rate was 20% (Pohl et al., 2004). This proportion of Medicaid patients would disqualify NMHC providers from the EHRS funding. A provider at a FQHC with the same payer mix would likely qualify for the Medicaid EHRS incentive payments (Medicare and Medicaid Programs, 2010).
Additional comparisons can be made between FQHCs and NMHCs. In the report from the 2008 UDS, data on select outcome measures were tracked for the first time (HRSA, 2008). Of the patients with hypertension in the 2008 UDS report, 62% were controlled. When outcomes for hypertension in NMHCs were assessed in the same year (Barkauskas et al., 2010), hypertension was controlled in 69% of the patients with some sites exceeding the HEDIS (Health Evaluation Data Information System) 90th percentile for that year. Diabetes outcomes as measured by a HbA1c below 7 were found to be almost identical in the FQHC and NMHC data (42.5% and 42%, respectively).
With the increased emphasis on primary care in our nation, and the need for access to that care as millions more are covered through the new PPACA, NMHCs have the potential to be part of the safety net practices along with the FQHCs. This article reports the latest comparisons of NMHCs and FQHCs based on 4 years of NMHC data compared to the 2008 UDS data (HRSA, 2008). For the ease of data comparison we used only 2008 UDS data that are based on a much larger sample.
Method
The development of the national INC survey of NMHCs has been described elsewhere (Pohl, Tanner et al., 2010). This article presents 4 years of data from the INC survey. The first year of INC data correspond to fiscal year 2004-2005, in which there were 29 participating centers. For 2005-2006 (Year 2), there were 27 participating centers; for 2006-2007 (Year 3), there were 24 participating centers; and finally Year 4 corresponds to 2008-2009 data in which there were 20 participating centers. Each year, the survey was disseminated via email to INC’s database of NMHCs, which currently has 172 listings. The survey was also disseminated through conferences and personal appeal via the American Academy of Nurse Practitioners, National Organization of Nurse Practitioner Faculties, and the National Nursing Centers Consortium. During Years 1 to 3, a compensation between US$100 and US$200 was offered as incentive for participating centers. In Year 4, no incentive payments were made to centers. It should be noted that UDS reporting by FQHCs is a requirement for receipt of grant funds. Comparing INC NMHC data to UDS data is, therefore, a comparison of a sample of NMHCs to the population of 1,080 FQHC grantees in 2008.
The INC survey collects very detailed clinical and financial data; the median length of time centers report taking to respond is 12 to 16 hr. Data collected are intentionally comprehensive and similar to the UDS data required annually of all FQHCs (Pohl, Tanner et al., 2010). For reporting ease, centers are requested to choose the 12-month reporting timeframe that corresponds with their own fiscal year (which in some cases is a calendar year). Most NMHCs do not participate every year. Over the 4 years, 45 unique centers have responded to the survey. Each year two to three participating NMHCs were also FQHCs, and they were included in the analyses to tell the full story of the NMHCs who submitted data.
Patient demographic and financial data are presented from the INC survey for each of the 4 years of data collection. The summary statistic presented for NMHCs is mean percent: The percent for a center is averaged across centers (effectively weighting each center, large and small, equally). UDS 2008 data (HRSA, 2008) presented are aggregate percentages (the sum of the numerators divided by the sum of the denominators), reflecting the universe of patients seen and revenue collected. This distinction is important to keep in mind when making comparisons. The FQHC data are a true characterization of the population served by FQHCs in the year presented. NMHC data are summary statistics that depict the characteristics of respondents. Although only a subset of all NMHCs choose to report data, the INC data are the most comprehensive financial data on a national set of NMHCs. We chose to keep the survey comprehensive in order to have meaningful data that could be compared to other data sets such as the UDS. The issues of response rate and comprehensiveness are discussed in a previous paper (Pohl, Tanner et al., 2010).
Results
NMHCs vary considerably in terms of size, with many being quite small. During the 4 years of data collection, the median unduplicated patient count ranged from 1,078 in 2004-2005 to 2,081 in year 2005-2006, and the median visit volume ranged from 3,712 in year 2005-2006 to 4,665 in year 2008-2009. There are also some large centers; for instance, one center reported more than 10,000 patients and more than 42,000 visits in 2006-2007.
Table 1 compares INC survey demographic data of NMHCs over 4 years to FQHC UDS 2008 data (HRSA, 2008). Both NMHCs and FQHCs serve a diverse population. NMHCs over the 4 years reported that on average 29% to 40% of their patient population was African American and 14% to 20% was Hispanic. Overall in 2008, 21% of FQHC patients were African American and 33% were Hispanic. Age distribution is fairly comparable between NMHCs and FQHCs (Table 1).
Comparison of FQHCs and NMHCs Patient Demographic Information
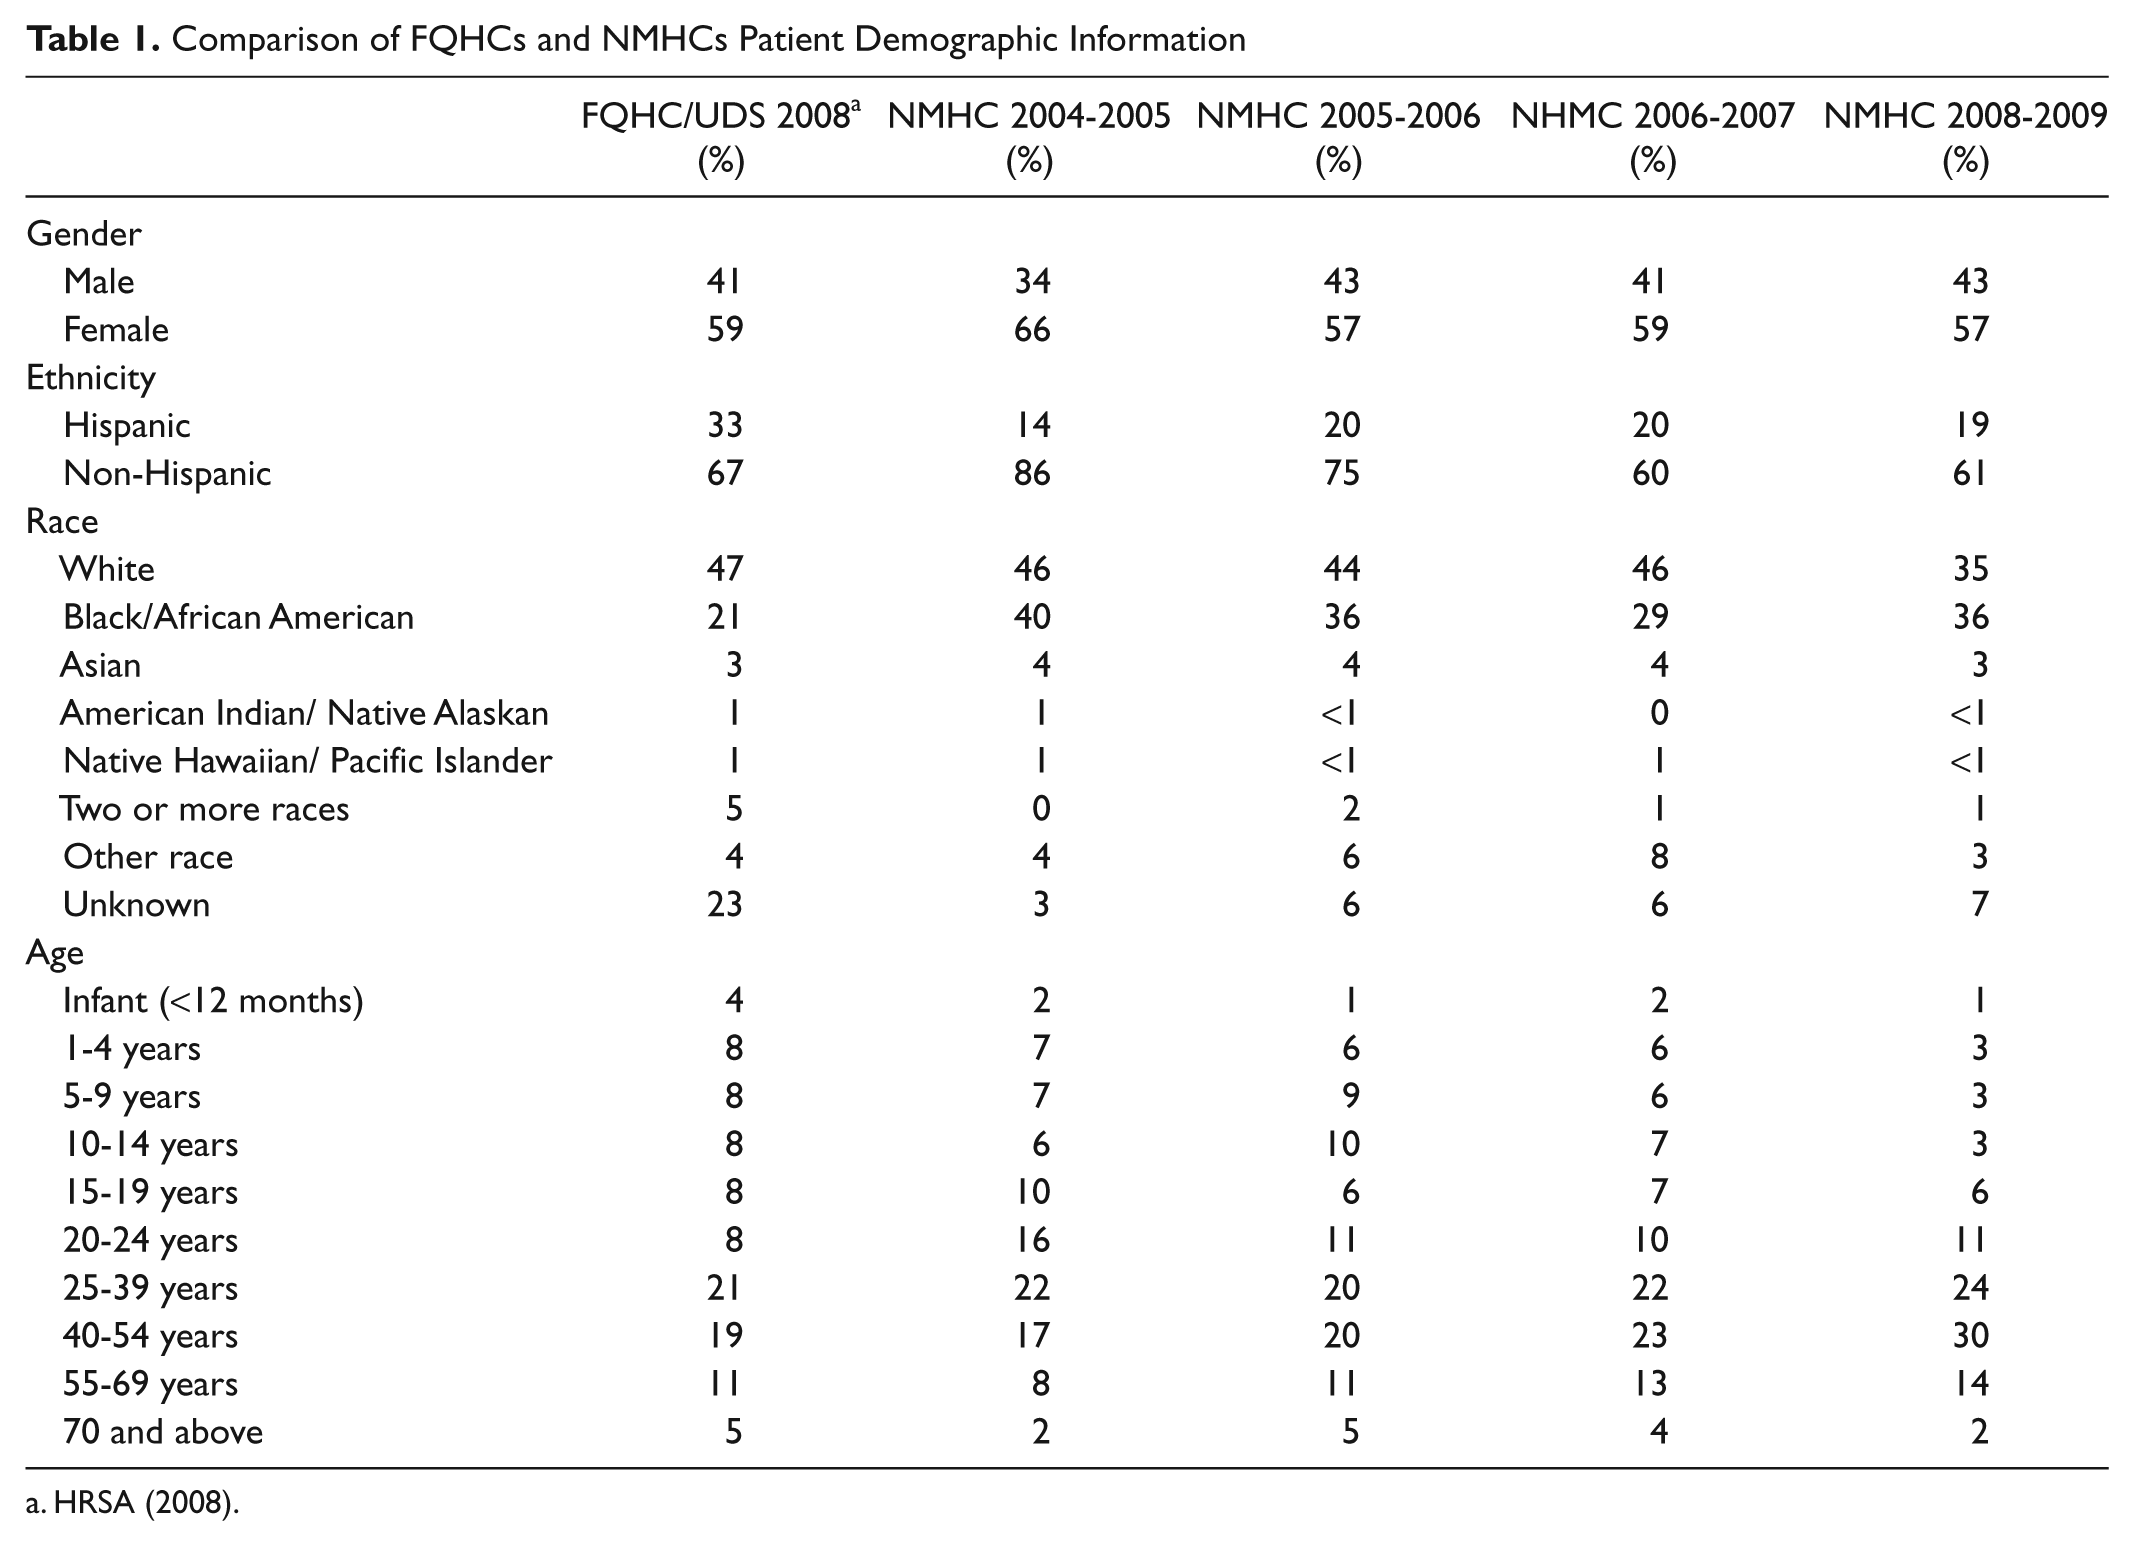
Table 2 presents revenue in terms of three large categories: (1) reimbursement for patient care (which includes self-pay and third-party reimbursement in the form of fee-for-service and capitated payments as well as contractual payments for patient care), (2) other operating funds (primarily grants), and (3) nonoperating funds (primarily donations). NMHCs typically obtain around 40% or less of revenue from patient care reimbursement. Overall, patient care reimbursement accounted for 60% of FQHC revenue in 2008. On average, NMHCs have a large share of revenue (20%-27% on average) that is classified as “nonoperating.” The largest and most common source of nonoperating revenue is a subsidy from universities and schools of nursing. By contrast, nonoperating funds accounted for less than 3% of FQHC revenue in 2008 (Table 2).
Comparison of FQHCs and NMHCs Percent Revenue by Categories
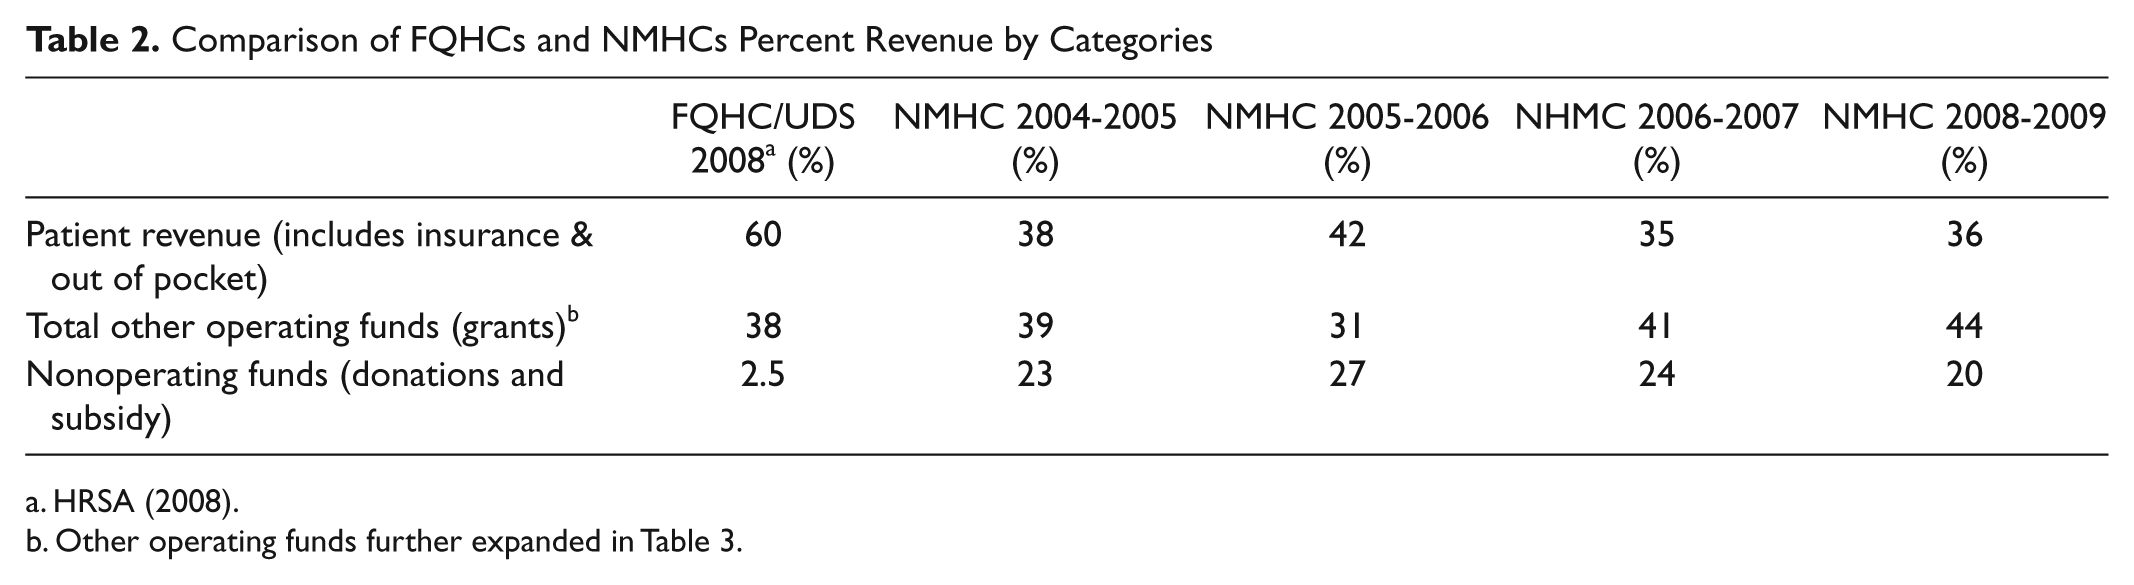
Other operating funds further expanded in Table 3.
Table 3 expands the data reported in Table 2 under Other Operating Funds, comparing the sources of grant revenue of FQHCs and NMHCs in 2008. The major difference between FQHC and NMHC federal grants is the source; FQHCs receive funding from the Bureau of Primary Health Care whereas NMHCs receive funds from the Bureau of Health Professions, Nursing Education, Practice and Retention grant. NMHCs also receive more funding from private sources such as foundations and donations. During most years, four reporting NMHCs were recipients of grant funding from the Bureau of Health Professions, with the exception of 2005-2006 in which there was only one recipient who responded that year (Table 3).
Comparison of FQHCs and NMHCs by Other Operating Funds/Grant Revenue by Source
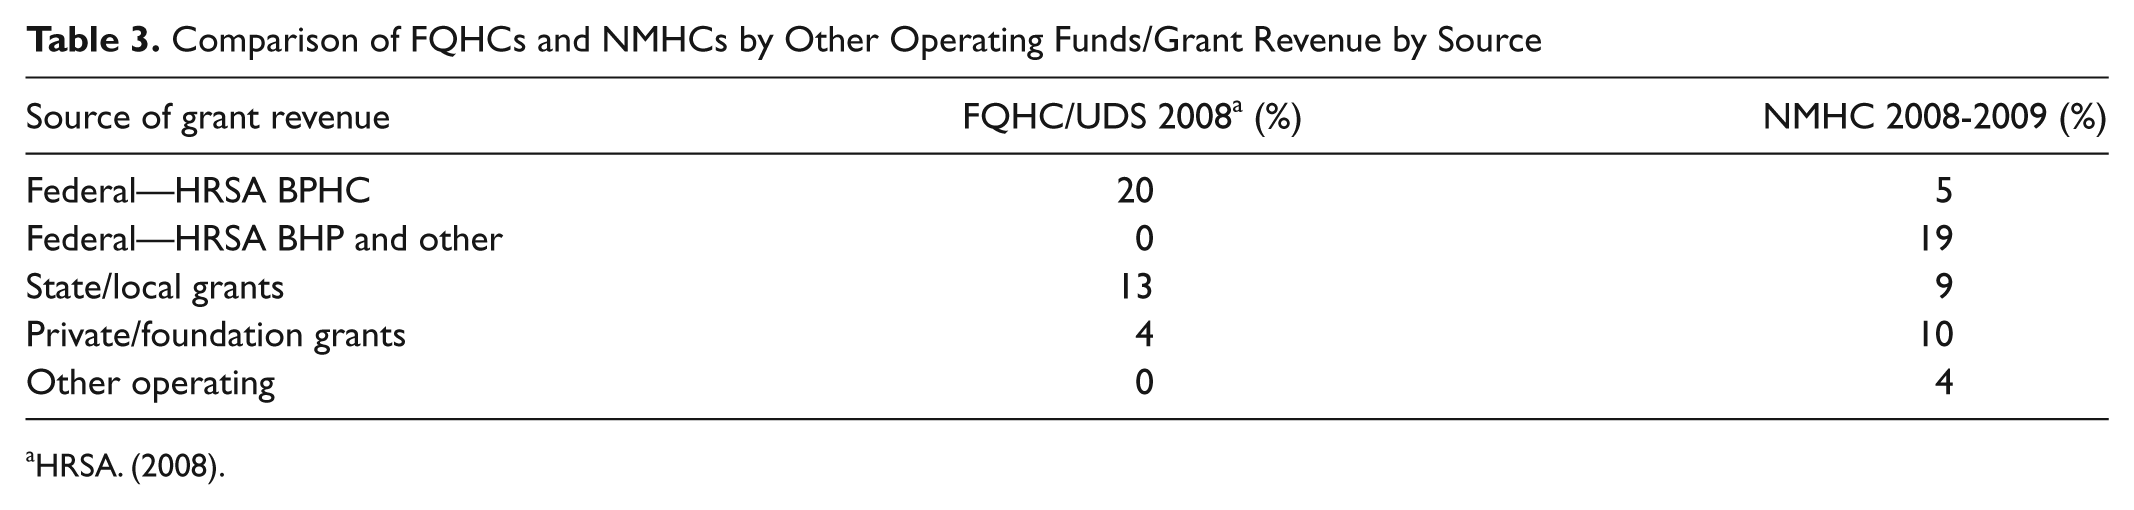
Table 4 compares payer mix and actual patient care reimbursement revenue (which does not include grants) of NMHCs across 4 years and FQHCs from the 2008 UDS data. It is important to note that included in the self-pay revenue category for both NMHC and FQHC data are those payments made by insured (e.g., copays) and uninsured patients, so the revenue category of “self-pay” is not perfectly comparable to the payer-mix category of “uninsured.” The percent of uninsured and commercially insured patients in NMHCs is comparable to FQHCs in the 2008 UDS report. However, the percent of Medicaid patients is lower in NMHCs than in FQHCs. In addition, some NMHCs have unique contractual relationships with payers—this shows up in the “other” category. These contracts include student health service and occupational health as well as unique contractual relationships to community and government entities.
Percent Payer Mix and Percent Actual Revenue: FQHC/UDS 2008 and NMHC Over 4 Years
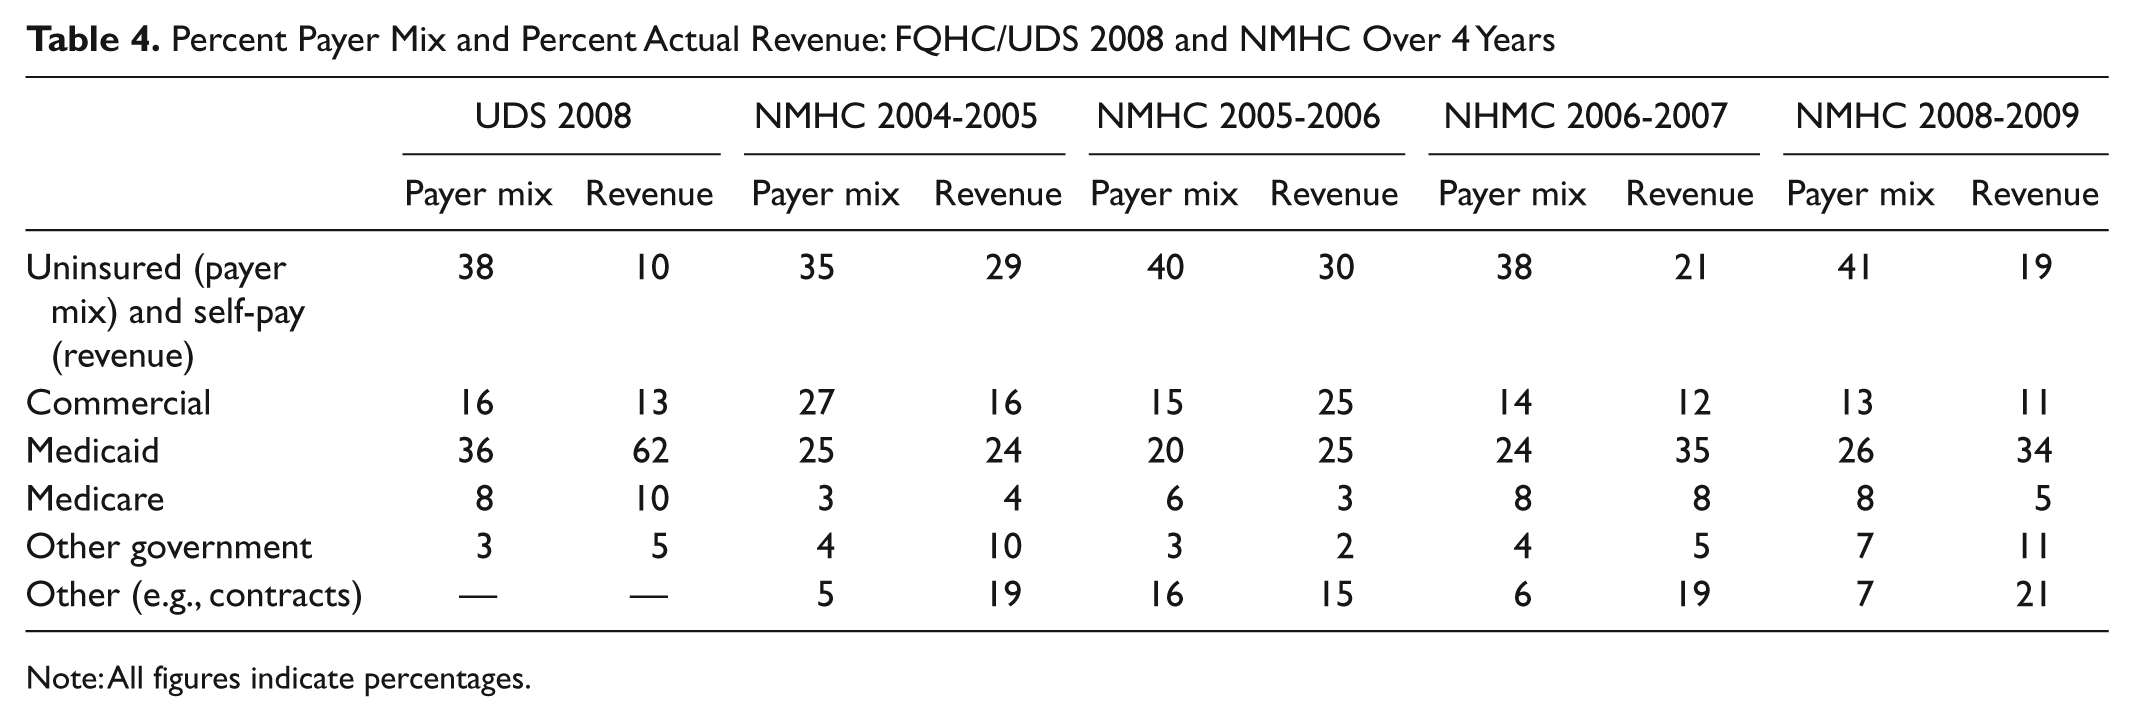
Note: All figures indicate percentages.
When comparing payer mix to actual revenue (Table 4), it is noticeable that NMHCs collect a higher percentage of revenue from uninsured patients than FQHCs do. For NMHCs on average, the percent of patients with Medicaid health coverage corresponds with the percent of patient care revenue accounted for by Medicaid. For FQHCs, Medicaid represents a much larger portion of revenue than would otherwise be expected based on payer mix. This could be called the “wrap-around payment effect,” as the economic value of each Medicaid patient to the FQHC is much higher than the revenue value to the NMHC. FQHCs receive a cost-based reimbursement rate, regardless of billing code level (above Level 1), whereas NMHCs receive reimbursement based on coded levels and the prevailing Medicaid fee schedule. In some states, nurse practitioner providers receive only 85% of the physician rate as well. The result is profoundly less revenue per Medicaid patient than the same care rendered to the same patient at an FQHC (Table 4).
Discussion
This study updates the first comparison of NMHCs and FQHCs reported in 2004 (Pohl et al., 2004). The patient demographics of NMHCs appear very similar to FQHCs, though NMHCs reported serving fewer Hispanic and more African American patients than FQHCs. This could be due to the location of the reporting centers, many of which are in urban settings with a large African American population.
Although there are numerous similarities between NMHCs and FQHCs in terms of patients served and payer mix and models of care, actual revenue differences are noteworthy. These differences point out the financial challenges NMHCs have faced in providing access to primary care. The enhanced Medicaid reimbursement benefit is not accorded to NMHCs (unless they are FQHCs), which may also partially explain why NMHCs have a lower Medicaid population. Contracts as a revenue source are another key and unique difference between NMHCs and FQHCs. The contracts accounted for 15% to 21% of NMHC revenue on average. Such contracts may well help sustain NMHCs who wouldn’t otherwise have the patient revenue to survive.
Revenue from patient insurance sources is lower overall for NMHCs, despite comparable payer mix. For example, NMHCs and FQHCs have a comparable commercially insured population, yet actual percent revenues are lower for NMHCs. This may be due to a combination of reimbursement policies that can differ state to state and policies that differentiate nurse practitioner and physician reimbursement for the same services or some insurers not reimbursing nurse practitioners directly (without physician supervision) or possibly under coding of visits by nurse practitioners.
The nonoperating revenues (donations) category points out additional striking differences between FQHCs and NMHCs. On average, 20% to 27% of NMHC revenue is from this category, which is often a university or school of nursing. Without the federal grant support that FQHCs receive, these universities/schools of nursing are in essence serving as a federal government surrogate for NMHCs. This finding was noted in 2004 with the first analysis in Michigan (Pohl et al., 2004). Federal funding from the Bureau of Health Professions, when it occurs for NMHCs, is far less advantageous in terms of supporting a center than the federal funding from Bureau of Primary Health Care that all FQHCs receive. FQHCs have access to considerably more sources of federal funding beyond the base funding described earlier in the article and the Medicaid/Medicare wrap-around payments. Expanded Medical, Dental, or Behavioral Health Capacity grants are periodically made to existing FQHC grantees to support documented additional demand for these services at health centers. FQHCs also have access to pharmacy expansion grants to add pharmacy services for their patient populations. In addition, federal grantees may enroll in the federal 340b pharmacy purchasing program that dates back to the Public Health Service Act of 1944 greatly reducing the cost of all pharmaceuticals used at FQHCs.
NMHCs have access to federal funding, albeit at lower amounts and fewer programs, through the HRSA Bureau of Health Professions, primarily through the Nurse Education, Practice, and Retention Grant program. Nurse Education, Practice, and Retention grants average US$200,000 per year for 3 to 5 years. Although federal funding for NMHCs under the PPACA showed promise, none of that funding to date has been appropriated, and it appears it will not be in the current climate of budget constraints and cuts. In addition, until barriers to practice for nurse practitioners are removed and policies support nurse practitioners as full players in the primary care arena, NMHCs will struggle to survive when primarily serving the underserved. For example, under current policies in some states and with some payers, including Medicaid and Medicare, nurse practitioners need to have a collaborative agreement with a physician who usually is paid for this service. Although this is a mandated policy, it is not in any way reimbursed, adding unnecessary costs to the NMHCs who are trying to serve the underserved and remain financially viable. Some payers, including Medicare, also reimburse nurse practitioners at a lower rate than physicians for the same service, again challenging NMHCs to be financially viable.
FQHCs also received greater support from state grants and contracts than NMHCs, as advocacy for the health center program is strong at both the federal and state levels, resulting in favorable funding legislation at both levels. States, like the federal government, are very familiar with the mission of FQHCs and the gaps in care that they have historically filled (Commissioner Susan R. Cooper, MSN, Tennessee State Department of Health, personal communication). State legislators and policy makers are less familiar with NMHCs, and NMHCs have not traditionally displayed a national public advocacy and awareness message. In many states, the sponsoring university must raise awareness to legislative and executive branches of the need for funding support for NMHCs, and universities have met with varying degrees of success in this endeavor. Therefore, it makes sense that NMHCs seek out funding from foundation/private grant sources in order to make up for funding they can’t otherwise access. What is not considered in these data is the time and cost of writing grants to foundations to cover expenses not otherwise reimbursed. NMHCs may need to continue to rely on significant private grant funding unless they move toward becoming FQHCs—if they want to continue to serve as a safety net provider. An additional note of caution the authors want to acknowledge is that we used average statistics when reporting data from the NMHCs and this may obscure the tremendous variation across centers. NMHCs have employed multiple responses to the financial dilemmas described in this article. Future works will characterize the different strategies employed.
Policy Implications
Our comparison of the revenue and funding patterns for FQHCs and NMHCs lead us to conclude that a number of policy changes at the federal, state, and private sectors would greatly enhance the ability of NMHCs to sustain their role as primary care safety net providers serving vulnerable communities across the nation. First, as HRSA develops regulations for the NMHC grants authorized under PPACA, provisions must be made for renewable grants after a reasonable initial funding cycle. This would be similar to the method used by HRSA for renewing FQHC grants every 2 to 3 years. Current rules for these new grants to NMHCs do not include any provision for renewal. Instead, the grant guidance encourages NMHCs to seek FQHC status by the end of the grant period (3 years). Gaining FQHC status is not always possible for NMHCs, nor is it desirable in some cases. For example, private university schools of nursing that operate NMHCs cannot apply for FQHC status because FQHCs must be governed by a community board representative of the population served and cannot be owned by a private sector corporate entity, even a not-for-profit university. This governance rule is firm and cannot be challenged without legislative action by Congress. Thus, when these schools complete their grant-funded work under HRSA’s Nurse Education, Practice, Quality, and Retention grants their access to federal funds ends, which of course threatens sustainability and ultimately may result in closure of the NMHC for lack of funding.
Second, NMHCs need access to the Medicaid and Medicare Prospective Payment Systems (wrap-around funding) in order to enhance their reimbursement for serving these federally insured patients. Again, this is in parallel to the funding access enjoyed by FQHCs. Access to wrap-around payments at NHMCs would greatly increase their ability to remain sustainable through this cost-based reimbursement-funding formula.
Third, since NMHCs are often funded by HRSA through Nursing Education, Practice, Quality, and Retention grants, and now through the NMHC grant program, they should also have access to other federal funding programs aimed at increasing services to vulnerable populations, such as the 340b pharmacy program, electronic medical record incentive payments for service to uninsured patients, and expanded capacity funding that would allow NMHCs to serve greater numbers of persons in need. In short, NMHCs should have access through the Bureau of Health Professions to the entire group of federal support programs that FQHCs access through the Bureau of Primary Health Care.
State policy also needs to be addressed, particularly for Medicaid wrap-around payments, which states design (under federal regulation) and administer. If federal policy changes to allow such payments to NMHCs, corresponding policy changes will be needed at the state level. States also control regulation for advanced practice registered nurses through their state nurse practice acts, and sometimes through the state medical practice acts as well. Work is needed in many states to adopt a uniform scope of practice act for advanced practice registered nurses (such as nurse practitioners and nurse midwives) that promotes and allows them to practice to the full extent of their education and training, without restriction. Such policy and regulation change has increasing support (e.g., Cronenwett & Dzau, 2010; IOM, 2010) and requires legislative support and strong advocacy.
In the private sector, insurers of all types (MCOs, federal, commercial) must embrace the utility of nurse providers in opening access and improving quality and patient safety. The literature has repeatedly described high-quality patient outcomes when advanced practice registered nurse providers (e.g., nurse practitioners and nurse midwives) manage patient care (e.g., Barkauskas et al., 2010; Horrocks, Anderson, & Sallisbury, 2002; Lenz, Mundinger, Hopkins, Lin, & Smolowitz, 2002; Mundinger et al., 2000). The policies in place that fail to recognize nurse-provided clinical care for reimbursement are not based on evidence, and such discriminatory reimbursement practices must end, hopefully by voluntary and prompt effort on the part of insurers. If voluntary changes are not forthcoming, legislative action will be required, a difficult, costly, and time-consuming effort.
Finally, NMHCs and their constituent advanced practice registered nurses and schools of nursing must deliver a uniform and succinct message to policy makers as health reform unfolds. Our ability to effectively communicate the value and efficacy of NMHCs is critical to the centers’ long-term sustainability and concomitant role in the nation’s safety net. FQHCs are well positioned in their advocacy efforts at both federal and state levels. Health reform changes have created a tipping point for NMHCs and their constituencies to adopt enhanced and collective advocacy methods. If increasing access to quality primary care is essential, strengthening the funding of NMHCs similar to that of FQHCs is an essential part of the solution.
Footnotes
The author(s) declared no potential conflicts of interest with respect to the research, authorship, and/or publication of this article.
The author(s) received the following financial support for the research, authorship,and/orpublicationofthisarticle: FundingAcknowledgements: This work was funded by the W. K. Kellogg Foundation grant “National Network for Nurse Managed Health Centers” 2002-2007, P 93479, Joanne M. Pohl, PI.