
Abstract
Obesity increases the risk for leading causes of death, including cardiovascular disease and some cancers. Midwestern and southern states have the highest obesity rates—in Kansas, one in every three adults is obese. We compared the willingness of Kansas adults and opinion leaders to pay more in taxes to fund obesity prevention policies. In 2014, we asked a representative sample of 2,203 Kansas adults (response rate 15.7%) and 912 opinion leaders (response rate 55%) drawn from elected office and other sectors, including business and health, whether they would pay an additional $50 in annual taxes to support five policies that improve access to healthy foods and opportunities for physical activity. We used adjusted Wald tests to compare public and opinion leaders’ responses, and regression analysis to assess whether differences in respondents’ gender, age, location (urban/rural), race/ethnicity, and political stance affected results. Adjusting for demographic differences, Kansas adults were more willing than opinion leaders to pay $50 in taxes for each of the five policy interventions. This study demonstrates a willingness among residents of a fiscally conservative state to pay increased taxes for policies that could reduce population obesity rates. Health professionals, including nurses, can use these findings to educate policy makers in Kansas and geopolitically similar states about widespread public support for obesity prevention policies. Public health and other nurses could also apply our methods to assess support for obesity prevention policies in their jurisdictions.
Obesity contributes to premature death and increases the risk for several chronic diseases, including heart disease, chronic lower respiratory disease, and some cancers (Garcia et al., 2016). The United States has persistent geographic disparities in obesity rates, contributing health behaviors, and obesogenic environments, with the highest obesity rates in Midwestern and southern states (Le et al., 2014). Policy changes that increase access to healthy foods and opportunities for physical activity can help address the population health burden of obesity and reduce geographic disparities in obesity (Bell, Mora, Hagan, Rubin, & Karpyn, 2013; Guide to Community Preventive Services, n.d.; Mowen & Baker, 2009; Novak & Brownell, 2012).
Public health nurses play a vital role in addressing population health threats like obesity (Sheehan & Yin, 2006). The practice of public health nursing includes advocacy and policy development (American Public Health Association, Public Health Nursing Section, 2013). Given their scope of practice and clinical expertise, public health nurses are well-positioned to advocate for effective obesity prevention policies. In addition, nurses are a large part of the health-care system’s workforce and have many opportunities to influence public awareness of obesity and obesity prevention policies (Bowen, Bryant, Hess, McCarty, & Ivey, 2014). Public and opinion leaders are key drivers of policy change (Coffman & Beer, 2015) and as such they are the focus of education and advocacy efforts designed to build support for obesity prevention policies. Public health nurses and other advocates can use data that document the baseline level of support for these policies to target communities with higher readiness to adopt them and tailor persuasive messages to the current level of support. With follow-up data collection of these measures, they can monitor the effectiveness of their efforts to increase support for policy change.
We present findings from surveys that assessed and compared public and opinion leaders’ support for obesity prevention policies. Findings that reflect strong public support for obesity prevention policies, including willingness to pay more in taxes to support the implementation of policy interventions, can be used by public health nurses and other health advocates in Kansas and other geopolitically similar states to advance an obesity prevention policy agenda. On a broader scale, our survey and analytic methods can be used to assess support and advocate for obesity prevention policies in any jurisdiction.
Background
In Kansas, a prototypical Midwest state, one in every three adults is obese (Trust for America’s Health, 2016), 41% eat fruit less than once per day, and 22% eat vegetables less than once per day (Centers for Disease Control and Prevention, 2013). In 2015, Kansas had the seventh highest rate of obesity of all states in the United States (34.2%) but ranked in the middle of states on related health indicators. Specifically, it had the 29th highest state rate of adults with diabetes (9.7%) and the 24th highest rate of adults with hypertension (31.6%; Trust for America’s Health, 2016). The obesity rate for Blacks in Kansas was higher than the state average, at 42.7%, the fifth highest rate for Blacks in the nation. Kansas also had the 21st highest percent of adults who are physically inactive, at 26.5%.
Like many areas of the country, the built environment—the physical environment that surrounds children and families where they live, work, and play—in Kansas serves as a barrier to healthy behaviors and contributes to poor health outcomes. Neighborhoods that have safe sidewalks, parks, streets, bicycle lanes, and other public recreation spaces give people more opportunities to be physically active, while nearby supermarkets and fresh produce promote access to healthy, fresh foods (Committee on Physical Activity Health Transportation and Land Use, 2005). Kansas has fewer supermarkets per capita than any other state in the country (Community Commons, 2012b) and more than 800,000 Kansans—about 29% of the total population—do not have a grocery store within a reasonable distance of their home (i.e., the closest supermarket or large grocery store is more than one mile from home in urban areas and more than 10 miles from home in rural areas; Community Commons, 2014). Despite having a robust trail system where people can walk or ride bicycles (Rails-to-Trails Conservancy, 2017), access to places for physical activity is also limited in Kansas. There are 7.92 recreation or fitness establishments per 100,000 Kansas residents, fewer than the national average of 9.44 per 100,000 residents (Community Commons, 2012a). In addition, only one third of Kansans lives within 0.5 mile of a park (Community Commons, 2013).
In 2012, the Kansas Health Foundation funded the Healthy Living Focus Area initiative, through which grantees throughout the state implemented interventions to decrease tobacco use and obesity through promotion of policy change. To evaluate this initiative, we developed a theory of change linking grantee activities and objectives to adoption of obesity prevention policies and subsequent changes in population health behaviors, including healthier food consumption and increased physical activity (Glasgow et al., 2017). Figure 1 reproduces one component of that theory of change and shows the relationship between public and opinion leader support for policy change. Consistent with O’Dougherty, Forster, and Widome (2010) and Huang et al. (2015), this model implies that public support for policy change—and willingness to pay for it—precedes and influences opinion leader support for policy change (Glasgow et al., 2017).
Theory of change for policy adoption based on Glasgow et al., 2017.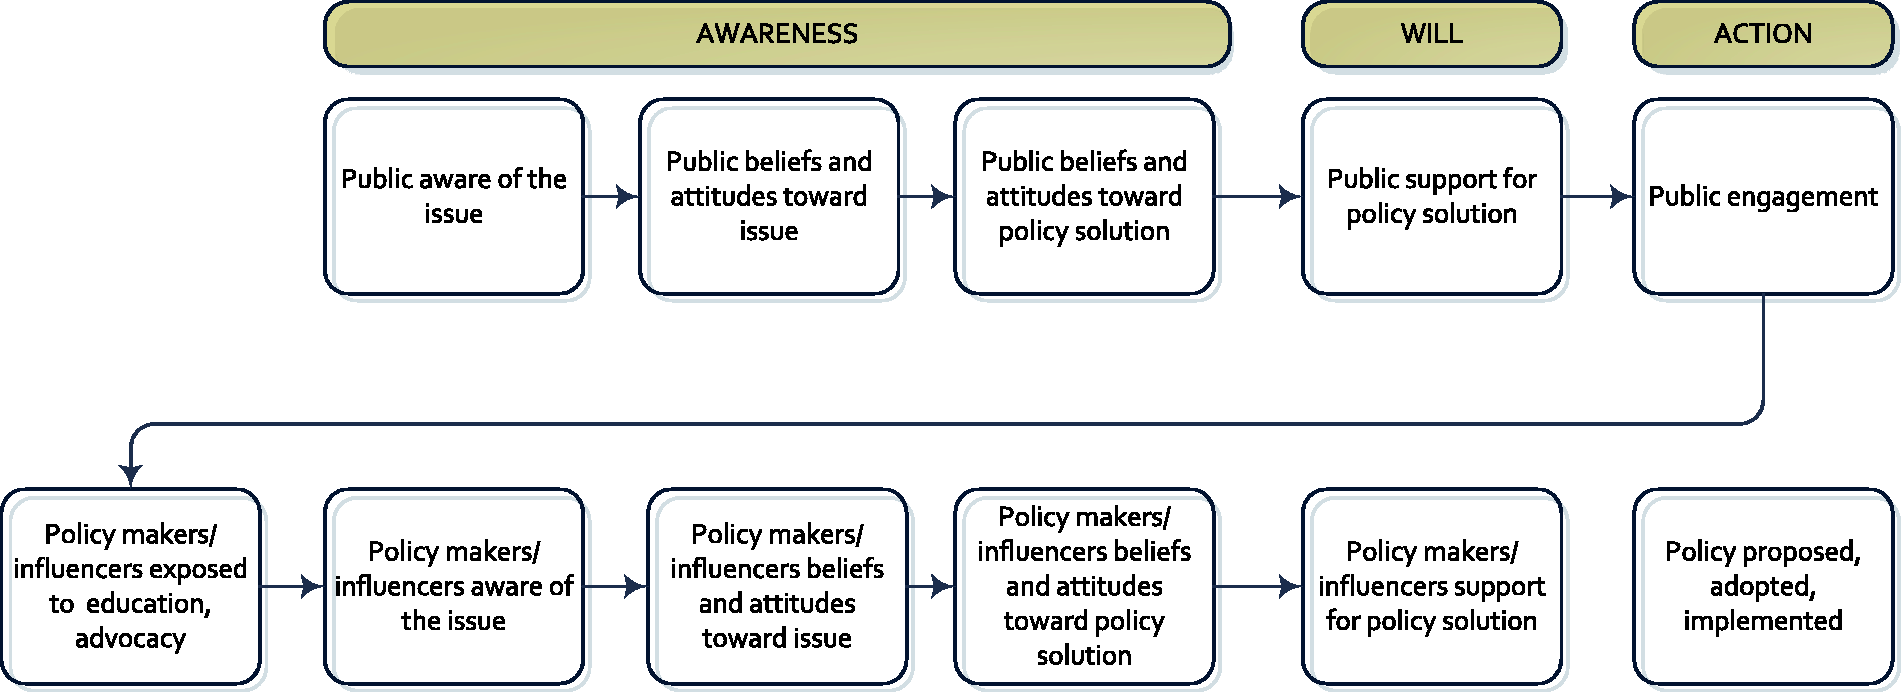
In this study, we compared willingness of Kansas opinion leaders (including elected officials) and willingness of adults in the Kansas general population to pay an additional $50 annually in taxes to fund each of five policies aimed at reducing and preventing obesity. The policies focus on increasing access to healthy foods and opportunities for physical activities, considered part of a comprehensive solution to the obesity problem (Institute of Medicine, 2012; Khan et al., 2009). A willingness to pay for a policy is important because many obesity prevention policies—such as improvements to the built environment or provision of transportation to retail food outlets—require significant funding for implementation. Absent public support to fund these policies, even if adopted, they may simply become unfunded mandates (Institute of Medicine, 2007).
Methods
Design
We designed and conducted two cross-sectional telephone surveys, the Kansas General Public Survey and the Kansas Opinion Leader Survey, to document beliefs about healthy eating and active living in Kansas and assess support for various obesity prevention policies. Participants were not incentivized, and all study procedures were approved by RTI International’s institutional review board. Each survey took approximately 15 minutes to complete.
Sampling and Recruitment
Kansas General Public Survey Sampling and Response Status Overall and by Frame.
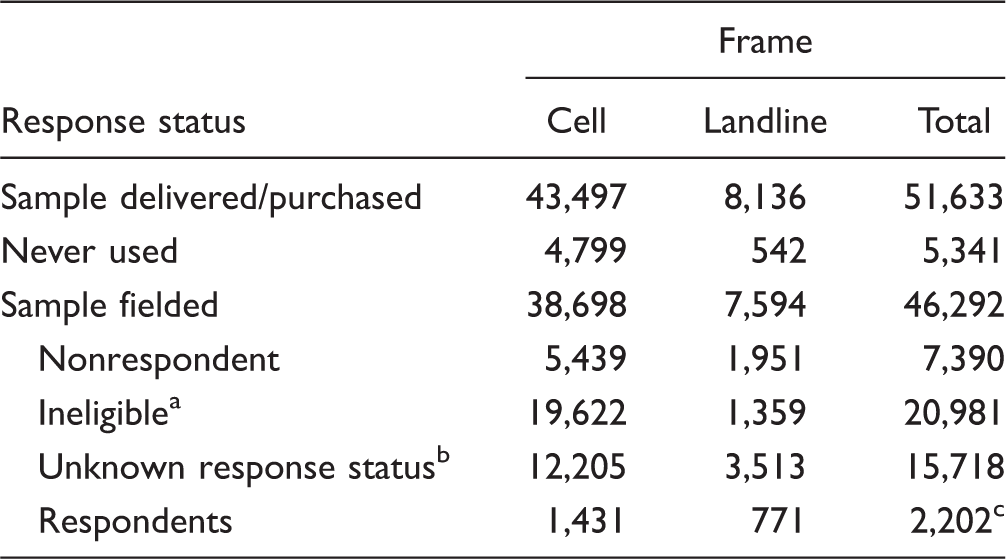
Sample members were ineligible due to the following: nonworking number, fax machine, disconnected, call forwarding, child’s phone, respondent not eligible, respondent under 18, not Kansas resident, or business
Sample members are classified as unknown response status for one of the following reasons: unknown if housing unit; not attempted or worked; always busy; no answer; telephone answering device (don’t know if housing unit); telecommunication technological barriers, for example, call-blocking; technical phone problems; ambiguous operator’s message; housing unit, unknown if eligible respondent; no screener completed; unknown if person is household resident; other
The data from one partial respondent were not used; this sample member was treated as a nonrespondent.
The Opinion Leader Survey was a two-stage probability telephone survey that we conducted May 12 to September 12, 2014. In the first sampling stage, we selected 73 out of 105 Kansas counties proportional to the eligible population with probability minimal replacement. We used publicly available information gathered through Internet searches to identify opinion leaders in each of the 73 selected counties.
Based on the sampling frame used by Howard et al. (2000), we developed a sampling frame in 2014 representing opinion leaders within the 73 counties representative of Kansas’s population. Opinion leaders were identified within nine sectors: (a) business, (b) education, (c) city government, (d) county government, (e) state government, (f) federal government, (g) organizations representing ethnic groups, (h) health, and (i) media.
For the business sector, the sampling frame consisted of heads of chambers of commerce, ethnic chambers of commerce, and heads of visitors’ bureaus. For the education sector, school district board presidents and district superintendents were retrieved from the Kansas Department of Education website. For the government sector, leaders were selected at four levels: city (city administrators, city council members, and mayors); county (county administrators, county commissioners, and health officers/administrators of local health departments); state (state assembly members, state senators); and federal (members of Congress). We included all elected officials who represented any part of a county or jurisdiction that fell within a selected county.
Health organizations were identified by searching for state branches of large national organizations used in the Howard et al. (2000) study, such as the American Lung Association and the American Heart Association, and by identifying health organizations from a list of Kansas Health Institute stakeholders and partners. The Kansas Health Foundation then reviewed the list and made recommendations for additional organizations. We sought to survey heads of health organizations on the list (e.g., directors, executive directors, chief executive officers, and presidents). We enumerated organizations representing ethnic groups (e.g., NAACP, Urban league) in Kansas by reviewing the results of the first five pages of a Google search for each of 11 search terms (e.g., “African American organizations in Kansas”) and compiling a list, which was then vetted by the Kansas Health Foundation, who provided additional recommendations. Our target participants for this sector were the heads of these organizations (e.g., director, executive director, chief executive officer, president). Finally, for the media sector, we compiled a list of newspapers and television stations from included counties. College newspapers were excluded. Newspaper editors and television news directors for the identified media sector organizations were the targeted participants for this sector and were identified through Internet searches.
Once the sampling frame was completed, we stratified by rural/urban designation to obtain estimates as close to representative of the population distribution of rural and urban counties as possible. We also stratified by office type within sectors (e.g., the education sector had two office types: superintendents and school board presidents; see Table 3). For office types with small sampling frame sizes (n < 67), we selected the entire frame. For office types with larger frame sizes, we selected a simple random sample (n = 67) with near equal numbers of leaders from rural and urban counties. We selected 67 as a cutoff to yield the number of responses necessary for an adequately powered study, aiming for 1,650 as our sample size. The Kansas Opinion Leader Survey was designed to produce estimates that are accurate within ±3% at a 95% confidence level. Based on surveys of opinion leaders in other states, where we have had response rates ranging from 55% to 65%, we calculated that we would need a total sample of 1,650 for a yield of at least 900 completed surveys (needed to keep the margin of error at a reasonable level). Our total sample size was 1,654 and of those 912 completed the survey (Table 3). Before calling opinion leaders, we sent them lead letters explaining the study purpose, study sponsor, survey duration, and informing them that they would receive a telephone call within the next few days from an interviewer.
Measures
We used the same items and question wording in each of the two surveys (General Public Survey and Opinion Leader Survey) so they could be directly compared. All items on the telephone surveys were close-ended. To measure willingness to pay for specific obesity policies, we asked participants in both surveys: For each of the following items, would you be willing to pay $50 more a year in taxes: (a) to provide farmer’s market vouchers to low-income families and seniors, (b) to provide public transportation to recreational facilities for low-income, senior and rural populations, (c) to provide public transportation to healthy food outlets for low-income, senior and rural populations, (d) to create more parks and other public spaces for exercise, and (e) to provide more nutritious lunches in your local public schools?
Because our primary research questions focused on the percent of participants who supported funding these policies, we constructed a binary dichotomous indicator (1 = yes, 0 = no, don’t know) for each item. We adapted the question stem for these items from Oliver and Lee (2005). We chose these policy areas to reflect Healthy Kansas 2020 priorities (Healthy Kansans 2020, n.d.) and recommendations made by an advisory panel the Kansas Health Foundation convened to help them identify objectives for the Healthy Living Focus Area. We developed the specific policy items in consultation with the Public Health Law Center at William Mitchell College of Law (St. Paul, Minnesota), which has a formal relationship with the Kansas Health Foundation and is familiar with promising healthy living policies and their feasibility in Kansas.
We asked each participant to describe their political ideology on a scale ranging from 1 (very conservative) to 5 (very liberal). For analysis, we constructed three binary dichotomous indicators: conservatives (including very or somewhat conservative), liberals (including very or somewhat liberal), and moderates (moderate, neither conservative nor liberal).
Other measures included gender, age, race/ethnicity (White non-Hispanic, Black non-Hispanic, Hispanic, other non-Hispanic, which includes Asian, Native Hawaiian or Other Pacific Islander, American Indian or Alaska Native, and multiracial), and urbanicity (defined as residing in an urban or rural area as classified by NCHS: Urban is large fringe metro, medium metro, and small metro; rural is micropolitan and noncore; Ingram & Franco, 2014).
Data Analysis
We conducted adjusted Wald tests to determine the distributions of gender, age, urbanicity, race/ethnicity, and political philosophy among the sample in the General Public Survey compared with the sample in the Opinion Leader Survey. We separately calculated the proportion of Kansas adults and opinion leaders who were willing to pay for each built environment policy. Analyses with adjusted Wald tests tested for differences in willingness to pay taxes to support each policy by sample (Kansas adult population versus opinion leaders). We also conducted regression analyses to determine whether differences in support between public and policy makers for the policies could be attributed to respondents’ gender, age, urbanicity, race/ethnicity, or political philosophy.
All analyses were conducted in 2015 using Stata (14.0) complex survey design estimators, which use sample weights to provide representative estimates of the relevant population groups.
Results
Response Rates and Participants
Demographic Characteristics of the Kansas General Public (n = 2,203) and Opinion Leader (n = 912) Samples.
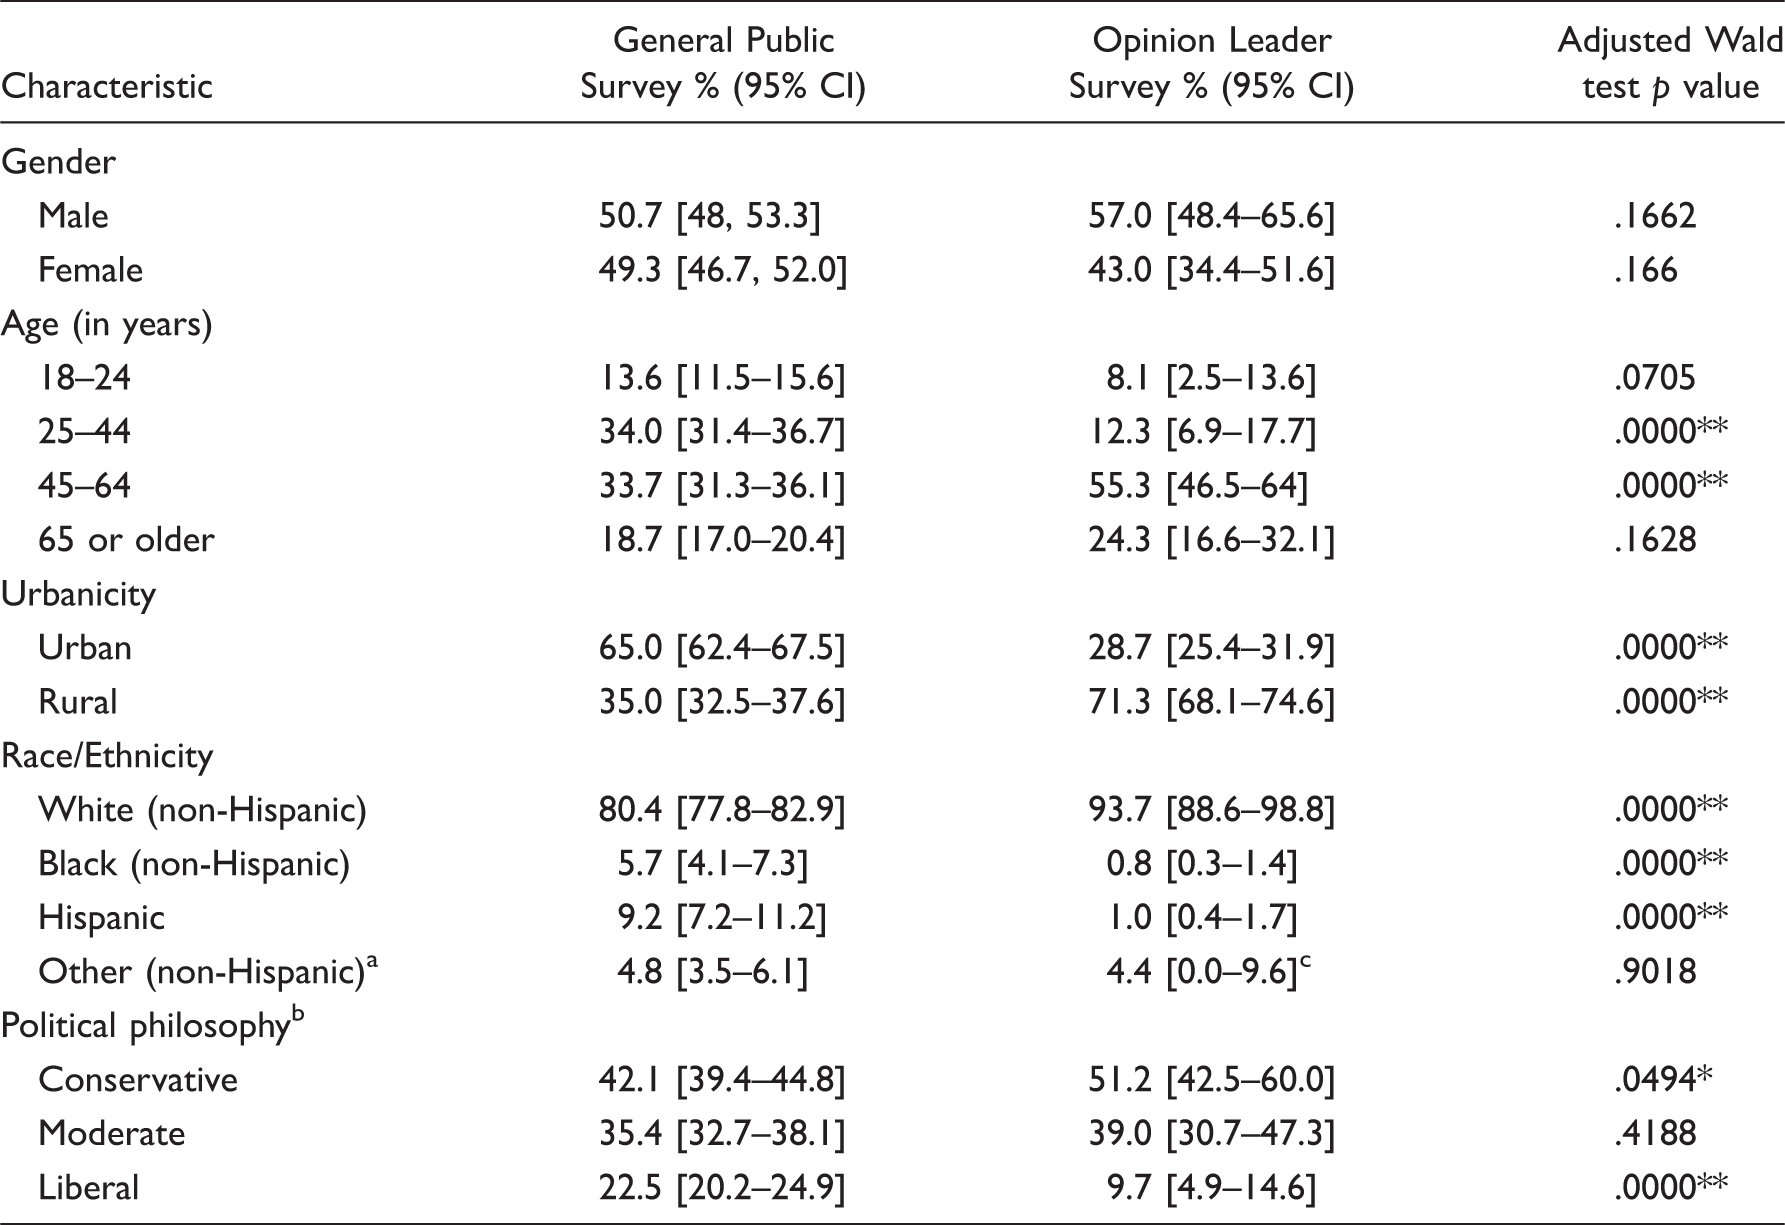
aIncludes Asian, Native Hawaiian or Other Pacific Islander, American Indian or Alaska Native, and multiracial.
bConservative = answered very conservative or somewhat conservative, moderate = answered moderate—neither conservative nor liberal, and liberal = answered somewhat liberal or very liberal in response to “How would you describe your overall political philosophy?”
cLower bound of confidence interval was calculated as negative but has been changed to 0.0 for reporting.
Statistically significant difference (p < .05).
Statistically significant difference (p < .01).
Sample Size and Response Rate by Kansas Opinion Leader Sector and Office Type.
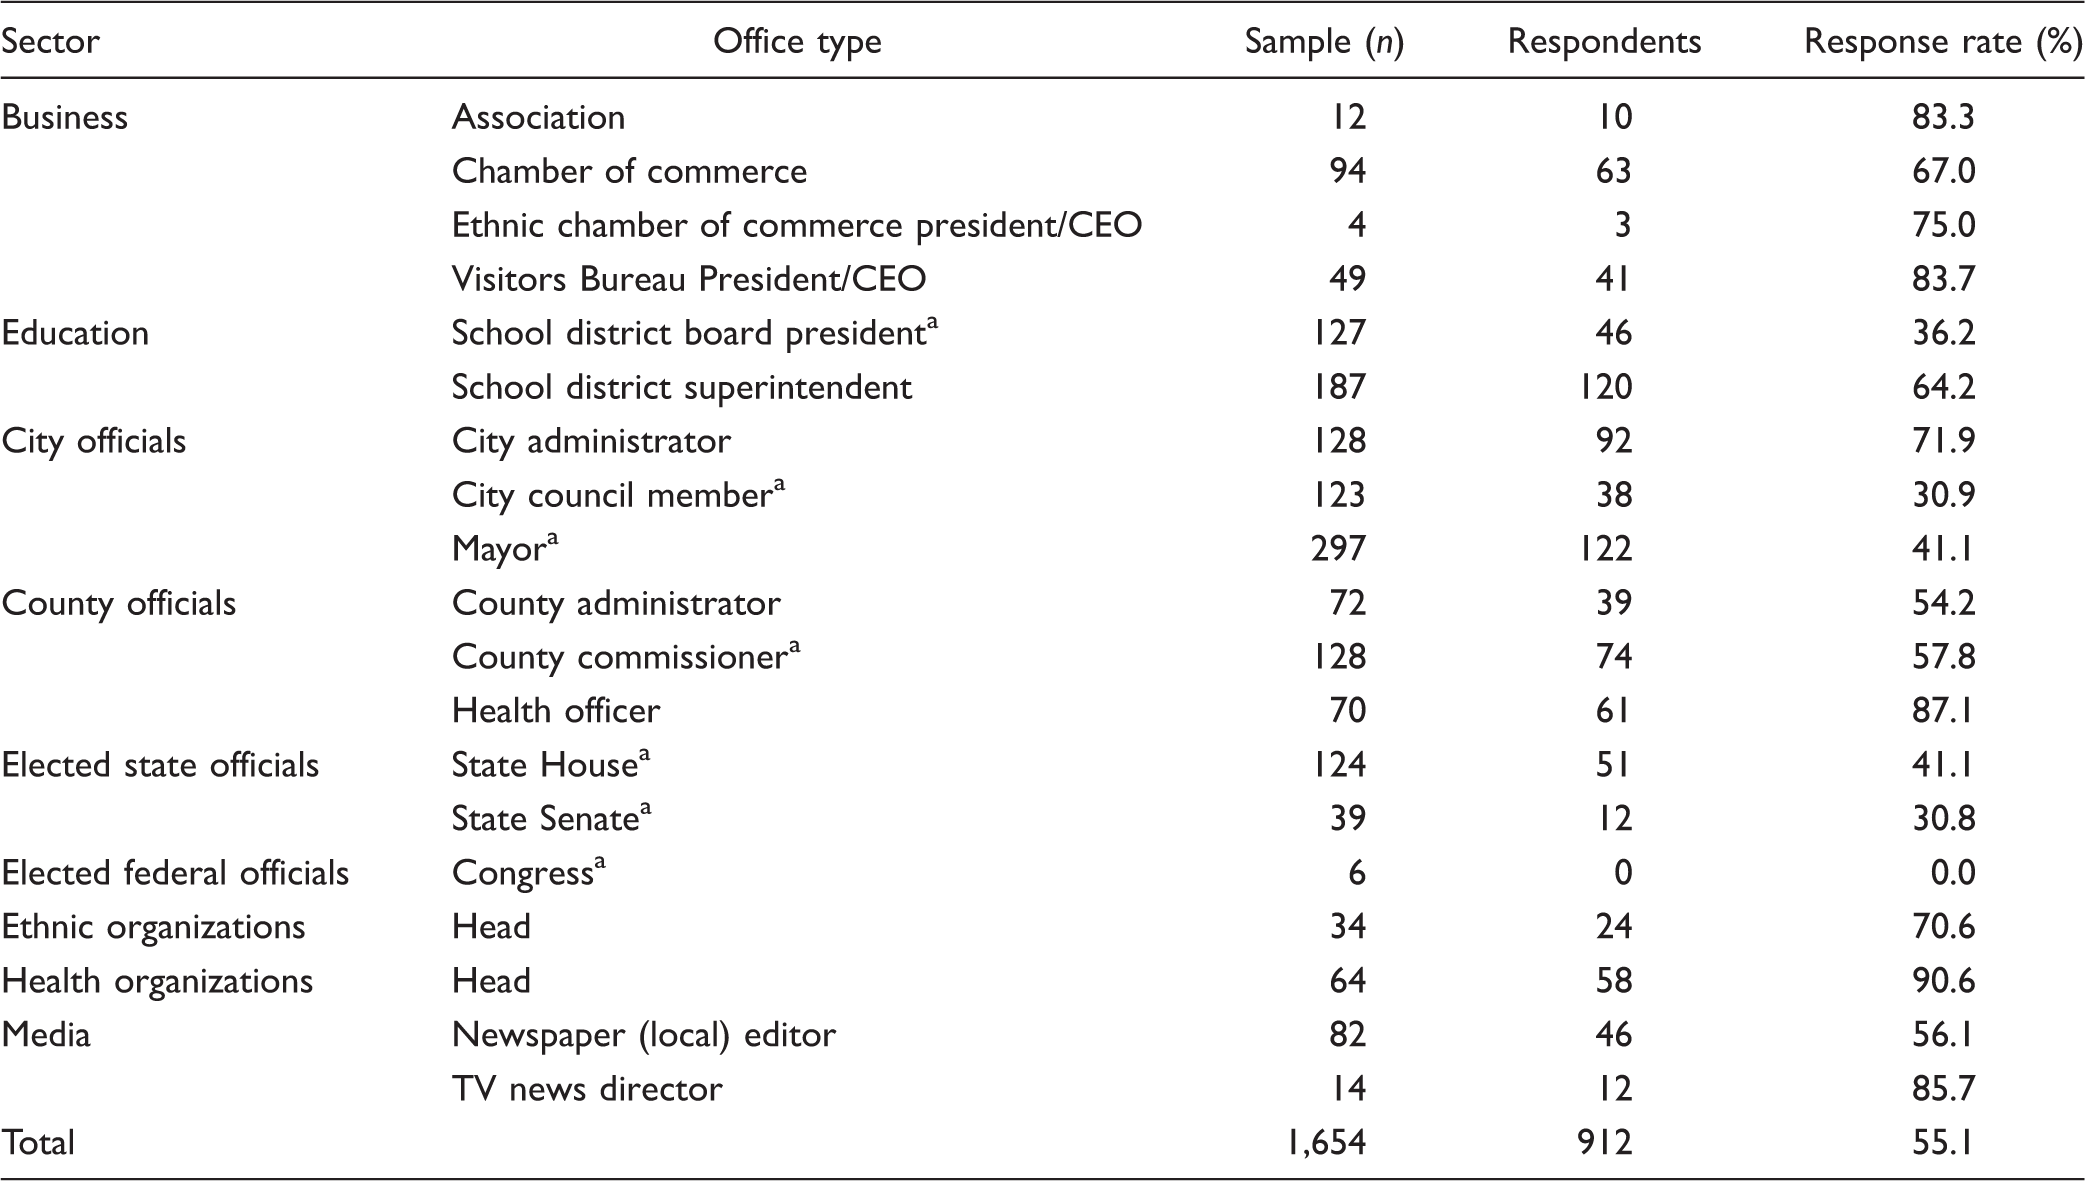
aDesignates an elected position.
The difference in urbanicity (i.e., geographic distribution) between public and opinion leader participants is due to the study design. The General Public Survey is an adult population study, and the majority of Kansans live in urban areas (Iowa State University, Iowa Community Indicators Program, n.d.). In contrast, we sampled leaders in counties for the Opinion Leader Survey; the 60 smallest counties in Kansas contain only 10% of the total population (Healthy Kansans 2020, n.d.). The sample of Kansas opinion leaders included a higher proportion of adults aged 45 years and older, participants representing rural areas, White non-Hispanics, and people identifying as conservative. Table 3 shows the Opinion Leader Survey response rate by opinion leader sector and office type. Response rates by sector ranged from 0.0% for members of Congress to 90.6% for health organizations.
Policy Support
As shown in Figure 2, significantly more Kansas adults than opinion leaders were willing to pay an additional $50 annually in taxes for each of the five policy approaches (p < .01). The least popular policy among the general public (provide farmer’s market vouchers to low-income families and seniors) received more support than the most popular policy among the opinion leaders (provide more nutritious lunches in local public schools)—67.9% versus 65.4%. Multivariable analyses incorporating sociodemographic covariates do not change these findings.
Willingness to pay $50 or more in taxes to support obesity prevention policies, Kansas general public and opinion Leaders, 2014.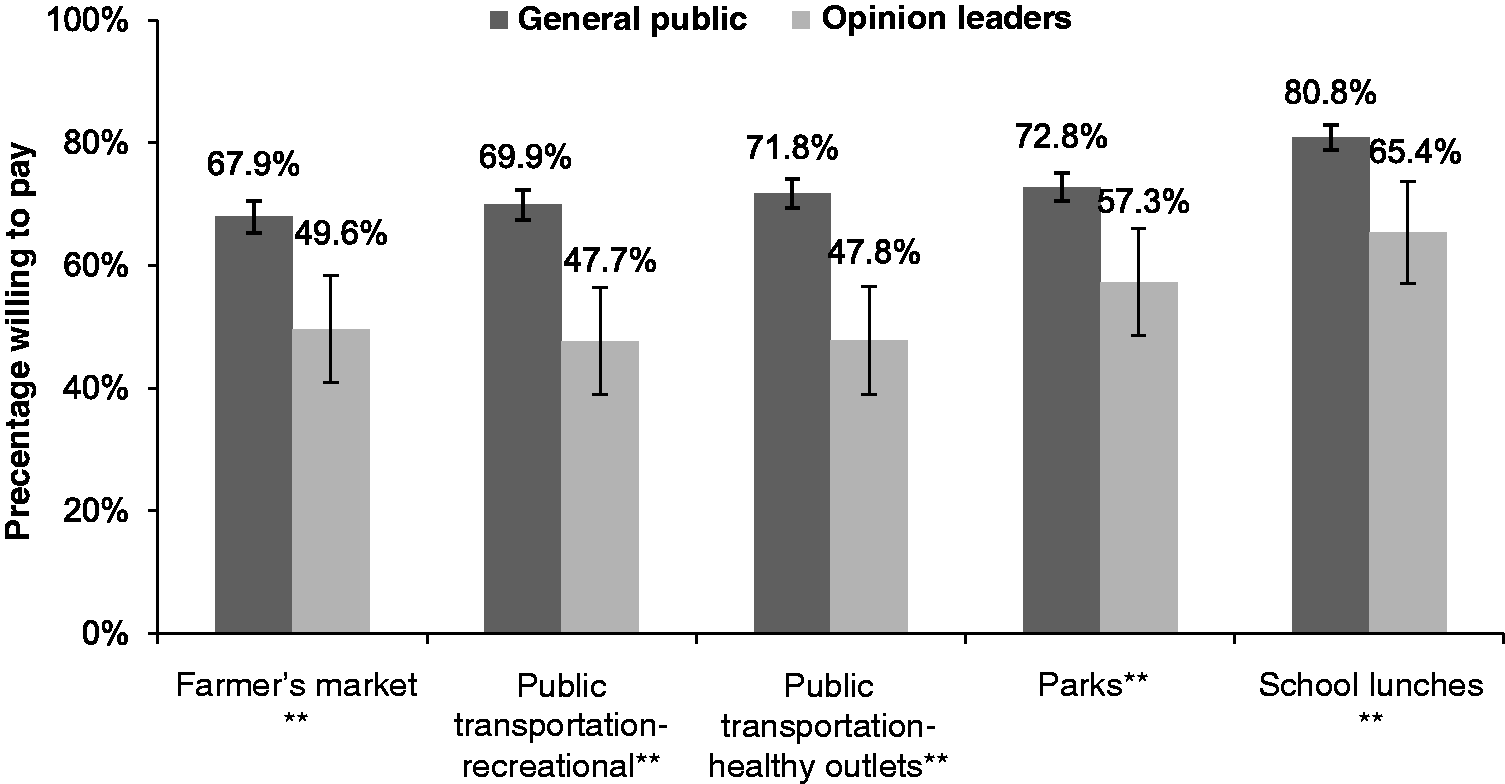
Discussion and Conclusion
Obesity prevention policies, such as improving the built environment by providing safe and accessible places for physical activity and enhancing the availability of healthy foods, are an integral part of a comprehensive solution to the obesity problem (Institute of Medicine, 2012; Khan et al., 2009). These policies, with sufficient funding to implement them, represent a population-based approach to obesity prevention by creating communities where the healthy choice is the effortless one (Frieden, 2010). Policy solutions, however, require sustained efforts and support of local and state leaders who have the power to propose, adopt, and implement them. In this study, we found that the general public in Kansas is more willing than state and local opinion leaders to pay for implementation of policies that support physical activity and healthy eating.
Approximately two thirds (68%) of Kansas public citizens are willing to pay additional taxes to support all five obesity prevention policies, while fewer than half of opinion leaders supported the public transportation and local food-oriented policies. Opinion leaders were more willing to fund nutritious school lunches than any of the other policies. School-focused policies directly target youth, a population of interest to many policy makers because healthy eating and physical activity habits established early in life can continue through adulthood (Institute of Medicine, 2011). Furthermore, many opinion leaders are familiar with local, state, and federal school nutrition policies (Boehmer, Brownson, Haire-Joshu, & Dreisinger, 2007; Chriqui, 2013; Welker, Lott, & Story, 2016).
Kansas is an ideologically conservative state. Voters twice elected Governor Sam Brownback, a Republican whose primary focus has been cutting taxes and the size of the state government. For many years, the Kansas state legislature supported those policies, too (Bosman, Smith, & Davey, 2017). Hence, it was not surprising that most of the opinion leaders surveyed did not support even a small tax increase to implement obesity prevention policies.
However, the comparatively high support among the general public for a small tax increase to support obesity prevention policies was somewhat surprising. Our public participants were representative of the Kansas voting public, with 42.1% describing themselves as conservative and 22.5% describing themselves as liberal, compared with registered voter estimates from 2015, in which approximately 45% of registered voters were Republicans and 24% were Democrats (State of Kansas, Office of the Secretary of State, n.d.). This suggests that the general public in Kansas sees a greater role for government in addressing obesity than do opinion leaders, a view consistent with their national counterparts (Tompson et al., 2013). Kansans are also more willing than their leaders to use taxes to advance a public health goal.
The limited research on public health policy change shows that elected officials find evidence of policy support among their constituents to be persuasive (Dodson et al., 2013; O’Dougherty et al., 2010). Our findings suggest that public support for funding obesity prevention policies in Kansas may be high enough to instigate coalescence around the issue and evidence-based policies (O’Grady, 2016), perhaps championed by nonprofits originally funded through the Health Living Focus Area. Once mobilized, public opinion should influence opinion leaders (including policy makers). Policy development encompasses 3 of the 10 essential public health services (Centers for Disease Control and Prevention, 2014), and public health nurses clearly have a role in leveraging opportunities for obesity prevention policies in states like Kansas where the public appears sufficiently educated about the issue and ready to mobilize.
Limitations
The main limitation of this study is the cross-sectional design. Multiple waves of data from the same population would have allowed us to examine changes over time and to better examine the temporal relationships between public and opinion leader support for built environment policies. In addition, our response rate for the public survey was low (16%); therefore, our findings might be subject to nonresponse bias. However, our response rate is consistent with the rates achieved in similar population surveys (Schmitt et al., 2014). Response rates across all modes of surveys are declining, and a positive association between response rates and survey quality is uncertain (AAPOR, 2015). The lumping of no and don’t know response categories for the policy report items may also be a limitation. Not knowing whether you support a policy and not supporting a policy have different implications for messaging, and in some cases, the don’t know category was over 10% of respondents. Finally, although we did cognitive testing on the survey items among a small convenience sample, and our measures were based on questions we have used in other surveys, we did not do any other type of psychometric testing of survey questions.
Conclusion
Policies that support healthy eating and active living have the potential to improve the health of U.S. citizens, including Kansans, living in recreational and nutritional deserts. Each of these policies requires public funding for implementation and sustainability. Our findings suggest that policy advocates may be underestimating the public’s willingness to support and fund policies that advance public health. In turn, this underestimate may delay the public mobilization needed to further increase public support among local and state leaders with the power to propose, adopt, and implement obesity prevention policies. The relatively high level of support for funding obesity prevention policies we found in a state as conservative as Kansas also suggests that the political environment for obesity prevention policy is not limited to states considered more progressive, such as New York and California. If public support for funding these policies is promising in Kansas, then other Midwestern states might also have similarly strong support. Or, enhanced support for obesity prevention policies could be built through education campaigns and grassroots advocacy. It is up to advocates, including public health and other nurses, to make the social and economic case for these public investments. After all, policy change is central to the public health mission and those in the health-care profession have the opportunity to “become leaders in health policy advocacy for our patients and the community as a whole” (Bowen et al., 2014, p. 105).
Footnotes
Acknowledgments
The authors would like to thank Burton Levine for his support with the sampling design.
Declaration of Conflicting Interests
The author(s) declared no potential conflicts of interest with respect to the research, authorship, and/or publication of this article.
Funding
The author(s) disclosed receipt of the following financial support for the research, authorship, and/or publication of this article: The authors were supported through a grant from the Kansas Health Foundation (#201304006-01: Evaluation of the Kansas Health Foundation’s Healthy Living Focus Area).